Journal of Mechanical Science and Technology 24 (11) (2010) 2253~2259
www.springerlink.com/content/1738-494x DOI 10.1007/s12206-010-0902-6
Analysis of pulsed Nd:YAG laser welding of AISI 304 steel†
Kwanwoo Kim1, Jungkil Lee1 and Haeyong Cho2,* 1Graduate School of Engineering, Chungbuk national university, 12 Gaesin-dong, Cheongju, Chungbuk, 361-763, Korea
2Department of Mechanical Engineering, Chungbuk national university, 12 Gaesin-dong, Cheongju, Chungbuk, 361-763, Korea
(Manuscript Received May 22, 2009; Revised July 12, 2010; Accepted July 26, 2010)
Abstract Pulsed laser welding of AISI 304 stainless steel plate was simulated using commercial finite element software to determine the optimal
welding conditions. Due to geometric symmetry, only one plate was modeled to reduce the simulation computation time. User subrou-tines were created to account for a moving three-dimensional heat source and to apply boundary conditions. The material properties such as conductivity, specific heat, and mass density were determined as functions of temperature. The latent heat was considered within the given temperature range. The three-dimensional heat source model for pulsed laser beam butt welding was designed by comparing the finite element analysis results and experimental data. This successful simulation of pulsed Nd:YAG laser welding for AISI 304 stainless steel will prove useful for determining optimal welding conditions.
Pulsed Nd:YAG lasers are widely used for welding because of the narrow heat-affected zone they produce. Pulsed laser welding has several process variables such as welding shape, material, and path. It is necessary to find the optimum combi-nation of these variables in industrial field applications. There-fore, an analytical study of pulsed Nd:YAG laser welding is required to reduce trial and error in experimental tests.
Rosenthal suggested a heat flux equation for point and line heat sources for welding and cutting [1]. Westby proposed a numerical analysis model for the temperature distribution during welding [2]. Friedman analyzed welding processes using the finite element (FE) method [3]. Mazumder and Steen suggested a three-dimensional (3D) heat transfer model using a moving Gaussian heat source [4]. Kim et al. studied the weldability of pure aluminum using a pulsed Nd: YAG laser [5]. Han et al. examined the welding characteristics of Inconel alloy and proposed pulsed Nd:YAG laser welding conditions [6]. Kim and Cho designed 3D conical heat source model for pulsed Nd:YAG laser welding of AISI 304 steel and simulated various welding conditions using the model [7].
Pulsed laser welding simulations were conducted during this study using the commercial MARC FE software package, and the simulated results were compared with empirical data.
A 3D moving heat source representing a pulsed Nd:YAG laser was designed as the heat input condition to the welding simu-lation. The temperature distribution and molten zone during welding were predicted through FE analysis for different lev-els of beam power.
2. Welding analysis
Pulsed Nd:YAG laser welding was analyzed using com-mercial FE software to reduce trial and error in experimental tests. During the simulation iterations, the shape factors of the 3D heat source were chosen so that the shapes of the molten zone in the welded specimen and in the simulation were nearly identical. The maximum energy density of the laser beam was then selected to produce the same size of molten zone in both approaches, which made it possible to design the 3D moving Gaussian heat source used in the simulation, to predict the temperature of the molten zone and the extent of the heat-affected zone for a given base material during weld-ing. The shape and size of the molten area were compared with those of an experimental specimen to check the validity of the simulation.
2.1 Experimental trial and analysis model
Stainless steel AISI 304 plates (50×20×1–3 mm) were butt welded with a pulsed Nd:YAG laser welder (JK701, Sumi-tomo) for experimental verification under the experimental conditions listed in Table 1. The shape factors (Xe, Xm, Xi, Re,
† This paper was recommended for publication in revised form by Associate EditorYong-Tae Kim
2254 K. Kim et al. / Journal of Mechanical Science and Technology 24 (11) (2010) 2253~2259
Rm, and Ri, where Xe, Xm, and Xi are the x-coordinate values of the upper, middle, and lower surfaces and Re, Rm, and Ri are the radii of the upper, middle, and lower surfaces) and the maximum energy density of the Gaussian distribution of the heat source, Q0 and Q1, were determined based on the size of the molten zone on 1-mm-thick plate welded using beam powers of 20 and 25 W. A proportional expression of the shape factors and maximum energy density was developed for various beam powers and was used to model the heat source. Pulsed Nd:YAG laser welding was simulated for the condi-tions shown in Table 1 using this heat source model.
Fig. 1 shows the analysis model and moving direction of the pulsed laser beam. Due to geometric symmetry, only one plate was used to reduce the simulation computation time. A fine mesh was used for areas in contact with the laser beam since they experienced a complicated thermal sequence of momen-tary heating and cooling.
The compatibility of the heat source model was verified by comparing the results of the analysis with those of a welded specimen for the same welding conditions and various levels of beam power.
2.2 Heat source design
Fig. 2 shows the 3D conical heat source model and ana-lyzed results in a previous study [7]. The heat source model shown in Fig. 2(a) has been modified to the heat source model as shown in Fig. 3(a). The predicted molten zone shape in the previous study was different from the real welded specimen shown in Fig. 2(b). Therefore, the heat source model should be modified as shown in Fig. 3(a).
Fig. 3 shows the 3D Gaussian heat source model that was designed in this study. The heat input per unit volume was a function of the position from the center of the heat source. Therefore, the heat input per unit volume was dependent upon
the shape factors Xe, Xm, Xi, Re, Rm, and Ri, as well as Q0 and Q1, as shown in the figure. Therefore, the simulated shape and size of the molten zone were governed by the heat source model. The heat input per unit volume of the 3D Gaussian heat source can be expressed as
2
0 20
exp rQ Qr
⎛ ⎞= −⎜ ⎟⎜ ⎟
⎝ ⎠ (1)
where Q is the heat input per unit volume, Q0 is the maximum heat input per unit volume of the 3D Gaussian heat source, r is the radial distance from the center of the heat source to the heat input position, and r0 is the radius of the Gaussian normal distribution at a certain height (i.e., on the x-axis) of the heat source. The values of Q0 and r0 are determined by the shape of
(a) heat source (b) comparison of molten zone Fig. 2. Analysis result for 3D conical heat source [7].
X
Y
Z
(a) heat source shape and variables
(b) frequency
Fig. 3. Moving heat source for the Nd:YAG pulsed laser.
Table 1. Experimental conditions of laser welding.
Thickness (mm)
Beam speed (mm/s)
Frequency (Hz)
Irradiation (ms)
Beam power(W)
1 1 5 8 20,25,30,33,35
2 1 5 8 30,35,40,45
3 1 5 8 30,35
Fig. 1. Half-model of the AISI 304 stainless steel plate.
K. Kim et al. / Journal of Mechanical Science and Technology 24 (11) (2010) 2253~2259 2255
the heat source, as shown in Fig. 3(a). A new subroutine was created to express the heat source as a function of the pulse shape and frequency, and was used to apply the various simu-lation boundary conditions such as the type of pulse and fre-quency, as shown in Fig. 3(b).
Pulsed laser welding was simulated for fixed beam powers of 20 and 25 W with various shape factors to determine the appropriate ones for the heat source. The shape factors were chosen during the simulation iterations so that the shapes of the molten zones in the welded specimen and the simulation were nearly identical. The maximum energy density Q0 and Q1 of the laser beam was then selected so that the molten zones in the two approaches were the same size.
Fig. 4 illustrates the heat source modeling process. The pro-portional expression of the shape factors and maximum en-ergy density was based on a comparison of the simulated and experimental results for beam powers of 20 and 25 W. The heat source for various beam powers was modeled using the proportional expression. The compatibility of the heat source model was verified by comparing the analysis results with welded specimens for various beam powers under the welding conditions shown in Table 1.
2.3 Boundary conditions
The boundary conditions for the simulation were the heat input condition of the pulsed laser and the cooling condition. A new subroutine was created to convert the heat source to variations of beam power, welding speed, pulse shape, and frequency, and was used to apply the various boundary condi-tions in the simulation. The cooling conditions, radiation, and convection were also considered in the subroutine.
The thermal properties of the material were temperature de-pendent. Table 2 lists the material properties, and Fig. 5 shows the method used to analyze the thermal properties.
3. Simulated results and discussions
Fig. 6 shows the temperature distributions at a point 1.808
mm along the welding direction. The edge length of cubic element is 0.1 mm. The simulated shape of the molten zone was similar to that obtained experimentally. The width and depth of the molten zone increased with the laser beam power. The molten zone was 0.72 mm wide and 0.48 mm deep for the 20 W beam power in Fig. 6(a). The molten zone was 0.84 mm wide and 0.64 mm deep for a beam power of 25 W, as shown in the Fig 6(b). The width and depth of the molten zone in-creased with further increases in laser beam power. A power of 35 W was appropriate for 1-mm-thick AISI 304 steel plate, as shown in Fig. 6(e).
The measured micro-Vicker’s hardness is shown in Fig. 7. The hardness of heat-affected zone is lower than molten zone and base metal. The width of the heat-affected zone was sur-mised to be less than 0.1 mm at the lower hardness, as shown in Fig. 7(a). Also, it shows that the heat-affected zone is very narrow in Fig. 7(b) and Fig. 7(c).
Fig. 8 shows the Fe-Cr phase diagram of AISI 304 for 0.08 % carbon content [8]. The phase transition temperature of AISI 304 is 950 °C for 18 % chromium content in Fig. 8.
The temperature range of the heat-affected zone is to be
(a) changing the heat source shape variables Xe, Xm, Xi, Re, Rm, and
Ri
(b) changing the maximum intensity of the heat source, Q0 and Q1
Fig. 4. Heat source modeling procedure.
Table 2. Material properties of AISI 304.
Thermal property Value
Conductivity (W/(mm·K)) Temperature dependent
Specific heat (J/(kg·K)) Temperature dependent
Mass density (kg/mm3) 7.912 × 10⁻⁶ (constant)
Emissivity 0.14 (constant)
(a) conductivity
(b) specific heat
Fig. 5. Thermal properties of AISI 304.
2256 K. Kim et al. / Journal of Mechanical Science and Technology 24 (11) (2010) 2253~2259
950-1440 °C. Therefore, a narrow heat-affected zone(about 0.1 mm) can be observed by temperature results of simulation, as shown in Fig. 6 and Fig. 9. Also, simulated results of tem-perature history could be useful data to study phase transition.
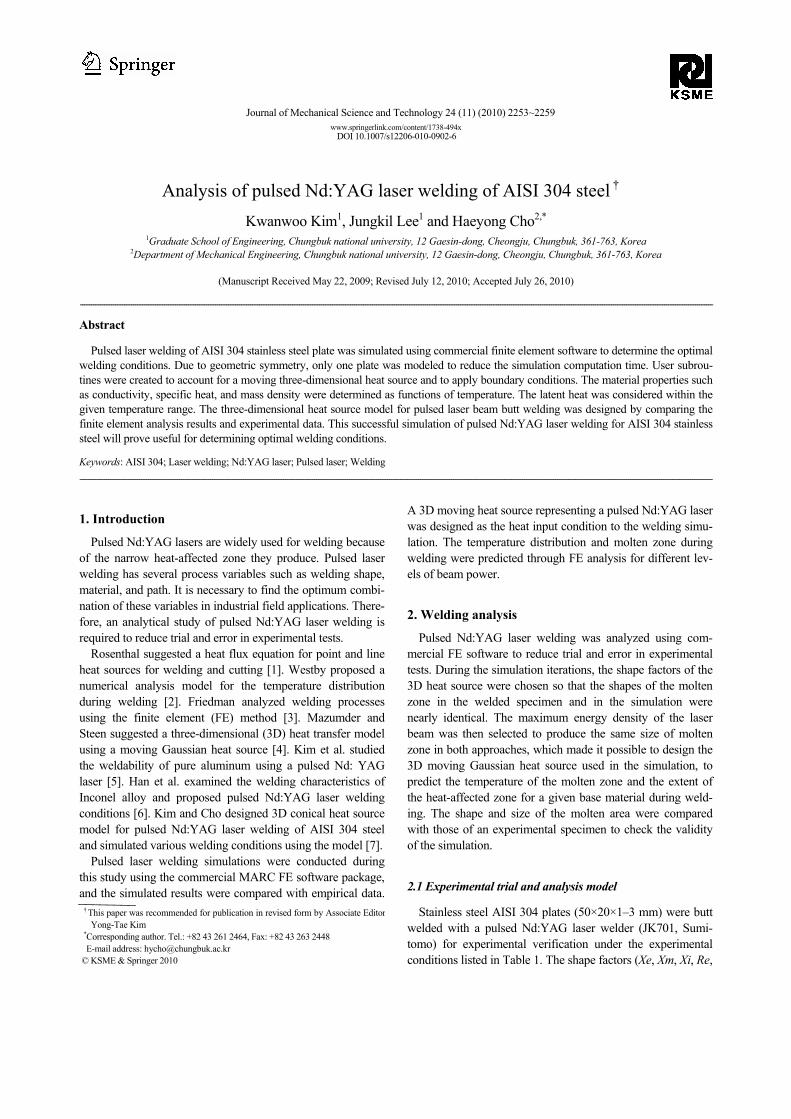
The simulated results shown in Fig. 6 were confirmed by laser welding experiments under the same conditions. Fig. 9 shows cross-sectional micro-structures along the welding di-rection. Fig. 9(a) shows the simulated temperature distribu-tions for 20 W, 5 Hz, and 1 mm/s along with the experimental distributions under the same conditions. The experimental results were compared with the simulated results for various shape factors of the heat source. From this comparison, the shape factors and maximum energy density were determined to Re = 0.8, Rm = 0.18, Ri = 0.2, Xe = 0.0, Xm = −0.05, Xi = −0.53, Q0 = 4250 W/mm3, and Q1 = 4000 W/mm3. Fig. 9(b) shows the temperature distributions of the simulated and ex-perimental results for 25 W. The simulated and experimental results were identical for Re = 0.9, Rm = 0.18, Ri = 0.2, Xe = 0.0, Xm = −0.05, Xi = −0.67, Q0 = 4650 W/mm3, and Q1 = 4050 W/mm3.
A proportional expression for the shape factors and maxi-mum energy density was developed by comparing the simu-lated results with experimental trials for beam powers of 20 and 25 W. The heat source for other beam powers was mod-eled using the proportional expression. Fig. 9(c) shows the simulated temperature distributions for 30 W, 5 Hz, and 1 mm/s along with the experimental distributions under the same conditions. The simulated results agreed closely with the experimental ones. Figs. 9(d) and (e) show the temperature distributions of the simulated results for 33 W and 35 W, re-spectively, along with the experimental results under the same conditions. There are some differences between the simulated results and the experimental ones for these cases. This might have been because heat transfer in the vertical direction of the molten zone and to the jig that held the base metals was not considered in the simulations.
Fig. 10 shows the size of the molten zone of butt -welded 1-mm-thick plate for each beam power. The difference between the width of the simulated molten zone and that obtained ex-perimentally increased as the beam power increased, as shown in Fig. 10(a). There are some differences between the simu-
(a) 20W (b) 25W
(c) 30W (d) 33W
(e) 35W
Fig. 6. Temperature distributions for a 1-mm-thick plate.
(a) micro-Vicker’s hardness
(b) indented points (c) micrograph of HAZ Fig. 7. Analysis of specimen of pulsed Nd:YAG laser welding.
Fig. 8. Fe-Cr phase diagram of AISI 304 for 0.08% carbon content [8].
K. Kim et al. / Journal of Mechanical Science and Technology 24 (11) (2010) 2253~2259 2257
lated and experimental depths, as shown in Fig. 10(b). This might have been due to the same reasons discussed for Fig. 9: heat transfer in the vertical direction of the molten zone and to the jig that held the base metals was not considered in the simulations.
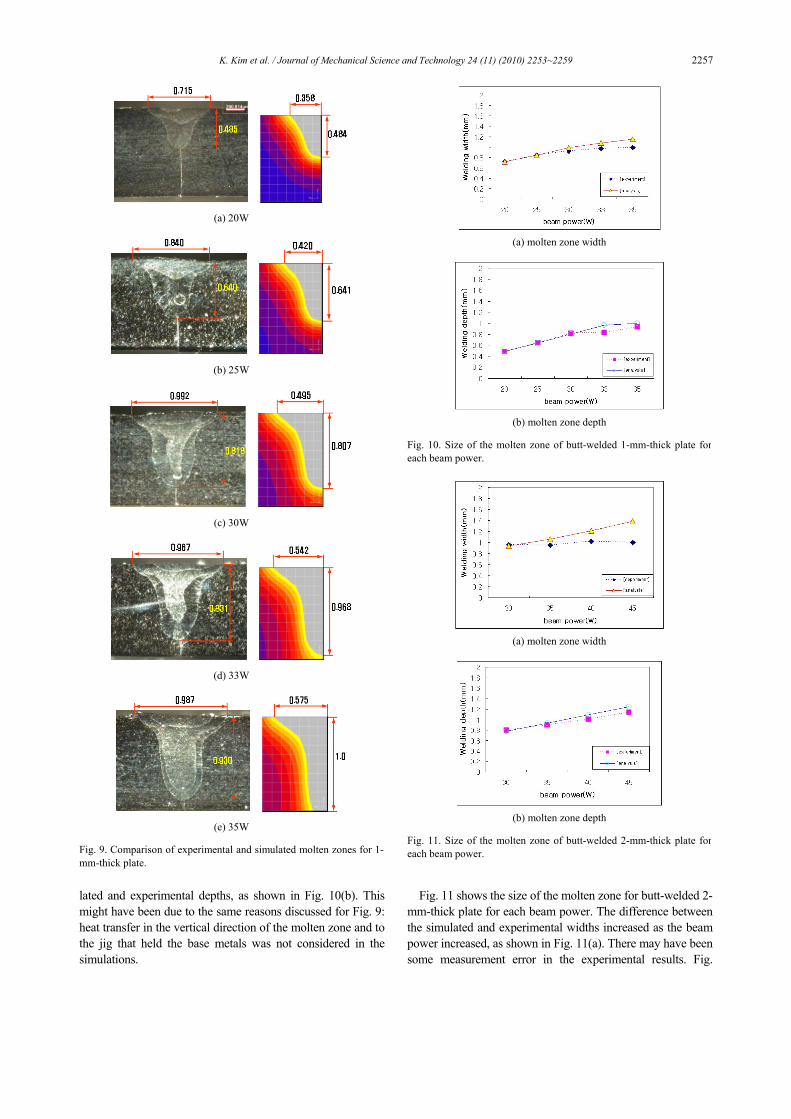
Fig. 11 shows the size of the molten zone for butt-welded 2-mm-thick plate for each beam power. The difference between the simulated and experimental widths increased as the beam power increased, as shown in Fig. 11(a). There may have been some measurement error in the experimental results. Fig.
(a) 20W
(b) 25W
(c) 30W
(d) 33W
(e) 35W
Fig. 9. Comparison of experimental and simulated molten zones for 1-mm-thick plate.
(a) molten zone width
(b) molten zone depth
Fig. 10. Size of the molten zone of butt-welded 1-mm-thick plate for each beam power.
(a) molten zone width
(b) molten zone depth
Fig. 11. Size of the molten zone of butt-welded 2-mm-thick plate for each beam power.
2258 K. Kim et al. / Journal of Mechanical Science and Technology 24 (11) (2010) 2253~2259
11(b) shows the depth of the molten zone for various beam powers. The simulated depth agreed closely with the experi-mental depth.
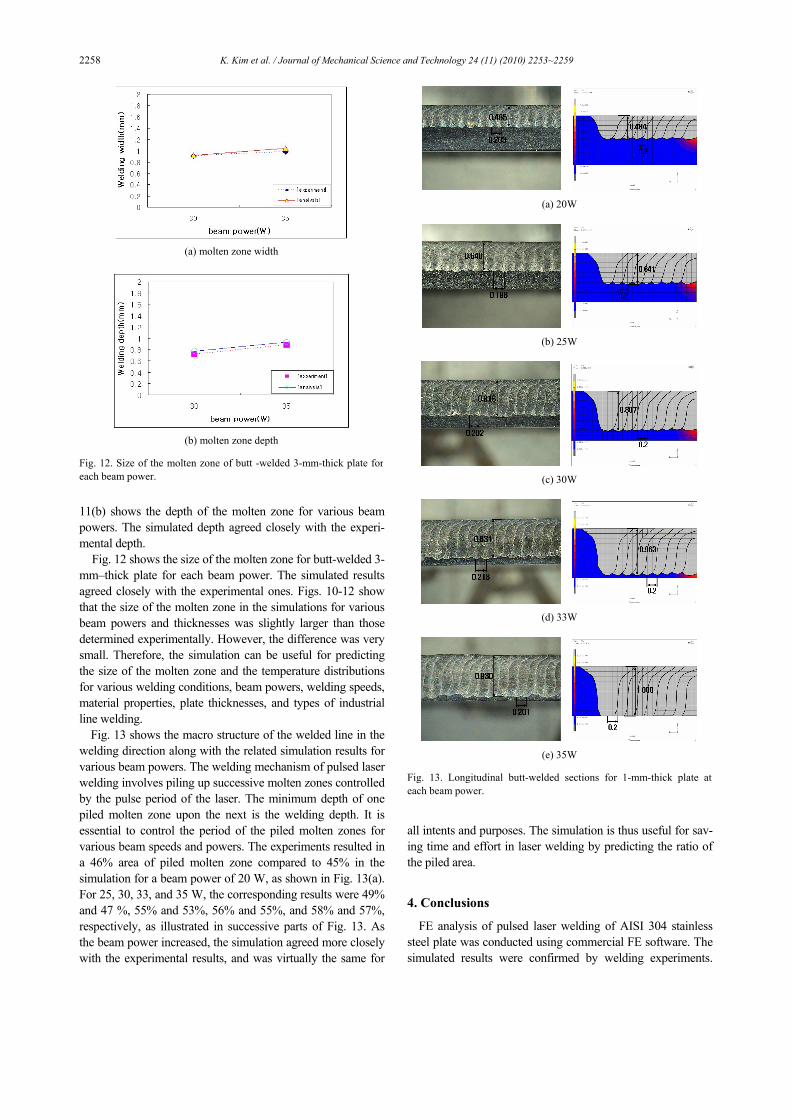
Fig. 12 shows the size of the molten zone for butt-welded 3-mm–thick plate for each beam power. The simulated results agreed closely with the experimental ones. Figs. 10-12 show that the size of the molten zone in the simulations for various beam powers and thicknesses was slightly larger than those determined experimentally. However, the difference was very small. Therefore, the simulation can be useful for predicting the size of the molten zone and the temperature distributions for various welding conditions, beam powers, welding speeds, material properties, plate thicknesses, and types of industrial line welding.
Fig. 13 shows the macro structure of the welded line in the welding direction along with the related simulation results for various beam powers. The welding mechanism of pulsed laser welding involves piling up successive molten zones controlled by the pulse period of the laser. The minimum depth of one piled molten zone upon the next is the welding depth. It is essential to control the period of the piled molten zones for various beam speeds and powers. The experiments resulted in a 46% area of piled molten zone compared to 45% in the simulation for a beam power of 20 W, as shown in Fig. 13(a). For 25, 30, 33, and 35 W, the corresponding results were 49% and 47 %, 55% and 53%, 56% and 55%, and 58% and 57%, respectively, as illustrated in successive parts of Fig. 13. As the beam power increased, the simulation agreed more closely with the experimental results, and was virtually the same for
all intents and purposes. The simulation is thus useful for sav-ing time and effort in laser welding by predicting the ratio of the piled area.
4. Conclusions
FE analysis of pulsed laser welding of AISI 304 stainless steel plate was conducted using commercial FE software. The simulated results were confirmed by welding experiments.
(a) molten zone width
(b) molten zone depth
Fig. 12. Size of the molten zone of butt -welded 3-mm-thick plate foreach beam power.
(a) 20W
(b) 25W
(c) 30W
(d) 33W
(e) 35W
Fig. 13. Longitudinal butt-welded sections for 1-mm-thick plate at each beam power.
K. Kim et al. / Journal of Mechanical Science and Technology 24 (11) (2010) 2253~2259 2259
The following conclusions may be drawn. (1) A heat source model for selecting the pulse laser beam
conditions was successfully designed using a comparison of the FE simulation results and experimental data for AISI304 stainless steel plate. A proportional expression of the shape factors and the maximum energy density was developed by comparing simulated results with experi-mental trials, and used to model the heat source for various beam powers. The simulated results agreed closely with experimental data obtained under the same conditions.
(2) Prediction of the molten zone and temperature distribution with the designed heat source at various beam powers and welding velocities was verified experimentally. This means that the approach proposed in this study is effective for determining suitable laser beam conditions for various variables in pulsed laser welding.
(3) The temperature range of the heat-affected zone was pre-dicted to be 950–1440°C, and the width of the molten zone was projected to be less than 0.1 mm by measuring the micro-Vicker’s hardness of the material and making use of the simulated results for 1-mm-thick plate.
(4) The ratio of the piled area increased with the beam power. The simulated results of the piled area ratio were identical to those obtained in the experimental trials. Therefore, this technique is useful for predicting the ratio of the piled area, which will save time and cost in the laser welding industry.
Acknowledgment
This work is the outcome of a Manpower Development Program for Energy & Resources supported by the Korea Ministry of Knowledge and Economy (MKE).
References
[1] D. Rosenthal, Mathematical theory of heat distribution dur-ing welding and cutting, Welding J., 20 (5) (1941) 220-234.
[2] O. Westby, Temperature distribution in the workpiece by welding, Dept. of Metallurgy and Metals Working, The Technical Univ. of Norway, Ph.D Dissertation (1968).
[3] E. Friedman, Thermo-mechanical analysis of the welding process using the finite element method, Trans. ASME, Journal of Pressure Vessel Technology, Series J, 97 (3) (1975) 206-213.
[4] J. Mazumder and W. M. Steen, Heat transfer model for cw laser material processing, J. Appl. Phys., 51 (2) (1980) 941-947.
[5] D. H. Kim, S. S. Kim and C. J. Kim, A study on the pure Al weldability using a pulsed Nd: YAG laser, Journal of the Korean Welding Society, 11 (1) (1993) 52-61.
[6] W. J. Han, J. G. Byeon and K. S. Park, Welding characteris-tics of the inconel plate using a pulsed Nd:YAG laser beam, Journal of Materials Processing Technology, 113 (1-3) (2001) 1234-237.
[7] K. W. Kim and H. Y. Cho, Analysis of pulsed Nd:YAG laser welding of AISI 304 steel(part I), International Journal of Advanced Manufacturing Technology (2009) (submitted).
[8] William F. Smith, Structure and properties of engineering alloys, Second Ed. McGraw-Hill College, USA (1992).
Kwan-Woo Kim received his B.S. in Precision Mechanical Engineering from Chungbuk National University, Korea, in 1997. He then received his M.S. and Ph.D. degrees from Graduate School of Chungbuk National University in 2001 and 2010, respectively. Dr. Kim is currently an Adjunct Instructor at the
School of Mechanical Engineering at Chungbuk National University in Cheong-Ju, Korea. Dr. Kim’s research interests include CAE for laser working and plastic working.
Jung-Kil Lee received his B.S. in Mechanical Engineering from Ulsan University, Korea, in 1992. Then, He received his M.S. degrees from Graduate School of Korea University of Technology and Education in 2000, respectively. Mr. Lee is currently an Adjunct Instructor at the School of Me-
chanical Engineering at Korea University of Technology and Education in Cheon-An, Korea. Mr. Lee’s research interests include cutting tool design and CAE for plastic working.
Hae-Yong Cho received his B.S. in Mechanical Engineering from Pusan National University, Korea, in 1983. Then, He received his M.S. and Ph.D. degrees from the Graduate School of Pusan National University in 1985 and 1991, respectively. Dr. Cho is currently a Professor at the School of Mechanical
Engineering at Chungbuk National University in Cheong-Ju, Korea. Also, He is currently Director of Future Technology Research Center for Heavy Electrical Apparatus supported by the Korea Ministry of Knowledge and Economy. Dr. Cho’s research interests include manufacturing process design, die design and CAE for plastic working.