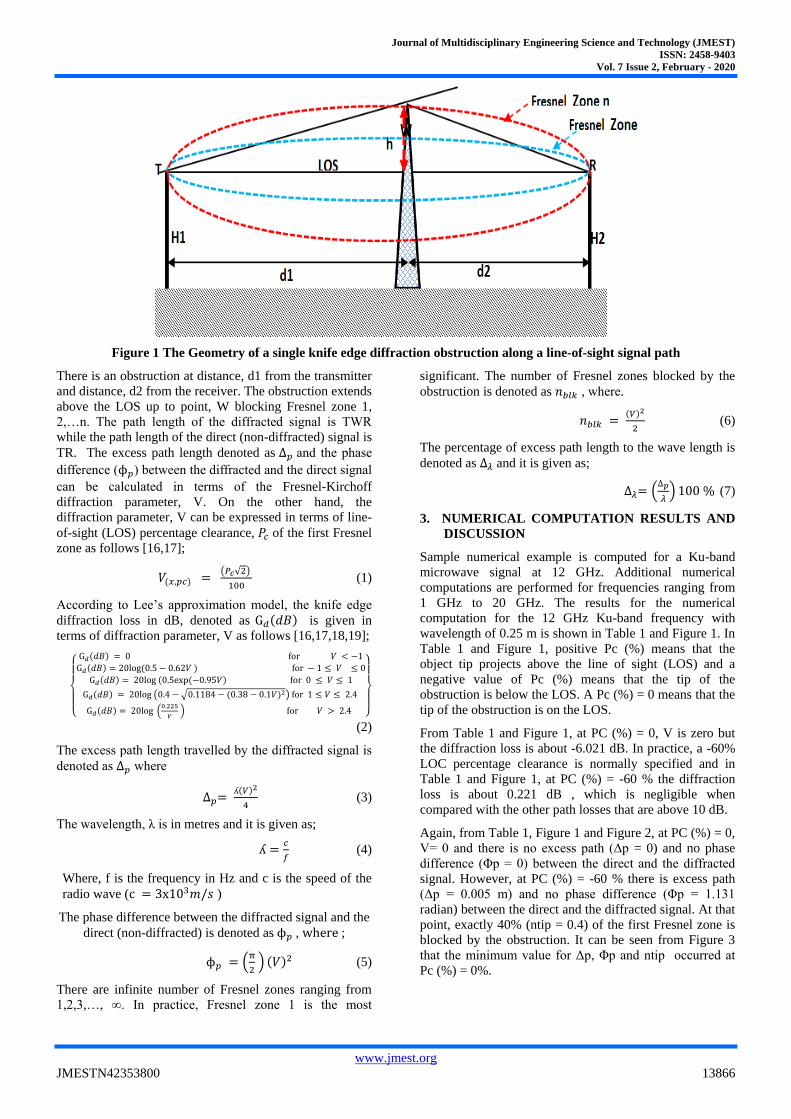
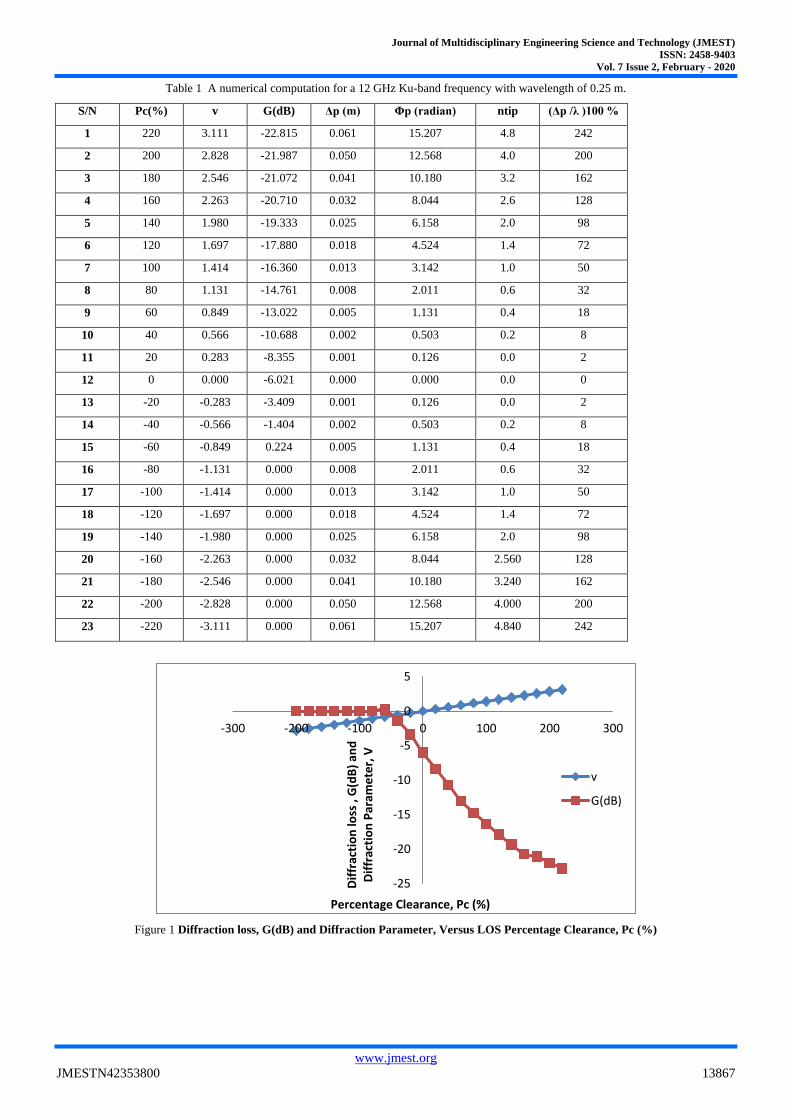
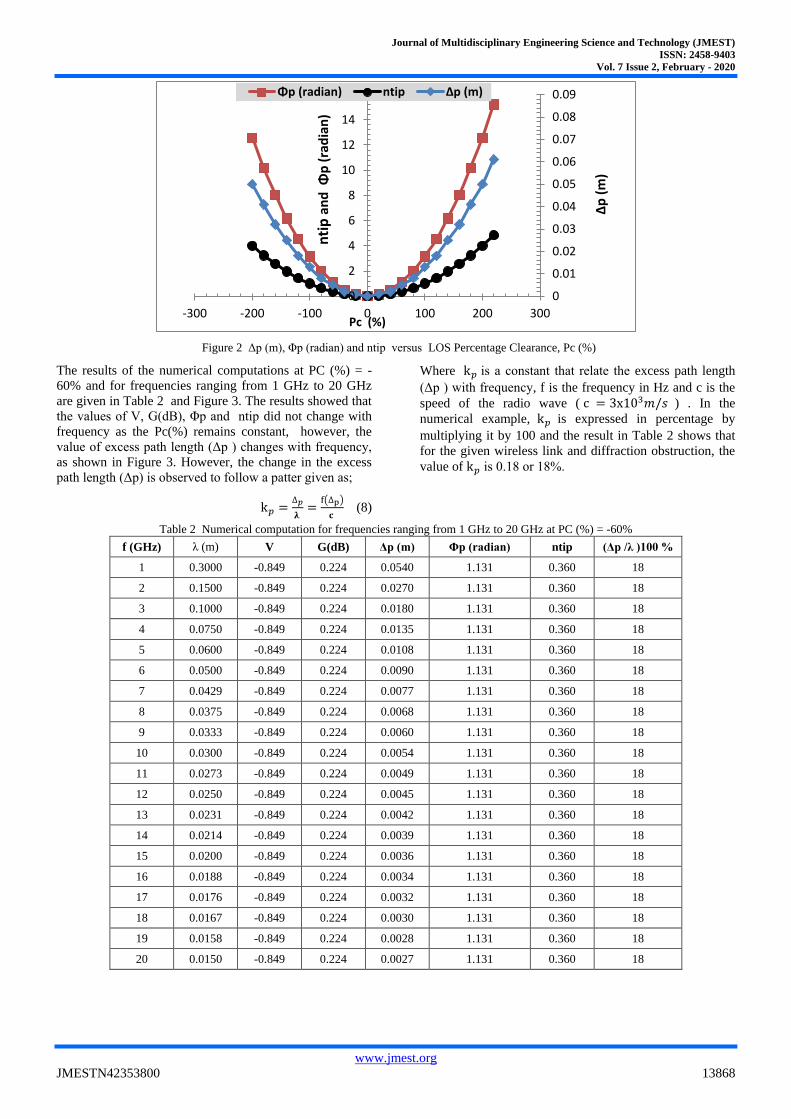
Journal of Multidisciplinary Engineering Science and Technology (JMEST) ISSN: 2458-9403 Vol. 7 Issue 2, February - 2020 www.jmest.org JMESTN42353800 13865 ANALYSIS OF SINGLE KNIFE EDGE DIFFRACTION LOSS FOR A FIXED TERRESTRIAL LINE-OF-SIGHT MICROWAVE COMMUNICATION LINK Dialoke, Ikenna Calistus 1 Department of Information and Communication Engineering, Air Force Institute of Technology, Kaduna, Kaduna State /[email protected]Ozuomba Simeon 2 Department of Electrical/Electronic and Computer Engineering, University of Uyo, Akwa Ibom, Nigeria [email protected][email protected]Henry Akpan Jacob 3 Department of Electrical/Electronic and Computer Engineering, University of Uyo, Akwa Ibom, Nigeria Abstract— In this paper, parametric analysis of single knife edge diffraction loss for a fixed terrestrial line-of- sight (LOS) microwave communication link is conducted with respect to LOS percentage clearance, Pc (%) of the first Fresnel zone. In practice, the required LOS clearance is specified in terms of Pc(%) but the computation of diffraction parameter, V is expressed in terms of clearance height which requires more elaborate and complex computations. In this paper, a simpler approach that computes the diffraction parameter using the LOS percentage clearance, Pc (%) is presented. Also, the single knife edge diffraction loss, the excess path length for the diffracted signal, the phase difference between the direct and the diffracted signal and the number of Fresnel zones that are blocked by the obstruction are computed for a given Pc(%) and frequency. The results show that at PC (%) = 0, V is zero but the diffraction loss is about -6.021 dB and at Pc(%) = -60% the diffraction loss, is about 0.221 dB , which is negligible when compared with other path losses that are above 10 dB. Also, at PC (%) = 0, V= 0 and there is no excess path (Δp = 0) and no phase difference (Φp = 0) between the direct and the diffracted signal. Furthermore, for various values of Pc(%) the minimum value for Δp and Φp occurred at Pc (%) = 0%. Finally, the results showed that the values of V, G(dB) and Φp did not change with frequency as the Pc(%) remains constant. However, the value of excess path length (Δp ) changes with frequency even when Pc(%) remains constant. Keywords— Diffraction loss, Diffraction parameter, microwave , line-of-sight, percentage clearance, knife edge diffraction 1. INTRODUCTION When wireless signals encounter obstruction they can be reflected, refracted, diffracted or scattered [1,2,3]. Each of these effects causes reduction in the received signal strength. Diffraction occurs when the signal spread around the object [4,5,6,7,8]. In this case, when compared with the direct signal, the diffracted signal travels extra distance before it arrives at the receiver. Also, there is phase difference between the diffracted signals and the direct signals (that is, signals that did not experience diffraction effect) [9,10,11,12]. Diffraction effect caused by isolated obstruction like hill is modeled as knife edge diffraction which is explained using the Huygens-Fresnel principle [13,14,15]. Specifically, the Fresnel diffraction parameter, V is normally used to determine the resultant knife edge diffraction loss, the excess path length, the phase difference between the direct and the diffracted waves and also the number of Fresnel zones that are blocked by the obstruction. Over the years, the diffraction parameter has been determined using the line-of-sight clearance height (h), the distance of the obstruction from the transmitter and the distance of the obstruction from the receiver [16,17]. However, this approach is quite difficult. In most cases, the effect of diffraction obstruction is specified in terms of percentage clearance (Pc) of the first Fresnel zone. As such, in a recent study, a formula has been derived for calculating the diffraction parameter, V directly from the specified percentage clearance (Pc) of the first Fresnel zone [16,17]. Consequently, in this paper, this recent formula for V expressed in terms of Pc is used to determine V and then to compute the other relevant parameters associated with knife edge obstruction. In particular, the Lee composite function for knife edge diffraction loss [16,17,18,19] is used to determine the diffraction loss. Sample numerical examples are used to demonstrate the application of the ideas presented in this paper. 2. THE THEORETICAL FRAMEWORK FOR THE SINGLE KNIFE EDGE DIFFRACTION LOSS COMPUTATION In Figure 1, the transmitter, T and the receiver, R antennas are aligned to give the line-of-sight, LT.
Transcript
Journal of Multidisciplinary Engineering Science and Technology (JMEST)
ISSN: 2458-9403
Vol. 7 Issue 2, February - 2020
www.jmest.org
JMESTN42353800 13865
ANALYSIS OF SINGLE KNIFE EDGE DIFFRACTION LOSS FOR A FIXED TERRESTRIAL LINE-OF-SIGHT MICROWAVE