25
By: Agrawal Bhavin 02 Jaydeep Gandhi 20 Nitin Madhavi 28 Jignesh Soni 32
| Date post: | 17-Jul-2015 |
| Category: |
Data & Analytics |
| Upload: | bhavin-agrawal |
| View: | 81 times |
| Download: | 6 times |
By:
Agrawal Bhavin 02
Jaydeep Gandhi 20
Nitin Madhavi 28
Jignesh Soni 32

•TATA STEEL LTD Established in 1907 as Asia's first integrated private
sector steel company
•Tata Steel Limited was the 12th largest steel producing company in the
world in 2012, with an annual crude steel capacity of 23.8 million tones
• The second largest private-sector steel company in India (measured by
domestic production) with an annual capacity of 9.7 million tonnes after
SAIL and JSW Steel
•Tata Steel has manufacturing operations in 26 countries, including
Australia, China, India, the Netherlands, Singapore, Thailand and the
United Kingdom

Cont… As on 31 March 2013, Tata Group held 31.35% shares in Tata Steel.
Over 1 million individual shareholders hold approx. 21% of its
shares Life Insurance Corporation of India is the largest non-
promoter shareholder in the company with 14.98% shareholding.
In 2013, Tata Steel was ranked India's 7th most admired company by
Fortune magazine. It was India's most admired company in 2012.

ANALYSIS OF BALANCE SHEET
70000
72000
74000
76000
78000
80000
82000
84000
86000
88000
Asset
2012
2013
2014
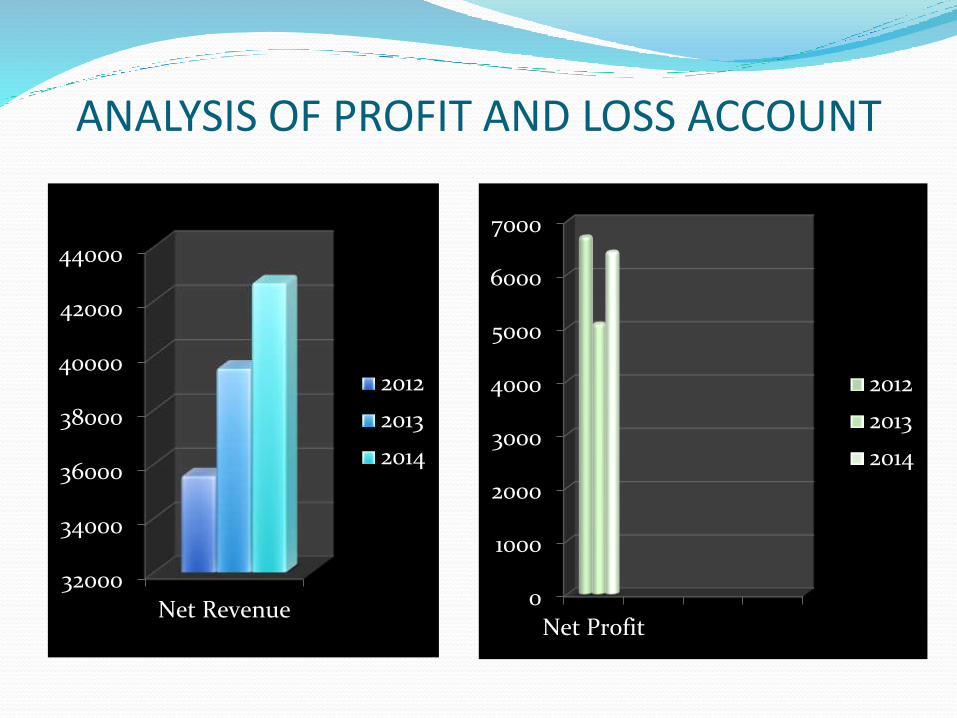
ANALYSIS OF PROFIT AND LOSS ACCOUNT
32000
34000
36000
38000
40000
42000
44000
Net Revenue
2012
2013
2014
0
1000
2000
3000
4000
5000
6000
7000
Net Profit
2012
2013
2014
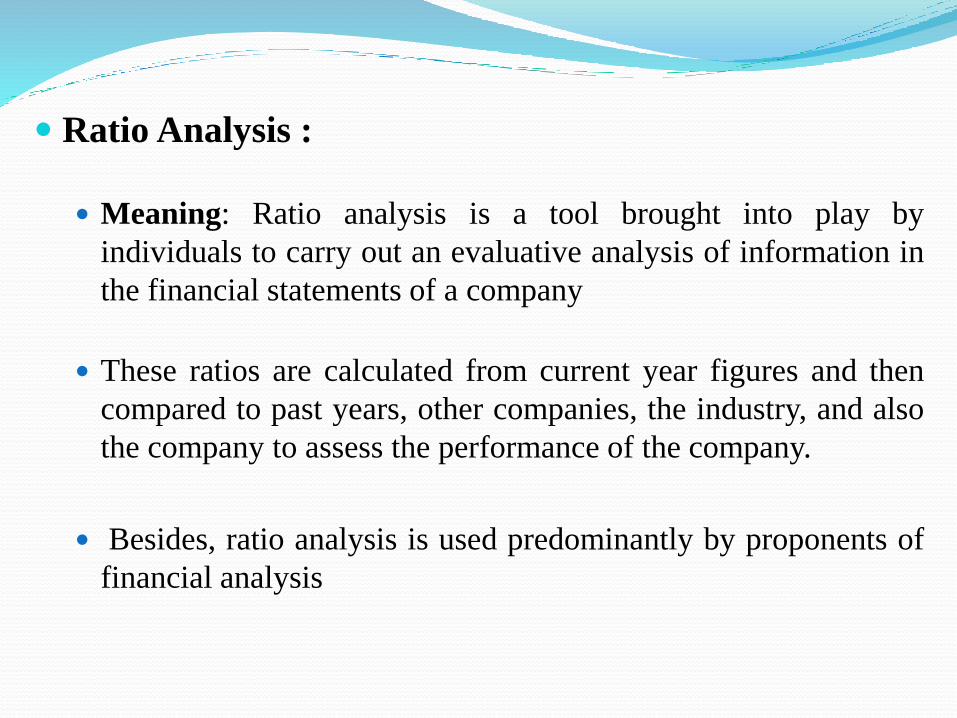
Ratio Analysis :
Meaning: Ratio analysis is a tool brought into play by
individuals to carry out an evaluative analysis of information in
the financial statements of a company
These ratios are calculated from current year figures and then
compared to past years, other companies, the industry, and also
the company to assess the performance of the company.
Besides, ratio analysis is used predominantly by proponents of
financial analysis

WORKING CAPITAL RATIO
0
0.1
0.2
0.3
0.4
0.5
0.6
0.7
0.8
0.9
1
2011-2012 2012-2013 2013-2014
Ratio
Ratio
0.93
0.86
0.57
Current Ratio

Acid Test Ratio
0
0.2
0.4
0.6
0.8
1
1.2
1.4
2011-12 2012-13 2013-14
Ratio
Ratio
1.161.04
0.68
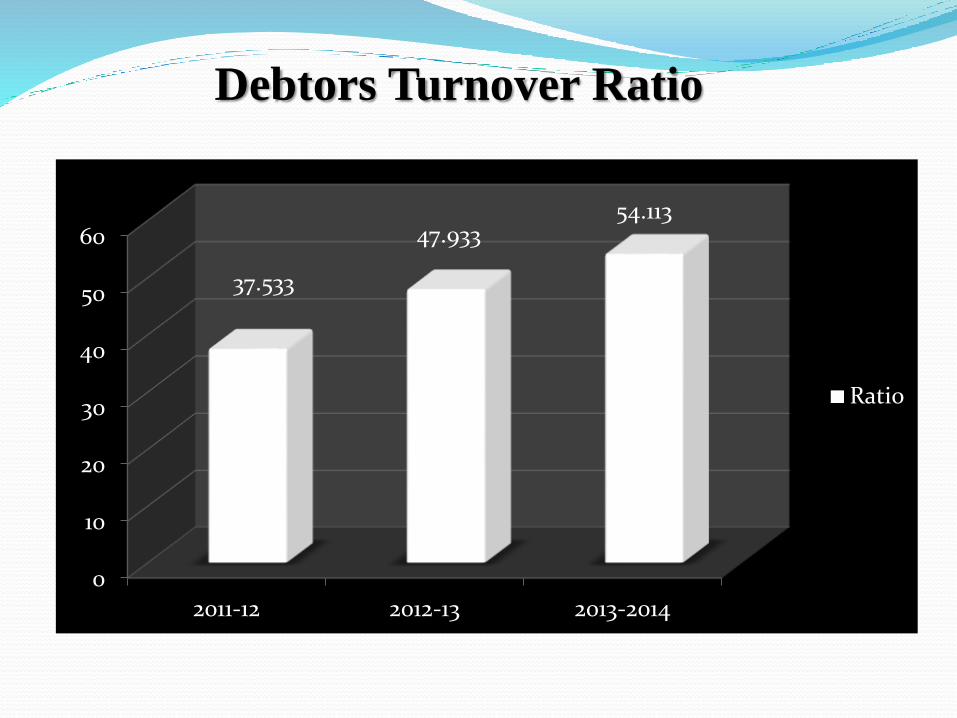
Debtors Turnover Ratio
0
10
20
30
40
50
60
2011-12 2012-13 2013-2014
Ratio
37.533
47.93354.113
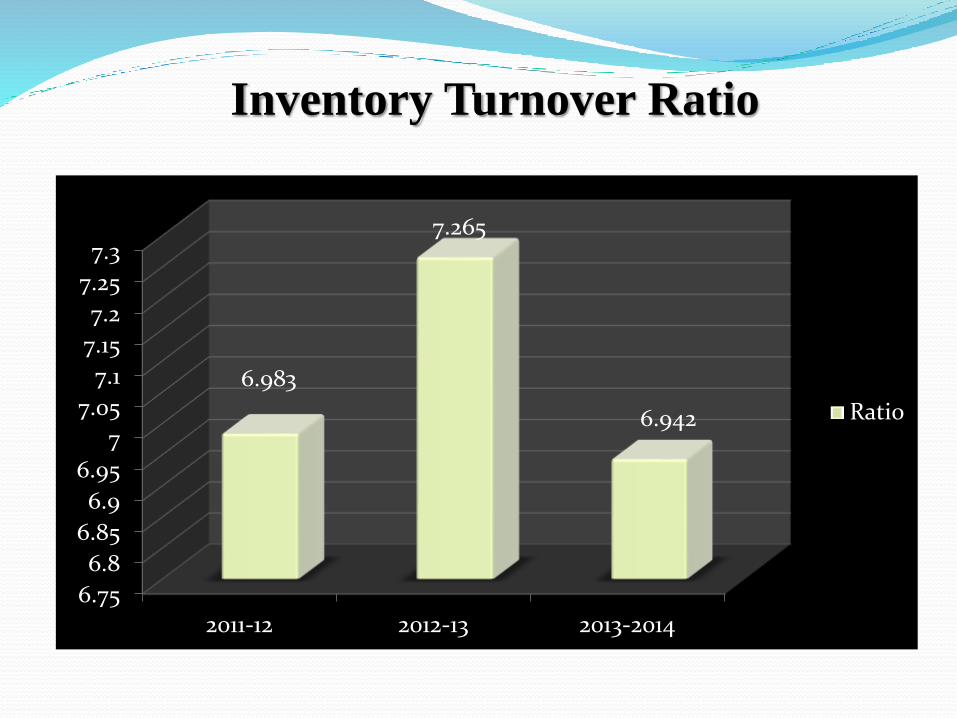
Inventory Turnover Ratio
6.75
6.8
6.85
6.9
6.95
7
7.05
7.1
7.15
7.2
7.25
7.3
2011-12 2012-13 2013-2014
Ratio6.942
6.983
7.265

Debt Equity Ratio
0
0.05
0.1
0.15
0.2
0.25
0.3
0.35
0.4
0.45
0.5
2011-12 2012-13 2013-2014
Ratio
0.450
0.078 0.071

Interest Coverage Ratio
0
1
2
3
4
5
6
7
8
2011-12 2012-13 2013-2014
Ratio
7.3946.717
6.049

Gross Profit Ratio
Ratio
0
10
20
30
40
2011-122012-13
2013-2014
Ratio
24.809 27.911
32.442

Net Profit Ratio
0
2
4
6
8
10
12
14
16
18
2011-12 2012-13 2013-2014
Ratio
12.605
13.823
16.464

Working CapitalParticular 2011-12` 2012-13 2013-14
Current Assets
Short term loan and advances 1829.25 2207.83 1299.2
Current investments 3204.17 3434.94 2343.24
Inventories 7522.99 6257.94 6007.81
Trade receivables 1904.3 1151.92 770.81
Cash and Bank Balances 3946.99 4192.36 3000.02
Other current assets 76.09 615.8 182.38
Total Assets (A) 18483.79 17860.79 13603.46
Current Liabilities
Short-term borrowings 65.62 70.94 43.69
Trade payables 7921.43 8524.01 10,930.61
Other current liabilities 9716.57 10616.79 10,888.89
Short-term provisions 2172.38 1544.26 1,902.81
Total Current Liabilities (B) 19876 20756 23766
Working Capital (A-B) -1392.09 -2894.95 -10162.18

COMMON SIZE STATEMENT

CAPM APPROACH CAPM measures the required rate of return.
CAPM is the most widely used risk return model because it is simple and
intuitively appealing and its basic message that diversifiable risk does not matter
is accepted by nearly everyone.
In the CAPM model, Beta defined as the risk of the investment in which its
compare market risk with the particular stock how much varies with respect to
market.
Expected return can be measure by the average of the variation in the market.

The CAPM formula is: Required return = Rf+ beta (E(Rm)-Rf)
Where:
rrf = the rate of return for a risk-free security
rm = the broad market's expected rate of return
Ba = beta of the asset
Stock data as per slope method average of 3 years
7.5352833
Expected Return Taken as the average of last 3 year
0.0396338
Required return =Rf+ beta(E(Rm)-Rf)
7.8984

DIVIDEND POLICY
Walter Model 2011-2012 2012-2013 2013-2014Dividend per share 12 8 8
Earning per share 67.84 50.28 66.02Rate of return on investment 10.48 12.81 12.72
cost of equity 13.82 13.82 13.82
valuation 3.93231982 3.414621734 4.442974694
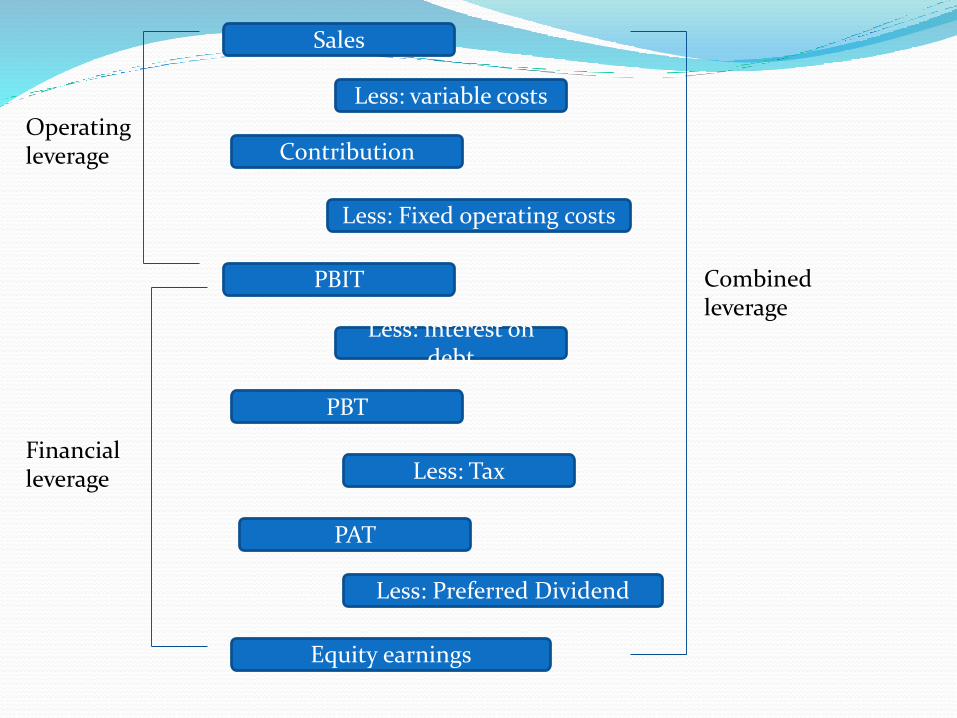
Sales
Less: variable costs
Contribution
Less: Fixed operating costs
PBIT
Less: interest on debt
PBT
Less: Tax
PAT
Less: Preferred Dividend
Equity earnings
Operating leverage
Financial leverage
Combined leverage
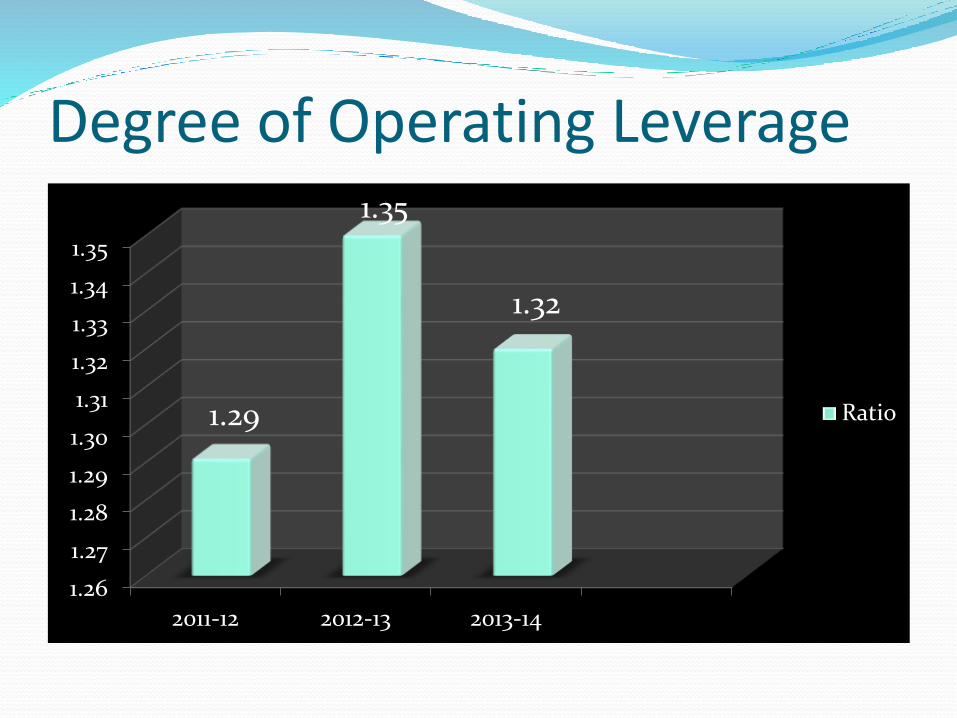
Degree of Operating Leverage
1.26
1.27
1.28
1.29
1.30
1.31
1.32
1.33
1.34
1.35
2011-12 2012-13 2013-14
Ratio1.29
1.35
1.32

Degree of Financial Leverage
0
0.2
0.4
0.6
0.8
1
1.2
2011-12 2012-13 2013-14
Ratio
1.05 1.08
0.76

Degree of Combine Leverage
0
0.2
0.4
0.6
0.8
1
1.2
1.4
1.6
2011-12 2012-13 2013-14
Ratio
1.361.45
1.01
Conclusion
As we all know that Tata steel is an ethical company that not only focus on gaining profit but also provide constant dividend to their shareholders and satisfy their employee. In last three years company’s assets are increased that shows the company is healthy but in front of that Current liability of the company is also increased in last 3 years which is not good for any big organization. Tata steel has also tried to increased in sales in 2014 but as a result expense of production or interest on debt also increased so that not much increase in net profit of the company.


