Analysis of technological and spatial needs of multimodal freight terminal Rail Baltic at Muuga Harbour (MCTRB) DB Engineering & Consulting GmbH | Logistics Consulting | Civitta Estonia | Infrastructure and Management Consulting |
Transcript
Analysis of technological and spatial needs of multimodal freight terminal Rail Baltic at Muuga Harbour (MCTRB)
DB Engineering & Consulting GmbH | Logistics Consulting |Civitta Estonia | Infrastructure and Management Consulting |
1
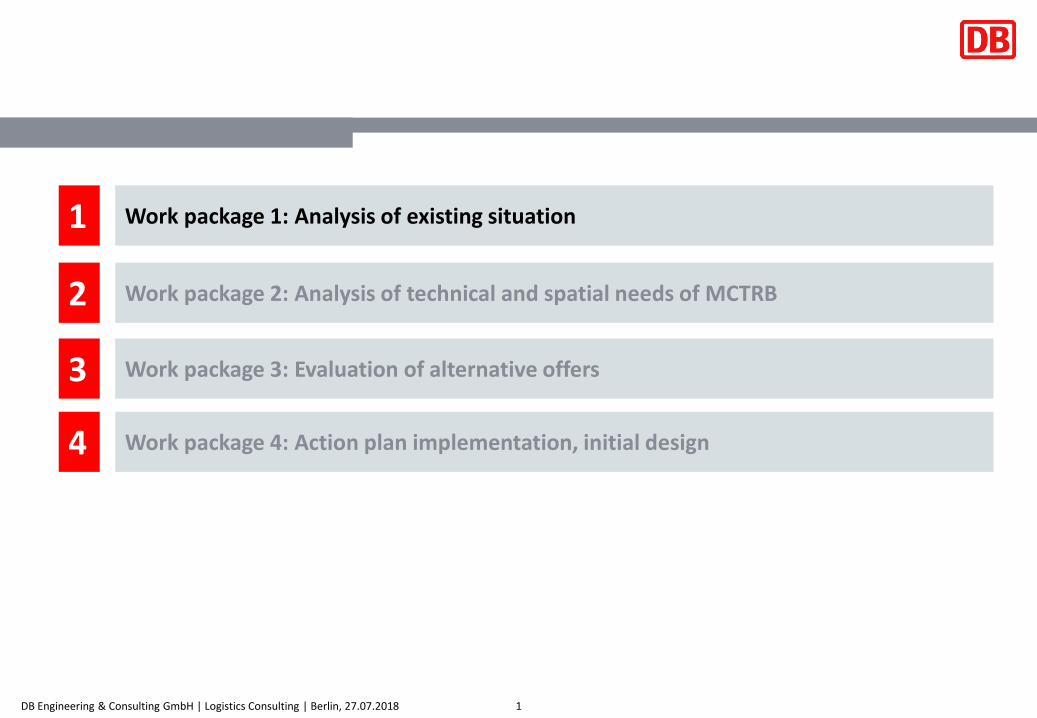
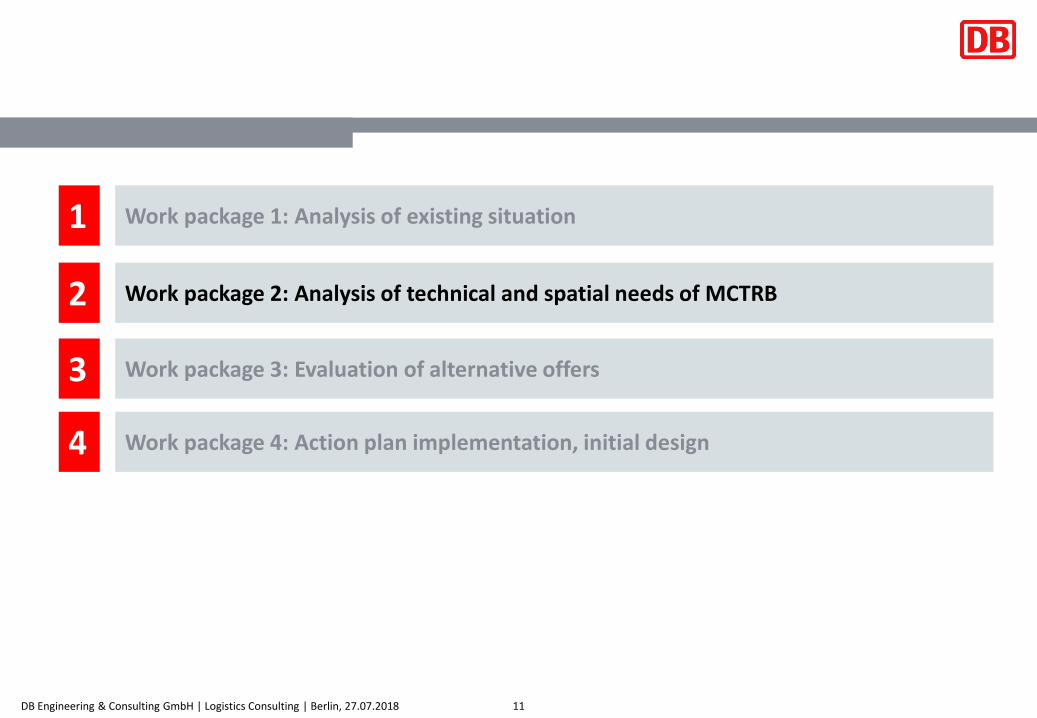
1 Work package 1: Analysis of existing situation
4 Work package 4: Action plan implementation, initial design
2 Work package 2: Analysis of technical and spatial needs of MCTRB
3 Work package 3: Evaluation of alternative offers
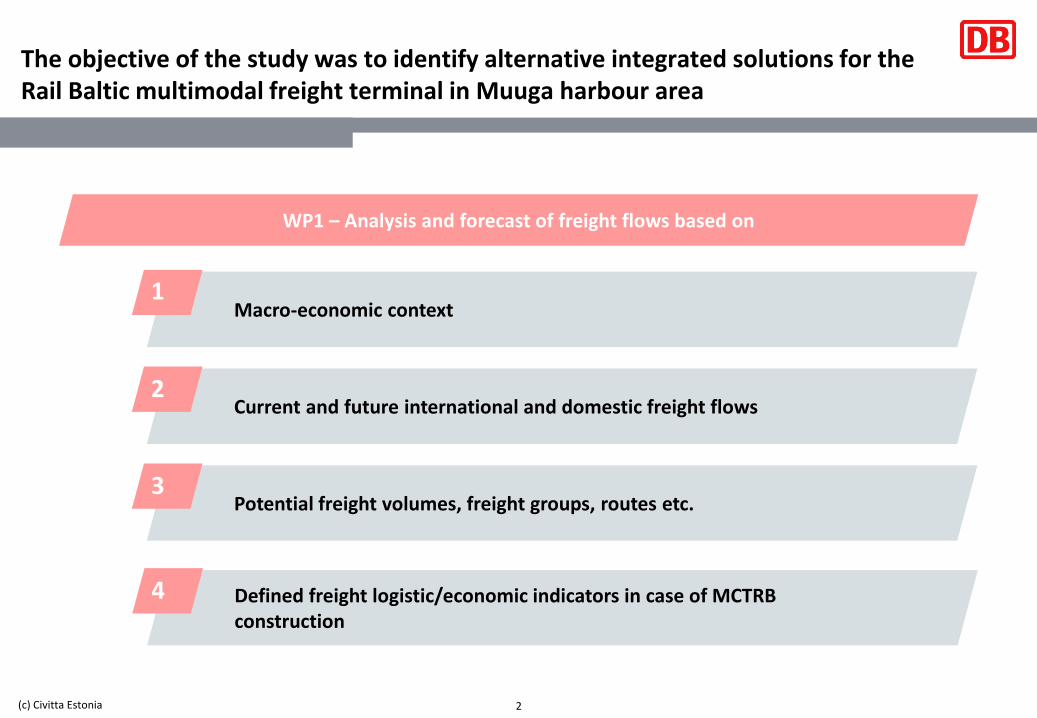
Defined freight logistic/economic indicators in case of MCTRB construction
4
WP1 – Analysis and forecast of freight flows based on
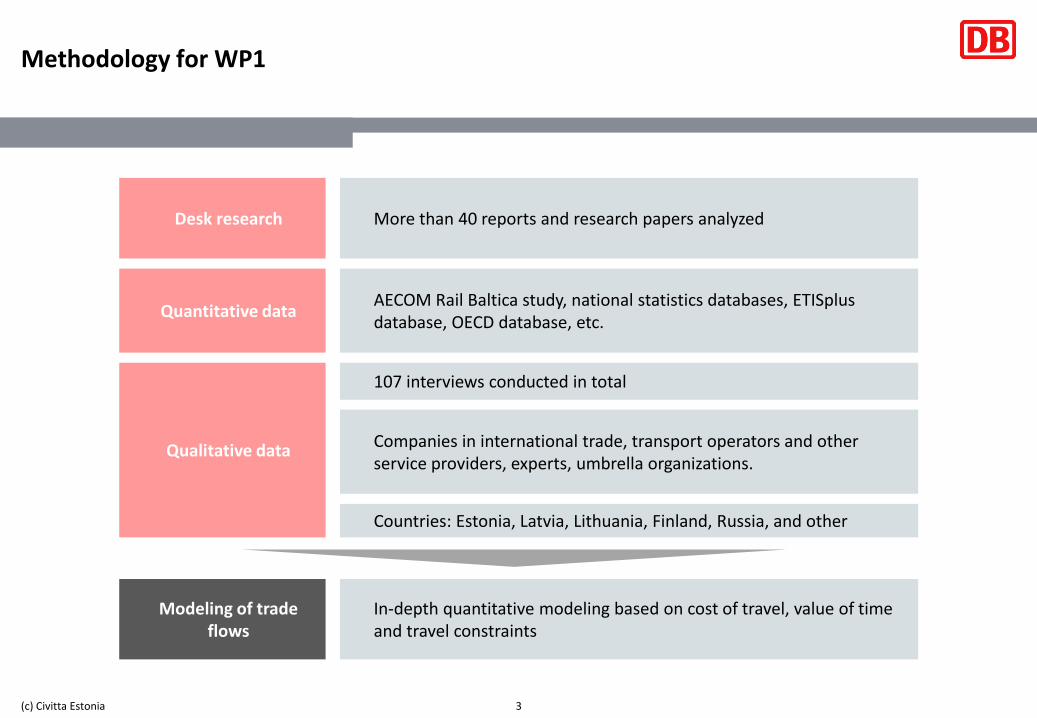
Methodology for WP1
3(c) Civitta Estonia
Desk research More than 40 reports and research papers analyzed
Quantitative data AECOM Rail Baltica study, national statistics databases, ETISplus database, OECD database, etc.
Countries: Estonia, Latvia, Lithuania, Finland, Russia, and other
Companies in international trade, transport operators and other service providers, experts, umbrella organizations.
107 interviews conducted in total
Qualitative data
Modeling of trade flows
In-depth quantitative modeling based on cost of travel, value of time and travel constraints
Global demand drivers were taken into account in the forecast
4(c) Civitta Estonia
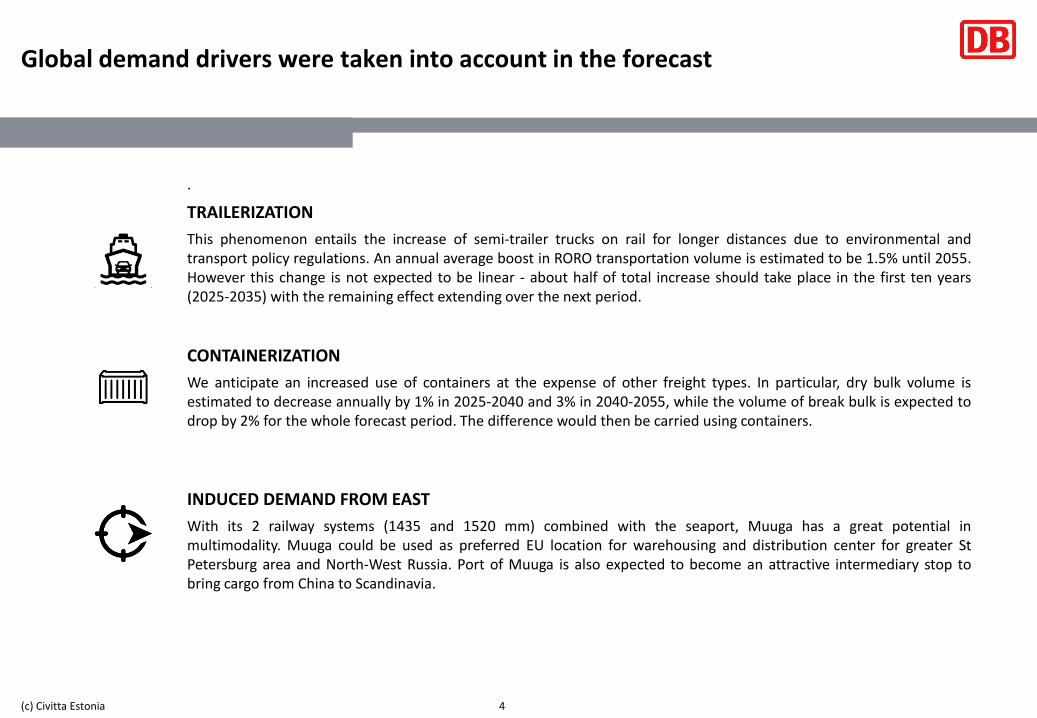
We anticipate an increased use of containers at the expense of other freight types. In particular, dry bulk volume isestimated to decrease annually by 1% in 2025-2040 and 3% in 2040-2055, while the volume of break bulk is expected todrop by 2% for the whole forecast period. The difference would then be carried using containers.
CONTAINERIZATION
INDUCED DEMAND FROM EAST
With its 2 railway systems (1435 and 1520 mm) combined with the seaport, Muuga has a great potential inmultimodality. Muuga could be used as preferred EU location for warehousing and distribution center for greater StPetersburg area and North-West Russia. Port of Muuga is also expected to become an attractive intermediary stop tobring cargo from China to Scandinavia.
TRAILERIZATION
This phenomenon entails the increase of semi-trailer trucks on rail for longer distances due to environmental andtransport policy regulations. An annual average boost in RORO transportation volume is estimated to be 1.5% until 2055.However this change is not expected to be linear - about half of total increase should take place in the first ten years(2025-2035) with the remaining effect extending over the next period.
.
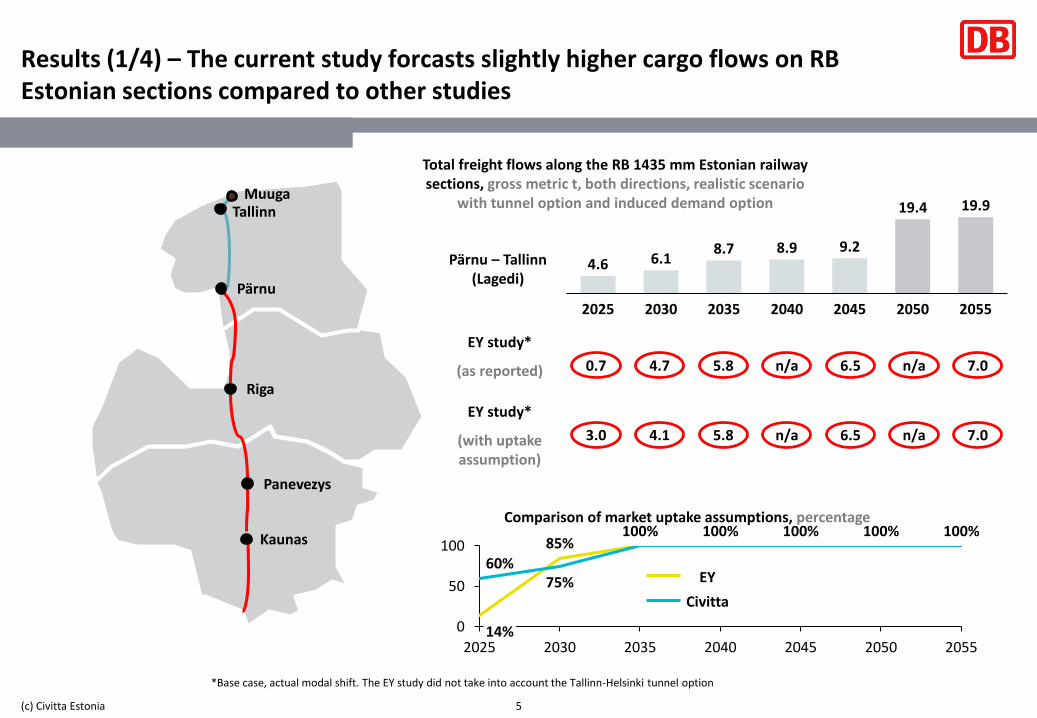
Results (1/4) – The current study forcasts slightly higher cargo flows on RB Estonian sections compared to other studies
5(c) Civitta Estonia
*Base case, actual modal shift. The EY study did not take into account the Tallinn-Helsinki tunnel option
Tallinn
Pärnu
Muuga
Riga
Panevezys
Kaunas
20452025 2030 2035 20552040 2050
4.6 6.18.7 8.9 9.2
19.4 19.9
Pärnu – Tallinn (Lagedi)
Total freight flows along the RB 1435 mm Estonian railway sections, gross metric t, both directions, realistic scenario
with tunnel option and induced demand option
EY study*
(as reported) 0.7 4.7 5.8 n/a 6.5 n/a 7.0
EY study*
(with uptake assumption)
3.0 4.1 5.8 n/a 6.5 n/a 7.0
0
50
100
2025 2030 2035 2040 2045 2050 205514%
85%
60%
100%
75%
100% 100% 100% 100%
EY
Civitta
Comparison of market uptake assumptions, percentage
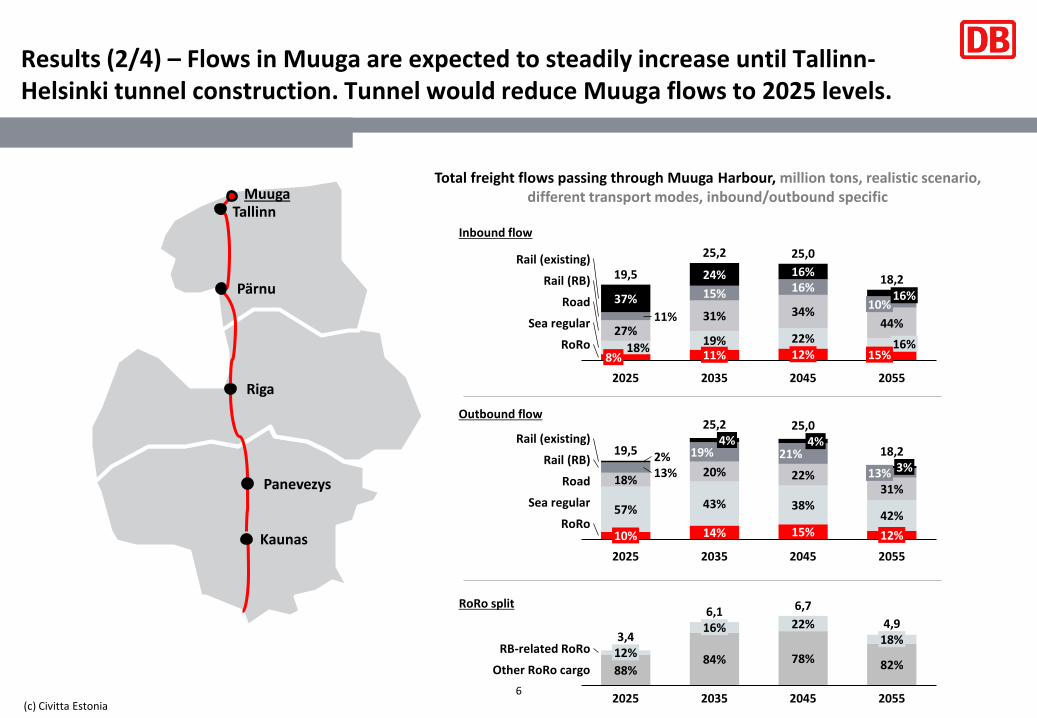
Results (2/4) – Flows in Muuga are expected to steadily increase until Tallinn-Helsinki tunnel construction. Tunnel would reduce Muuga flows to 2025 levels.
6
(c) Civitta Estonia
Tallinn
Pärnu
Muuga
Riga
Panevezys
Kaunas
Inbound flow
37%
27%11%Sea regular
8%
24%
2025
25,0
2055
15%
19%
2035
16%18,2
10%
16%
34%
12%
2045
16%
44%
16%15%
31%
Rail (existing)
18%
Rail (RB)
Road
22%
11%RoRo
19,5
25,2
Outbound flow
2025
13%2%
12%
25,2
Sea regular
13%
57%
18%
10%
43%
19%
20%
14%
2035
25,0Rail (existing) 4%4%
21%
22%
38%
15%
2045
3%
31%
42%
2055
Rail (RB)
Road
RoRo
19,5 18,2
RoRo split
22%16%
12%
88%
2025
84% 78%
2035 2045
18%
82%
2055
RB-related RoRo
Other RoRo cargo
3,4
6,1 6,7
4,9
Total freight flows passing through Muuga Harbour, million tons, realistic scenario, different transport modes, inbound/outbound specific
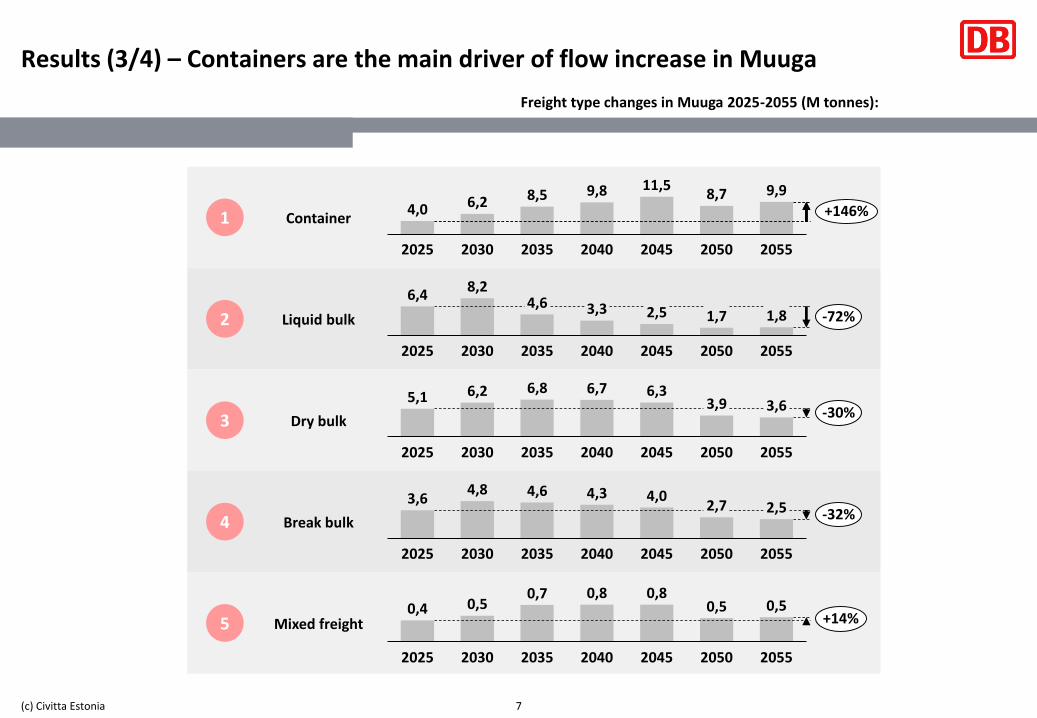
Results (3/4) – Containers are the main driver of flow increase in Muuga
7(c) Civitta Estonia
Freight type changes in Muuga 2025-2055 (M tonnes):
205520402025 2030 2035 2045 2050
9,99,84,0 6,2 8,5
11,58,7
+146%Container1
4,6
205020352025 2030 2040 20552045
8,26,4
3,3 2,5 1,7 1,8 -72%Liquid bulk2
2045
6,8
20302025 2035 2040 2050 2055
5,1 6,2 6,7 6,33,9 3,6 -30%
Dry bulk3
20352025 20552030 2040 2045 2050
2,73,64,8 4,6 4,3 4,0
2,5 -32%Break bulk4
20352025 2055
0,4
2030 20452040 2050
0,50,80,7 0,8
0,5 0,5+14%Mixed freight5
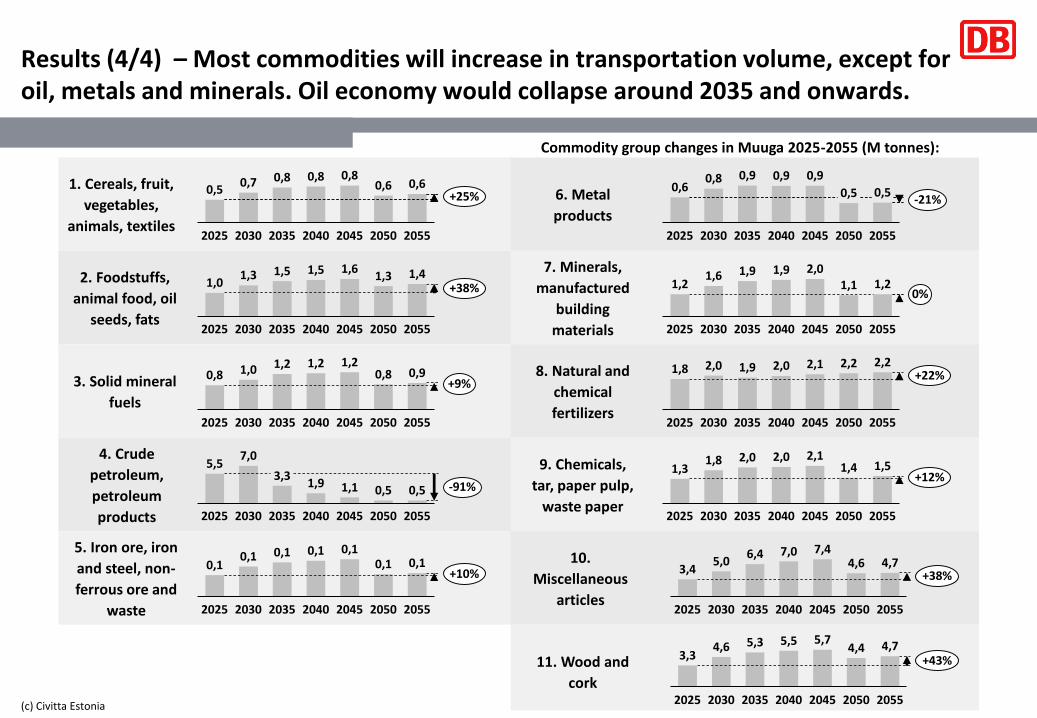
Results (4/4) – Most commodities will increase in transportation volume, except for oil, metals and minerals. Oil economy would collapse around 2035 and onwards.
(c) Civitta Estonia
2. Foodstuffs,
animal food, oil
seeds, fats
3. Solid mineral
fuels
4. Crude
petroleum,
petroleum
products
5. Iron ore, iron
and steel, non-
ferrous ore and
waste
1. Cereals, fruit,
vegetables,
animals, textiles
7. Minerals,
manufactured
building
materials
8. Natural and
chemical
fertilizers
9. Chemicals,
tar, paper pulp,
waste paper
10.
Miscellaneous
articles
6. Metal
products
11. Wood and
cork
2025 2030 2035 2040 2045 20552050
0,50,7 0,8 0,8 0,8
0,6 0,6+25%
2030 205020352025 2040 2045 2055
1,01,3 1,5 1,5 1,6 1,41,3
+38%
1,2
2050
1,2
2025 2030 20402035 2045 2055
0,8 1,01,2
0,8 0,9+9%
20452025 20402030 2035 20552050
1,1
5,57,0
3,31,9
0,5 0,5 -91%
2025 2030 2035 2040 2045 2050 2055
0,10,1 0,1
0,1 0,1 0,10,1
+10%
204520402025 2030 2035 2050
0,5
2055
0,60,8 0,9 0,9 0,9
0,5-21%
203520302025 20502040 20552045
1,91,2
1,6 1,9 2,01,1 1,2
0%
205520402025 20452030 2035 2050
1,8 2,0 1,9 2,0 2,1 2,2 2,2+22%
2025 2030 2035 20452040 2050 2055
2,01,3
1,8 2,0 2,11,4 1,5
+12%
7,0
2025 2050 205520452030 2035
7,45,0
2040
3,46,4
4,6 4,7+38%
Commodity group changes in Muuga 2025-2055 (M tonnes):
204520302025 2035 2040 2050 2055
3,35,54,6 5,3 5,7
4,4 4,7+43%
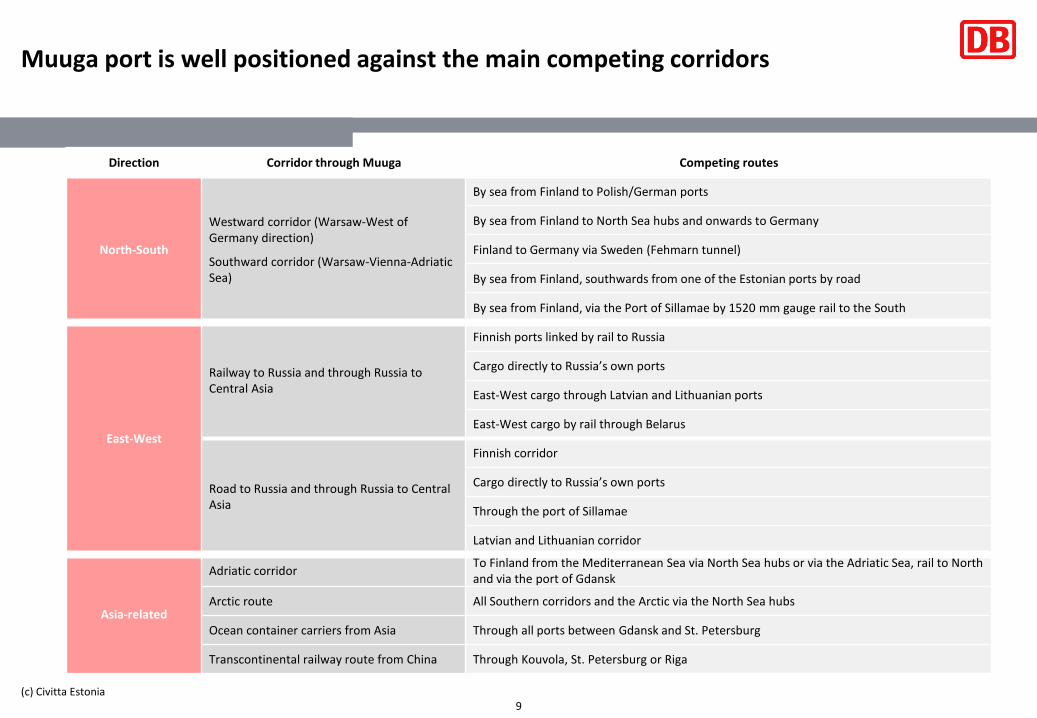
Muuga port is well positioned against the main competing corridors
9(c) Civitta Estonia
Direction Corridor through Muuga Competing routes
North-South
Westward corridor (Warsaw-West of Germany direction)
Southward corridor (Warsaw-Vienna-Adriatic Sea)
By sea from Finland to Polish/German ports
By sea from Finland to North Sea hubs and onwards to Germany
Finland to Germany via Sweden (Fehmarn tunnel)
By sea from Finland, southwards from one of the Estonian ports by road
By sea from Finland, via the Port of Sillamae by 1520 mm gauge rail to the South
East-West
Railway to Russia and through Russia to Central Asia
Finnish ports linked by rail to Russia
Cargo directly to Russia’s own ports
East-West cargo through Latvian and Lithuanian ports
East-West cargo by rail through Belarus
Road to Russia and through Russia to Central Asia
Finnish corridor
Cargo directly to Russia’s own ports
Through the port of Sillamae
Latvian and Lithuanian corridor
Asia-related
Adriatic corridorTo Finland from the Mediterranean Sea via North Sea hubs or via the Adriatic Sea, rail to North and via the port of Gdansk
Arctic route All Southern corridors and the Arctic via the North Sea hubs
Ocean container carriers from Asia Through all ports between Gdansk and St. Petersburg
Transcontinental railway route from China Through Kouvola, St. Petersburg or Riga
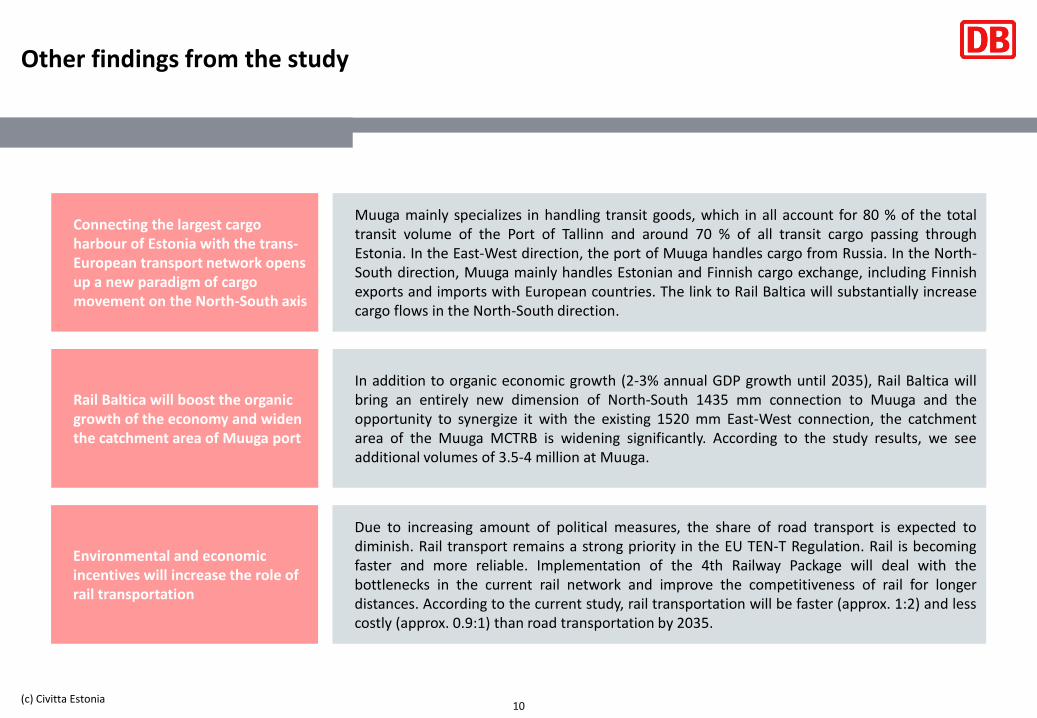
Other findings from the study
10(c) Civitta Estonia
Connecting the largest cargo harbour of Estonia with the trans-European transport network opens up a new paradigm of cargo movement on the North-South axis
Muuga mainly specializes in handling transit goods, which in all account for 80 % of the totaltransit volume of the Port of Tallinn and around 70 % of all transit cargo passing throughEstonia. In the East-West direction, the port of Muuga handles cargo from Russia. In the North-South direction, Muuga mainly handles Estonian and Finnish cargo exchange, including Finnishexports and imports with European countries. The link to Rail Baltica will substantially increasecargo flows in the North-South direction.
Rail Baltica will boost the organic growth of the economy and widen the catchment area of Muuga port
In addition to organic economic growth (2-3% annual GDP growth until 2035), Rail Baltica willbring an entirely new dimension of North-South 1435 mm connection to Muuga and theopportunity to synergize it with the existing 1520 mm East-West connection, the catchmentarea of the Muuga MCTRB is widening significantly. According to the study results, we seeadditional volumes of 3.5-4 million at Muuga.
Environmental and economic incentives will increase the role of rail transportation
Due to increasing amount of political measures, the share of road transport is expected todiminish. Rail transport remains a strong priority in the EU TEN-T Regulation. Rail is becomingfaster and more reliable. Implementation of the 4th Railway Package will deal with thebottlenecks in the current rail network and improve the competitiveness of rail for longerdistances. According to the current study, rail transportation will be faster (approx. 1:2) and lesscostly (approx. 0.9:1) than road transportation by 2035.
11
1 Work package 1: Analysis of existing situation
4 Work package 4: Action plan implementation, initial design
2 Work package 2: Analysis of technical and spatial needs of MCTRB
3 Work package 3: Evaluation of alternative offers
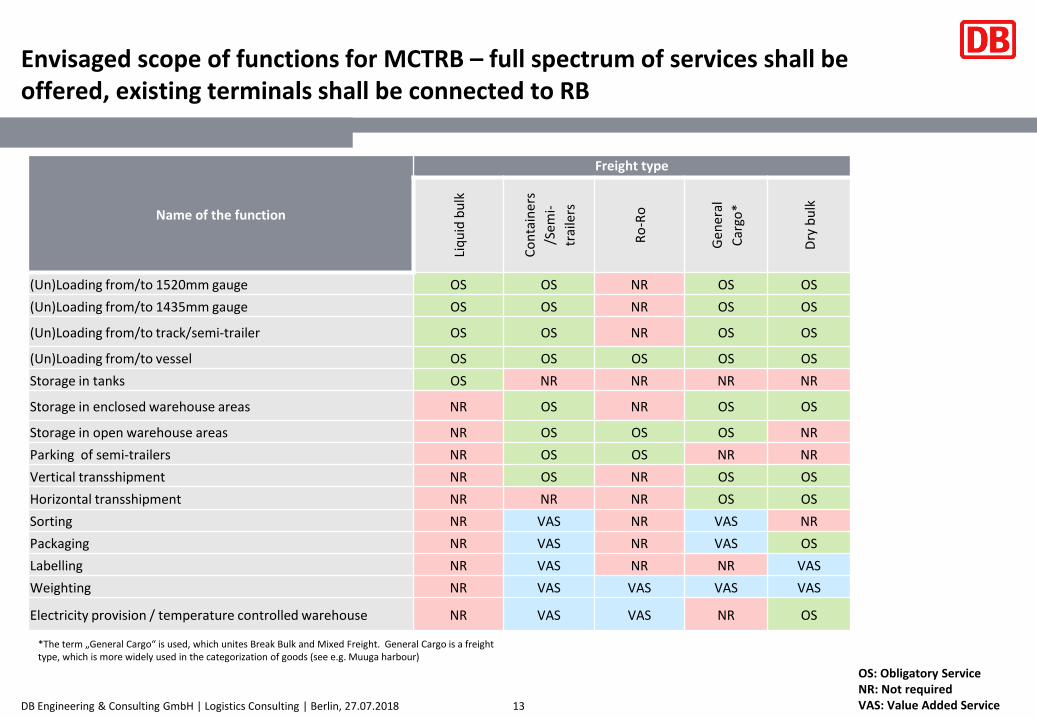
Envisaged scope of functions for MCTRB – full spectrum of services shall beoffered, existing terminals shall be connected to RB
13
Name of the function
Freight type
Liq
uid
bu
lk
Co
nta
iner
s
/Sem
i-
trai
lers
Ro
-Ro
Gen
eral
Car
go*
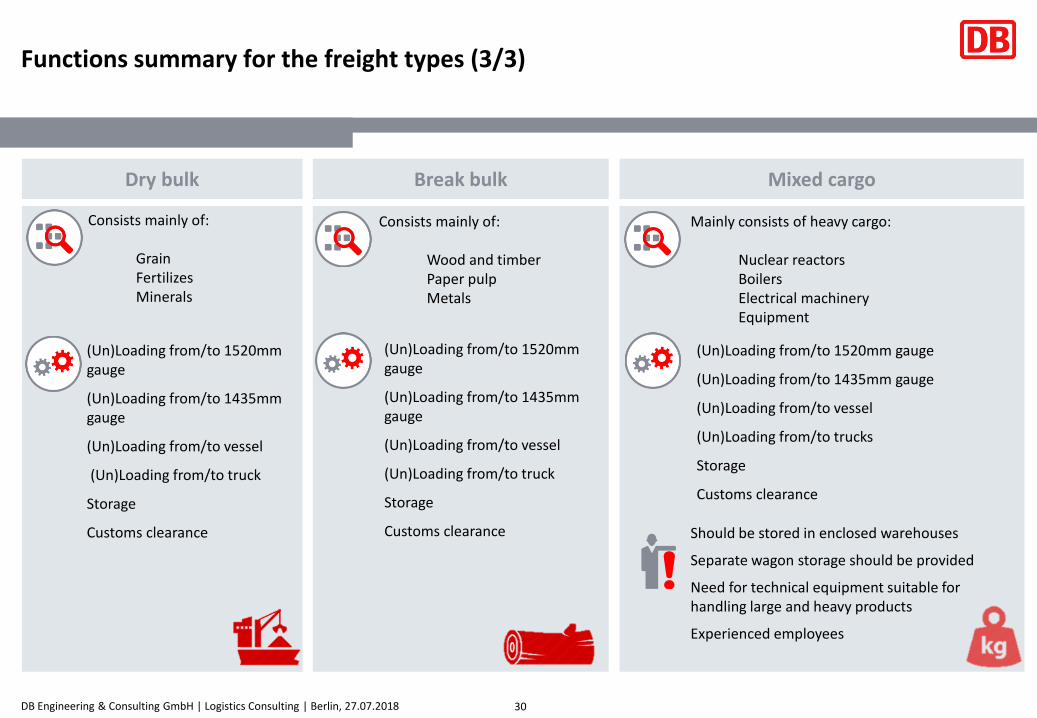
Dry
bu
lk
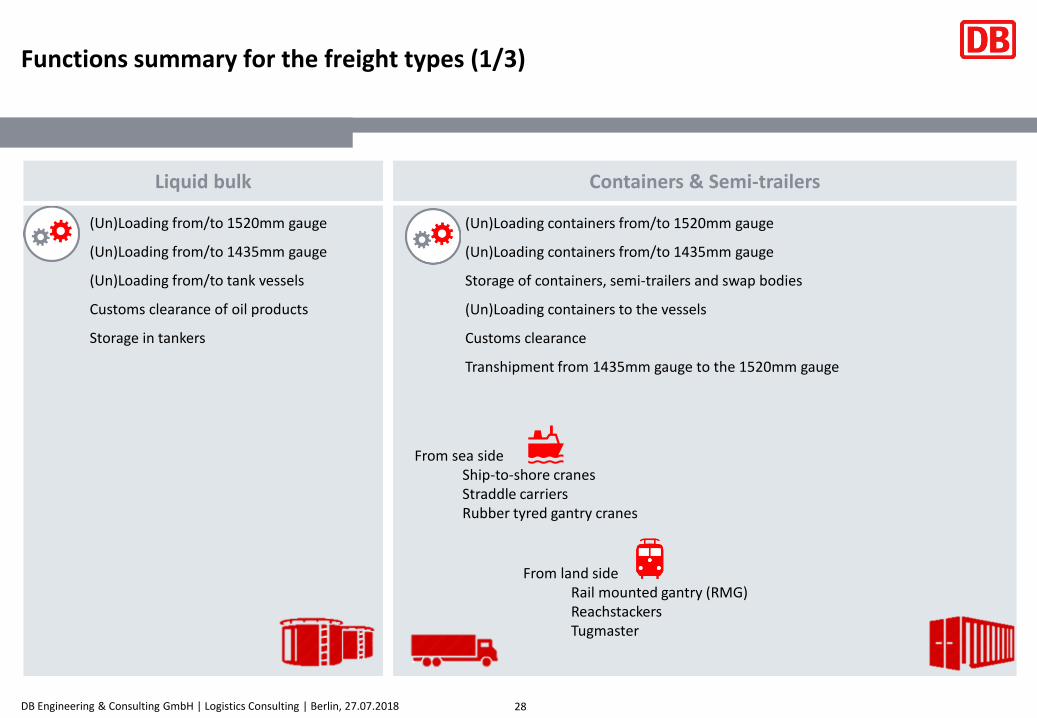
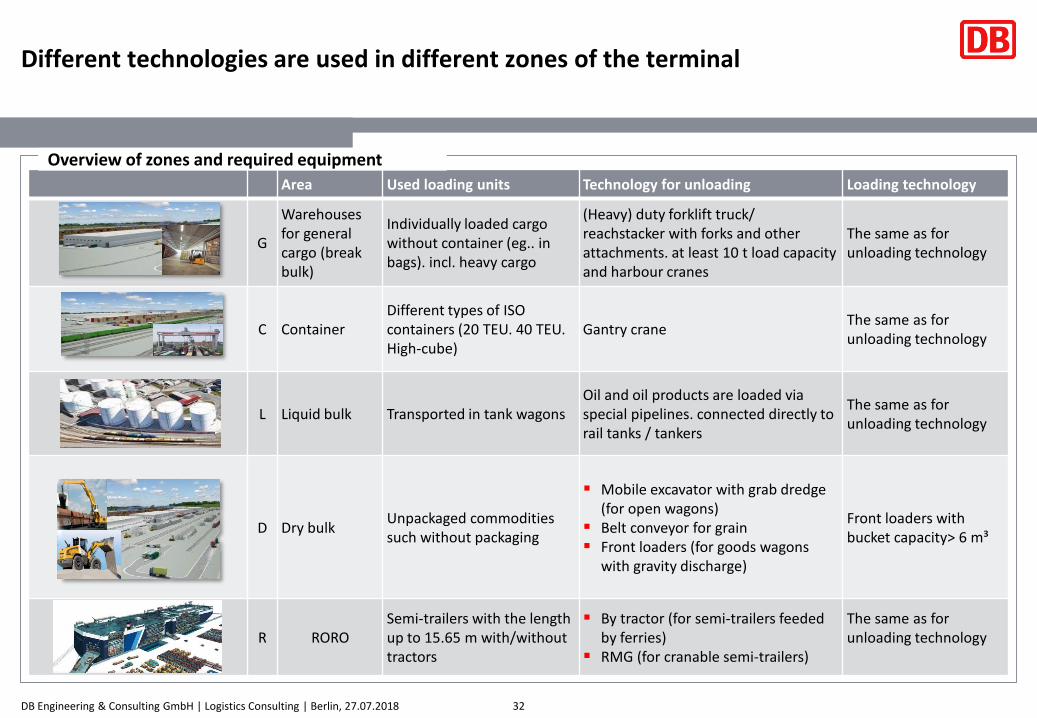
(Un)Loading from/to 1520mm gauge OS OS NR OS OS
(Un)Loading from/to 1435mm gauge OS OS NR OS OS
(Un)Loading from/to track/semi-trailer OS OS NR OS OS
(Un)Loading from/to vessel OS OS OS OS OS
Storage in tanks OS NR NR NR NR
Storage in enclosed warehouse areas NR OS NR OS OS
Storage in open warehouse areas NR OS OS OS NR
Parking of semi-trailers NR OS OS NR NR
Vertical transshipment NR OS NR OS OS
Horizontal transshipment NR NR NR OS OS
Sorting NR VAS NR VAS NR
Packaging NR VAS NR VAS OS
Labelling NR VAS NR NR VAS
Weighting NR VAS VAS VAS VAS
Electricity provision / temperature controlled warehouse NR VAS VAS NR OS
OS: Obligatory ServiceNR: Not requiredVAS: Value Added Service
*The term „General Cargo“ is used, which unites Break Bulk and Mixed Freight. General Cargo is a freighttype, which is more widely used in the categorization of goods (see e.g. Muuga harbour)
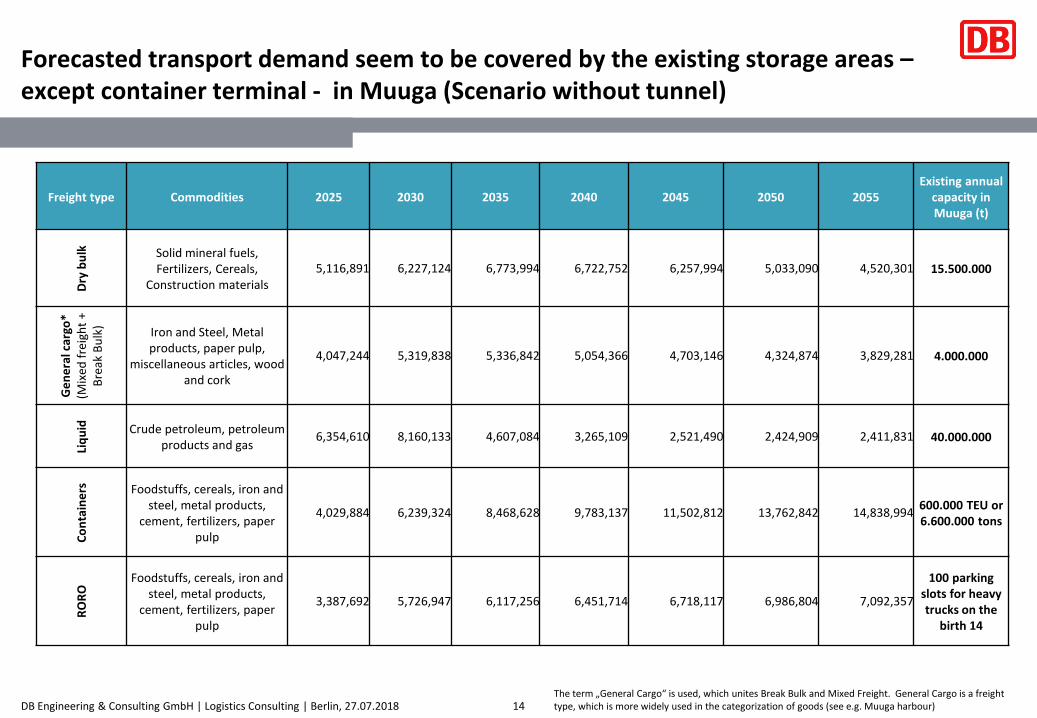
Forecasted transport demand seem to be covered by the existing storage areas –except container terminal - in Muuga (Scenario without tunnel)
14The term „General Cargo“ is used, which unites Break Bulk and Mixed Freight. General Cargo is a freighttype, which is more widely used in the categorization of goods (see e.g. Muuga harbour)
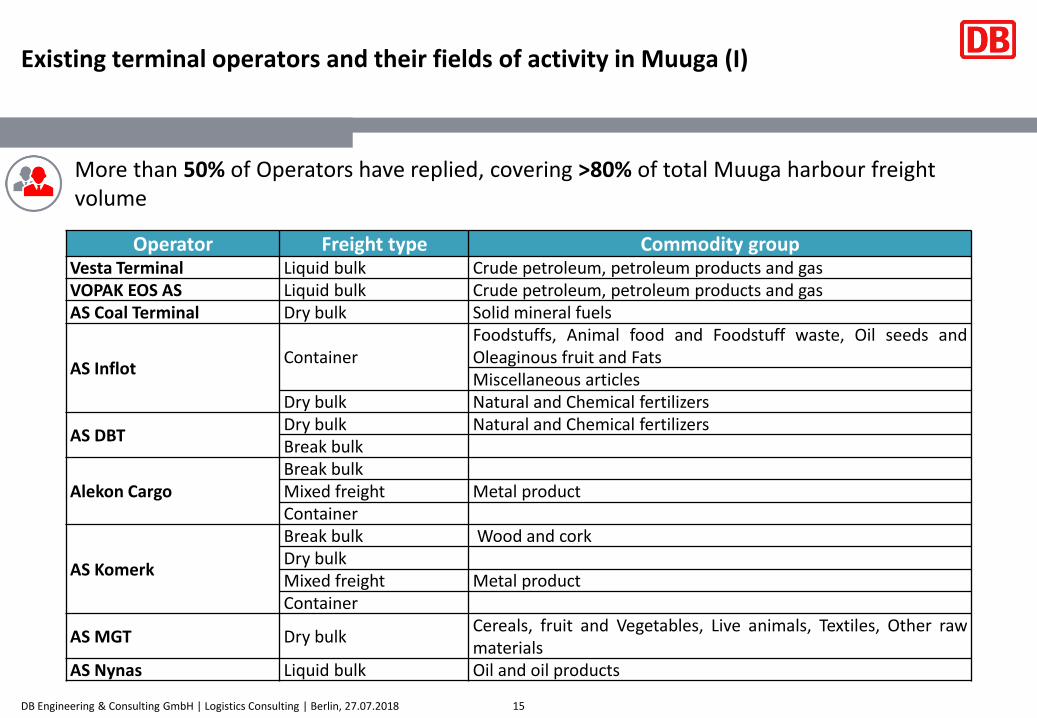
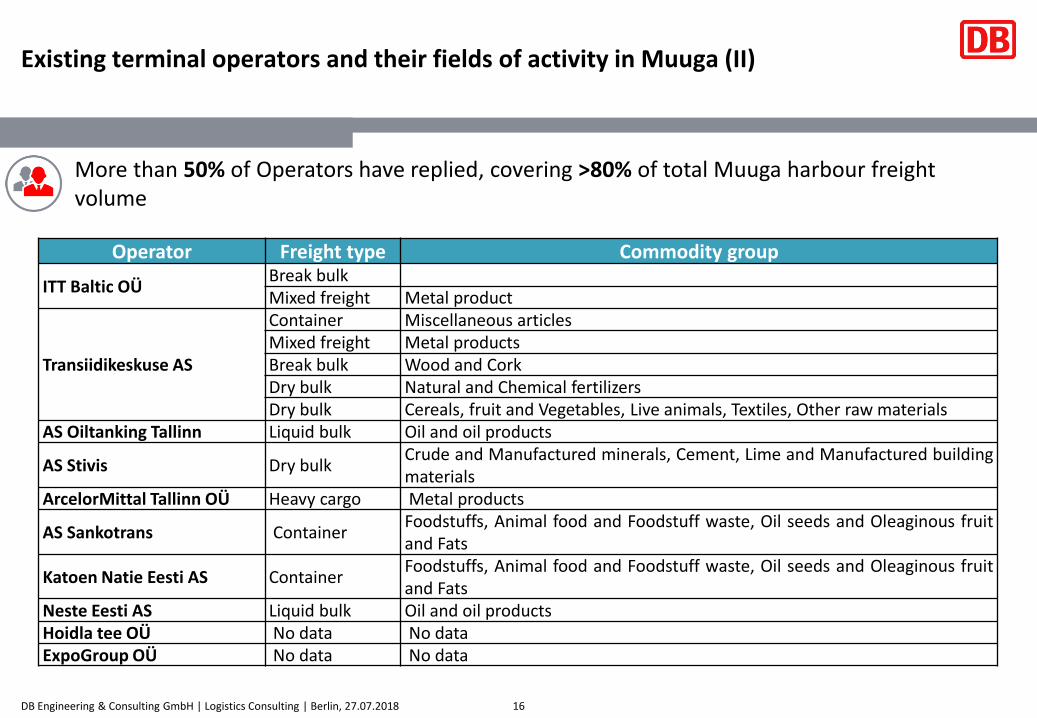
Existing terminal operators and their fields of activity in Muuga (II)
16
Operator Freight type Commodity group
ITT Baltic OÜBreak bulkMixed freight Metal product
Transiidikeskuse AS
Container Miscellaneous articlesMixed freight Metal productsBreak bulk Wood and CorkDry bulk Natural and Chemical fertilizersDry bulk Cereals, fruit and Vegetables, Live animals, Textiles, Other raw materials
AS Oiltanking Tallinn Liquid bulk Oil and oil products
AS Stivis Dry bulkCrude and Manufactured minerals, Cement, Lime and Manufactured buildingmaterials
ArcelorMittal Tallinn OÜ Heavy cargo Metal products
AS Sankotrans ContainerFoodstuffs, Animal food and Foodstuff waste, Oil seeds and Oleaginous fruitand Fats
Katoen Natie Eesti AS ContainerFoodstuffs, Animal food and Foodstuff waste, Oil seeds and Oleaginous fruitand Fats
Neste Eesti AS Liquid bulk Oil and oil productsHoidla tee OÜ No data No dataExpoGroup OÜ No data No data
More than 50% of Operators have replied, covering >80% of total Muuga harbour freightvolume
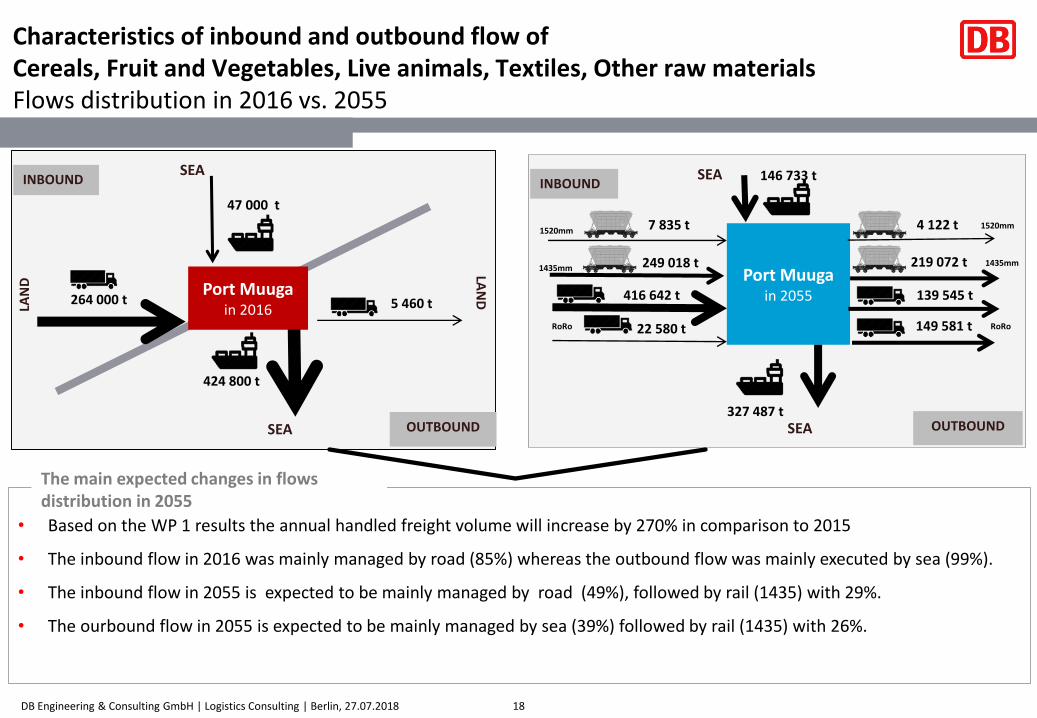
Characteristics of inbound and outbound flow ofCereals, Fruit and Vegetables, Live animals, Textiles, Other raw materialsFlows distribution in 2016 vs. 2055
18
INBOUND
Port Muugain 2016
OUTBOUND
LAN
D
LAN
D
SEA
SEA
47 000 t
5 460 t
424 800 t
264 000 t
1520mm
1435mm
INBOUND
Port Muugain 2055
OUTBOUNDSEA
SEA 146 733 t
149 581 t
327 487 t
22 580 t
249 018 t
7 835 t
219 072 t
4 122 t 1520mm
1435mm
416 642 t
RoRo RoRo
139 545 t
1520mm
1435mm
• Based on the WP 1 results the annual handled freight volume will increase by 270% in comparison to 2015
• The inbound flow in 2016 was mainly managed by road (85%) whereas the outbound flow was mainly executed by sea (99%).
• The inbound flow in 2055 is expected to be mainly managed by road (49%), followed by rail (1435) with 29%.
• The ourbound flow in 2055 is expected to be mainly managed by sea (39%) followed by rail (1435) with 26%.
The main expected changes in flowsdistribution in 2055
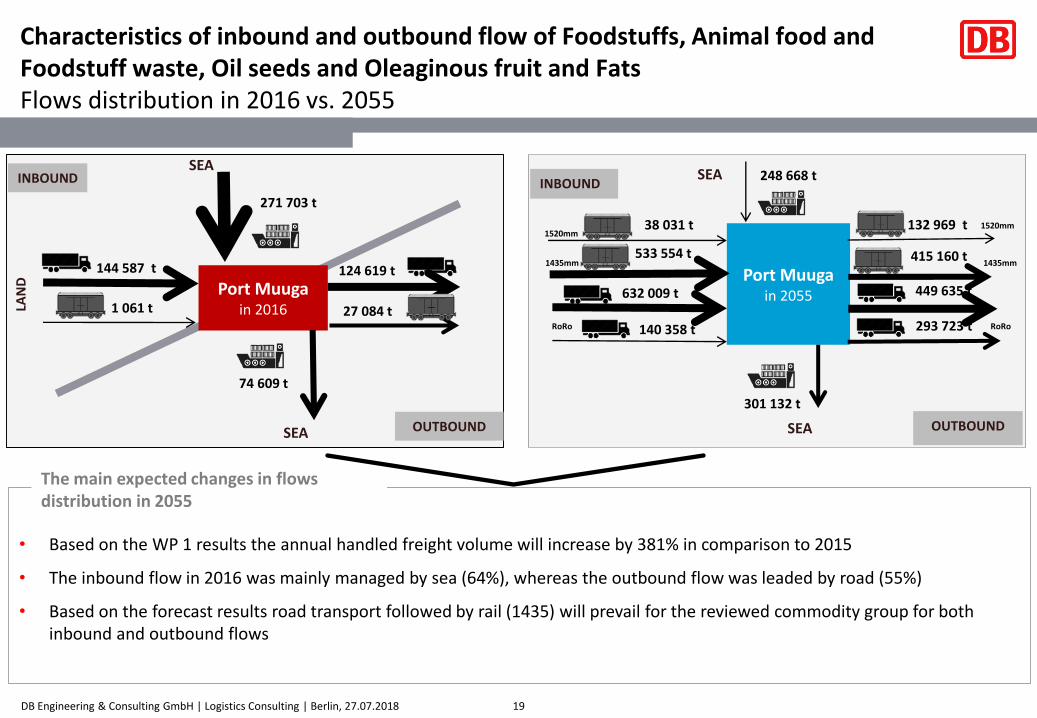
Characteristics of inbound and outbound flow of Foodstuffs, Animal food andFoodstuff waste, Oil seeds and Oleaginous fruit and FatsFlows distribution in 2016 vs. 2055
19
INBOUND
Port Muugain 2016
OUTBOUND
LAN
D
SEA
SEA
271 703 t
74 609 t
144 587 t 124 619 t
27 084 t1 061 t
INBOUND
Port Muugain 2055
OUTBOUNDSEA
SEA 248 668 t
293 723 t
301 132 t
140 358 t
533 554 t
38 031 t
415 160 t
132 969 t 1520mm
1435mm
632 009 t
RoRo RoRo
449 635 t
1435mm
1520mm
• Based on the WP 1 results the annual handled freight volume will increase by 381% in comparison to 2015
• The inbound flow in 2016 was mainly managed by sea (64%), whereas the outbound flow was leaded by road (55%)
• Based on the forecast results road transport followed by rail (1435) will prevail for the reviewed commodity group for bothinbound and outbound flows
The main expected changes in flowsdistribution in 2055
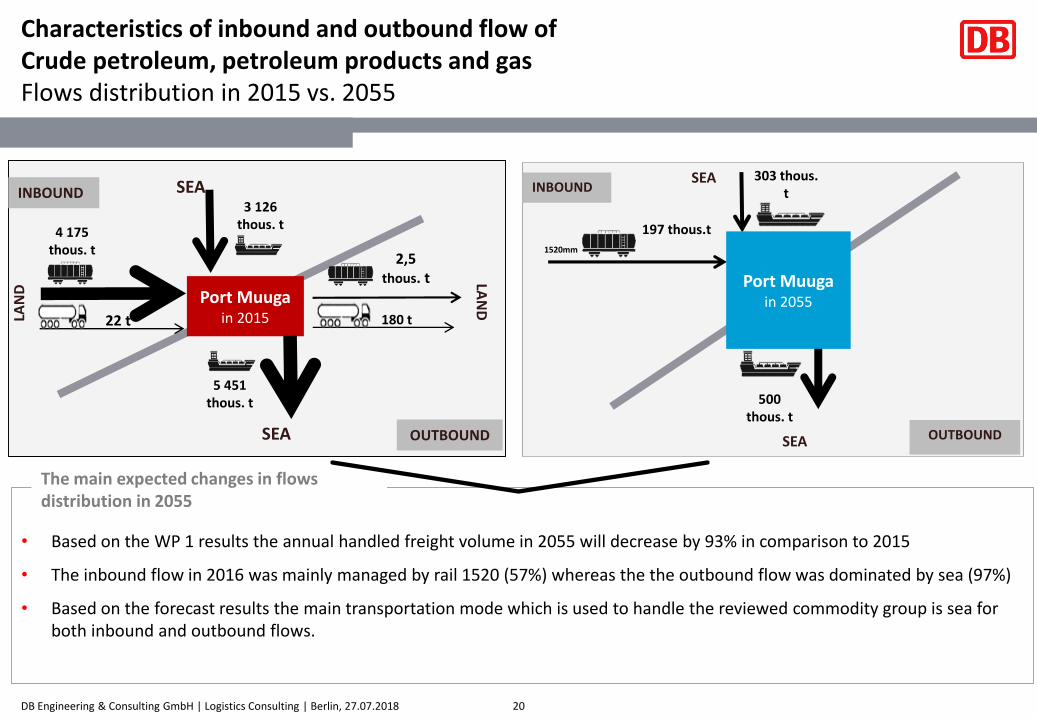
Characteristics of inbound and outbound flow ofCrude petroleum, petroleum products and gas Flows distribution in 2015 vs. 2055
20
INBOUND
Port Muugain 2015
OUTBOUND
LAN
D
LAN
D
SEA
SEA3 126
thous. t4 175
thous. t2,5
thous. t
180 t
5 451 thous. t
22 t
The main expected changes in flowsdistribution in 2055
INBOUND
OUTBOUNDSEA
SEA 303 thous. t
500 thous. t
197 thous.t
1520mm
• Based on the WP 1 results the annual handled freight volume in 2055 will decrease by 93% in comparison to 2015
• The inbound flow in 2016 was mainly managed by rail 1520 (57%) whereas the the outbound flow was dominated by sea (97%)
• Based on the forecast results the main transportation mode which is used to handle the reviewed commodity group is sea for both inbound and outbound flows.
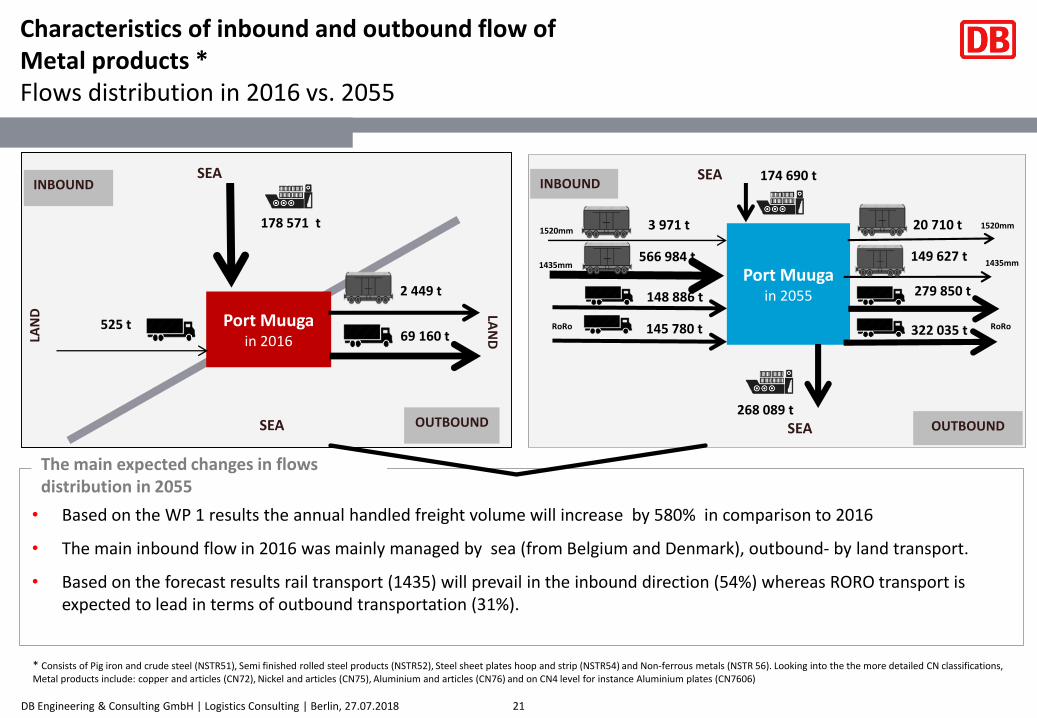
Characteristics of inbound and outbound flow ofMetal products *Flows distribution in 2016 vs. 2055
21
* Consists of Pig iron and crude steel (NSTR51), Semi finished rolled steel products (NSTR52), Steel sheet plates hoop and strip (NSTR54) and Non-ferrous metals (NSTR 56). Looking into the the more detailed CN classifications, Metal products include: copper and articles (CN72), Nickel and articles (CN75), Aluminium and articles (CN76) and on CN4 level for instance Aluminium plates (CN7606)
INBOUND
Port Muugain 2055
OUTBOUNDSEA
SEA 174 690 t
322 035 t
268 089 t
145 780 t
566 984 t
3 971 t
149 627 t
20 710 t 1520mm
1435mm
148 886 t
RoRo RoRo
279 850 t
1520mm
1435mm
• Based on the WP 1 results the annual handled freight volume will increase by 580% in comparison to 2016
• The main inbound flow in 2016 was mainly managed by sea (from Belgium and Denmark), outbound- by land transport.
• Based on the forecast results rail transport (1435) will prevail in the inbound direction (54%) whereas RORO transport isexpected to lead in terms of outbound transportation (31%).
The main expected changes in flowsdistribution in 2055
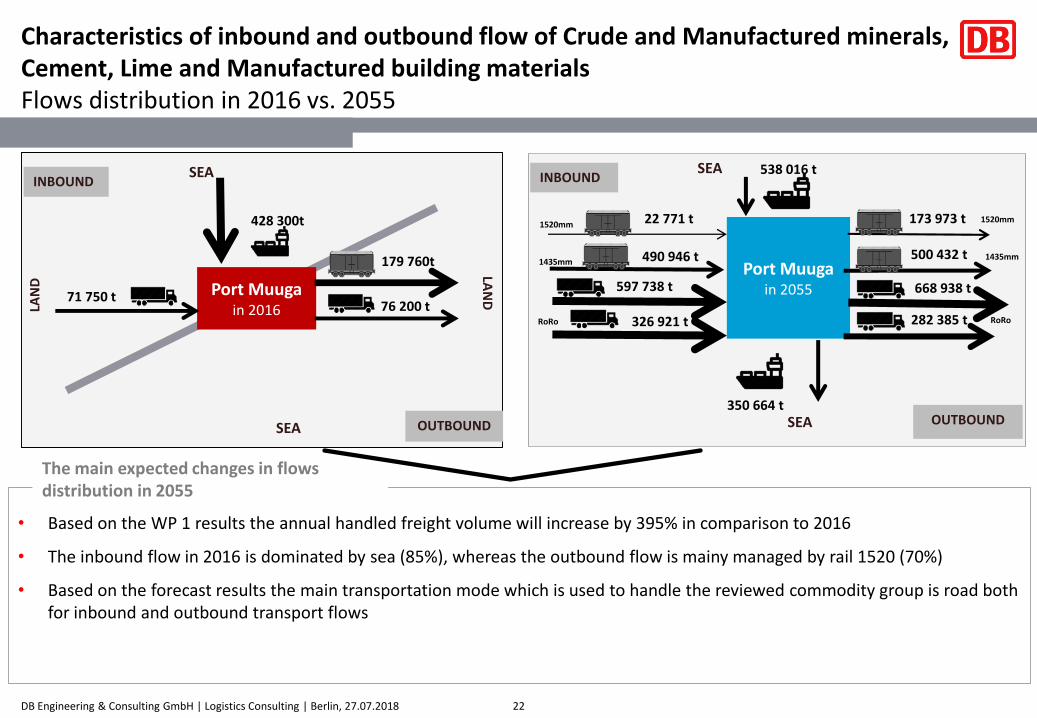
Characteristics of inbound and outbound flow of Crude and Manufactured minerals, Cement, Lime and Manufactured building materialsFlows distribution in 2016 vs. 2055
22
INBOUND
Port Muugain 2016
OUTBOUND
LAN
D
LAN
D
SEA
SEA
428 300t
76 200 t71 750 t
179 760t
INBOUND
Port Muugain 2055
OUTBOUNDSEA
SEA 538 016 t
282 385 t
350 664 t
326 921 t
490 946 t
22 771 t
500 432 t
173 973 t 1520mm
1435mm
597 738 t
RoRo RoRo
668 938 t
1520mm
1435mm
• Based on the WP 1 results the annual handled freight volume will increase by 395% in comparison to 2016
• The inbound flow in 2016 is dominated by sea (85%), whereas the outbound flow is mainy managed by rail 1520 (70%)
• Based on the forecast results the main transportation mode which is used to handle the reviewed commodity group is road both for inbound and outbound transport flows
The main expected changes in flowsdistribution in 2055
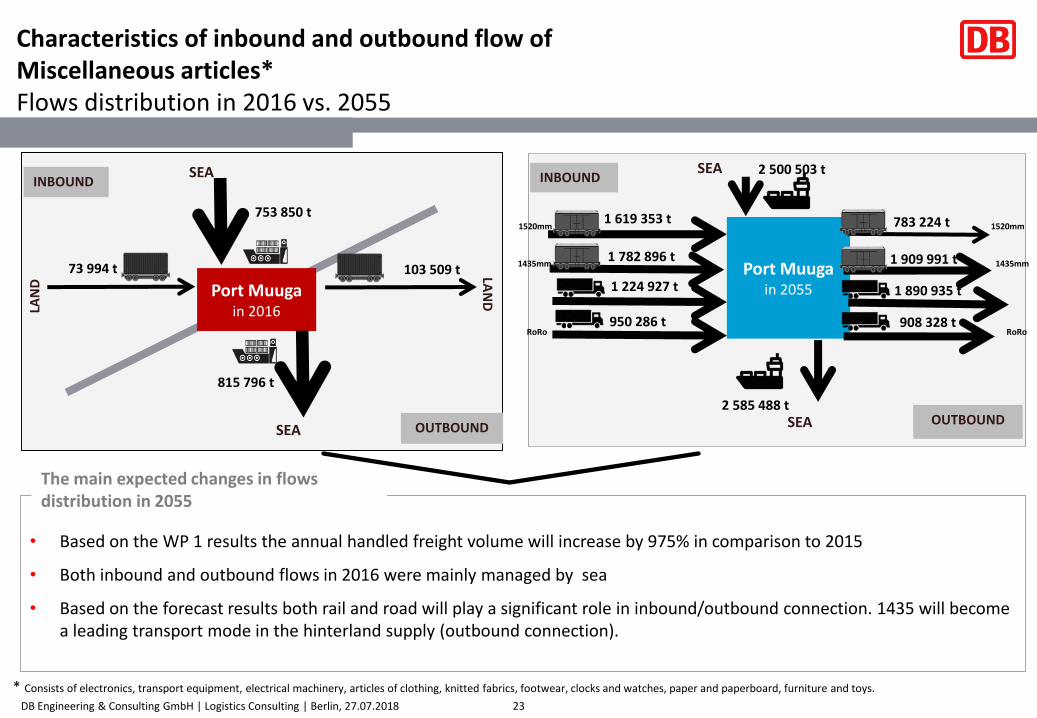
Characteristics of inbound and outbound flow ofMiscellaneous articles*Flows distribution in 2016 vs. 2055
23
* Consists of electronics, transport equipment, electrical machinery, articles of clothing, knitted fabrics, footwear, clocks and watches, paper and paperboard, furniture and toys.
INBOUND
Port Muugain 2016
OUTBOUND
LAN
D
LAN
D
SEA
SEA
753 850 t
73 994 t 103 509 t
815 796 t
• Based on the WP 1 results the annual handled freight volume will increase by 975% in comparison to 2015
• Both inbound and outbound flows in 2016 were mainly managed by sea
• Based on the forecast results both rail and road will play a significant role in inbound/outbound connection. 1435 will become a leading transport mode in the hinterland supply (outbound connection).
The main expected changes in flowsdistribution in 2055
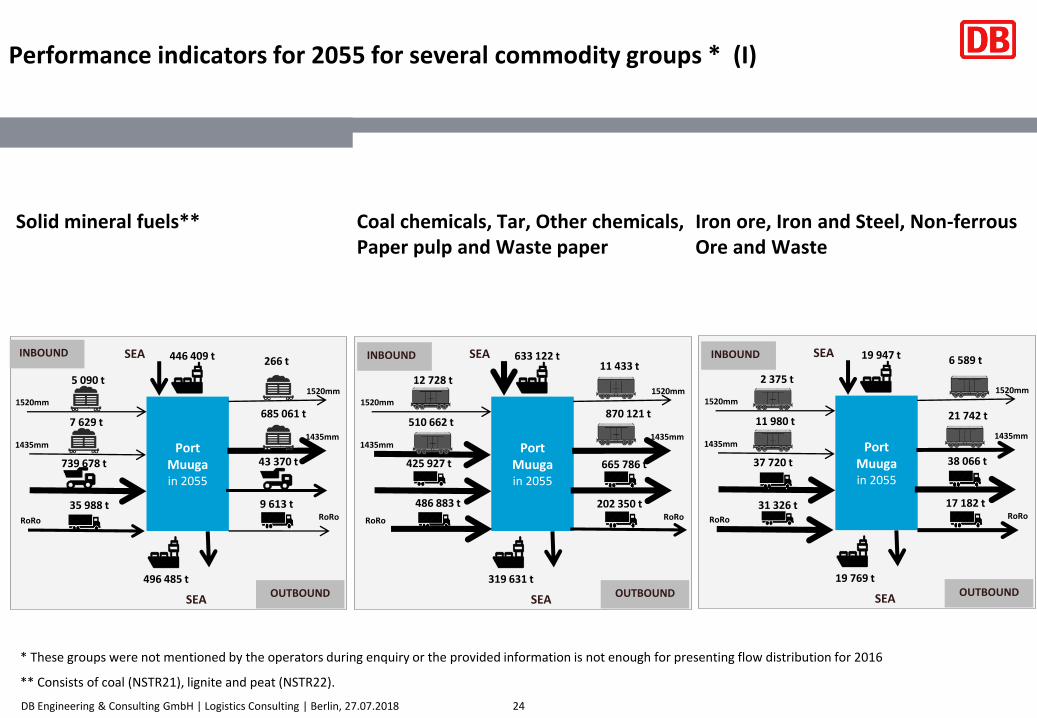
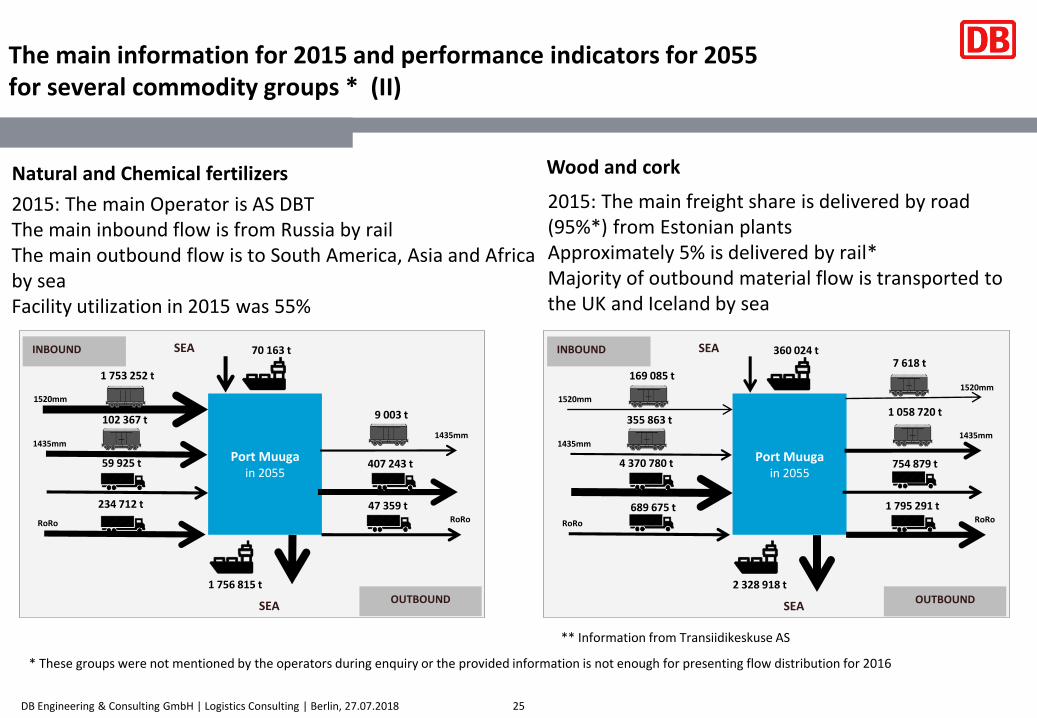
2015: The main Operator is AS DBTThe main inbound flow is from Russia by railThe main outbound flow is to South America, Asia and Africaby seaFacility utilization in 2015 was 55%
25
Natural and Chemical fertilizers
2015: The main freight share is delivered by road (95%*) from Estonian plantsApproximately 5% is delivered by rail*Majority of outbound material flow is transported to the UK and Iceland by sea
Wood and cork
** Information from Transiidikeskuse AS
INBOUND
Port Muugain 2055
OUTBOUNDSEA
SEA 360 024 t
1 795 291 t
2 328 918 t
689 675 t
355 863 t
169 085 t
1 058 720 t
7 618 t
1520mm
1435mm
4 370 780 t
RoRo RoRo
754 879 t
1520mm
1435mm
INBOUND
Port Muugain 2055
OUTBOUNDSEA
SEA 70 163 t
47 359 t
1 756 815 t
234 712 t
102 367 t
1 753 252 t
9 003 t
1435mm
59 925 t
RoRo RoRo
407 243 t
1520mm
1435mm
The main information for 2015 and performance indicators for 2055 for several commodity groups * (II)
* These groups were not mentioned by the operators during enquiry or the provided information is not enough for presenting flow distribution for 2016
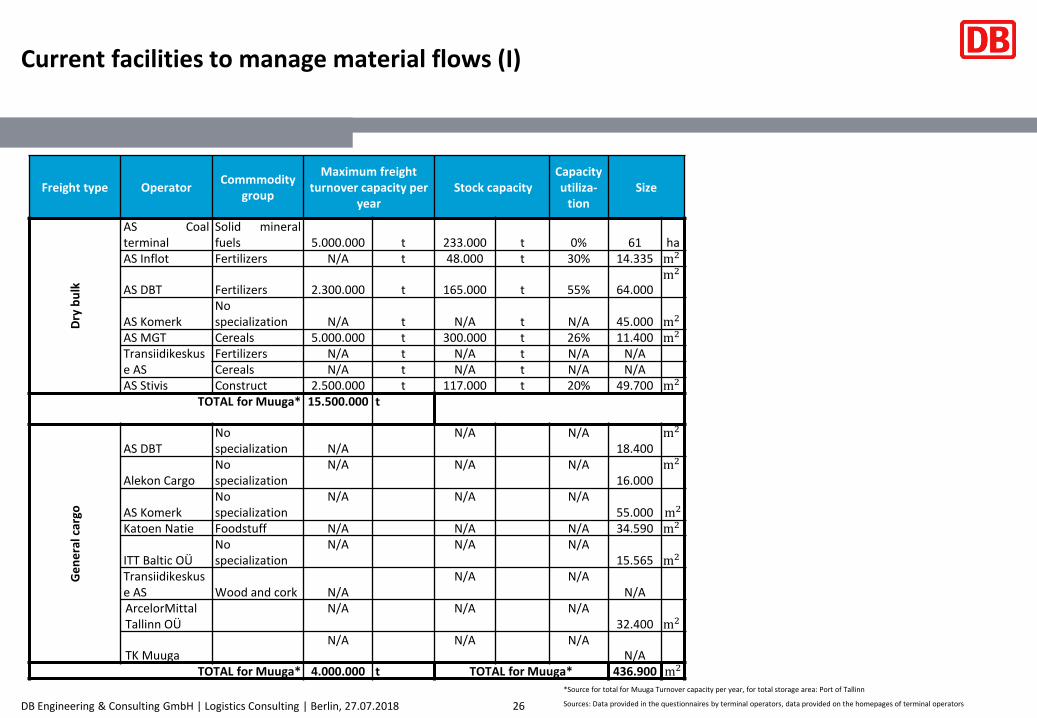
AS Inflot Fertilizers N/A t 48.000 t 30% 14.335 m2
AS DBT Fertilizers 2.300.000 t 165.000 t 55% 64.000m2
AS KomerkNospecialization N/A t N/A t N/A 45.000 m2
AS MGT Cereals 5.000.000 t 300.000 t 26% 11.400 m2
Transiidikeskuse AS
Fertilizers N/A t N/A t N/A N/ACereals N/A t N/A t N/A N/A
AS Stivis Construct 2.500.000 t 117.000 t 20% 49.700 m2
TOTAL for Muuga* 15.500.000 t
Ge
ne
ral c
argo
AS DBTNospecialization N/A
N/A N/A18.400
m2
Alekon CargoNospecialization
N/A N/A N/A16.000
m2
AS KomerkNospecialization
N/A N/A N/A55.000 m2
Katoen Natie Foodstuff N/A N/A N/A 34.590 m2
ITT Baltic OÜNospecialization
N/A N/A N/A15.565 m2
Transiidikeskuse AS Wood and cork N/A
N/A N/AN/A
ArcelorMittalTallinn OÜ
N/A N/A N/A32.400 m2
TK MuugaN/A N/A N/A
N/ATOTAL for Muuga* 4.000.000 t TOTAL for Muuga* 436.900 m2
*Source for total for Muuga Turnover capacity per year, for total storage area: Port of Tallinn
Sources: Data provided in the questionnaires by terminal operators, data provided on the homepages of terminal operatorsDB Engineering & Consulting GmbH | Logistics Consulting | Berlin, 27.07.2018
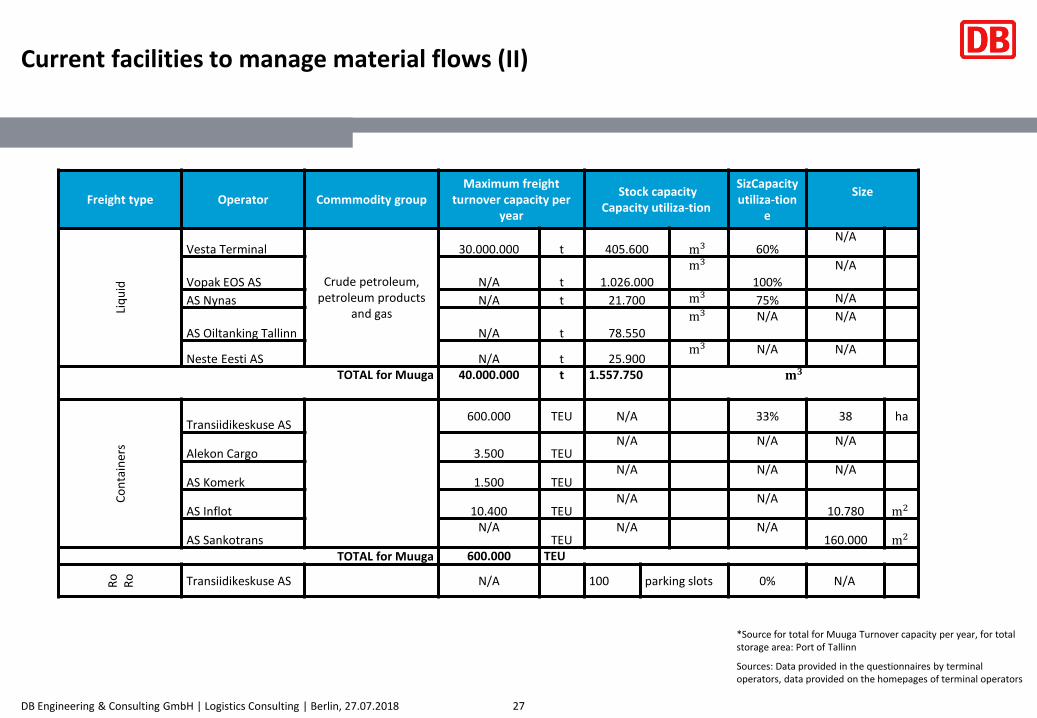
Current facilities to manage material flows (II)
27
*Source for total for Muuga Turnover capacity per year, for total storage area: Port of Tallinn
Sources: Data provided in the questionnaires by terminal operators, data provided on the homepages of terminal operators
Freight type Operator Commmodity groupMaximum freight
turnover capacity per year
Stock capacityCapacity utiliza-tion
SizCapacityutiliza-tion
e
Size
Liq
uid
Vesta Terminal
Crude petroleum, petroleum products
and gas
30.000.000 t 405.600 m3 60%N/A
Vopak EOS AS N/A t 1.026.000
m3
100%
N/A
AS Nynas N/A t 21.700 m375% N/A
AS Oiltanking Tallinn N/A t 78.550
m3 N/A N/A
Neste Eesti AS N/A t 25.900m3 N/A N/A
TOTAL for Muuga 40.000.000 t 1.557.750 𝐦𝟑
Co
nta
iner
s
Transiidikeskuse AS600.000 TEU N/A 33% 38 ha
Alekon Cargo 3.500 TEUN/A N/A N/A
AS Komerk 1.500 TEUN/A N/A N/A
AS Inflot 10.400 TEUN/A N/A
10.780 m2
AS SankotransN/A
TEUN/A N/A
160.000 m2
TOTAL for Muuga 600.000 TEU
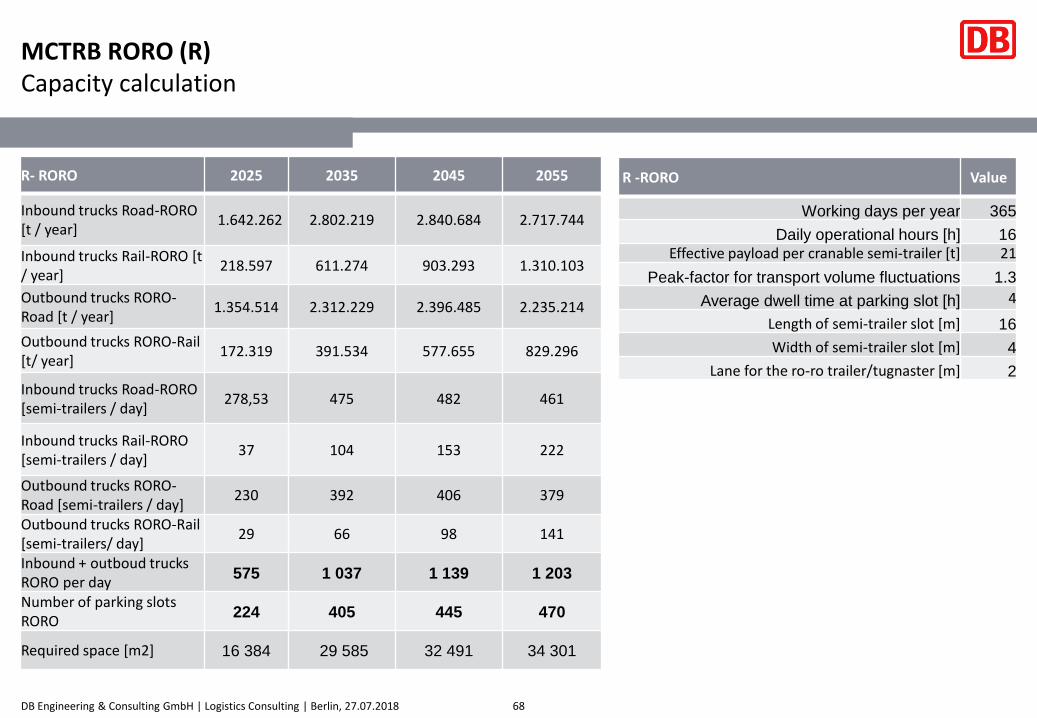
Ro
Ro Transiidikeskuse AS N/A 100 parking slots 0% N/A
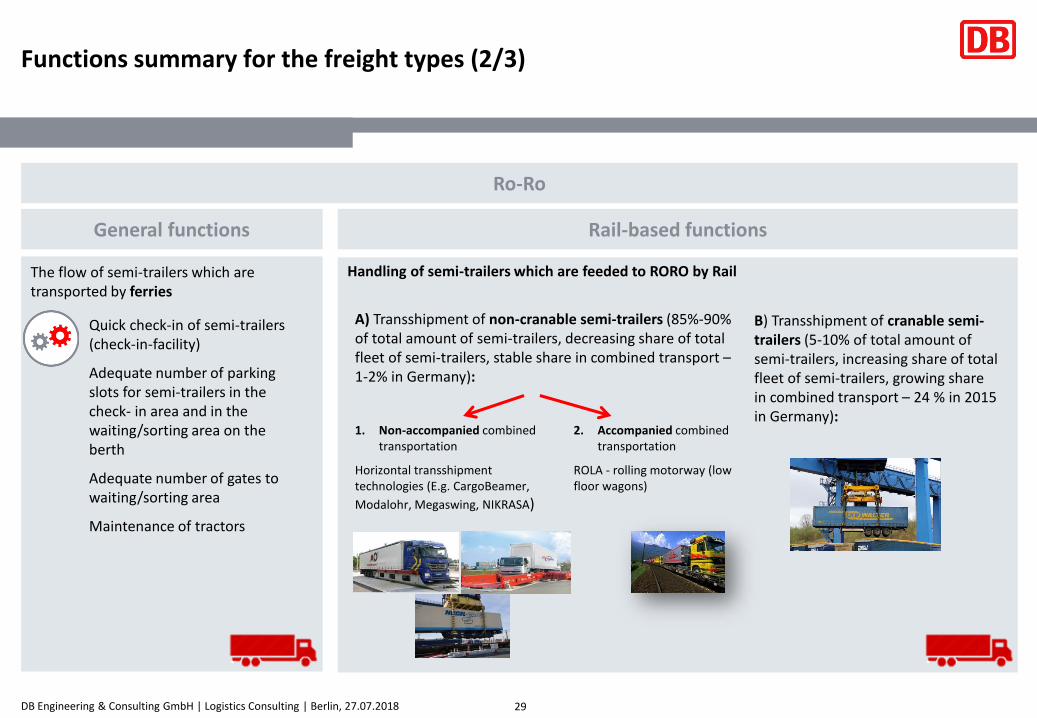
The flow of semi-trailers which are transported by ferries
Handling of semi-trailers which are feeded to RORO by Rail
Quick check-in of semi-trailers (check-in-facility)
Adequate number of parking slots for semi-trailers in the check- in area and in the waiting/sorting area on the berth
Adequate number of gates to waiting/sorting area
Maintenance of tractors
B) Transshipment of cranable semi-trailers (5-10% of total amount of semi-trailers, increasing share of total fleet of semi-trailers, growing share in combined transport – 24 % in 2015 in Germany):
A) Transshipment of non-cranable semi-trailers (85%-90% of total amount of semi-trailers, decreasing share of total fleet of semi-trailers, stable share in combined transport –1-2% in Germany):
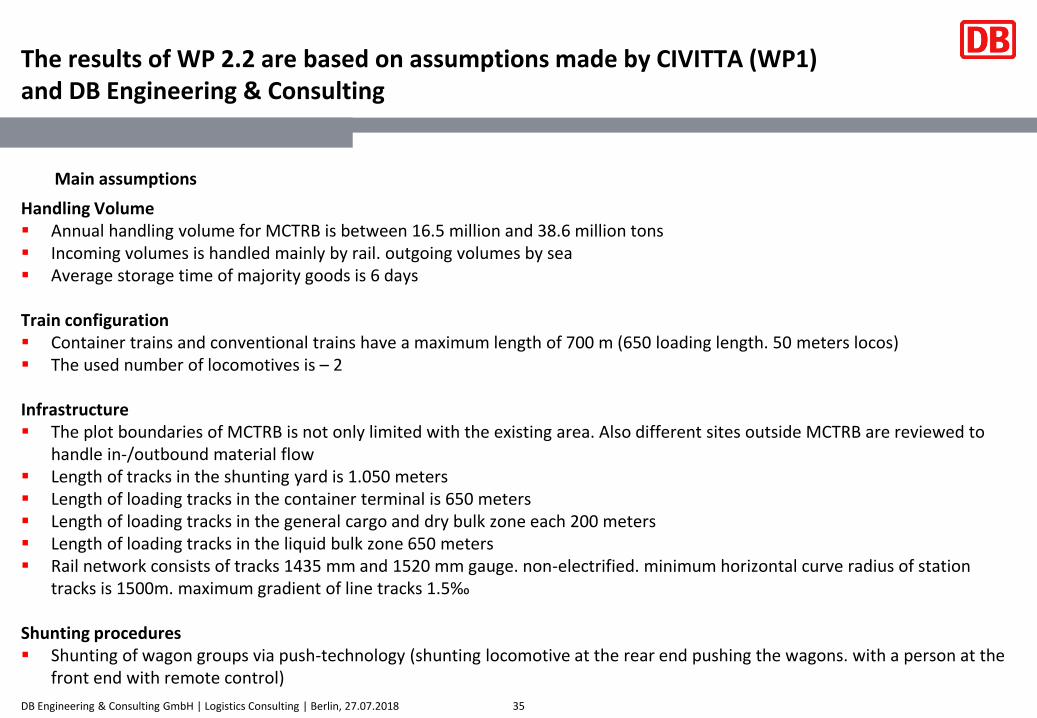
The results of WP 2.2 are based on assumptions made by CIVITTA (WP1) and DB Engineering & Consulting
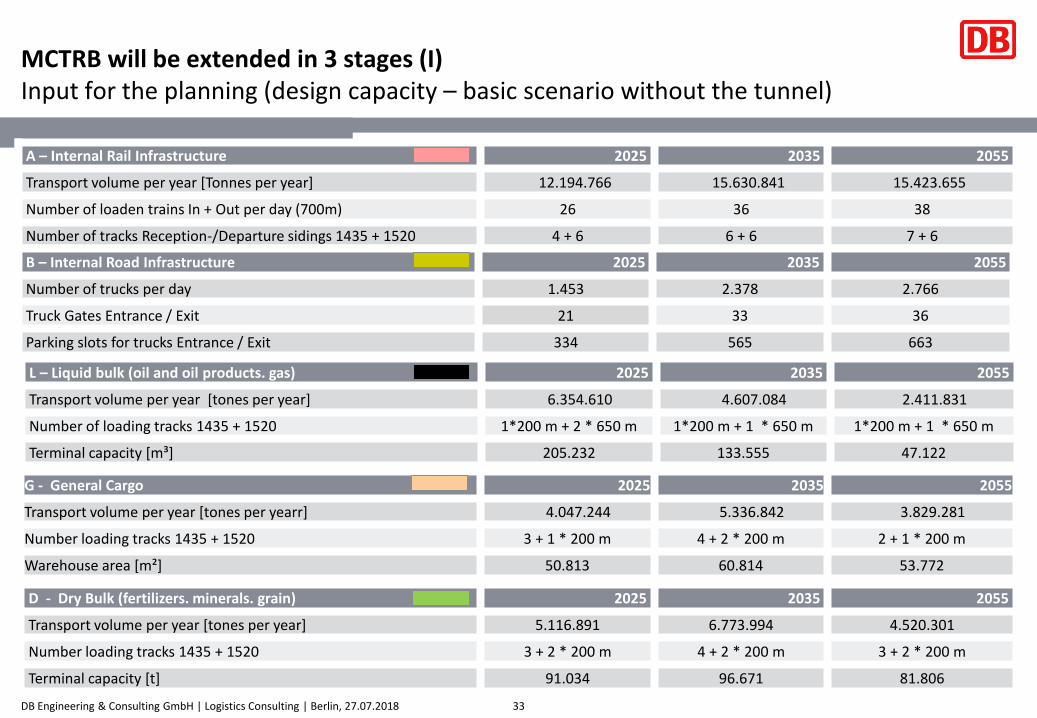
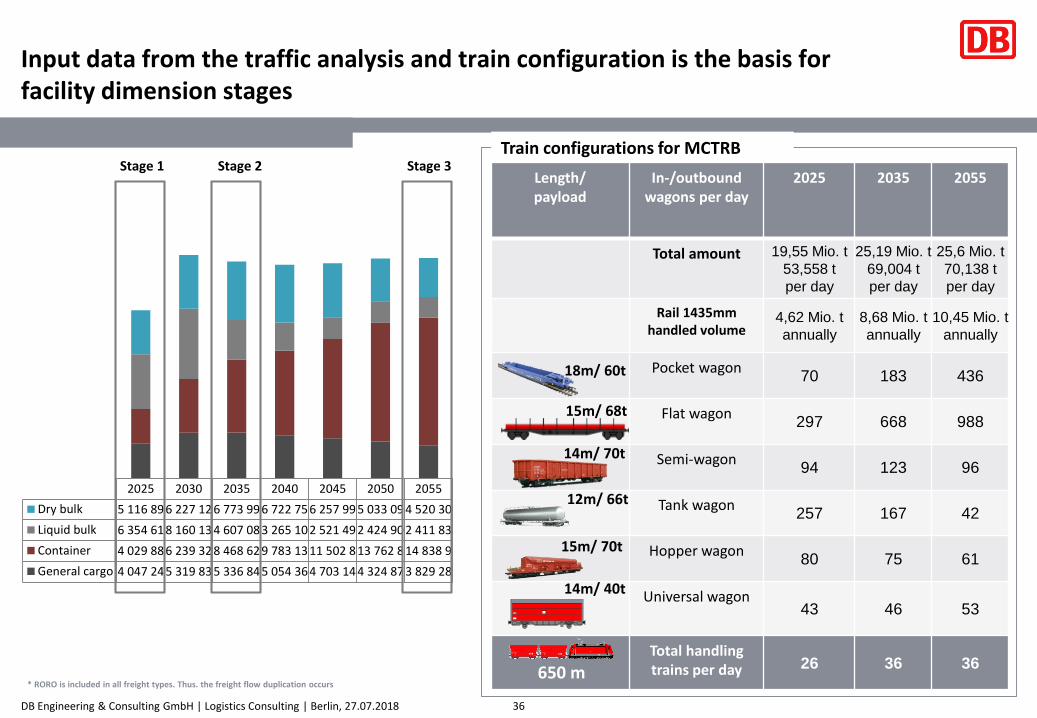
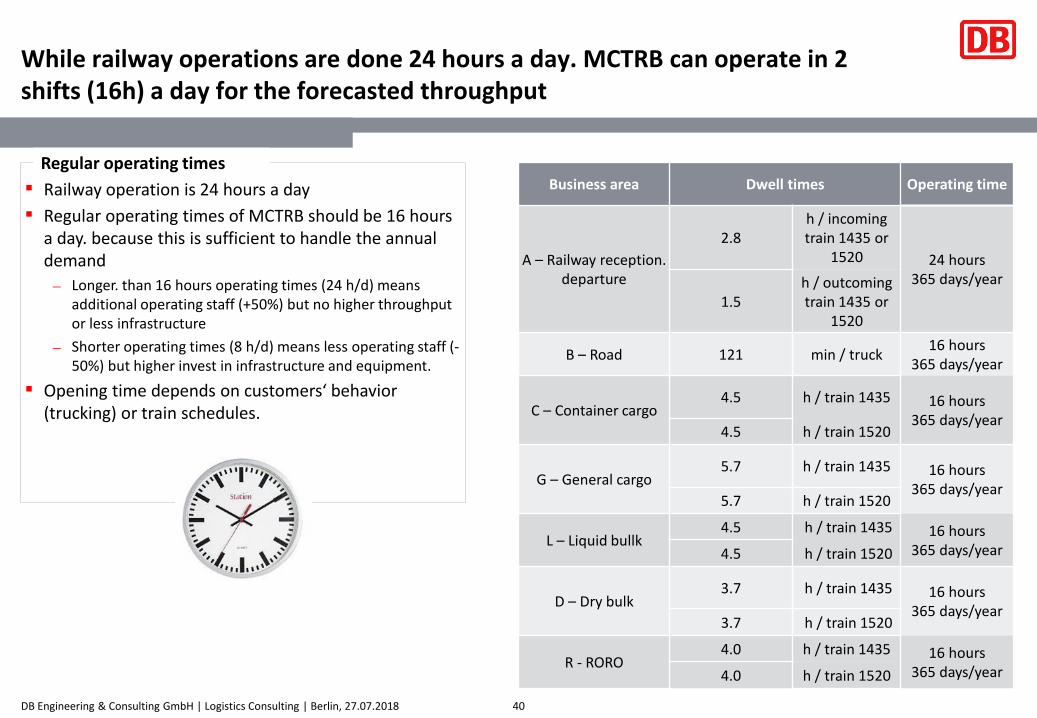
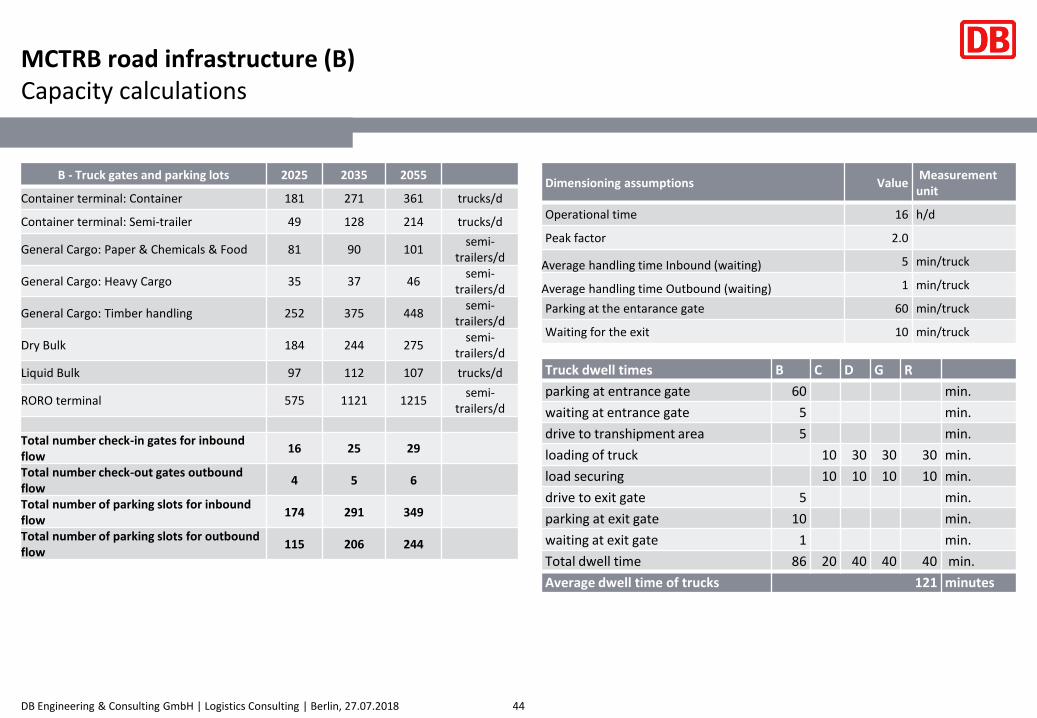
Handling Volume▪ Annual handling volume for MCTRB is between 16.5 million and 38.6 million tons▪ Incoming volumes is handled mainly by rail. outgoing volumes by sea▪ Average storage time of majority goods is 6 days
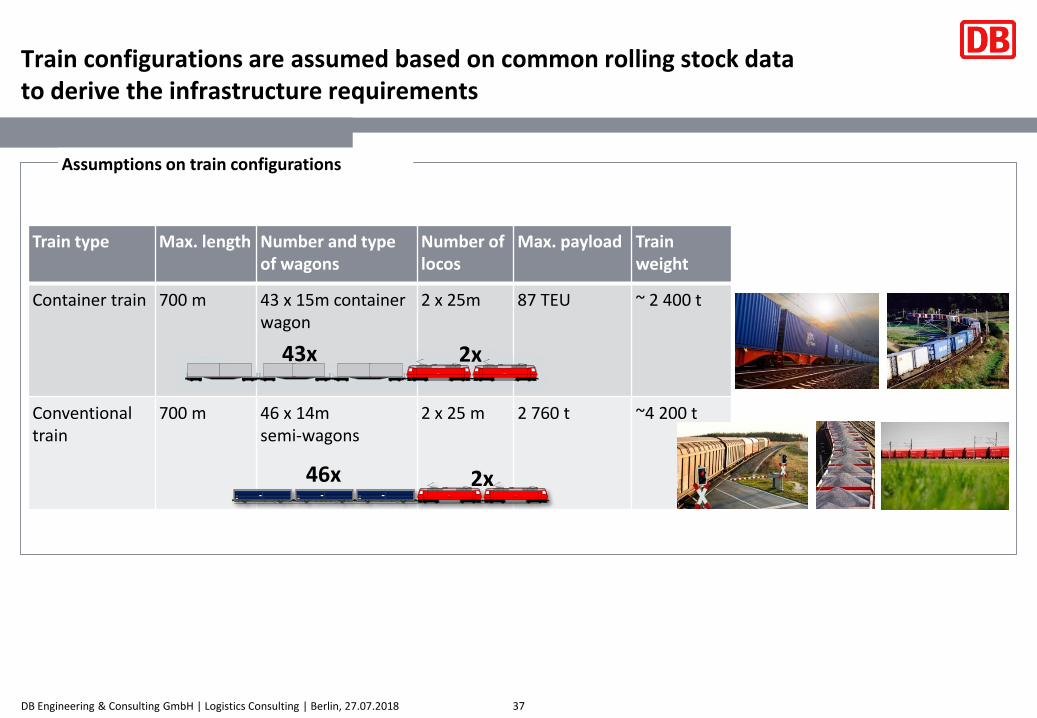
Train configuration▪ Container trains and conventional trains have a maximum length of 700 m (650 loading length. 50 meters locos)▪ The used number of locomotives is – 2
Infrastructure▪ The plot boundaries of MCTRB is not only limited with the existing area. Also different sites outside MCTRB are reviewed to
handle in-/outbound material flow▪ Length of tracks in the shunting yard is 1.050 meters▪ Length of loading tracks in the container terminal is 650 meters▪ Length of loading tracks in the general cargo and dry bulk zone each 200 meters▪ Length of loading tracks in the liquid bulk zone 650 meters▪ Rail network consists of tracks 1435 mm and 1520 mm gauge. non-electrified. minimum horizontal curve radius of station
tracks is 1500m. maximum gradient of line tracks 1.5‰
Shunting procedures▪ Shunting of wagon groups via push-technology (shunting locomotive at the rear end pushing the wagons. with a person at the
▪ TK is concentrated on export. import. RO-RO flows only (containers+semi-trailers) (tracks: 2x1435 and 2x1520)
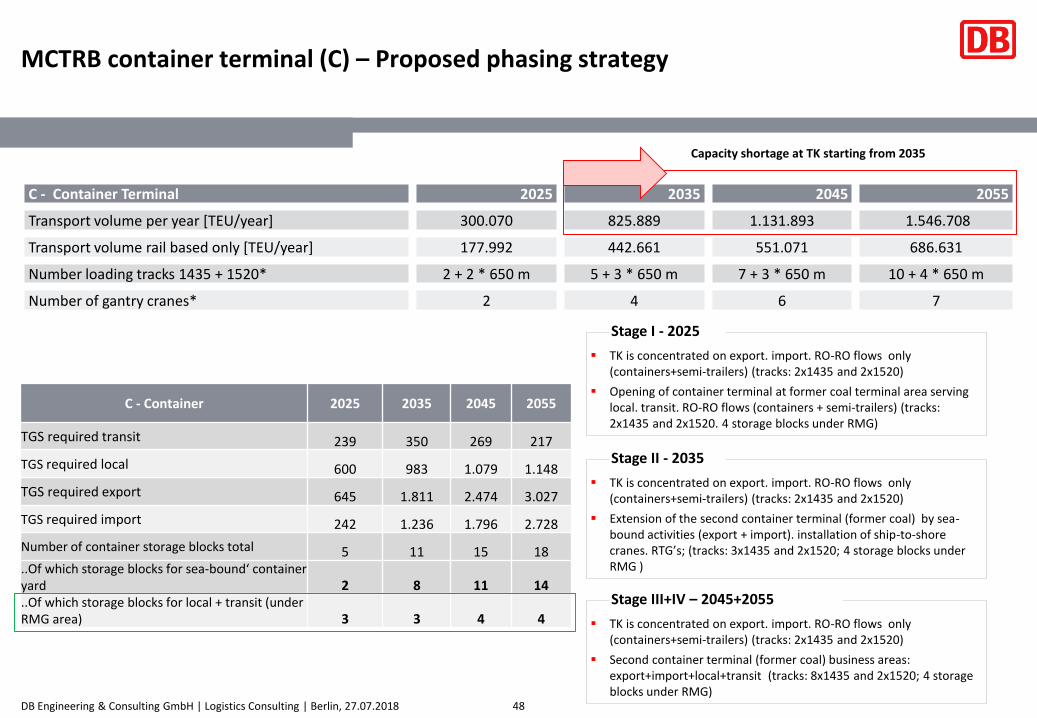
▪ Second container terminal (former coal) business areas: export+import+local+transit (tracks: 8x1435 and 2x1520; 4 storage blocks under RMG)
Stage III+IV – 2045+2055
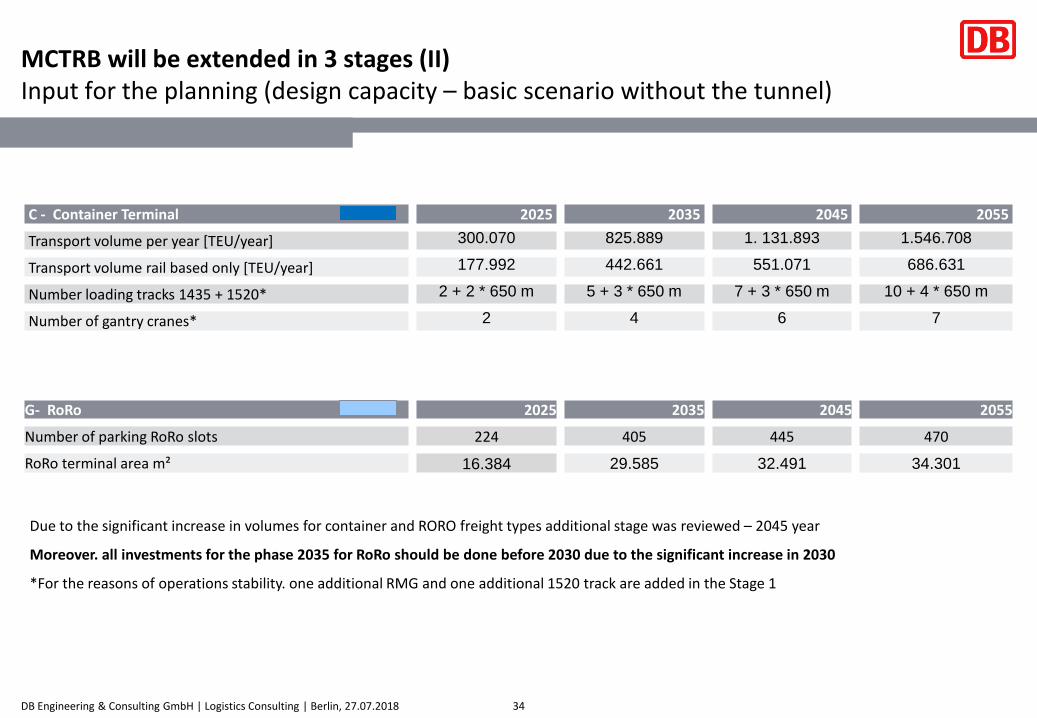
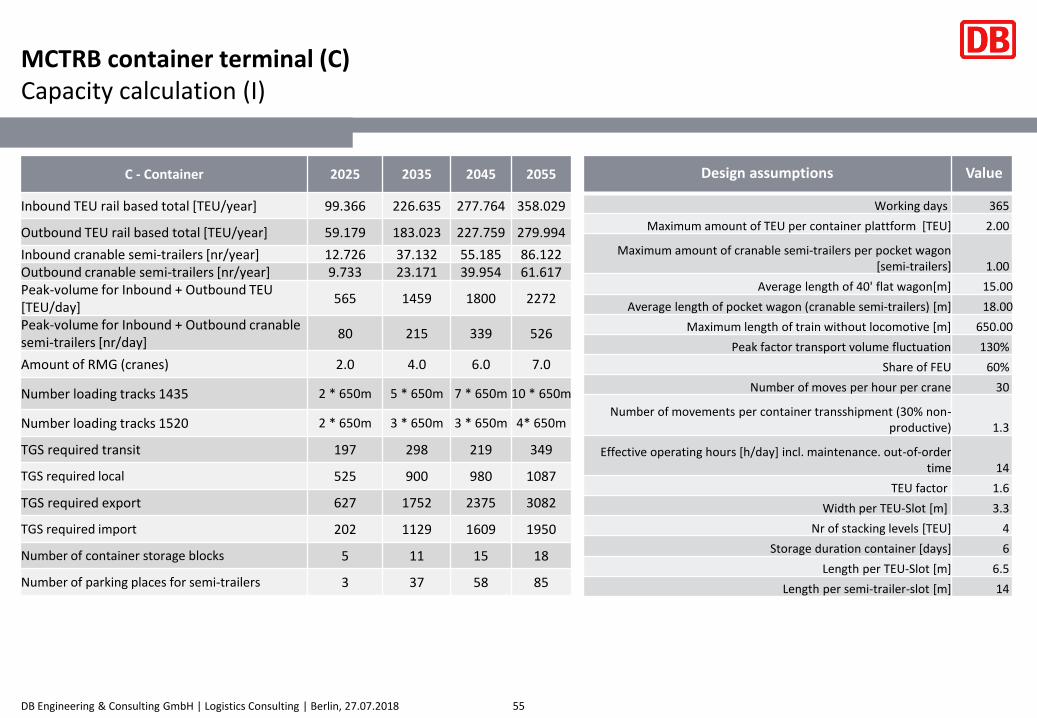
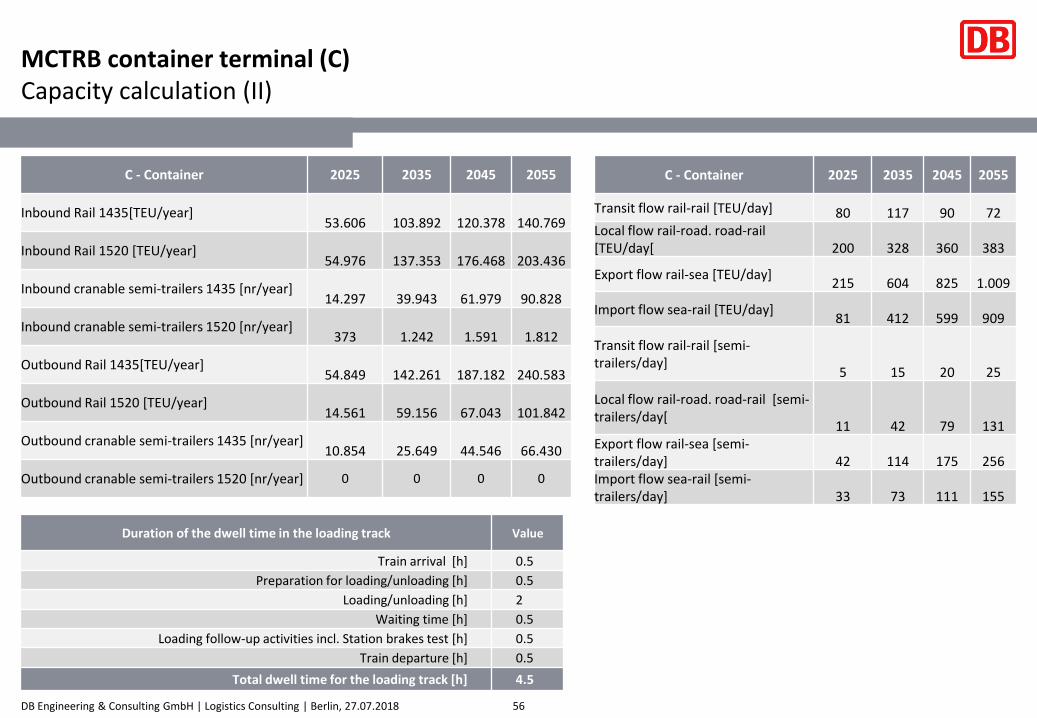
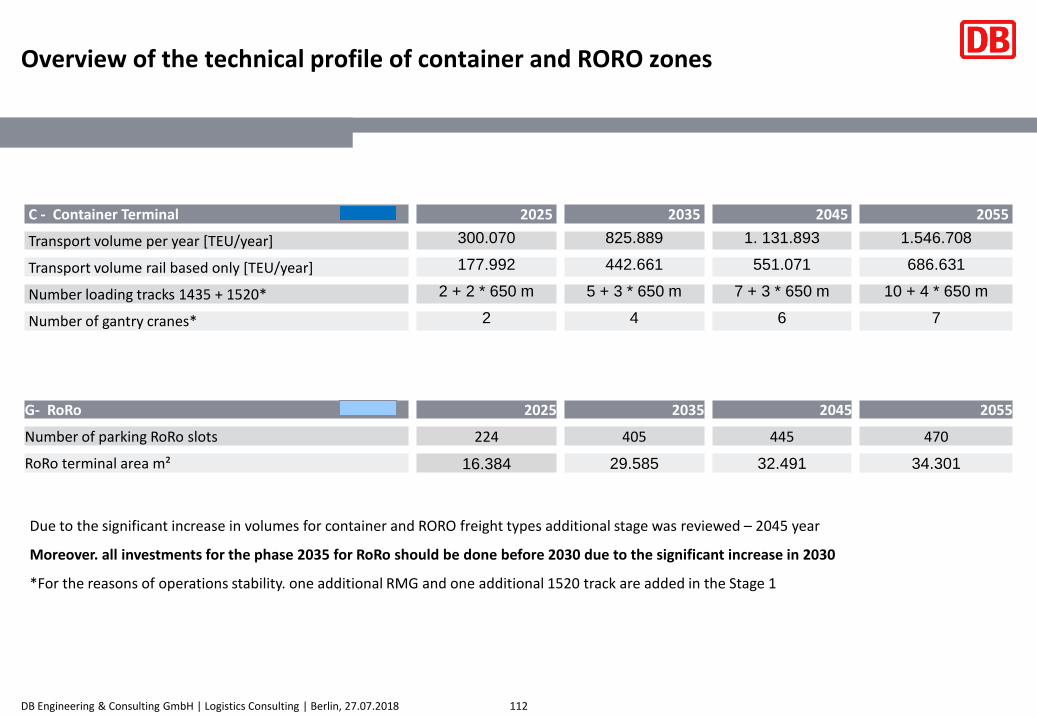
C - Container Terminal 2025 2035 2045 2055
Transport volume per year [TEU/year] 300.070 825.889 1.131.893 1.546.708
Transport volume rail based only [TEU/year] 177.992 442.661 551.071 686.631
Number loading tracks 1435 + 1520* 2 + 2 * 650 m 5 + 3 * 650 m 7 + 3 * 650 m 10 + 4 * 650 m
Number of gantry cranes* 2 4 6 7
C - Container 2025 2035 2045 2055
TGS required transit 239 350 269 217
TGS required local 600 983 1.079 1.148
TGS required export 645 1.811 2.474 3.027
TGS required import 242 1.236 1.796 2.728
Number of container storage blocks total 5 11 15 18..Of which storage blocks for sea-bound‘ containeryard 2 8 11 14..Of which storage blocks for local + transit (underRMG area) 3 3 4 4
Capacity shortage at TK starting from 2035
▪ TK is concentrated on export. import. RO-RO flows only (containers+semi-trailers) (tracks: 2x1435 and 2x1520)
▪ Opening of container terminal at former coal terminal area serving local. transit. RO-RO flows (containers + semi-trailers) (tracks: 2x1435 and 2x1520. 4 storage blocks under RMG)
Stage I - 2025
▪ TK is concentrated on export. import. RO-RO flows only (containers+semi-trailers) (tracks: 2x1435 and 2x1520)
▪ Extension of the second container terminal (former coal) by sea-bound activities (export + import). installation of ship-to-shore cranes. RTG’s; (tracks: 3x1435 and 2x1520; 4 storage blocks under RMG )
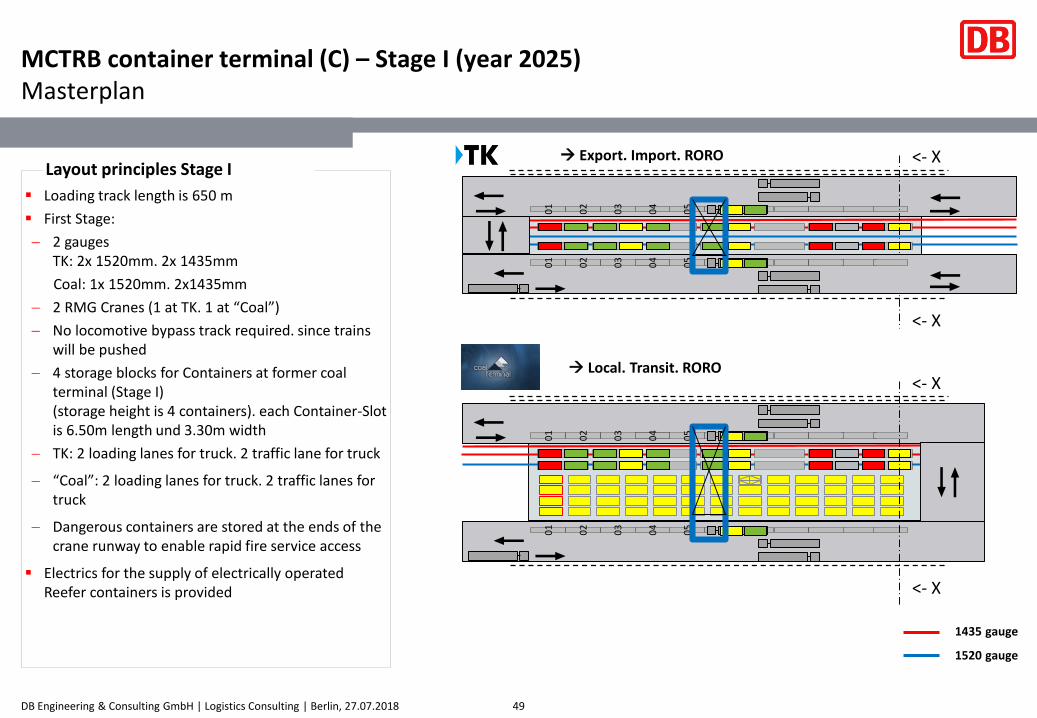
MCTRB container terminal (C) – Stage I (year 2025)Masterplan
49
▪ Loading track length is 650 m
▪ First Stage:
2 gauges TK: 2x 1520mm. 2x 1435mm
Coal: 1x 1520mm. 2x1435mm
2 RMG Cranes (1 at TK. 1 at “Coal”)
No locomotive bypass track required. since trains will be pushed
4 storage blocks for Containers at former coal terminal (Stage I) (storage height is 4 containers). each Container-Slot is 6.50m length und 3.30m width
TK: 2 loading lanes for truck. 2 traffic lane for truck
“Coal”: 2 loading lanes for truck. 2 traffic lanes for truck
Dangerous containers are stored at the ends of the crane runway to enable rapid fire service access
▪ Electrics for the supply of electrically operated Reefer containers is provided
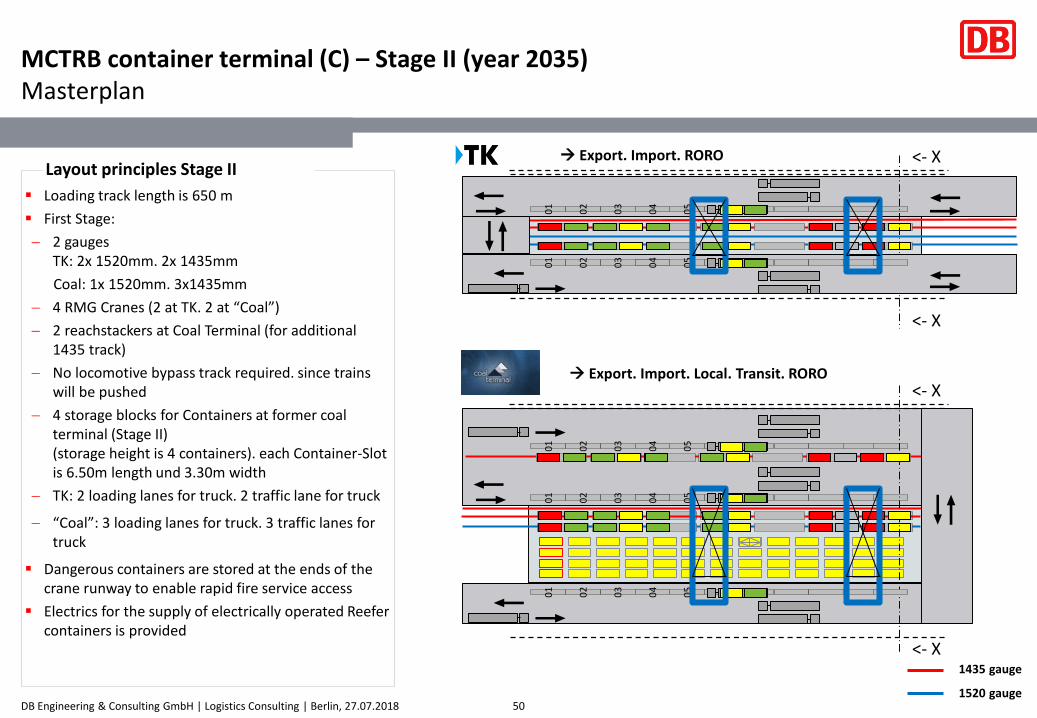
MCTRB container terminal (C) – Stage II (year 2035)Masterplan
50
▪ Loading track length is 650 m
▪ First Stage:
2 gauges TK: 2x 1520mm. 2x 1435mm
Coal: 1x 1520mm. 3x1435mm
4 RMG Cranes (2 at TK. 2 at “Coal”)
2 reachstackers at Coal Terminal (for additional 1435 track)
No locomotive bypass track required. since trains will be pushed
4 storage blocks for Containers at former coal terminal (Stage II) (storage height is 4 containers). each Container-Slot is 6.50m length und 3.30m width
TK: 2 loading lanes for truck. 2 traffic lane for truck
“Coal”: 3 loading lanes for truck. 3 traffic lanes for truck
▪ Dangerous containers are stored at the ends of the crane runway to enable rapid fire service access
▪ Electrics for the supply of electrically operated Reefer containers is provided
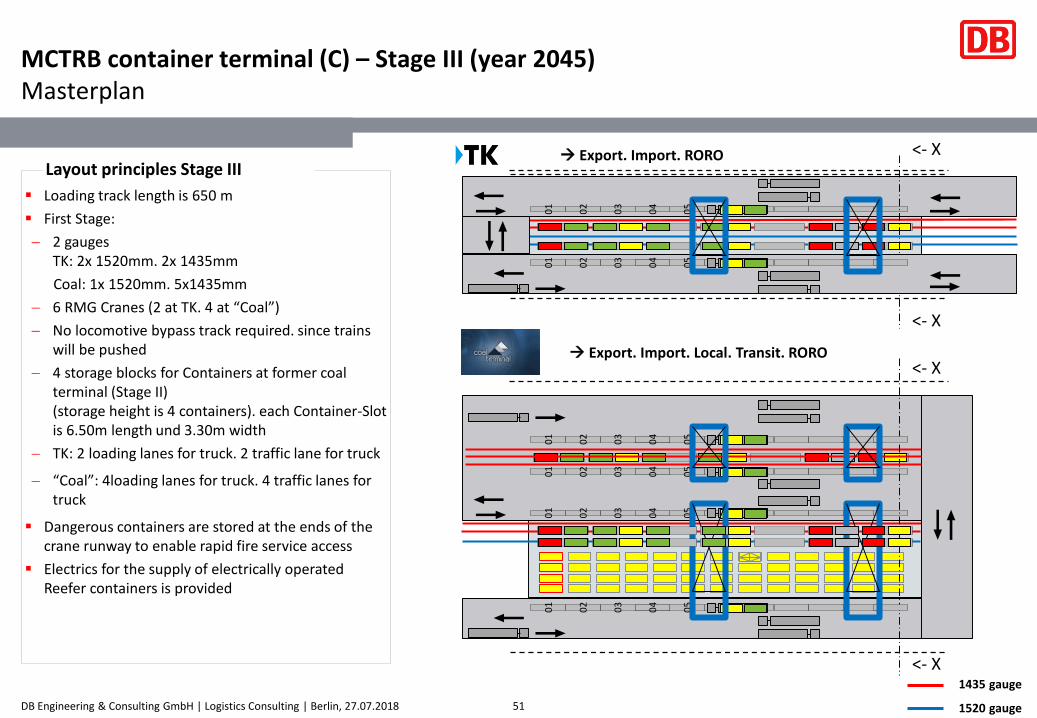
MCTRB container terminal (C) – Stage III (year 2045)Masterplan
51
▪ Loading track length is 650 m
▪ First Stage:
2 gauges TK: 2x 1520mm. 2x 1435mm
Coal: 1x 1520mm. 5x1435mm
6 RMG Cranes (2 at TK. 4 at “Coal”)
No locomotive bypass track required. since trains will be pushed
4 storage blocks for Containers at former coal terminal (Stage II) (storage height is 4 containers). each Container-Slot is 6.50m length und 3.30m width
TK: 2 loading lanes for truck. 2 traffic lane for truck
“Coal”: 4loading lanes for truck. 4 traffic lanes for truck
▪ Dangerous containers are stored at the ends of the crane runway to enable rapid fire service access
▪ Electrics for the supply of electrically operated Reefer containers is provided
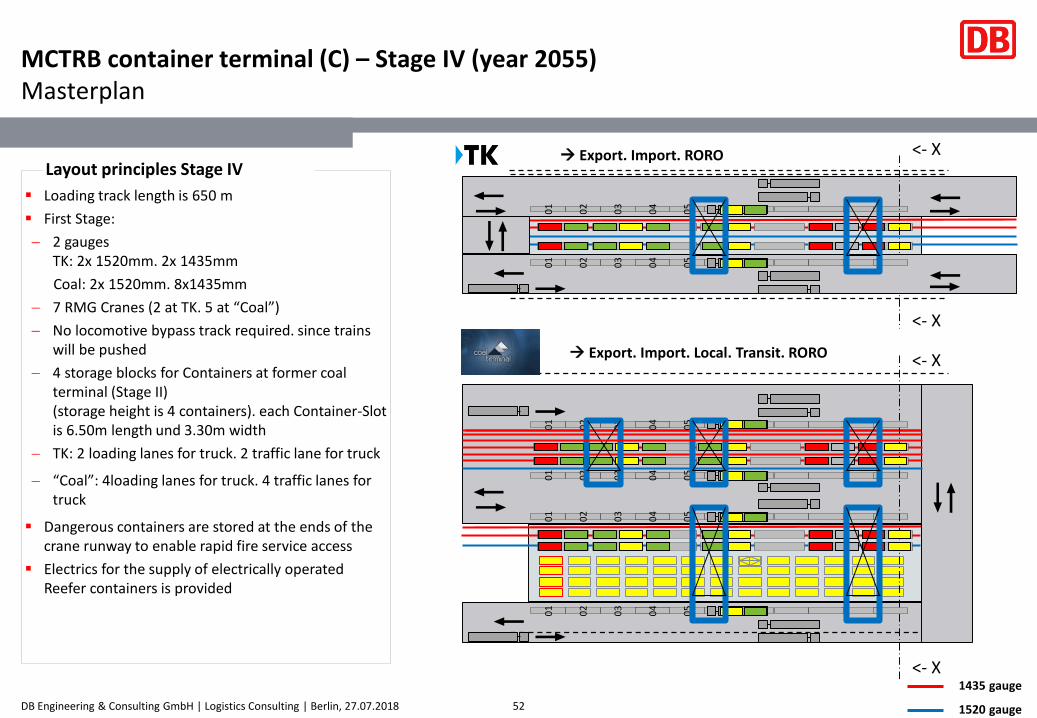
MCTRB container terminal (C) – Stage IV (year 2055)Masterplan
52
▪ Loading track length is 650 m
▪ First Stage:
2 gauges TK: 2x 1520mm. 2x 1435mm
Coal: 2x 1520mm. 8x1435mm
7 RMG Cranes (2 at TK. 5 at “Coal”)
No locomotive bypass track required. since trains will be pushed
4 storage blocks for Containers at former coal terminal (Stage II) (storage height is 4 containers). each Container-Slot is 6.50m length und 3.30m width
TK: 2 loading lanes for truck. 2 traffic lane for truck
“Coal”: 4loading lanes for truck. 4 traffic lanes for truck
▪ Dangerous containers are stored at the ends of the crane runway to enable rapid fire service access
▪ Electrics for the supply of electrically operated Reefer containers is provided
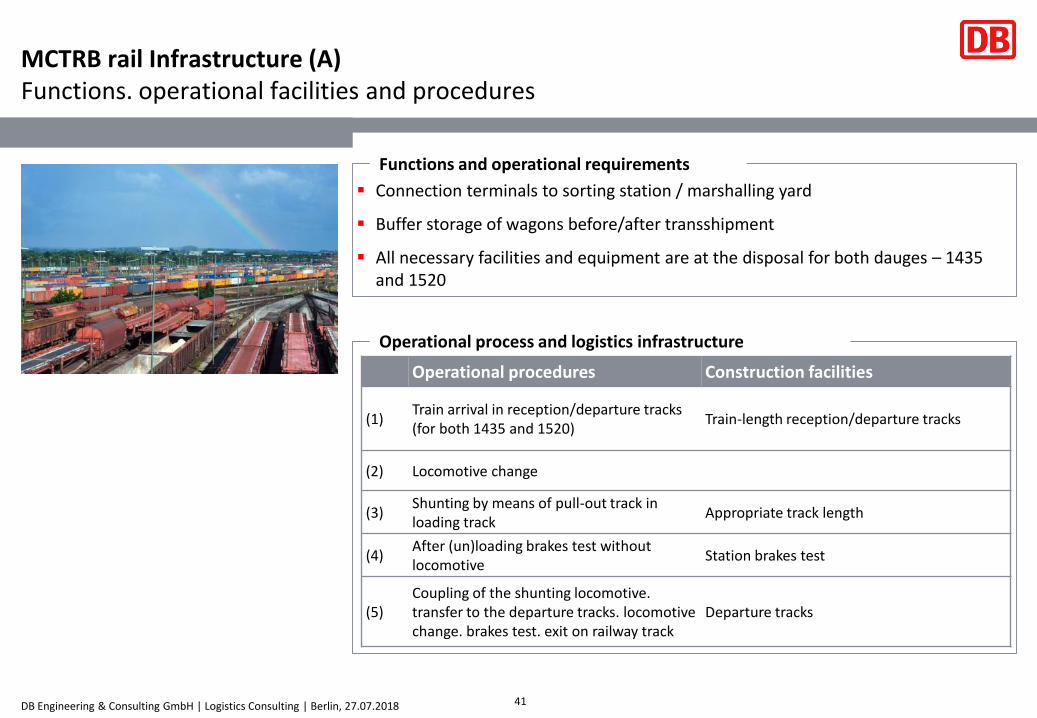
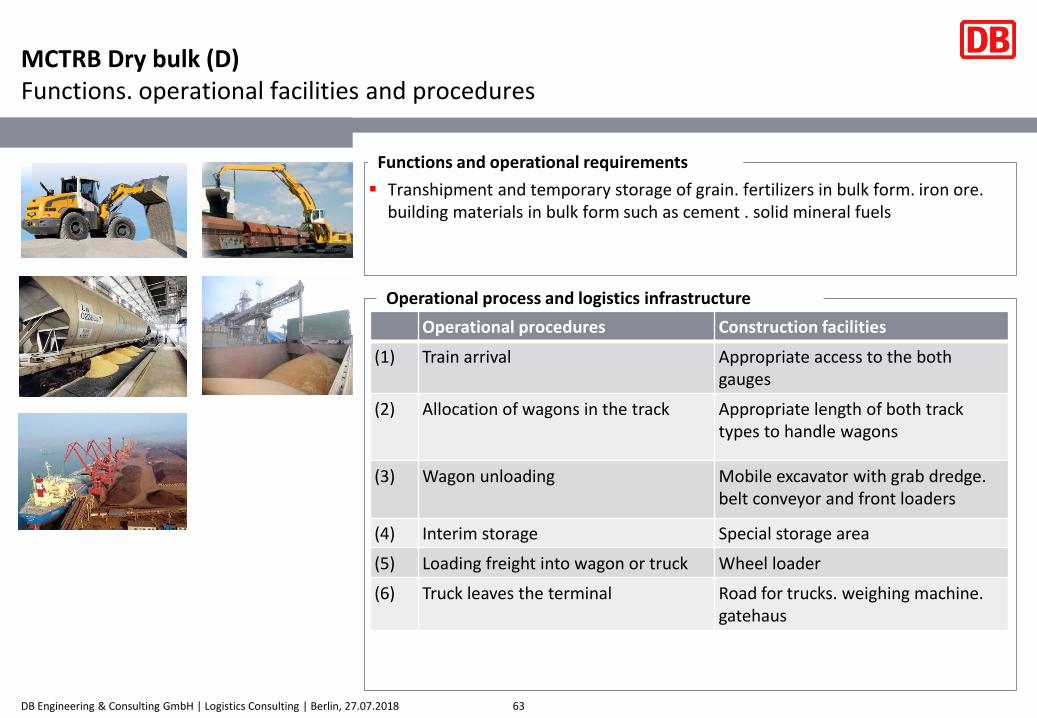
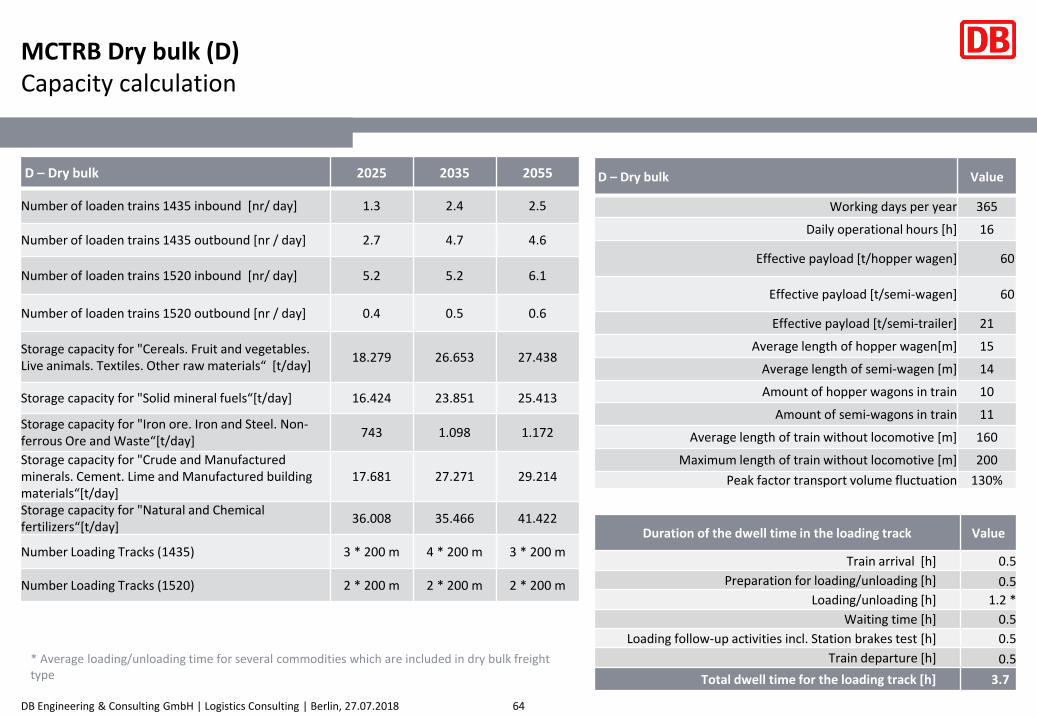
MCTRB Dry bulk (D)Functions. operational facilities and procedures
▪ Transhipment and temporary storage of grain. fertilizers in bulk form. iron ore. building materials in bulk form such as cement . solid mineral fuels
63
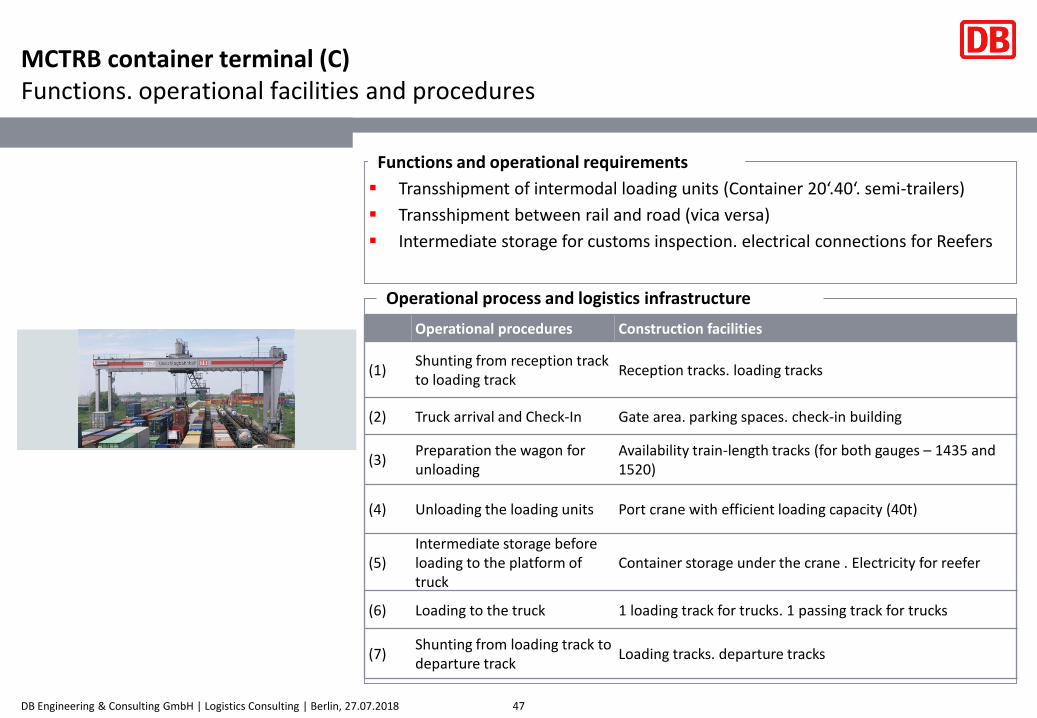
Functions and operational requirements
Operational process and logistics infrastructure
Operational procedures Construction facilities
(1) Train arrival Appropriate access to the bothgauges
(2) Allocation of wagons in the track Appropriate length of both tracktypes to handle wagons
(3) Wagon unloading Mobile excavator with grab dredge. belt conveyor and front loaders
(4) Interim storage Special storage area
(5) Loading freight into wagon or truck Wheel loader
(6) Truck leaves the terminal Road for trucks. weighing machine. gatehaus
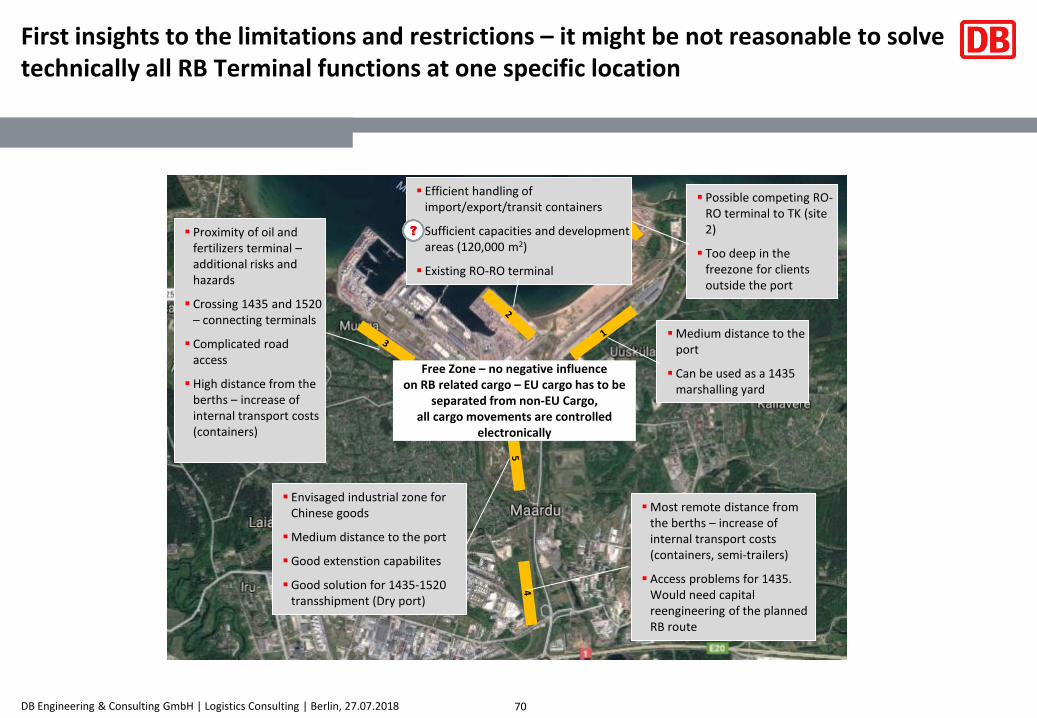
First insights to the limitations and restrictions – it might be not reasonable to solve technically all RB Terminal functions at one specific location
70
▪ Proximity of oil andfertilizers terminal –additional risks andhazards
▪ Crossing 1435 and 1520 – connecting terminals
▪ Complicated roadaccess
▪ High distance from theberths – increase ofinternal transport costs(containers)
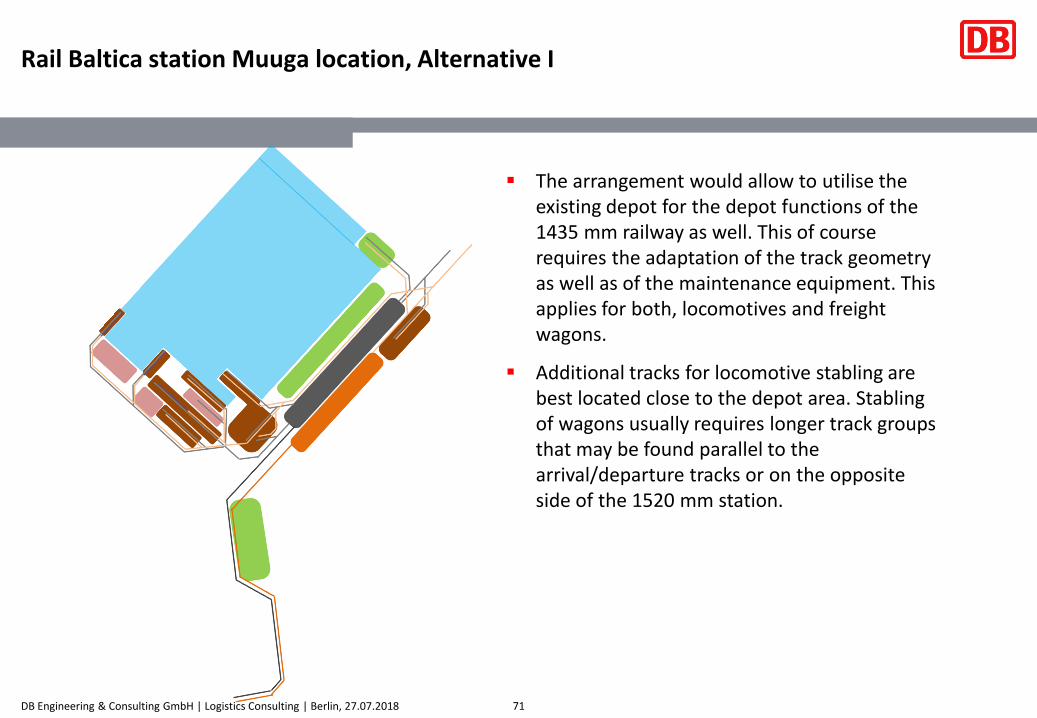
Rail Baltica station Muuga location, Alternative I
71
▪ The arrangement would allow to utilise the existing depot for the depot functions of the 1435 mm railway as well. This of course requires the adaptation of the track geometry as well as of the maintenance equipment. This applies for both, locomotives and freight wagons.
▪ Additional tracks for locomotive stabling are best located close to the depot area. Stabling of wagons usually requires longer track groups that may be found parallel to the arrival/departure tracks or on the opposite side of the 1520 mm station.
Rail Baltica station Muuga location, Alternative II
72
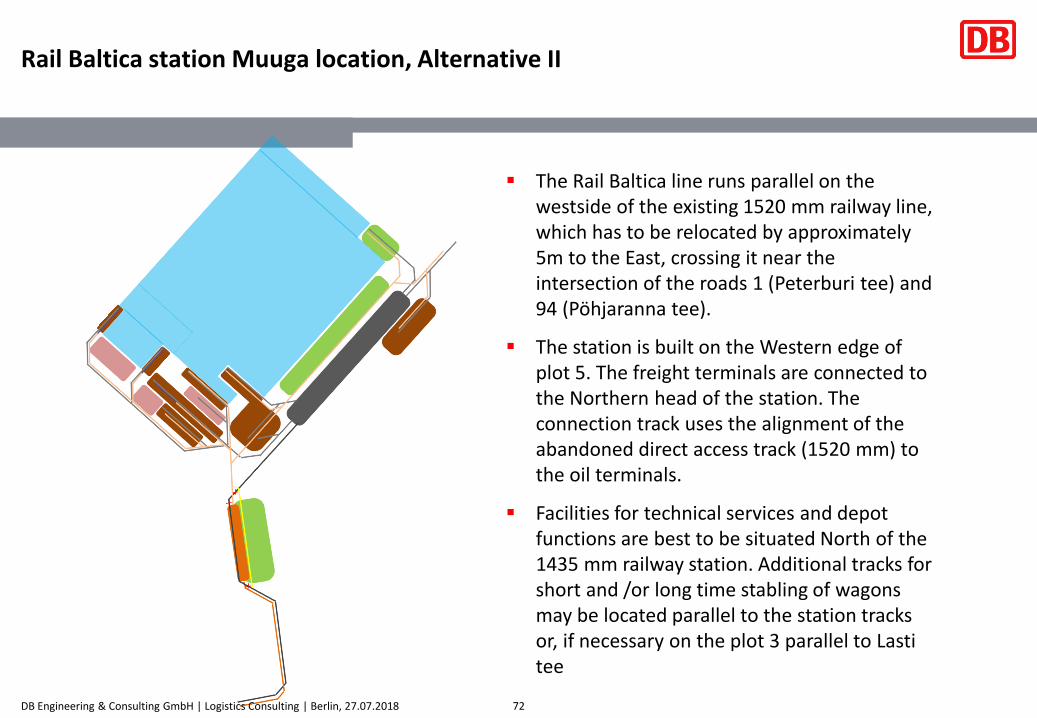
▪ The Rail Baltica line runs parallel on the westside of the existing 1520 mm railway line, which has to be relocated by approximately 5m to the East, crossing it near the intersection of the roads 1 (Peterburi tee) and 94 (Pöhjaranna tee).
▪ The station is built on the Western edge of plot 5. The freight terminals are connected to the Northern head of the station. The connection track uses the alignment of the abandoned direct access track (1520 mm) to the oil terminals.
▪ Facilities for technical services and depot functions are best to be situated North of the 1435 mm railway station. Additional tracks for short and /or long time stabling of wagons may be located parallel to the station tracks or, if necessary on the plot 3 parallel to Lastitee
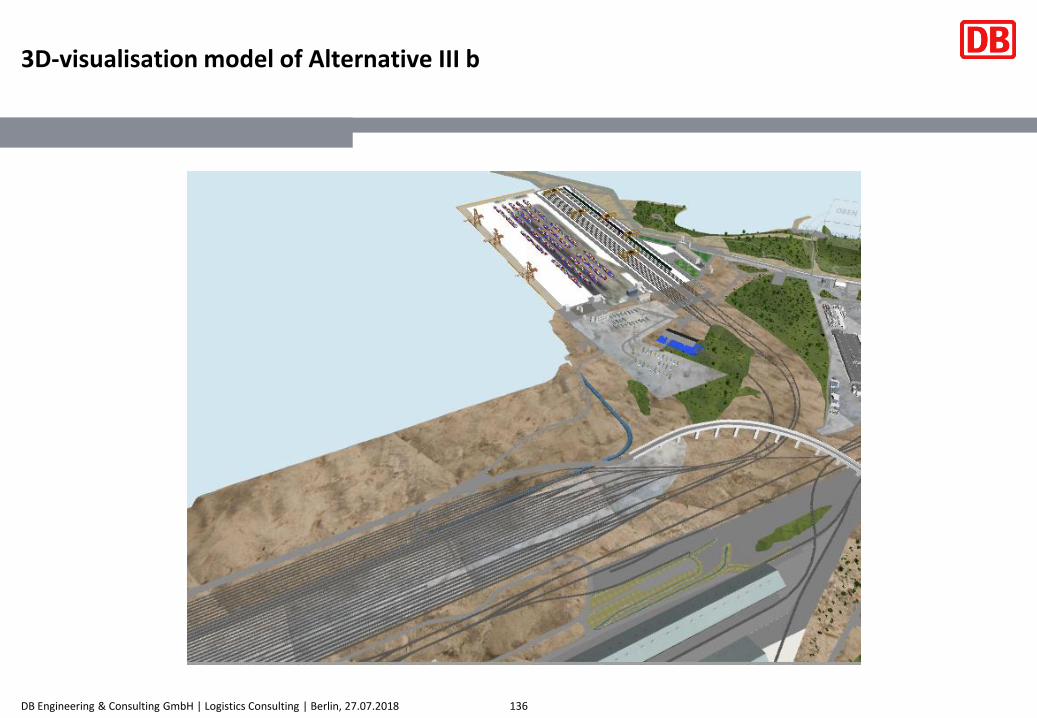
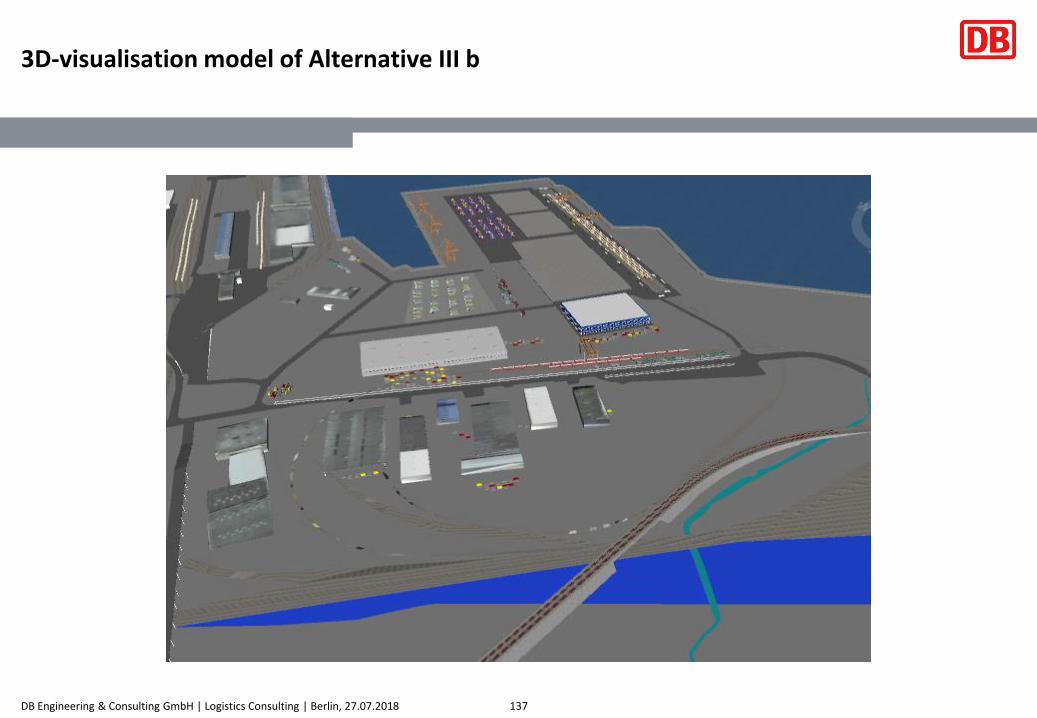
Rail Baltica station Muuga location, Alternative III
73
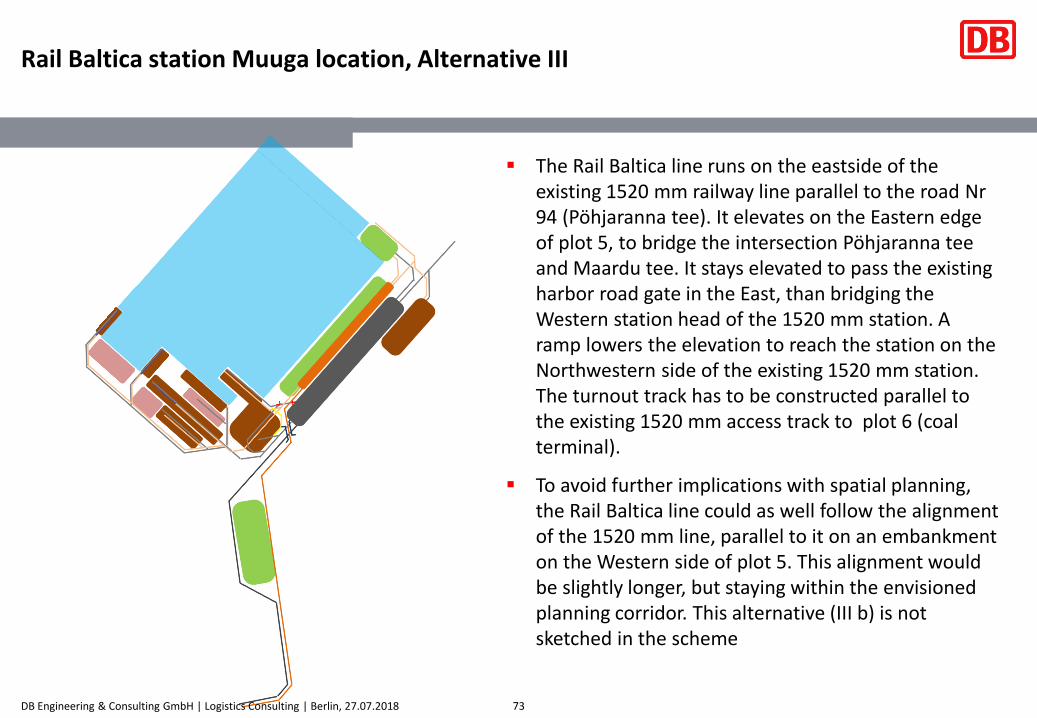
▪ The Rail Baltica line runs on the eastside of the existing 1520 mm railway line parallel to the road Nr94 (Pöhjaranna tee). It elevates on the Eastern edge of plot 5, to bridge the intersection Pöhjaranna tee and Maardu tee. It stays elevated to pass the existing harbor road gate in the East, than bridging the Western station head of the 1520 mm station. A ramp lowers the elevation to reach the station on the Northwestern side of the existing 1520 mm station. The turnout track has to be constructed parallel to the existing 1520 mm access track to plot 6 (coal terminal).
▪ To avoid further implications with spatial planning, the Rail Baltica line could as well follow the alignment of the 1520 mm line, parallel to it on an embankment on the Western side of plot 5. This alignment would be slightly longer, but staying within the envisioned planning corridor. This alternative (III b) is not sketched in the scheme
Rail Baltica station Muuga location, Alternative IV
74
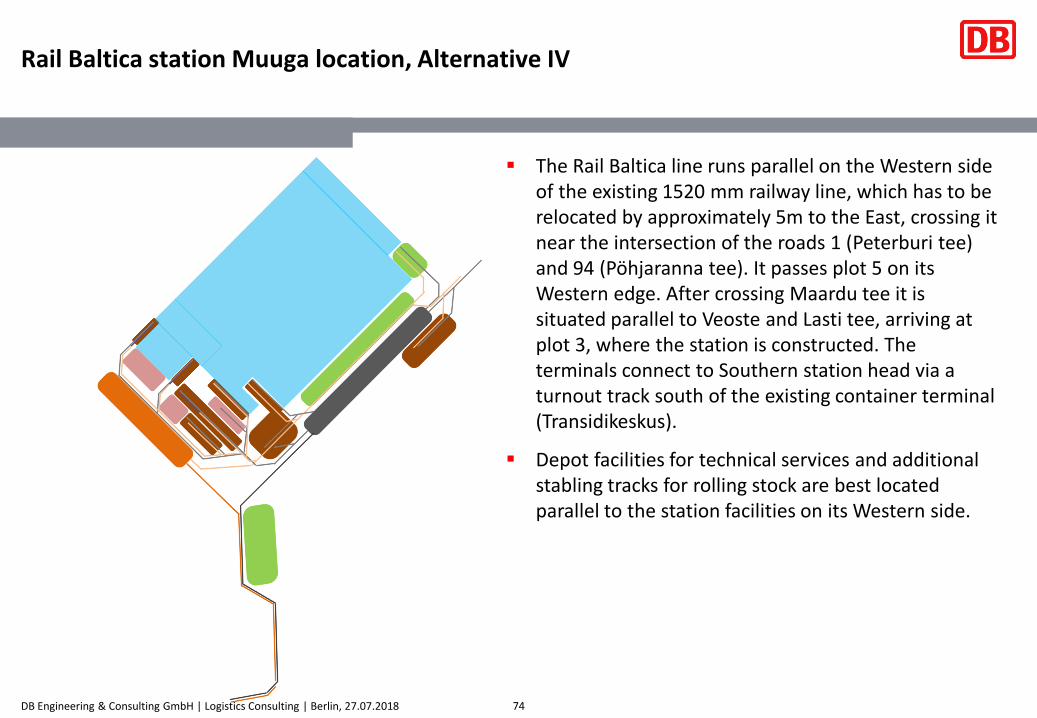
▪ The Rail Baltica line runs parallel on the Western side of the existing 1520 mm railway line, which has to be relocated by approximately 5m to the East, crossing it near the intersection of the roads 1 (Peterburi tee) and 94 (Pöhjaranna tee). It passes plot 5 on its Western edge. After crossing Maardu tee it is situated parallel to Veoste and Lasti tee, arriving at plot 3, where the station is constructed. The terminals connect to Southern station head via a turnout track south of the existing container terminal (Transidikeskus).
▪ Depot facilities for technical services and additional stabling tracks for rolling stock are best located parallel to the station facilities on its Western side.
Rail Baltica station Muuga location, Alternative V
75
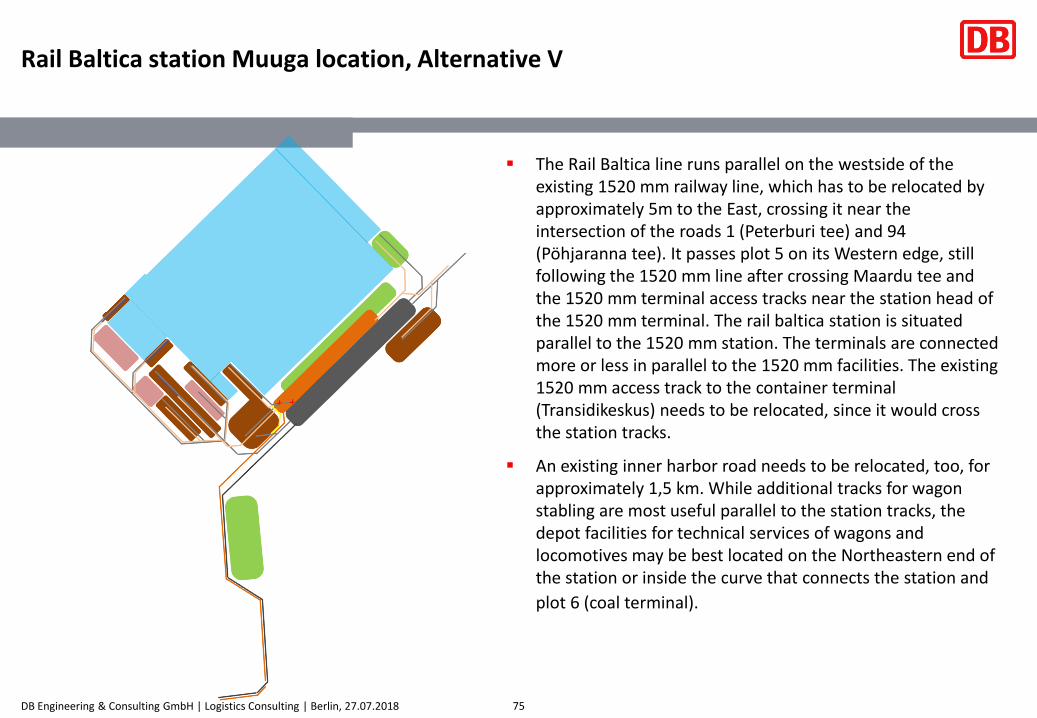
▪ The Rail Baltica line runs parallel on the westside of the existing 1520 mm railway line, which has to be relocated by approximately 5m to the East, crossing it near the intersection of the roads 1 (Peterburi tee) and 94 (Pöhjaranna tee). It passes plot 5 on its Western edge, still following the 1520 mm line after crossing Maardu tee and the 1520 mm terminal access tracks near the station head of the 1520 mm terminal. The rail baltica station is situated parallel to the 1520 mm station. The terminals are connected more or less in parallel to the 1520 mm facilities. The existing 1520 mm access track to the container terminal (Transidikeskus) needs to be relocated, since it would cross the station tracks.
▪ An existing inner harbor road needs to be relocated, too, for approximately 1,5 km. While additional tracks for wagon stabling are most useful parallel to the station tracks, the depot facilities for technical services of wagons and locomotives may be best located on the Northeastern end of the station or inside the curve that connects the station and
Rail Baltica station Muuga location, Alternative VI
76
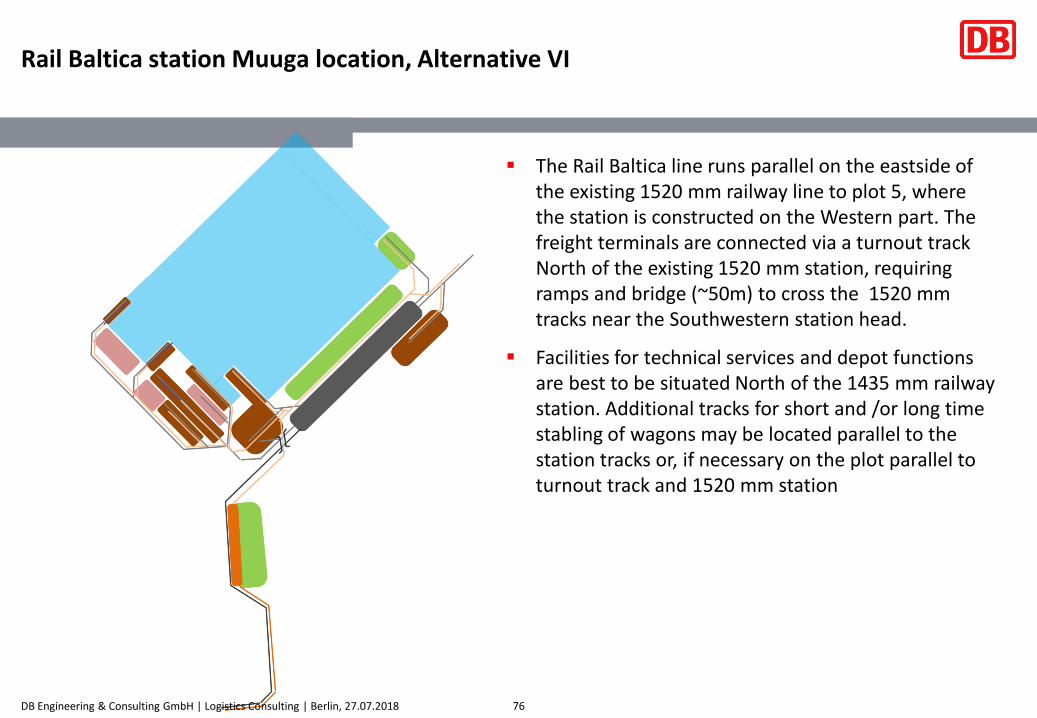
▪ The Rail Baltica line runs parallel on the eastside of the existing 1520 mm railway line to plot 5, where the station is constructed on the Western part. The freight terminals are connected via a turnout track North of the existing 1520 mm station, requiring ramps and bridge (~50m) to cross the 1520 mm tracks near the Southwestern station head.
▪ Facilities for technical services and depot functions are best to be situated North of the 1435 mm railway station. Additional tracks for short and /or long time stabling of wagons may be located parallel to the station tracks or, if necessary on the plot parallel to turnout track and 1520 mm station
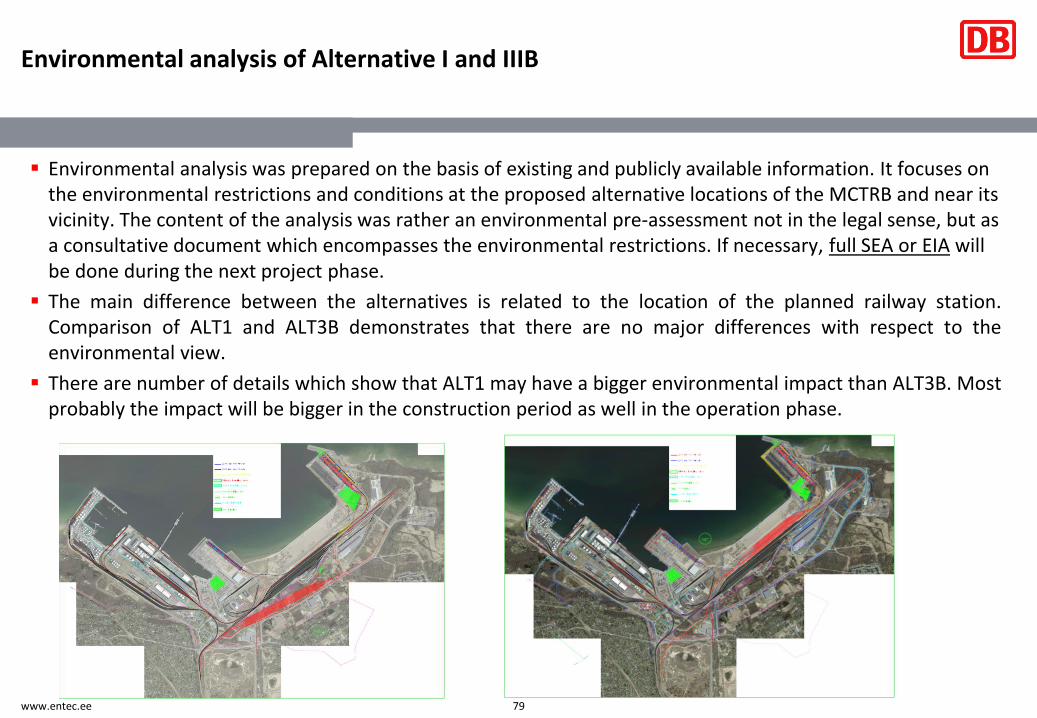
▪ Environmental analysis was prepared on the basis of existing and publicly available information. It focuses on the environmental restrictions and conditions at the proposed alternative locations of the MCTRB and near its vicinity. The content of the analysis was rather an environmental pre-assessment not in the legal sense, but as a consultative document which encompasses the environmental restrictions. If necessary, full SEA or EIA will be done during the next project phase.
▪ The main difference between the alternatives is related to the location of the planned railway station.Comparison of ALT1 and ALT3B demonstrates that there are no major differences with respect to theenvironmental view.
▪ There are number of details which show that ALT1 may have a bigger environmental impact than ALT3B. Mostprobably the impact will be bigger in the construction period as well in the operation phase.
Impact analysis 1/4
80www.entec.ee
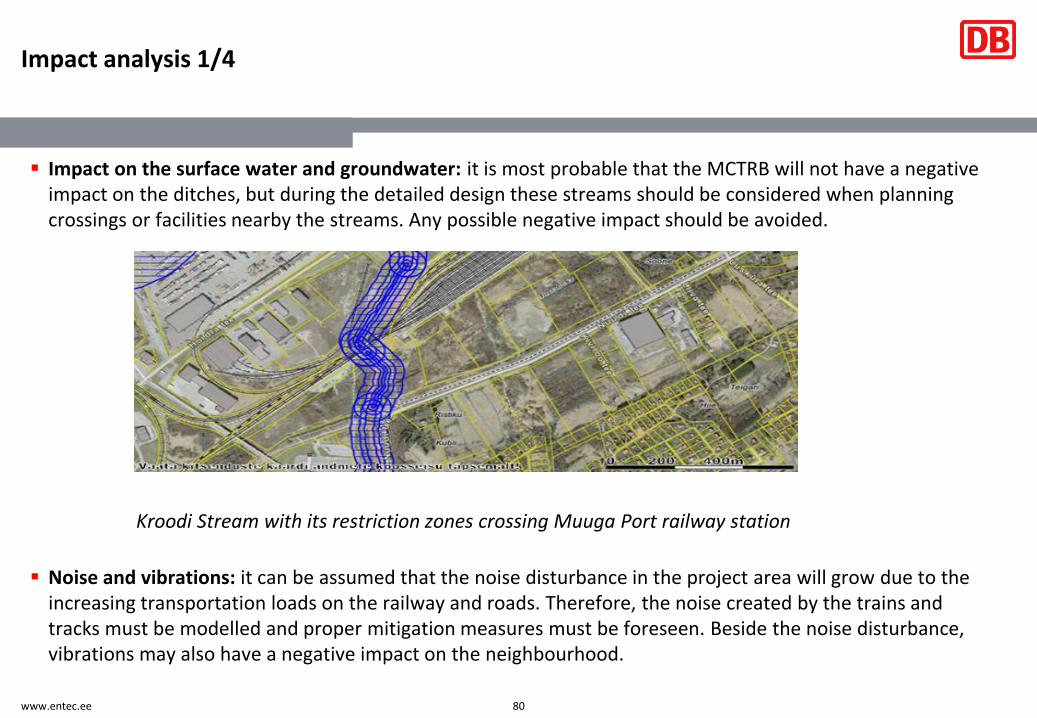
▪ Impact on the surface water and groundwater: it is most probable that the MCTRB will not have a negative impact on the ditches, but during the detailed design these streams should be considered when planning crossings or facilities nearby the streams. Any possible negative impact should be avoided.
Kroodi Stream with its restriction zones crossing Muuga Port railway station
▪ Noise and vibrations: it can be assumed that the noise disturbance in the project area will grow due to the increasing transportation loads on the railway and roads. Therefore, the noise created by the trains and tracks must be modelled and proper mitigation measures must be foreseen. Beside the noise disturbance, vibrations may also have a negative impact on the neighbourhood.
Impact analysis 2/4
81www.entec.ee
▪ Impact on the air quality: air pollution due to rail traffic is mainly related to the movement of diesellocomotives. Also, the possible standing time at the MCTRB must be taken into account, as this may lead toa slightly higher concentration of contaminants compared to the natural background level. The increasingroad traffic will also generate an increase of air pollution.
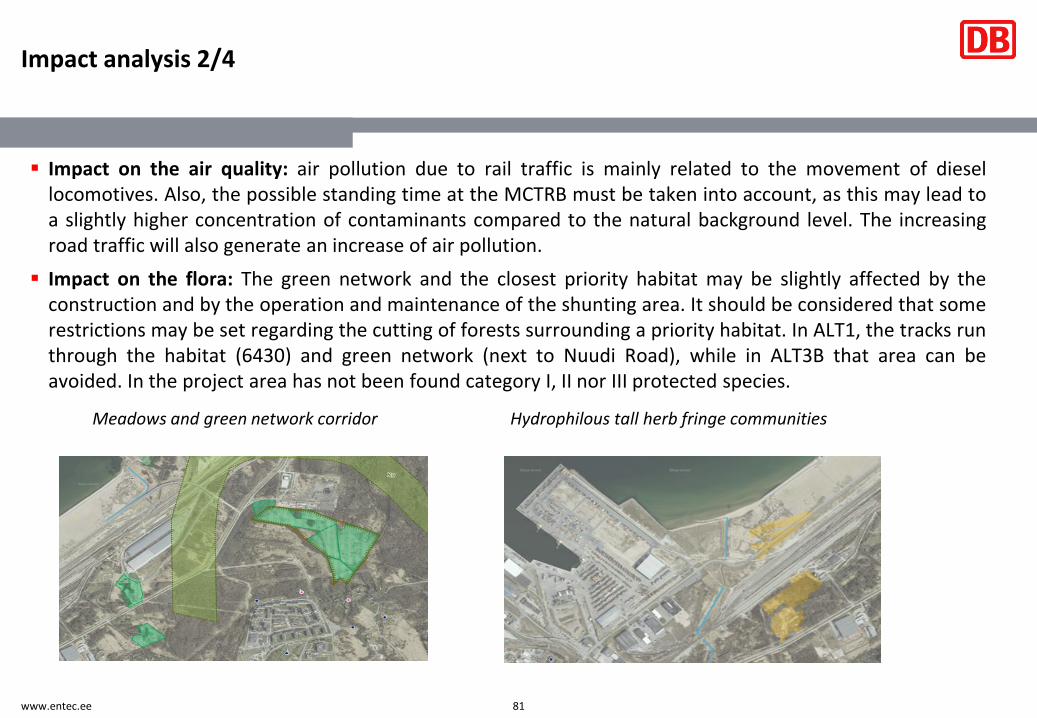
▪ Impact on the flora: The green network and the closest priority habitat may be slightly affected by theconstruction and by the operation and maintenance of the shunting area. It should be considered that somerestrictions may be set regarding the cutting of forests surrounding a priority habitat. In ALT1, the tracks runthrough the habitat (6430) and green network (next to Nuudi Road), while in ALT3B that area can beavoided. In the project area has not been found category I, II nor III protected species.
Meadows and green network corridor Hydrophilous tall herb fringe communities
Impact analysis 3/4
82www.entec.ee
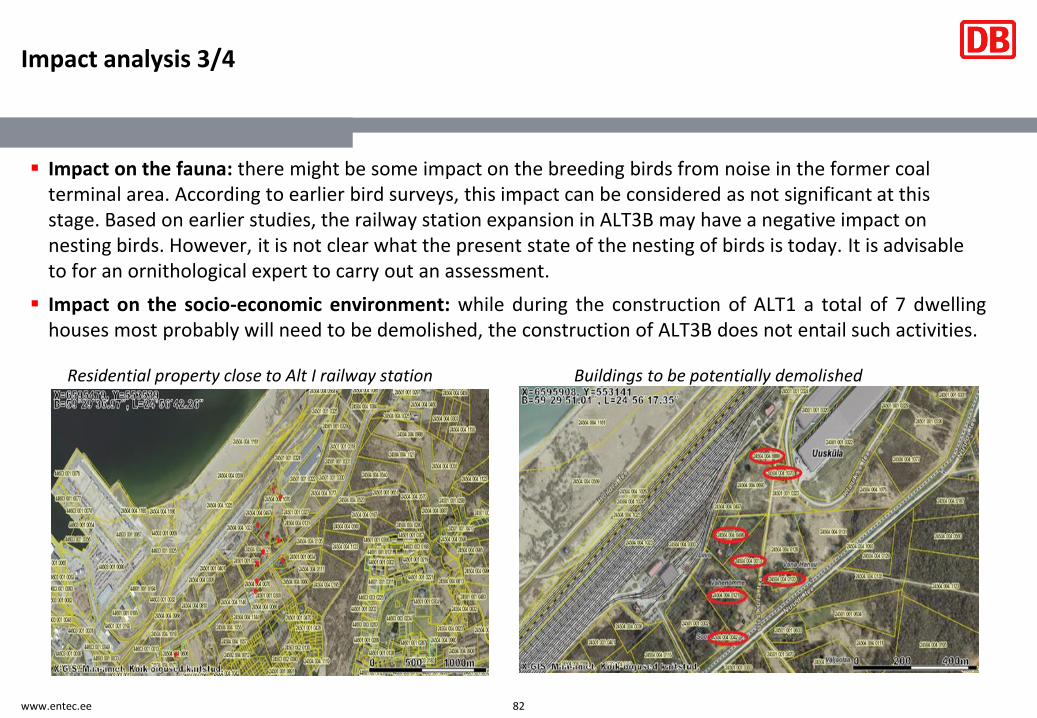
▪ Impact on the fauna: there might be some impact on the breeding birds from noise in the former coal terminal area. According to earlier bird surveys, this impact can be considered as not significant at this stage. Based on earlier studies, the railway station expansion in ALT3B may have a negative impact on nesting birds. However, it is not clear what the present state of the nesting of birds is today. It is advisable to for an ornithological expert to carry out an assessment.
▪ Impact on the socio-economic environment: while during the construction of ALT1 a total of 7 dwellinghouses most probably will need to be demolished, the construction of ALT3B does not entail such activities.
Residential property close to Alt I railway station Buildings to be potentially demolished
Impact analysis 4/4
83www.entec.ee
▪ The planned railway station in ALT1 is located much closer to the residential areas, which may lead to a higher cost of the required mitigation measures than is the case with ALT3B (Noise and vibrations).
▪ The potential negative impact on people during the construction phase of the MTCRB will be temporary and can be reduced by the organisation of the construction activities and engineering methods.
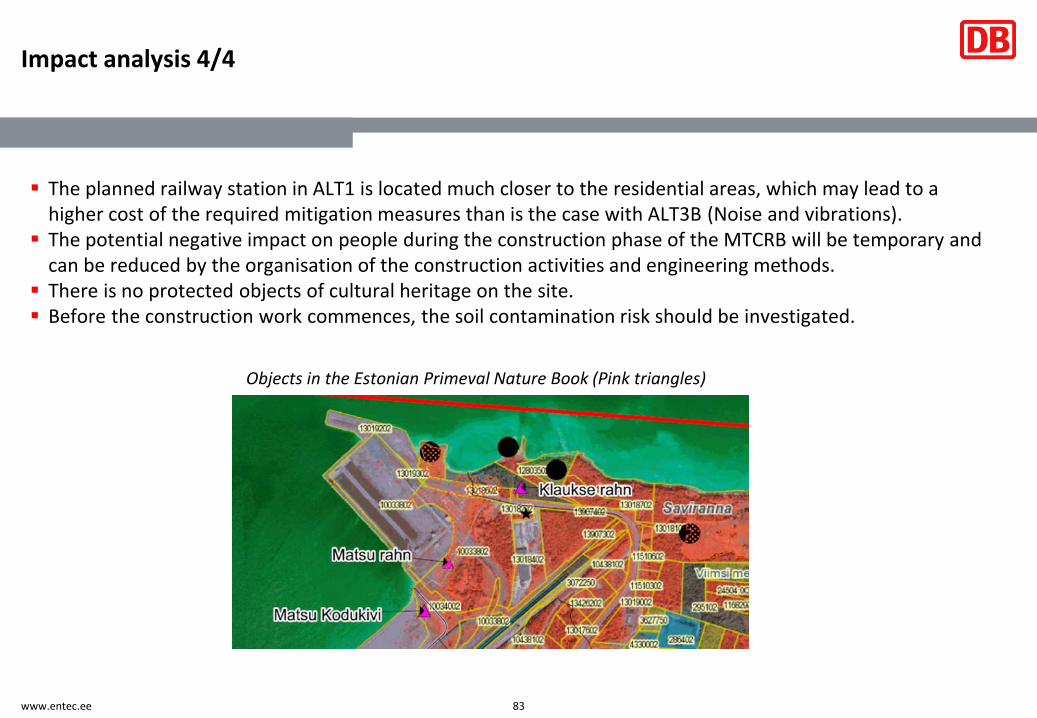
▪ There is no protected objects of cultural heritage on the site.▪ Before the construction work commences, the soil contamination risk should be investigated.
Objects in the Estonian Primeval Nature Book (Pink triangles)
84
1 Work package 1: Analysis of existing situation
4 Work package 4: Action plan implementation, initial design
2 Work package 2: Analysis of technical and spatial needs of MCTRB
3 Work package 3: Evaluation of alternative offers
Process of train handling on 1435 an 1520 mm tracks
87
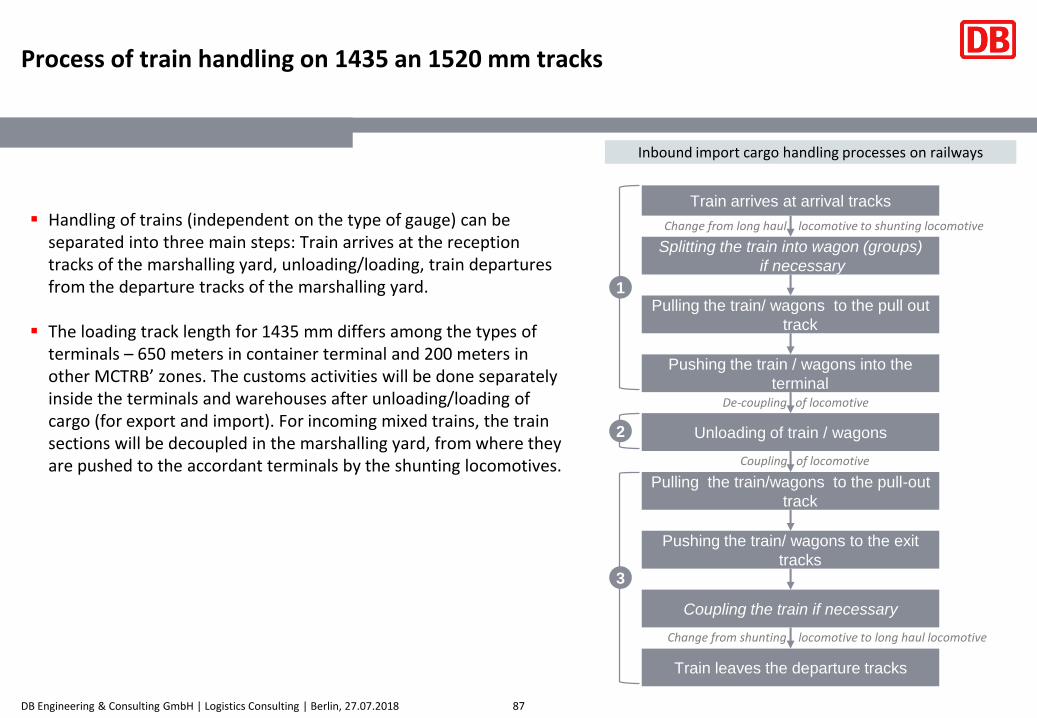
▪ Handling of trains (independent on the type of gauge) can be separated into three main steps: Train arrives at the reception tracks of the marshalling yard, unloading/loading, train departures from the departure tracks of the marshalling yard.
▪ The loading track length for 1435 mm differs among the types of terminals – 650 meters in container terminal and 200 meters in other MCTRB’ zones. The customs activities will be done separately inside the terminals and warehouses after unloading/loading of cargo (for export and import). For incoming mixed trains, the train sections will be decoupled in the marshalling yard, from where they are pushed to the accordant terminals by the shunting locomotives.
Train arrives at arrival tracks
1
Change from long haul locomotive to shunting locomotive
Pulling the train/ wagons to the pull out
track
Pushing the train / wagons into the
terminal
Unloading of train / wagons
Train leaves the departure tracks
De-coupling of locomotive
Pulling the train/wagons to the pull-out
track
Coupling of locomotive
Pushing the train/ wagons to the exit
tracks
2
3
Change from shunting locomotive to long haul locomotive
Splitting the train into wagon (groups)
if necessary
Coupling the train if necessary
Inbound import cargo handling processes on railways
Process of container handling by truck at container terminal
Container handling processes on road
88
Truck arrives at the Muuga port pre-
check area (port gate)
Truck passes the pre-check
Check in at container terminal (check-in
facility)
Truck passes the gate of the container term. and proceeds to the loading place
Truck reaches the loading position
Crane loads the container
Loaded truck leaves the port
1
2
3
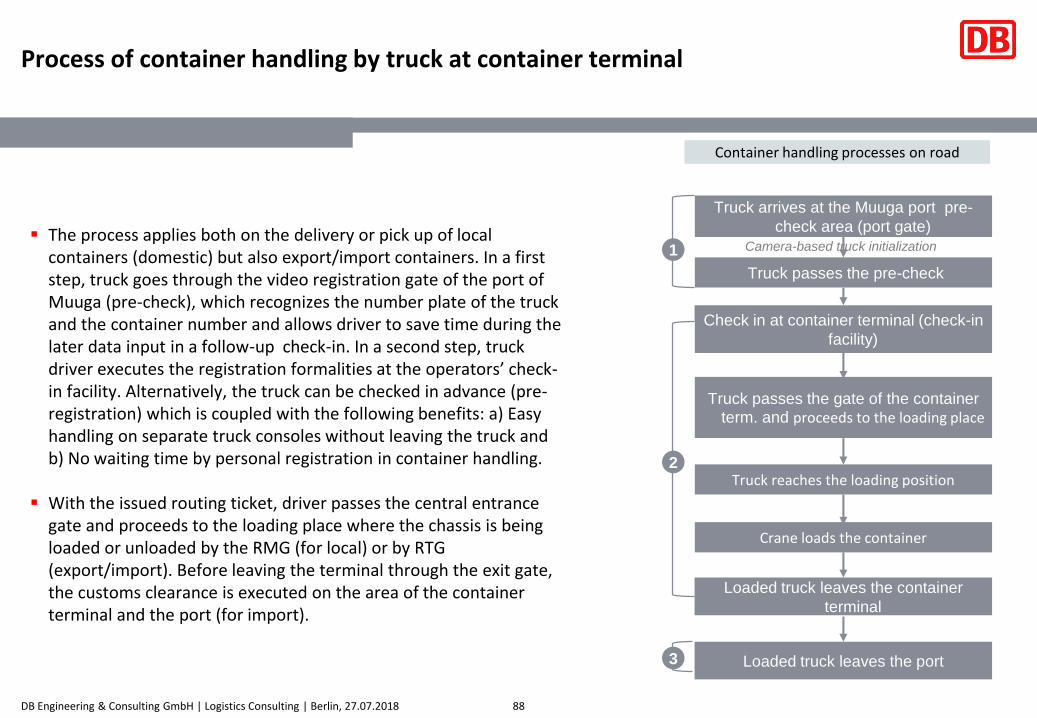
Camera-based truck initialization▪ The process applies both on the delivery or pick up of local
containers (domestic) but also export/import containers. In a first step, truck goes through the video registration gate of the port of Muuga (pre-check), which recognizes the number plate of the truck and the container number and allows driver to save time during the later data input in a follow-up check-in. In a second step, truck driver executes the registration formalities at the operators’ check-in facility. Alternatively, the truck can be checked in advance (pre-registration) which is coupled with the following benefits: a) Easy handling on separate truck consoles without leaving the truck and b) No waiting time by personal registration in container handling.
▪ With the issued routing ticket, driver passes the central entrance gate and proceeds to the loading place where the chassis is being loaded or unloaded by the RMG (for local) or by RTG (export/import). Before leaving the terminal through the exit gate, the customs clearance is executed on the area of the container terminal and the port (for import).
Process of rail-road transshipment (1 – cranable units)
89
1 RMG unloads the train
Containers are stored in the yard
Customs Clearance (if required)
RMG loads the truck
Truck arrives at the loading position
2
3
Loaded truck leaves the terminal
Loaded train arrives at the tracks of the
container terminal
Rail-Road transshipment process
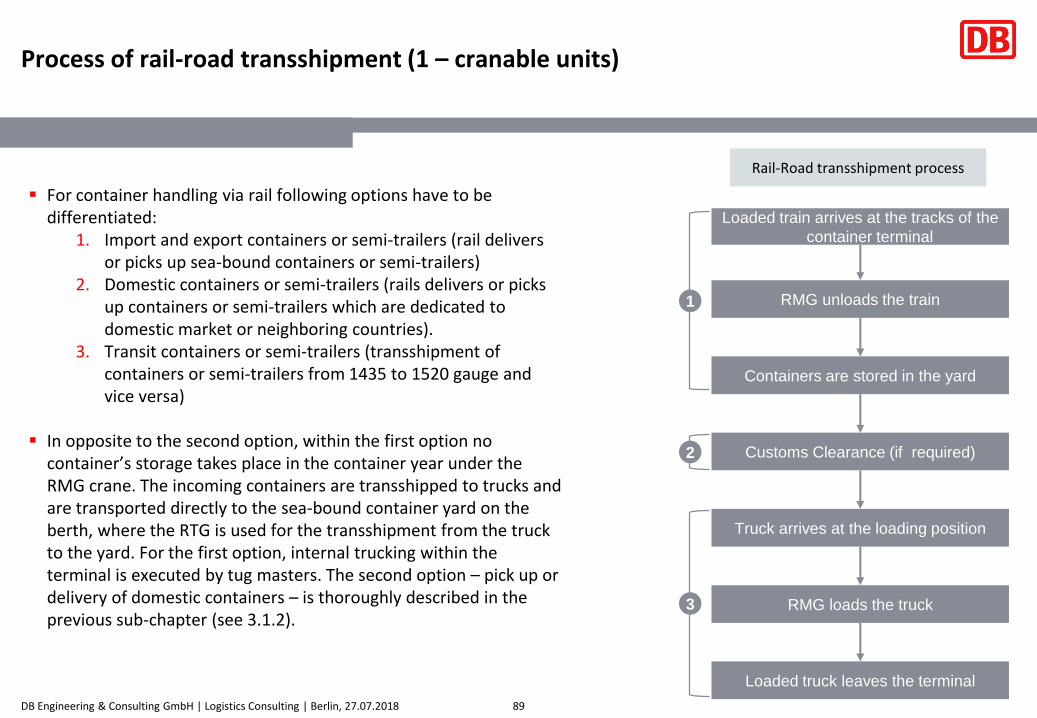
▪ For container handling via rail following options have to be differentiated:
1. Import and export containers or semi-trailers (rail delivers or picks up sea-bound containers or semi-trailers)
2. Domestic containers or semi-trailers (rails delivers or picks up containers or semi-trailers which are dedicated to domestic market or neighboring countries).
3. Transit containers or semi-trailers (transshipment of containers or semi-trailers from 1435 to 1520 gauge and vice versa)
▪ In opposite to the second option, within the first option no container’s storage takes place in the container year under the RMG crane. The incoming containers are transshipped to trucks and are transported directly to the sea-bound container yard on the berth, where the RTG is used for the transshipment from the truck to the yard. For the first option, internal trucking within the terminal is executed by tug masters. The second option – pick up or delivery of domestic containers – is thoroughly described in the previous sub-chapter (see 3.1.2).
Process of rail-road transshipment (2 – non-cranable units)
90
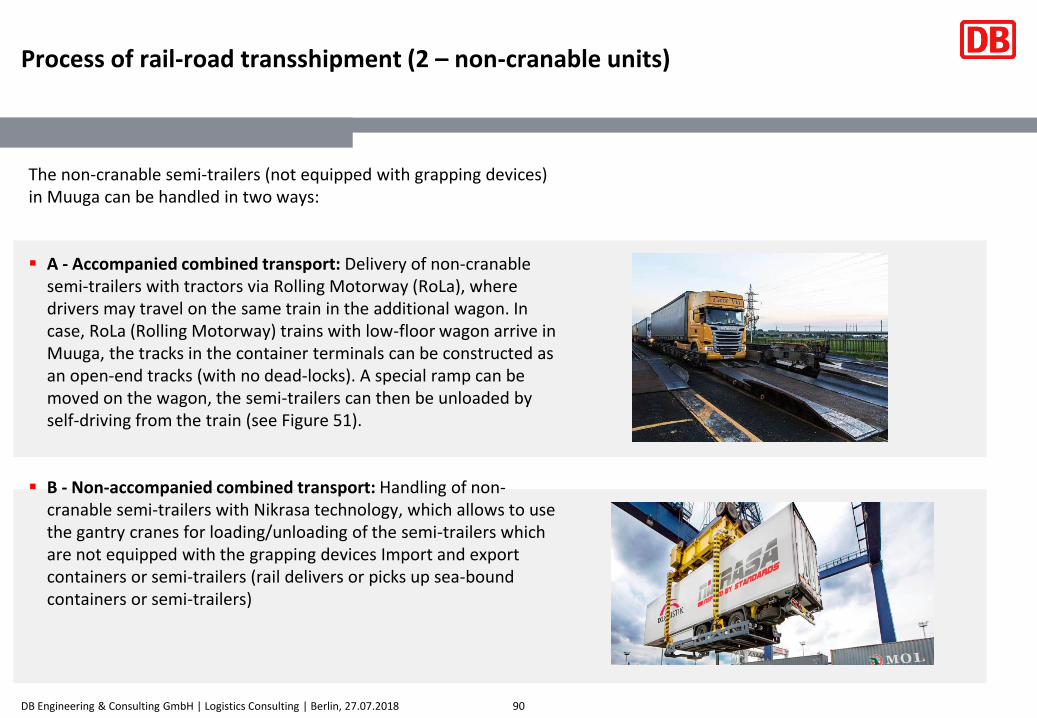
The non-cranable semi-trailers (not equipped with grapping devices) in Muuga can be handled in two ways:
▪ A - Accompanied combined transport: Delivery of non-cranablesemi-trailers with tractors via Rolling Motorway (RoLa), where drivers may travel on the same train in the additional wagon. In case, RoLa (Rolling Motorway) trains with low-floor wagon arrive in Muuga, the tracks in the container terminals can be constructed as an open-end tracks (with no dead-locks). A special ramp can be moved on the wagon, the semi-trailers can then be unloaded by self-driving from the train (see Figure 51).
▪ B - Non-accompanied combined transport: Handling of non-cranable semi-trailers with Nikrasa technology, which allows to use the gantry cranes for loading/unloading of the semi-trailers which are not equipped with the grapping devices Import and export containers or semi-trailers (rail delivers or picks up sea-bound containers or semi-trailers)
Truck passes the gate of the RORO term. and proceeds to the assigned lane
Ferry leaves the port
3 Truck is loaded on the ferry
2
Truck arrives at the Muuga port pre-
check area (port gate)
1 Camera-based truck initialization
Truck passes the pre-check
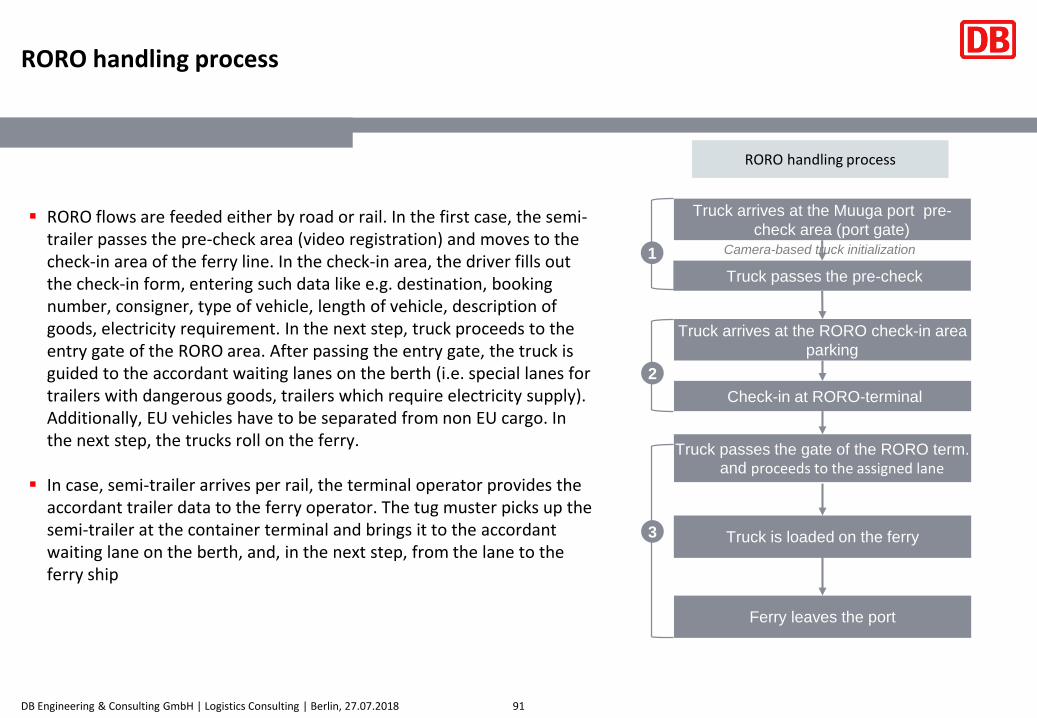
▪ RORO flows are feeded either by road or rail. In the first case, the semi-trailer passes the pre-check area (video registration) and moves to the check-in area of the ferry line. In the check-in area, the driver fills out the check-in form, entering such data like e.g. destination, booking number, consigner, type of vehicle, length of vehicle, description of goods, electricity requirement. In the next step, truck proceeds to the entry gate of the RORO area. After passing the entry gate, the truck is guided to the accordant waiting lanes on the berth (i.e. special lanes for trailers with dangerous goods, trailers which require electricity supply). Additionally, EU vehicles have to be separated from non EU cargo. In the next step, the trucks roll on the ferry.
▪ In case, semi-trailer arrives per rail, the terminal operator provides the accordant trailer data to the ferry operator. The tug muster picks up the semi-trailer at the container terminal and brings it to the accordant waiting lane on the berth, and, in the next step, from the lane to the ferry ship
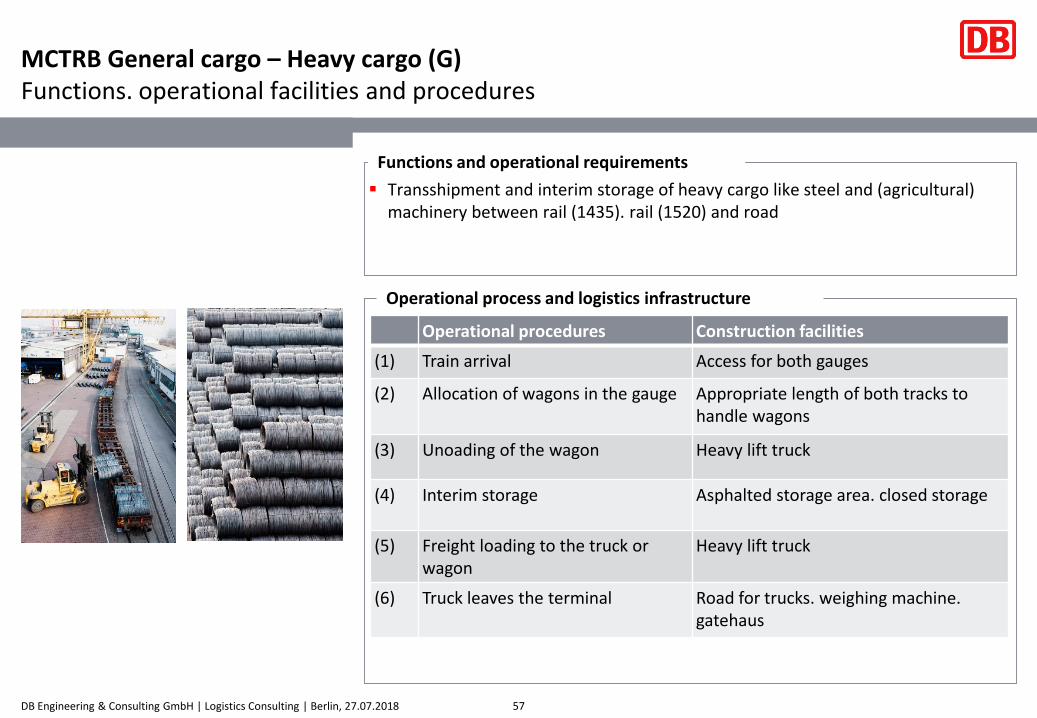
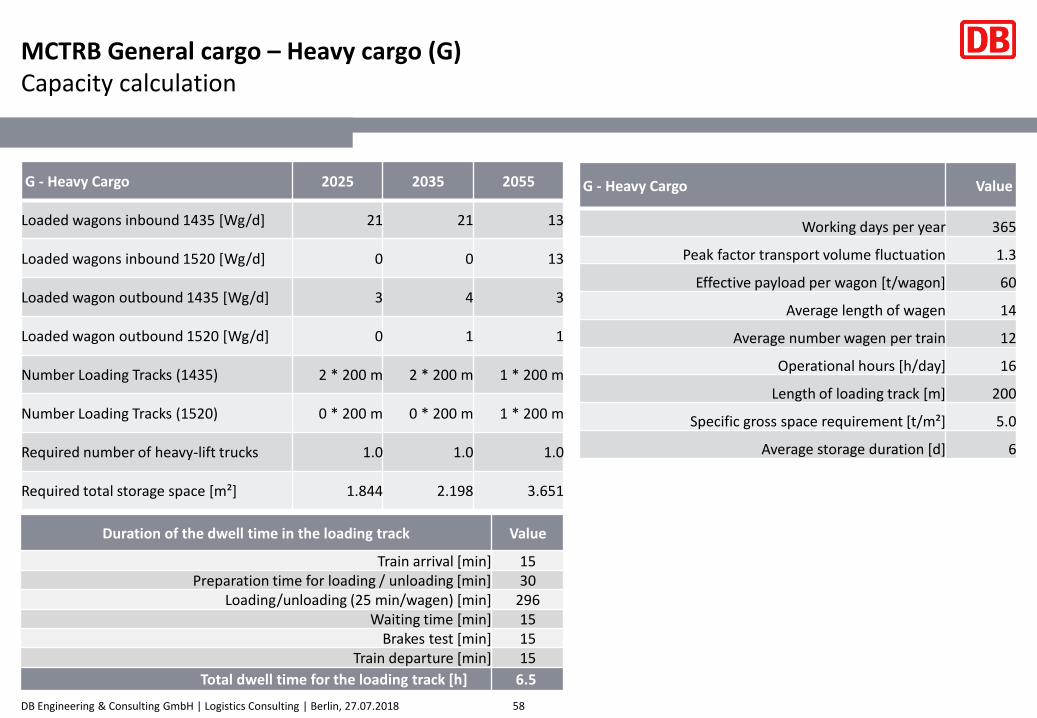
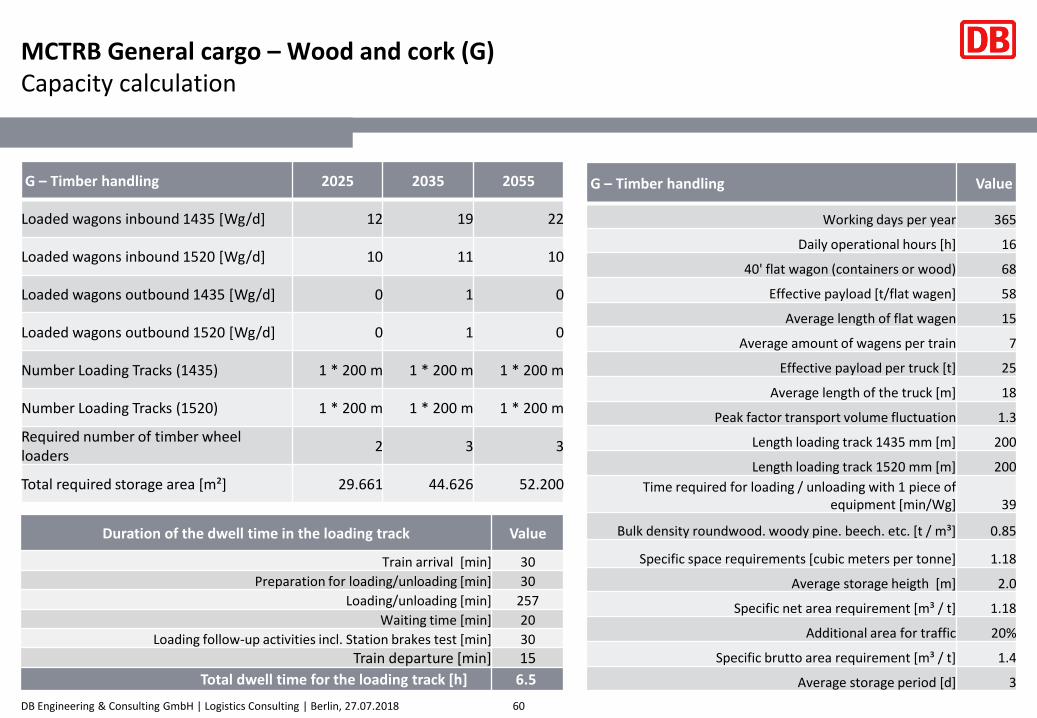
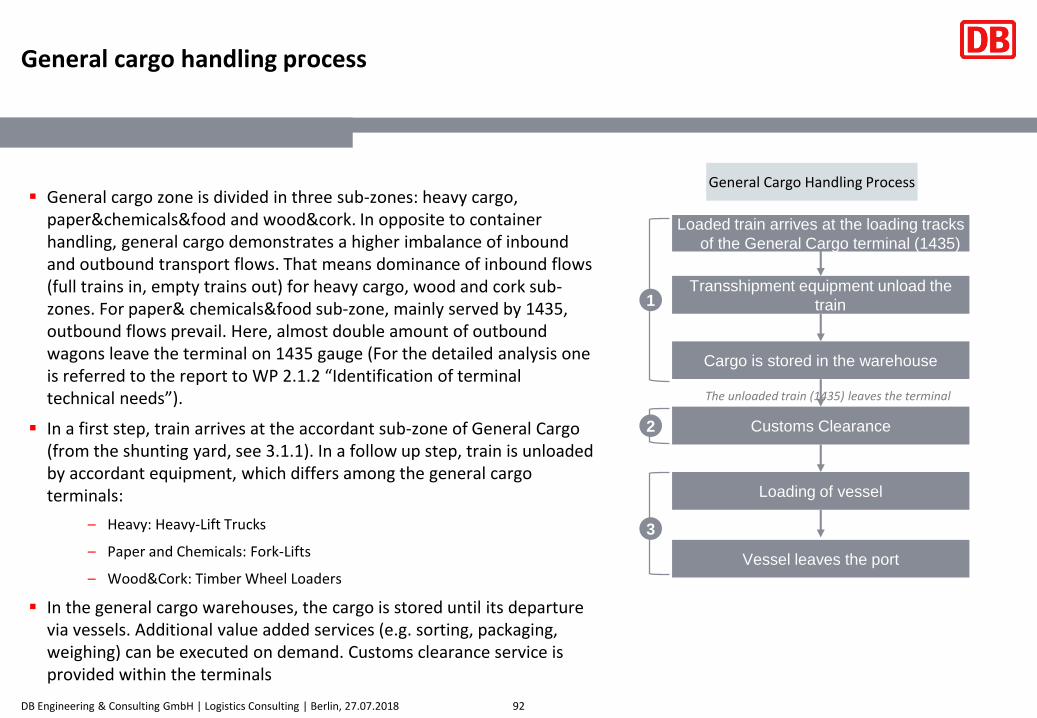
▪ General cargo zone is divided in three sub-zones: heavy cargo, paper&chemicals&food and wood&cork. In opposite to container handling, general cargo demonstrates a higher imbalance of inbound and outbound transport flows. That means dominance of inbound flows (full trains in, empty trains out) for heavy cargo, wood and cork sub-zones. For paper& chemicals&food sub-zone, mainly served by 1435, outbound flows prevail. Here, almost double amount of outbound wagons leave the terminal on 1435 gauge (For the detailed analysis one is referred to the report to WP 2.1.2 “Identification of terminal technical needs”).
▪ In a first step, train arrives at the accordant sub-zone of General Cargo (from the shunting yard, see 3.1.1). In a follow up step, train is unloaded by accordant equipment, which differs among the general cargo terminals:
– Heavy: Heavy-Lift Trucks
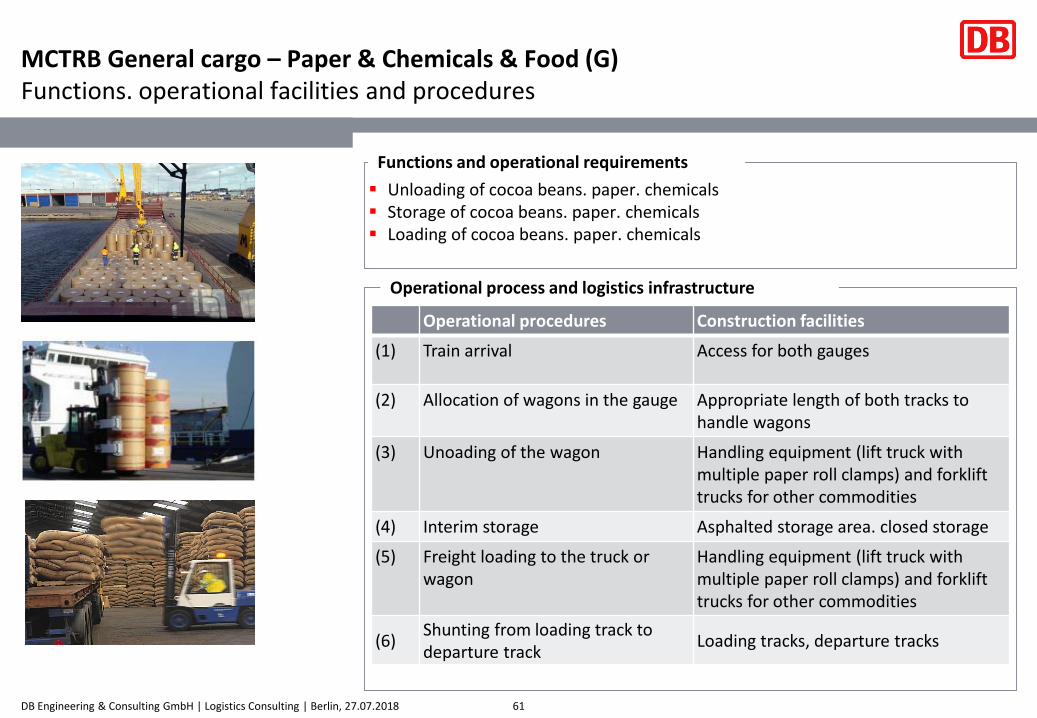
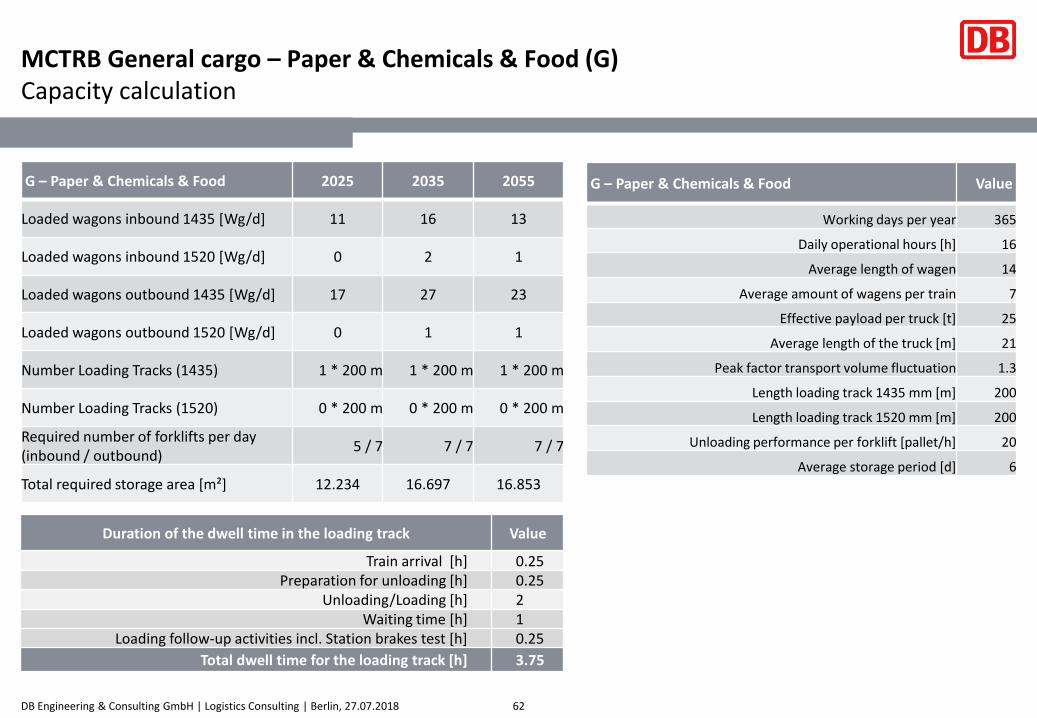
– Paper and Chemicals: Fork-Lifts
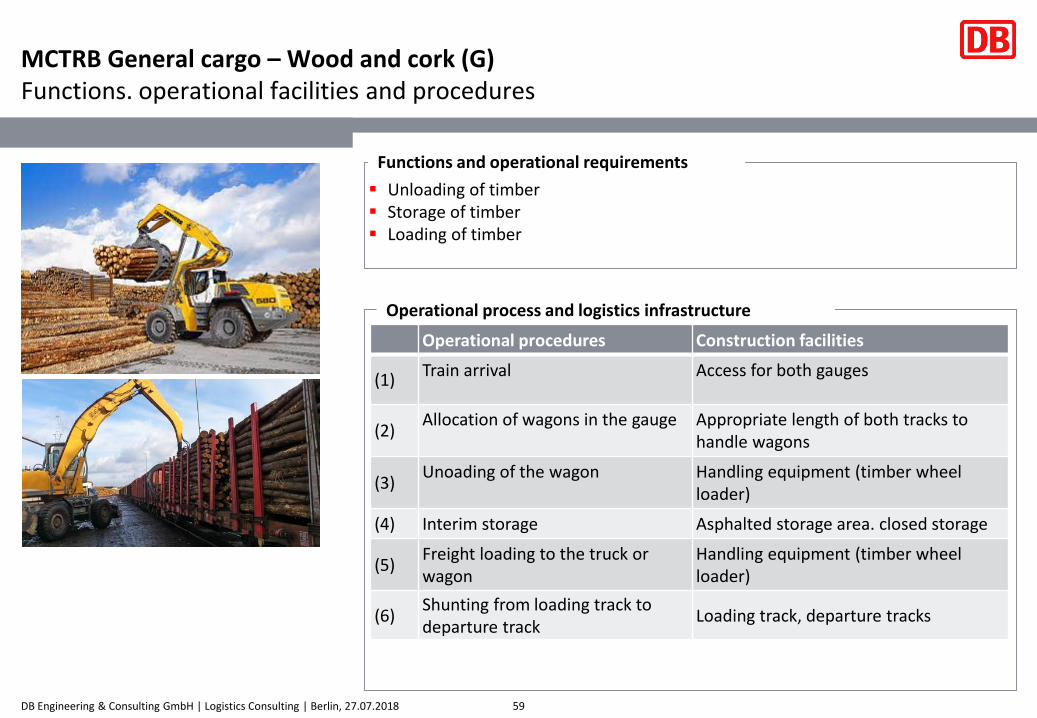
– Wood&Cork: Timber Wheel Loaders
▪ In the general cargo warehouses, the cargo is stored until its departure via vessels. Additional value added services (e.g. sorting, packaging, weighing) can be executed on demand. Customs clearance service is provided within the terminals
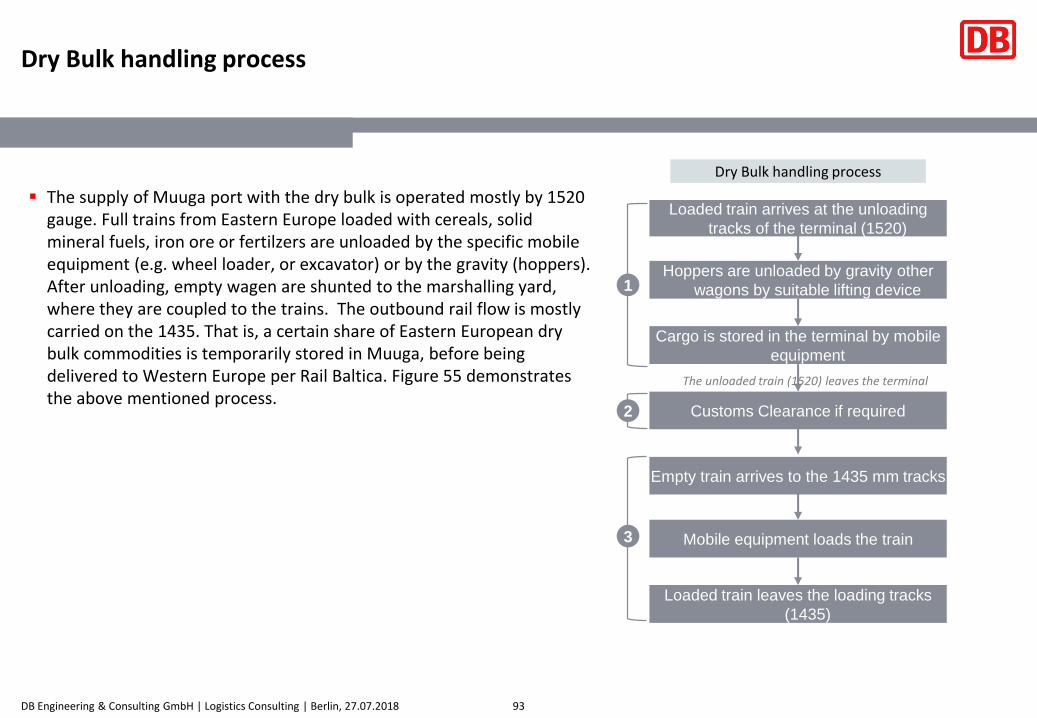
▪ The supply of Muuga port with the dry bulk is operated mostly by 1520 gauge. Full trains from Eastern Europe loaded with cereals, solid mineral fuels, iron ore or fertilzers are unloaded by the specific mobile equipment (e.g. wheel loader, or excavator) or by the gravity (hoppers). After unloading, empty wagen are shunted to the marshalling yard, where they are coupled to the trains. The outbound rail flow is mostly carried on the 1435. That is, a certain share of Eastern European dry bulk commodities is temporarily stored in Muuga, before being delivered to Western Europe per Rail Baltica. Figure 55 demonstrates the above mentioned process.
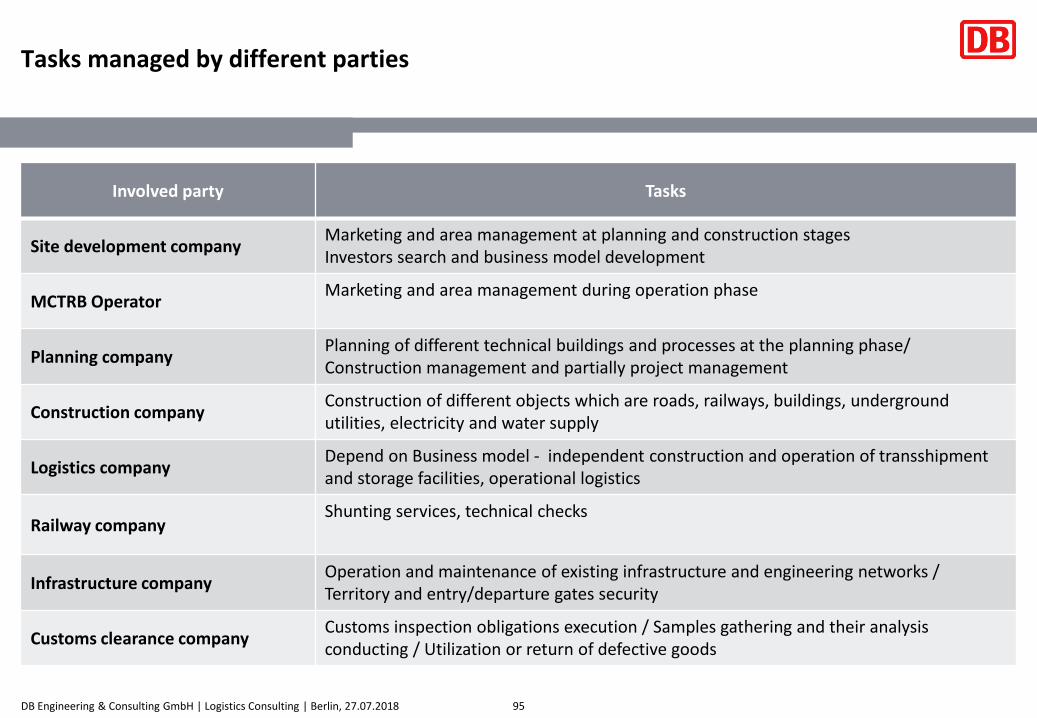
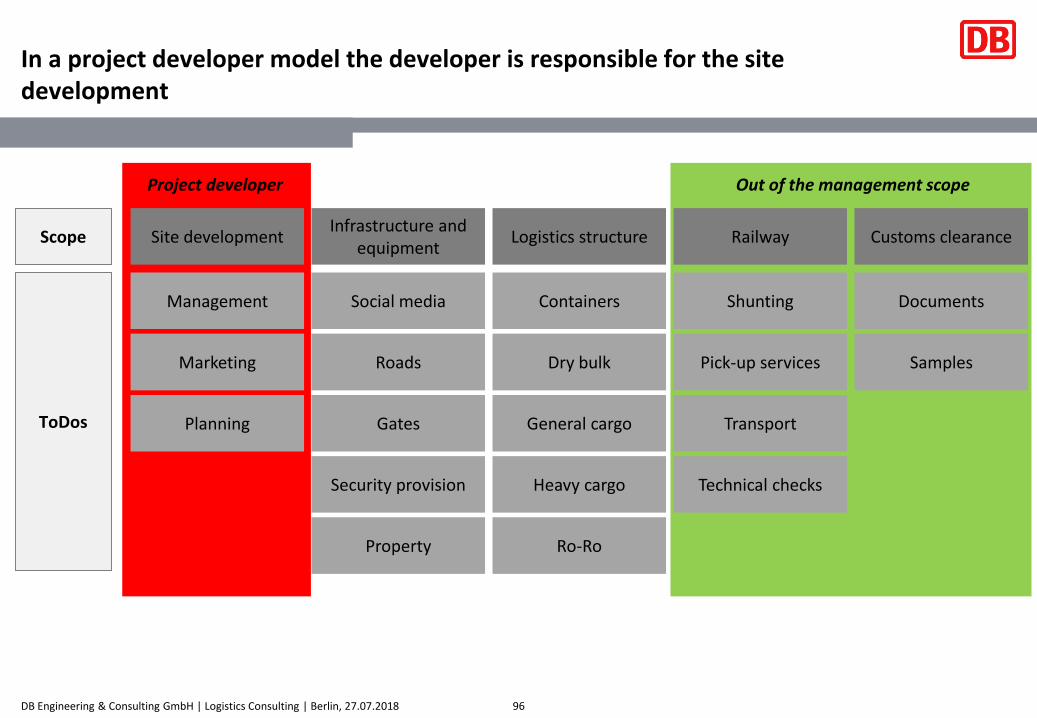
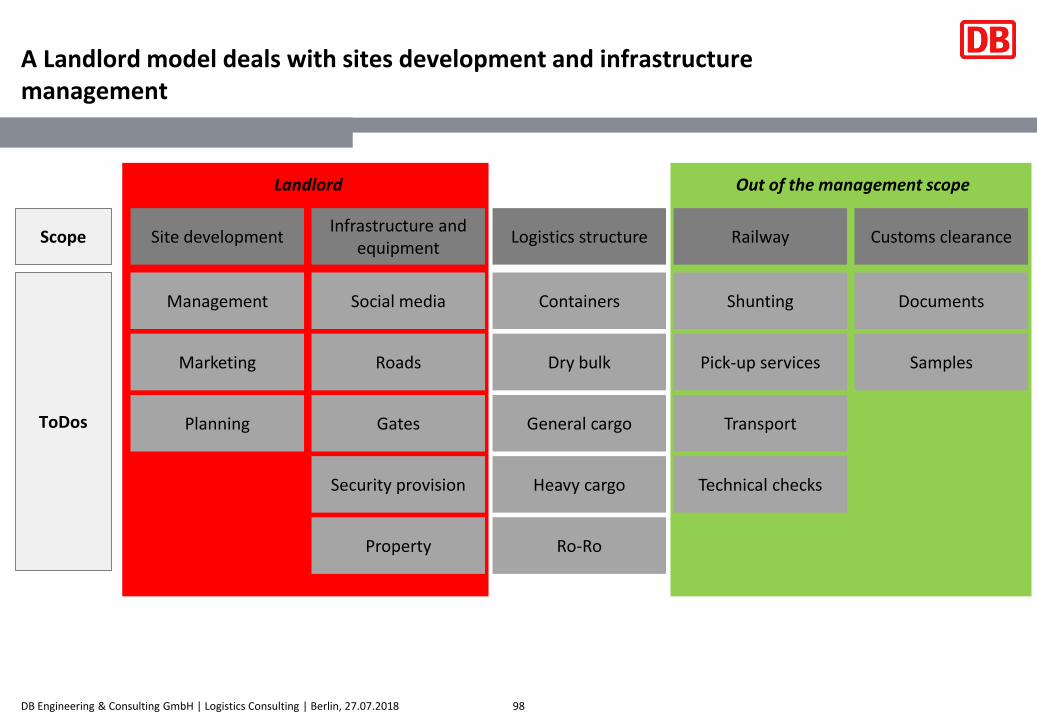
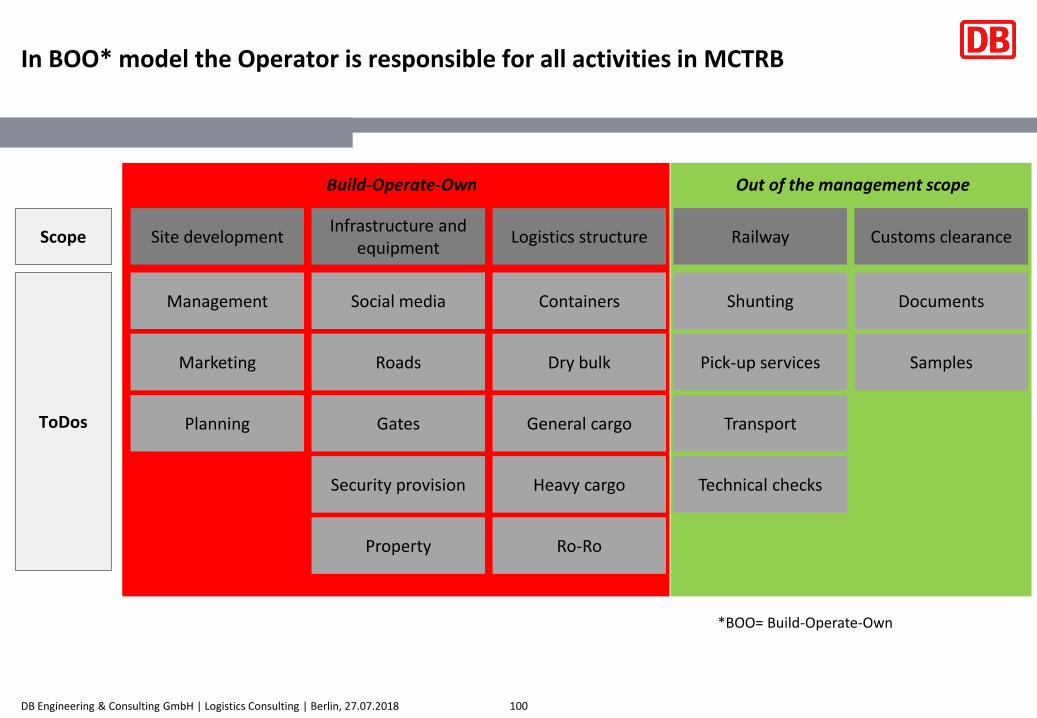
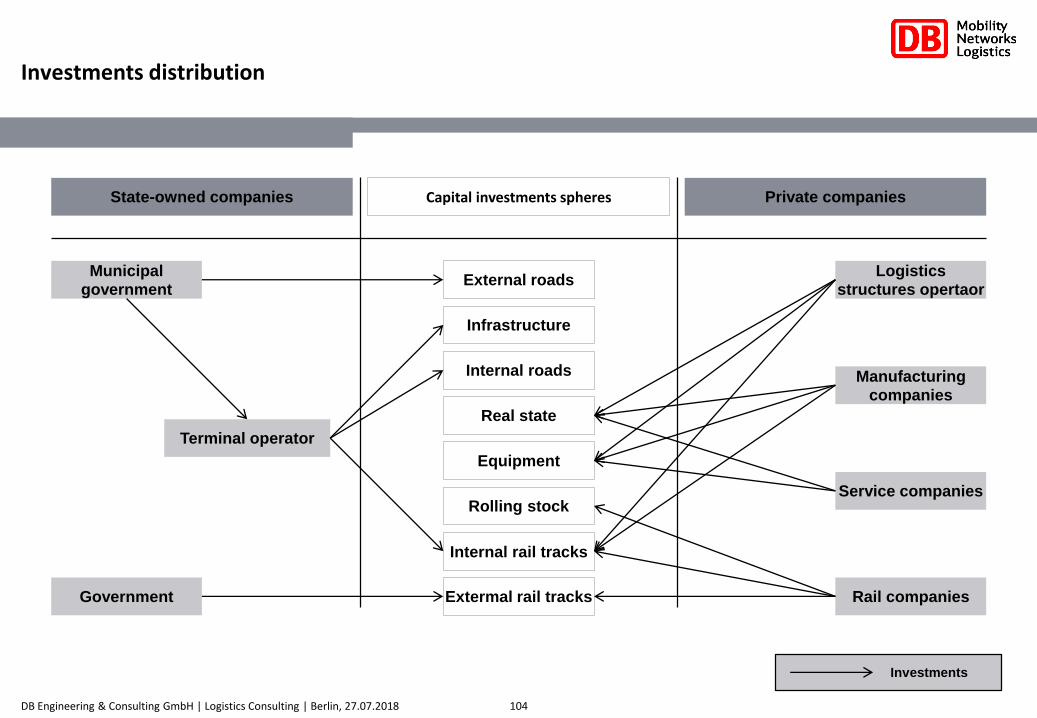
Site development companyMarketing and area management at planning and construction stagesInvestors search and business model development
MCTRB OperatorMarketing and area management during operation phase
Planning companyPlanning of different technical buildings and processes at the planning phase/ Construction management and partially project management
Construction companyConstruction of different objects which are roads, railways, buildings, underground utilities, electricity and water supply
Logistics companyDepend on Business model - independent construction and operation of transshipment and storage facilities, operational logistics
Infrastructure companyOperation and maintenance of existing infrastructure and engineering networks / Territory and entry/departure gates security
Customs clearance companyCustoms inspection obligations execution / Samples gathering and their analysis conducting / Utilization or return of defective goods
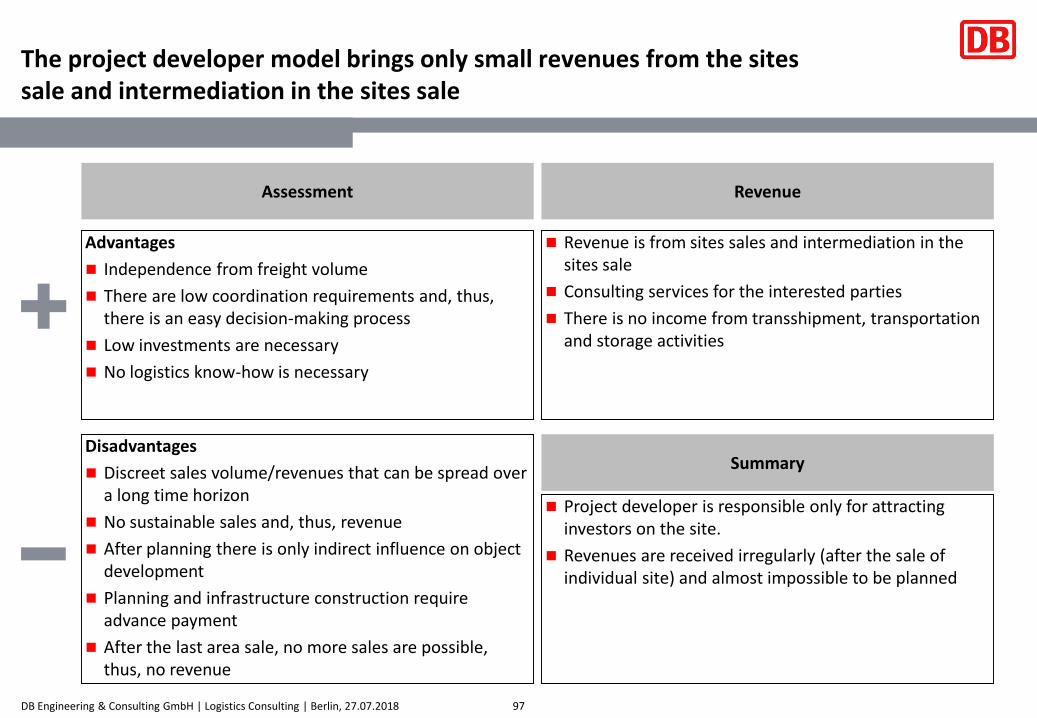
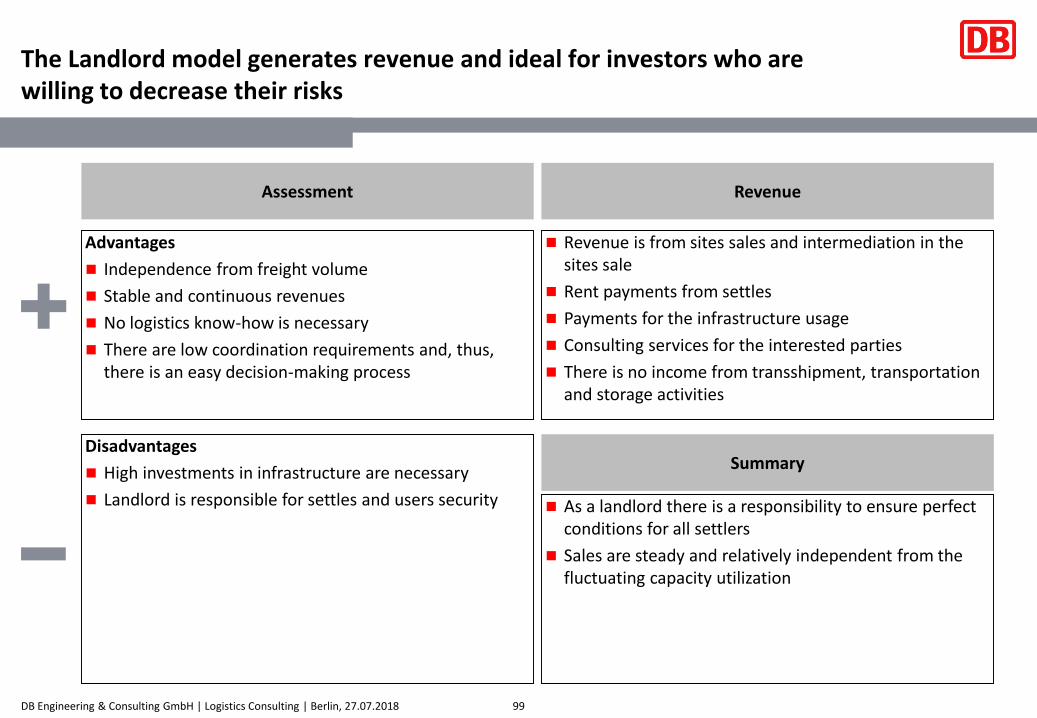
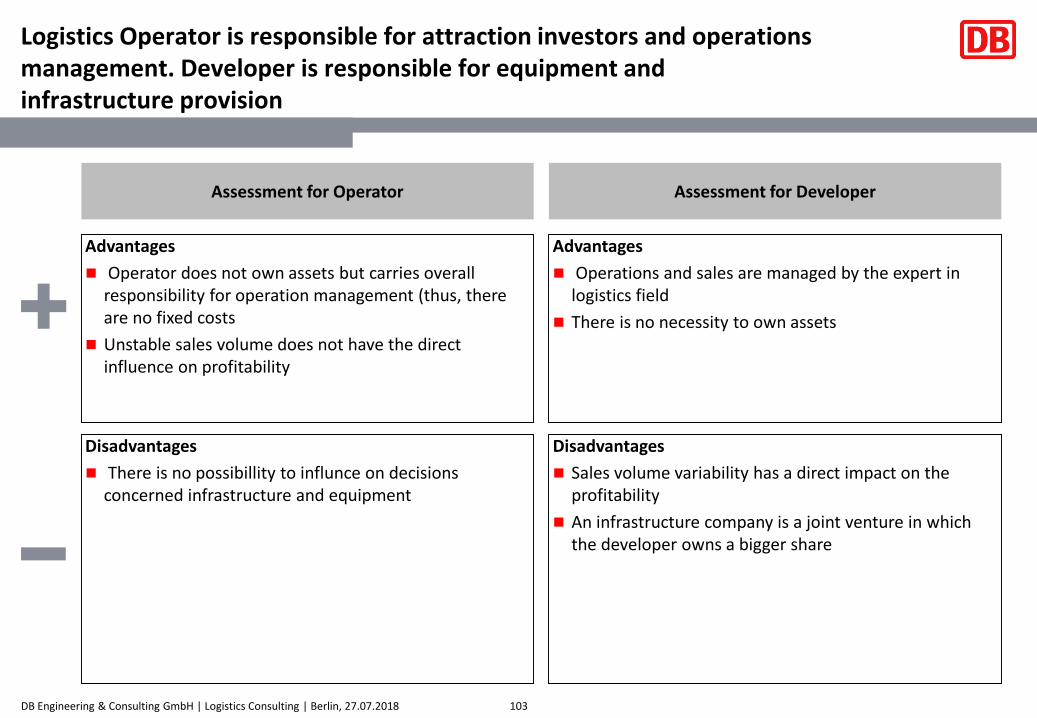
Logistics Operator is responsible for attraction investors and operationsmanagement. Developer is responsible for equipment andinfrastructure provision
103
Advantages
Operator does not own assets but carries overallresponsibility for operation management (thus, thereare no fixed costs
Unstable sales volume does not have the directinfluence on profitability
Disadvantages
There is no possibillity to influnce on decisionsconcerned infrastructure and equipment
Assessment for Operator
Advantages
Operations and sales are managed by the expert in logistics field
There is no necessity to own assets
Disadvantages
Sales volume variability has a direct impact on the profitability
An infrastructure company is a joint venture in which the developer owns a bigger share
▪ stakeholders that see the potential of the RBMMT or are cautiously positiveThese companies agree that the containerisation of goods will continue in the coming decades. Companies belonging to this group argue that Rail Baltica will bring extra value to their business and see possible synergies in the 1435 mm and 1520 mm railway. According to their view RBMMT should be established right next to the harbour to minimise the additional expenses of reloading goods.
▪ stakeholders that tend to be convinced that the RBMMT will not create any added value for their business or have doubts about the vitality of RB as such
Some of these companies focus exclusively on 1520 transport in an east-to-west direction. A considerable part of today’s bulk goods are so-called intercontinental goods and the north-to-south direction therefore has no meaning for these stakeholders. Therefore, these undertakings have no direct interest in disturbing the existing functionality of 1520 mm railway.
▪ stakeholders that are based in the vicinity of Muuga Harbour and are planning additional terminalsThey include developers who are prepared to build warehouses and production premises as well as multimodal terminals with 1435/1520 reloading possibilities and the possibility to load trailers. These undertakings support the vision that goods related to the water line should go directly to the harbour. However, they also find that goods sent from or to the inland that have no connection with the sea and wharf line should be loaded outside the territory of the harbour (dry port option)
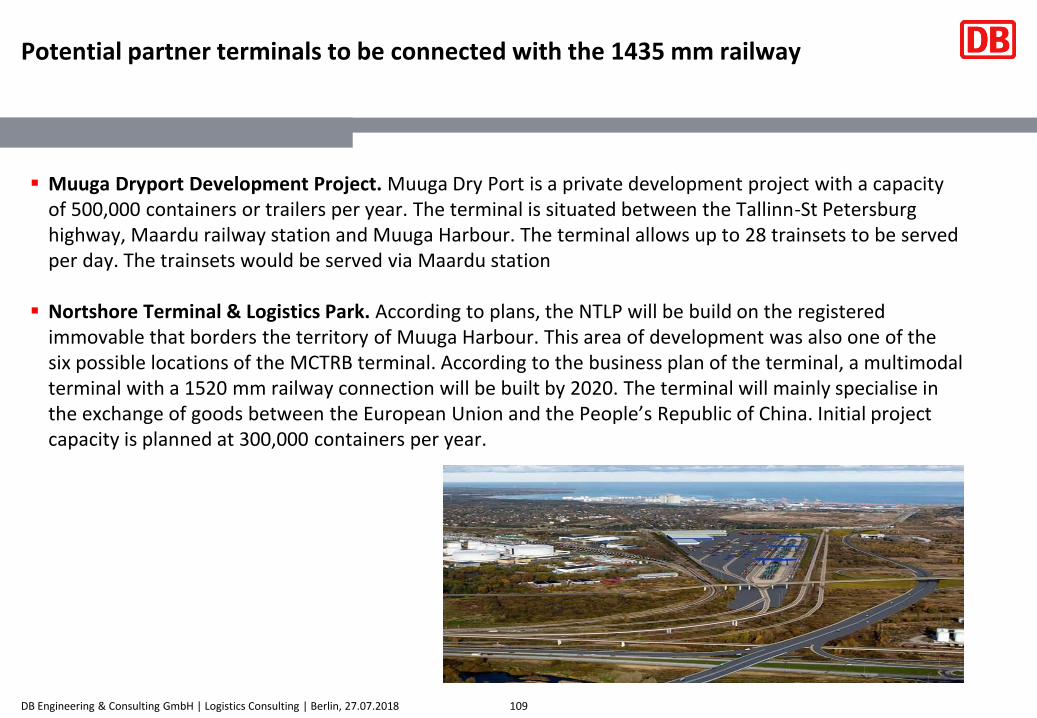
Potential partner terminals to be connected with the 1435 mm railway
▪ Muuga Dryport Development Project. Muuga Dry Port is a private development project with a capacity of 500,000 containers or trailers per year. The terminal is situated between the Tallinn-St Petersburg highway, Maardu railway station and Muuga Harbour. The terminal allows up to 28 trainsets to be served per day. The trainsets would be served via Maardu station
▪ Nortshore Terminal & Logistics Park. According to plans, the NTLP will be build on the registered immovable that borders the territory of Muuga Harbour. This area of development was also one of the six possible locations of the MCTRB terminal. According to the business plan of the terminal, a multimodal terminal with a 1520 mm railway connection will be built by 2020. The terminal will mainly specialise in the exchange of goods between the European Union and the People’s Republic of China. Initial project capacity is planned at 300,000 containers per year.
110
1 Work package 1: Analysis of existing situation
2 Work package 2: Analysis of technical and spatial needs of MCTRB
3 Work package 3: Evaluation of alternative offers
Work package 3.4: A cost-benefit analysis (CBA)
Work package 3.1: Identification of terminal functions and technological needs
Work package 3.2: The most important interest groups
Work package 3.3: Technological and operational profile
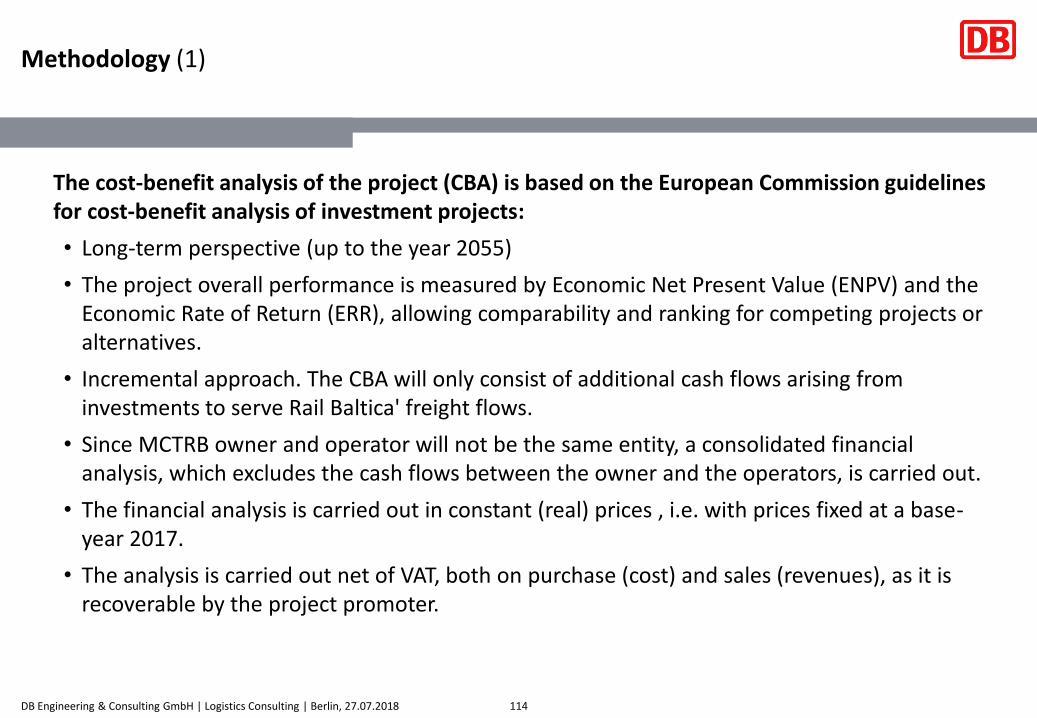
The cost-benefit analysis of the project (CBA) is based on the European Commission guidelines for cost-benefit analysis of investment projects:
• Long-term perspective (up to the year 2055)
• The project overall performance is measured by Economic Net Present Value (ENPV) and the Economic Rate of Return (ERR), allowing comparability and ranking for competing projects or alternatives.
• Incremental approach. The CBA will only consist of additional cash flows arising from investments to serve Rail Baltica' freight flows.
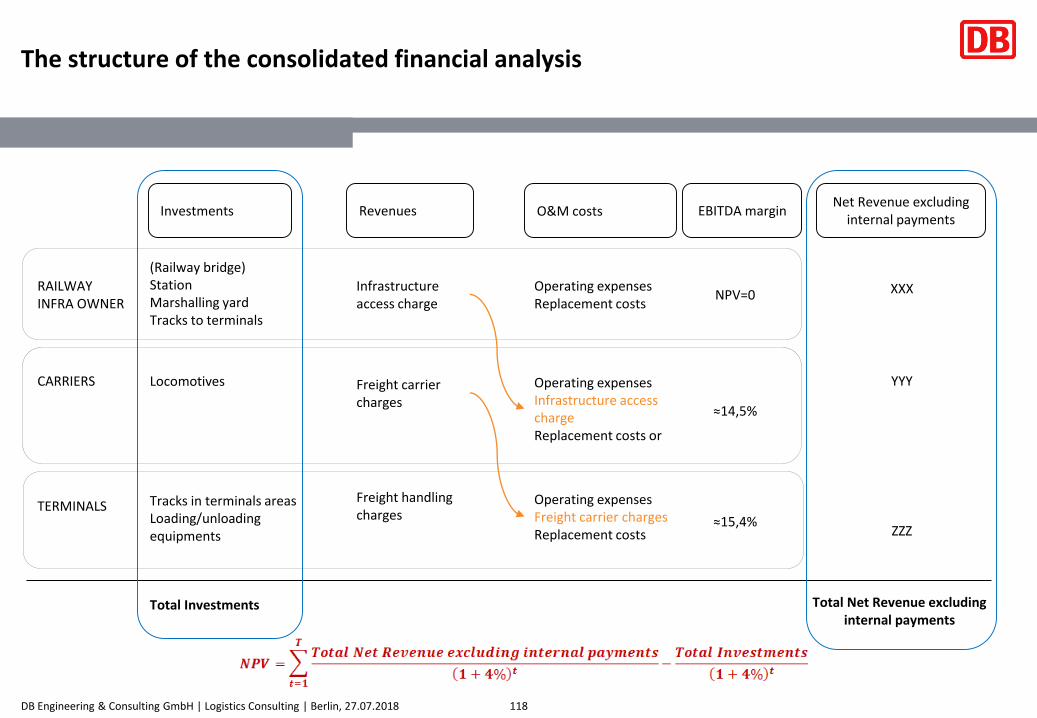
• Since MCTRB owner and operator will not be the same entity, a consolidated financial analysis, which excludes the cash flows between the owner and the operators, is carried out.
• The financial analysis is carried out in constant (real) prices , i.e. with prices fixed at a base-year 2017.
• The analysis is carried out net of VAT, both on purchase (cost) and sales (revenues), as it is recoverable by the project promoter.
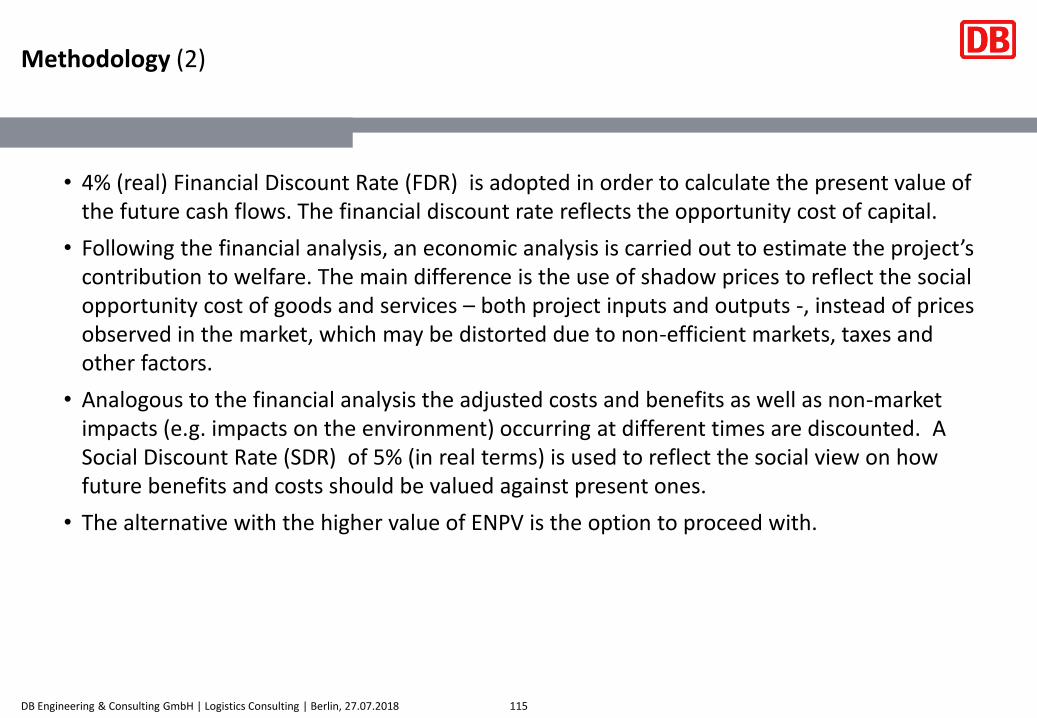
• 4% (real) Financial Discount Rate (FDR) is adopted in order to calculate the present value of the future cash flows. The financial discount rate reflects the opportunity cost of capital.
• Following the financial analysis, an economic analysis is carried out to estimate the project’s contribution to welfare. The main difference is the use of shadow prices to reflect the social opportunity cost of goods and services – both project inputs and outputs -, instead of prices observed in the market, which may be distorted due to non-efficient markets, taxes and other factors.
• Analogous to the financial analysis the adjusted costs and benefits as well as non-market impacts (e.g. impacts on the environment) occurring at different times are discounted. ASocial Discount Rate (SDR) of 5% (in real terms) is used to reflect the social view on how future benefits and costs should be valued against present ones.
• The alternative with the higher value of ENPV is the option to proceed with.
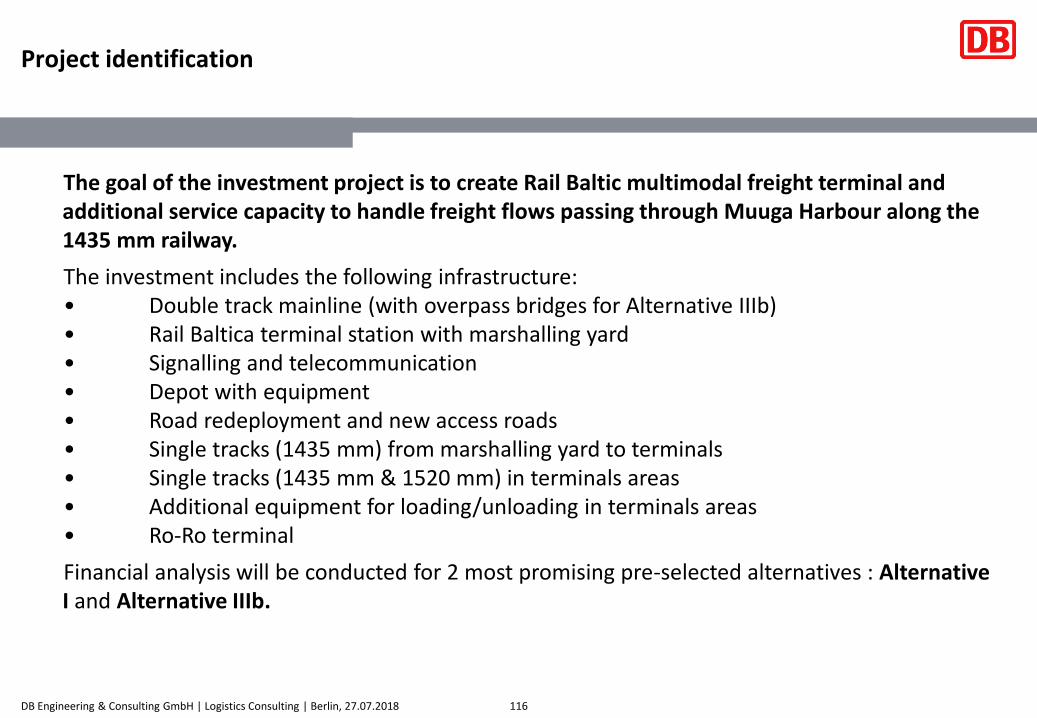
The goal of the investment project is to create Rail Baltic multimodal freight terminal and additional service capacity to handle freight flows passing through Muuga Harbour along the 1435 mm railway.
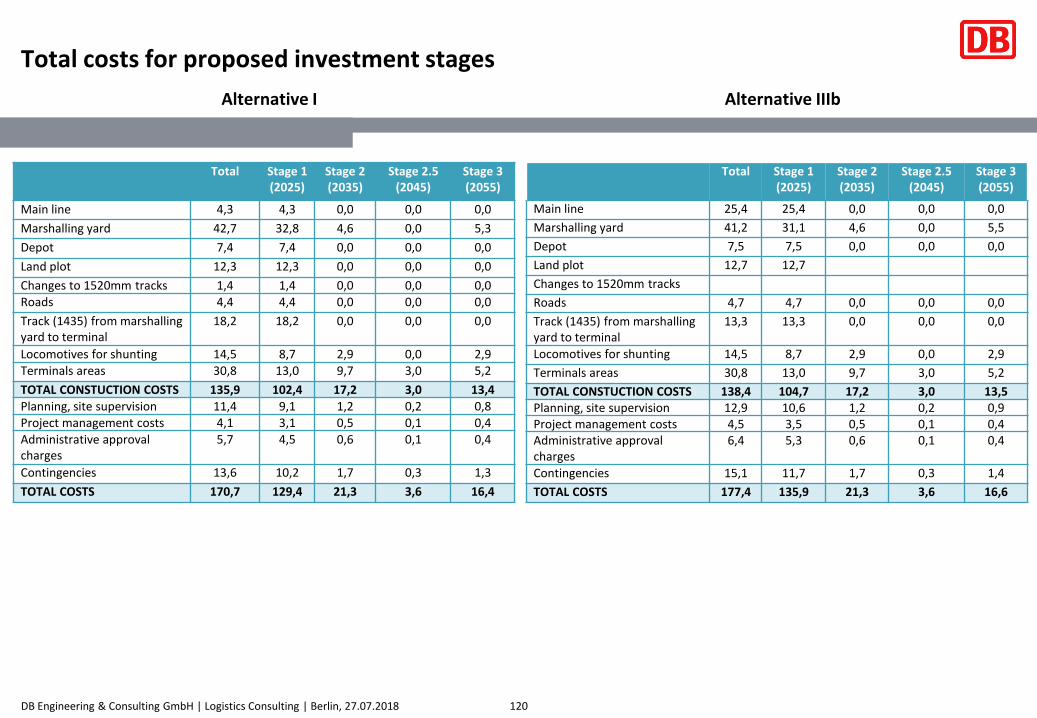
The investment includes the following infrastructure:• Double track mainline (with overpass bridges for Alternative IIIb)• Rail Baltica terminal station with marshalling yard• Signalling and telecommunication• Depot with equipment• Road redeployment and new access roads• Single tracks (1435 mm) from marshalling yard to terminals• Single tracks (1435 mm & 1520 mm) in terminals areas• Additional equipment for loading/unloading in terminals areas• Ro-Ro terminal
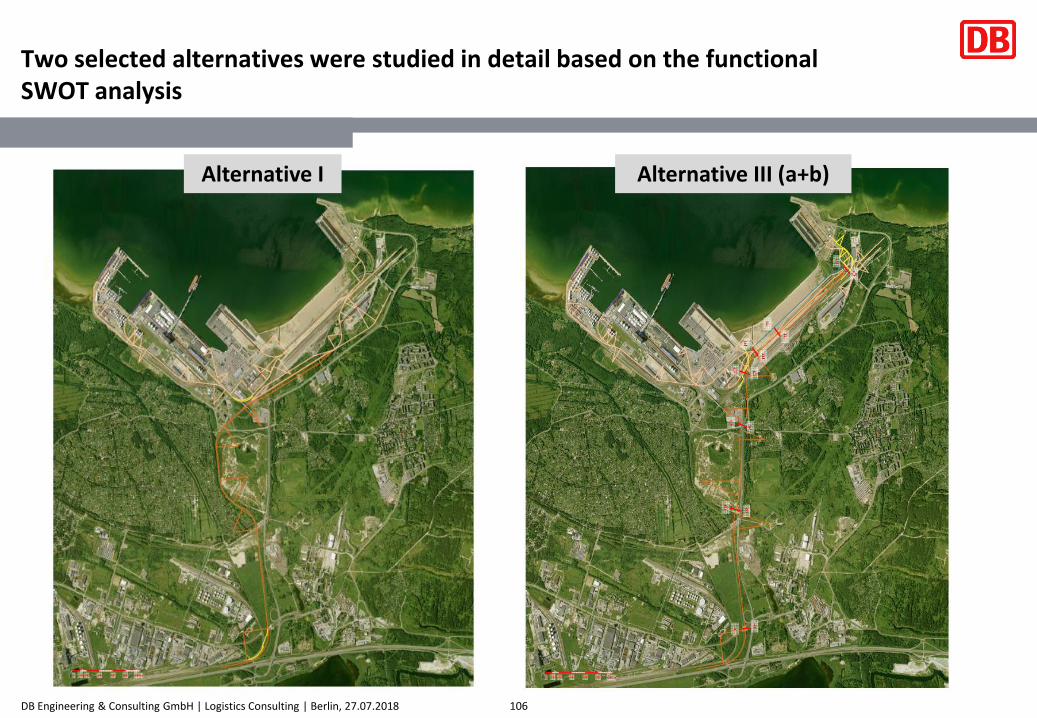
Financial analysis will be conducted for 2 most promising pre-selected alternatives : Alternative I and Alternative IIIb.
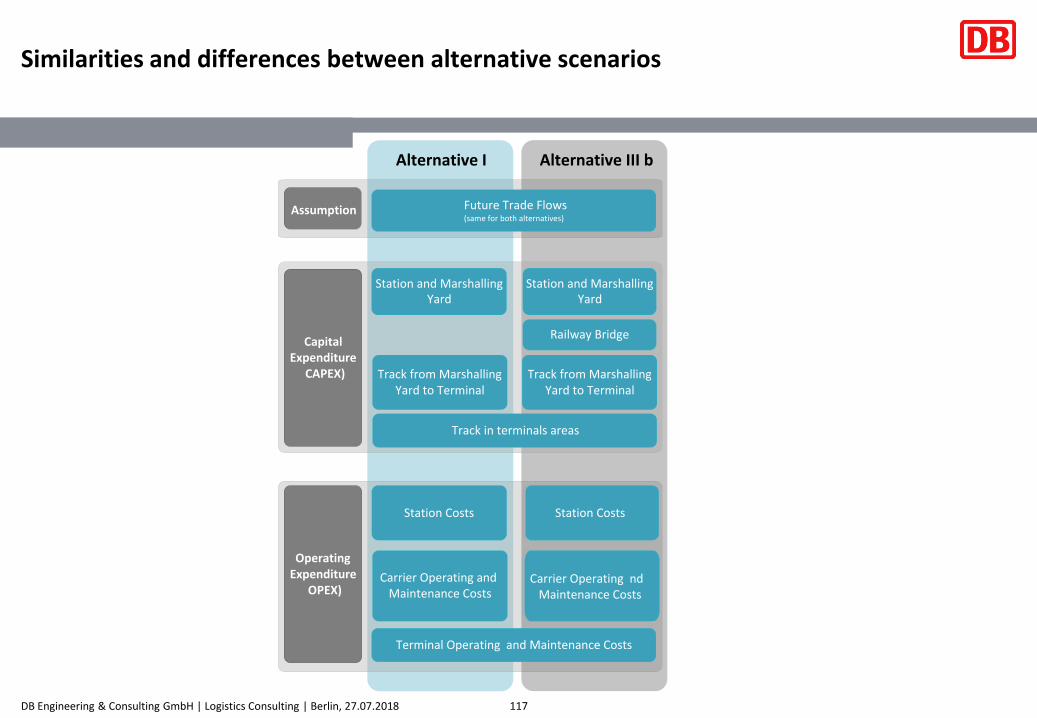
Similarities and differences between alternative scenarios
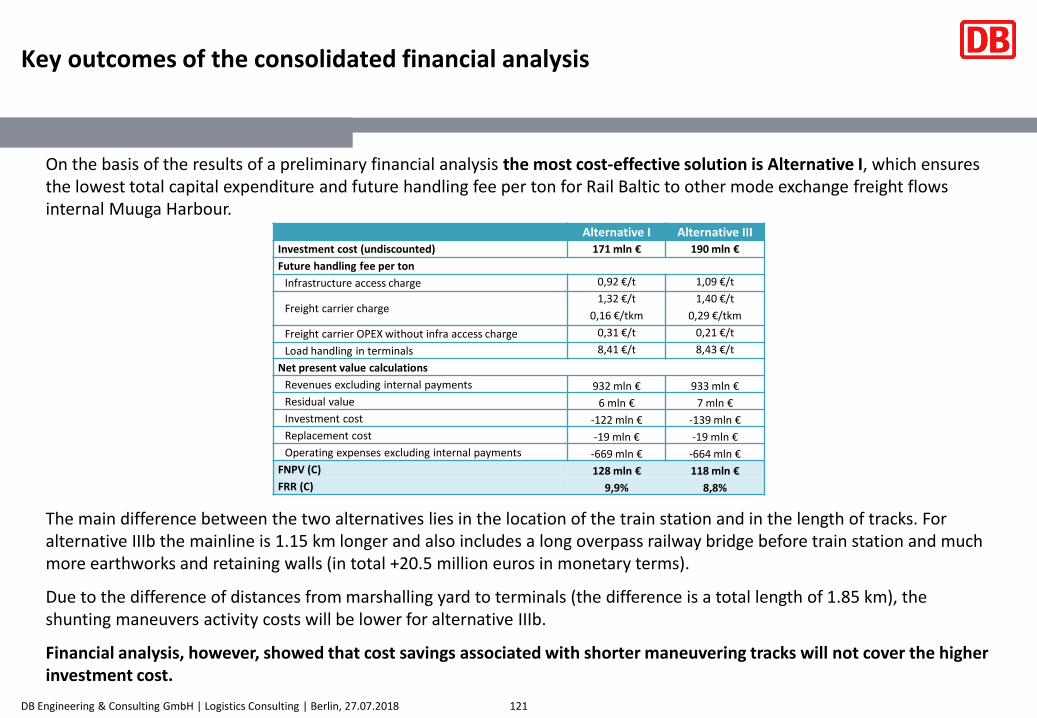
Alternative I Alternative IIIInvestment cost (undiscounted) 171 mln € 190 mln €
Future handling fee per ton
Infrastructure access charge 0,92 €/t 1,09 €/t
Freight carrier charge1,32 €/t 1,40 €/t
0,16 €/tkm 0,29 €/tkm
Freight carrier OPEX without infra access charge 0,31 €/t 0,21 €/t
Load handling in terminals 8,41 €/t 8,43 €/t
Net present value calculations
Revenues excluding internal payments 932 mln € 933 mln €
Residual value 6 mln € 7 mln €
Investment cost -122 mln € -139 mln €
Replacement cost -19 mln € -19 mln €
Operating expenses excluding internal payments -669 mln € -664 mln €
FNPV (C) 128 mln € 118 mln €
FRR (C) 9,9% 8,8%
On the basis of the results of a preliminary financial analysis the most cost-effective solution is Alternative I, which ensures the lowest total capital expenditure and future handling fee per ton for Rail Baltic to other mode exchange freight flows internal Muuga Harbour.
The main difference between the two alternatives lies in the location of the train station and in the length of tracks. For alternative IIIb the mainline is 1.15 km longer and also includes a long overpass railway bridge before train station and much more earthworks and retaining walls (in total +20.5 million euros in monetary terms).
Due to the difference of distances from marshalling yard to terminals (the difference is a total length of 1.85 km), the shunting maneuvers activity costs will be lower for alternative IIIb.
Financial analysis, however, showed that cost savings associated with shorter maneuvering tracks will not cover the higher investment cost.
As in the financial analysis, the economic analysis will be conducted for the 2 most promising pre-selected alternatives: Alternative I and Alternative IIIb.
The main difference between the alternatives arises from capital expenditures and operating costs, while associated externalities are similar for each alternative.
• As part of the economic analysis, identifiable fiscal transfer payments will be eliminated from the project cash flow. These include basic transfers, like payment involving salaries (income tax) and other taxes (fuel and electricity excise taxes). The net financial flows for each year of analysis have therefore been adjusted by applying coefficients to remove social taxes as well as fuel and electricity excise taxes.
• In the CBA the objective is to appraise the social value of the investment. In some situations observed prices do not provide a fair measure of the social opportunity costs. This is usually due to market distortions. This issue is addressed by adopting conversion factors to convert from financial costs to economic costs.
The second step of the economic analysis is to include in the appraisal those project impacts that are relevant for society, but for which a market value is not available.
Non-market impacts are evaluated by using the method of long-run marginal costs. The main economic cost and benefit of externalities can be divided into two categories:
• Alternatives-dependent ones arising directly from MCTRB as handling the extra freight flows bring extra costs to the local environment – increase in noise and air pollution and negative climate change.
• Undistributed benefits and costs from the Rail Baltica Global Project as MCTRB is part of the overall Rail Baltic project and it shares the economic costs and benefits of the global Rail Baltic project as well (air pollution reduction, climate change mitigation, noise reduction, travel time savings, travel safety increase etc).
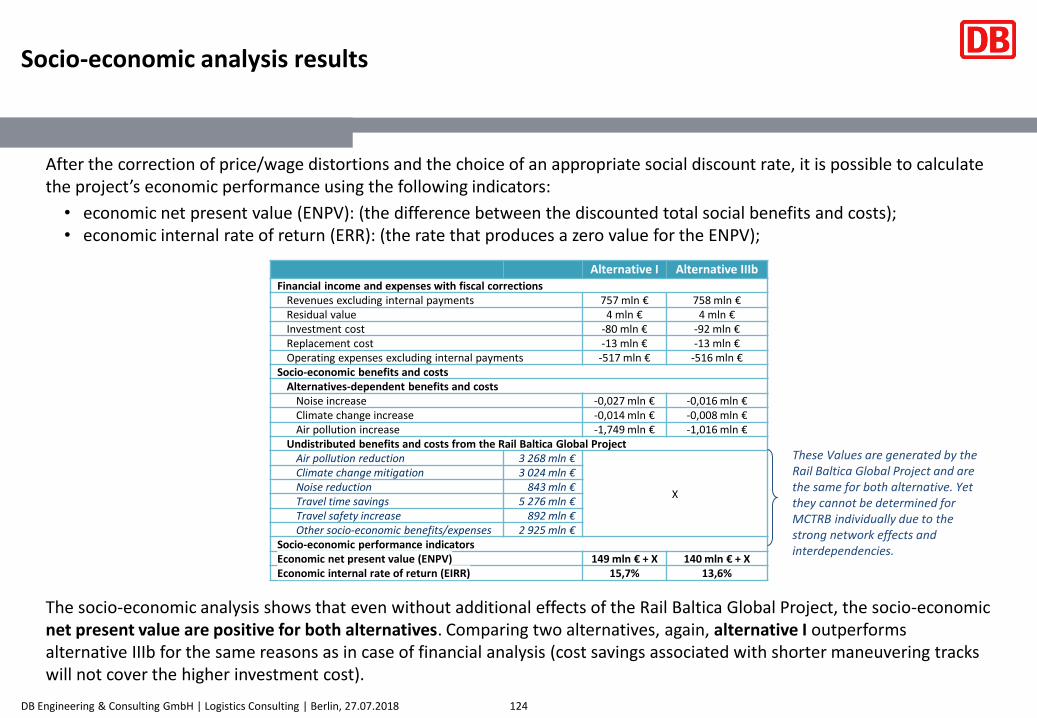
After the correction of price/wage distortions and the choice of an appropriate social discount rate, it is possible to calculate the project’s economic performance using the following indicators:
• economic net present value (ENPV): (the difference between the discounted total social benefits and costs);• economic internal rate of return (ERR): (the rate that produces a zero value for the ENPV);
The socio-economic analysis shows that even without additional effects of the Rail Baltica Global Project, the socio-economic net present value are positive for both alternatives. Comparing two alternatives, again, alternative I outperforms alternative IIIb for the same reasons as in case of financial analysis (cost savings associated with shorter maneuvering tracks will not cover the higher investment cost).
Alternative I Alternative IIIbFinancial income and expenses with fiscal corrections
Revenues excluding internal payments 757 mln € 758 mln €Residual value 4 mln € 4 mln €Investment cost -80 mln € -92 mln €Replacement cost -13 mln € -13 mln €Operating expenses excluding internal payments -517 mln € -516 mln €
Socio-economic benefits and costsAlternatives-dependent benefits and costs
Noise increase -0,027 mln € -0,016 mln €Climate change increase -0,014 mln € -0,008 mln €Air pollution increase -1,749 mln € -1,016 mln €
Undistributed benefits and costs from the Rail Baltica Global ProjectAir pollution reduction 3 268 mln €
X
Climate change mitigation 3 024 mln €Noise reduction 843 mln €Travel time savings 5 276 mln €Travel safety increase 892 mln €Other socio-economic benefits/expenses 2 925 mln €
Socio-economic performance indicatorsEconomic net present value (ENPV) 149 mln € + X 140 mln € + XEconomic internal rate of return (EIRR) 15,7% 13,6%
These Values are generated by theRail Baltica Global Project and are the same for both alternative. Yetthey cannot be determined forMCTRB individually due to thestrong network effects and interdependencies.
125
1 Work package 1: Analysis of existing situation
4 Work package 4: Action plan implementation, initial design
2 Work package 2: Analysis of technical and spatial needs of MCTRB
3 Work package 3: Evaluation of alternative offers
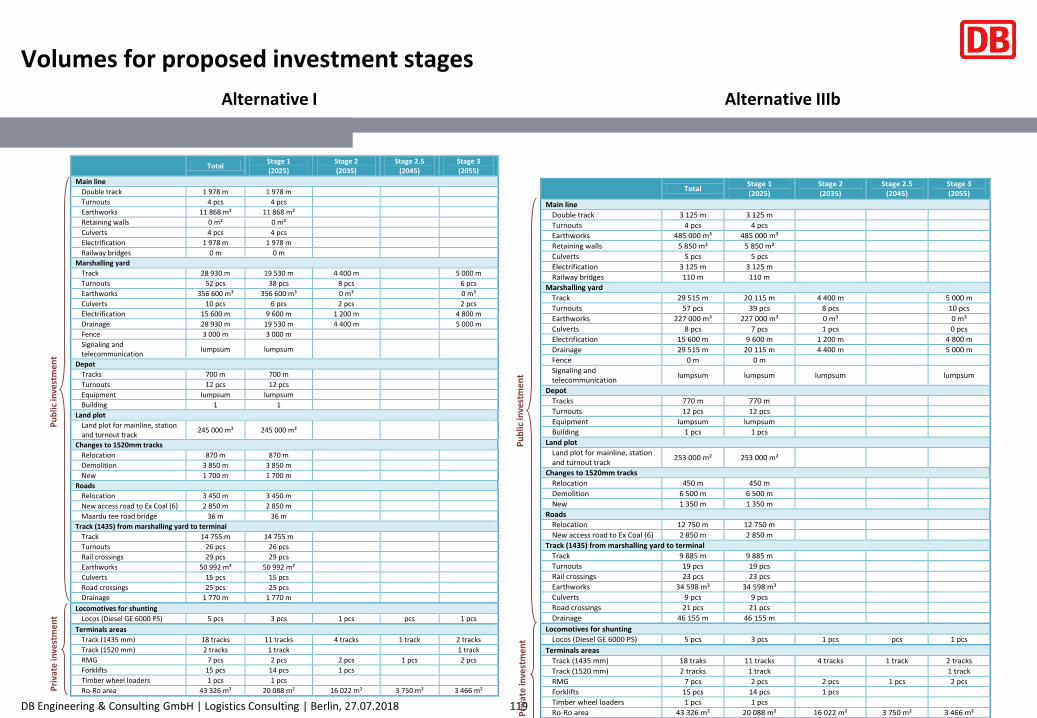
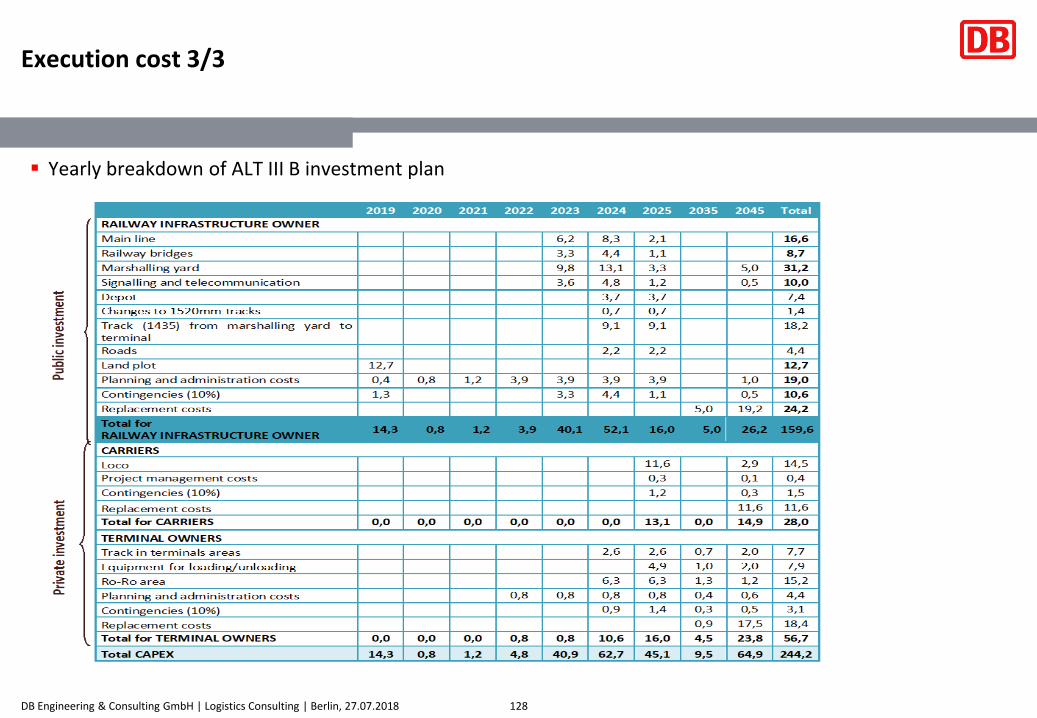
▪ Execution costs were calculated for Alternative I and Alternative IIIb. Both alternatives were phased for the years of 2025, 2035 and 2045. The most crucial period is the first phasing period where the main functionalities of a marshalling yard and connecting infrastructure will be developed.
▪ Phasing of 2035 and 2045 would involve mainly replacement costs of the phase 1 and 2 investments, partial expansion of the marshalling yard and additional expansion of the technical capacities of the terminals operated by private entities.
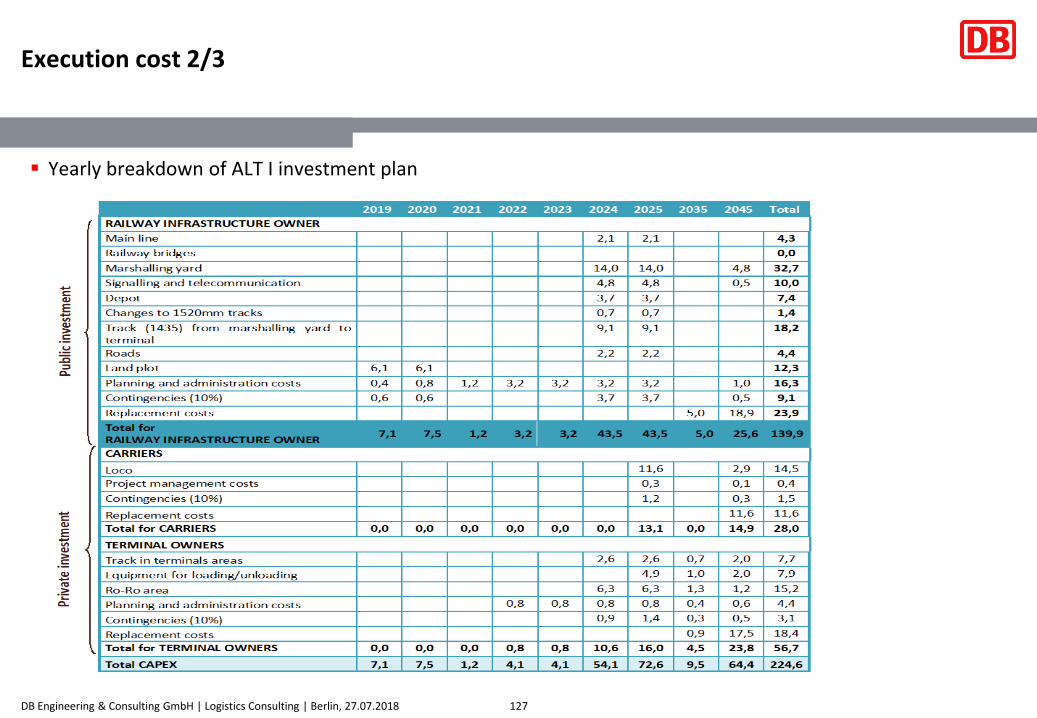
▪ The biggest infrastructure expenditures will be foreseen for the years 2023 and 2024. This is when marshalling yard phase one and the connecting rails to terminals will be developed. Connections to the terminals are designed to sustain the demand to the very end of the forecasting period. In addition to railway infrastructure, roads, bridges, culverts and other associated technical infrastructure will be built. Public investment will be followed by private investment to the terminals. These are mainly terminal inner tracks, loading equipment, parking spots, ramps etc. Final elements of private investment component are locomotives and rolling stock.
▪ For both alternatives investment costs are split between the public and private sector as following: main line, bridges, station, marshalling yard, depot and tracks to terminals are public investments (the totals highlighted in yellow); tracks in terminals areas, loading/unloading equipment, Ro-Ro area and locomotives for shunting are private investments.
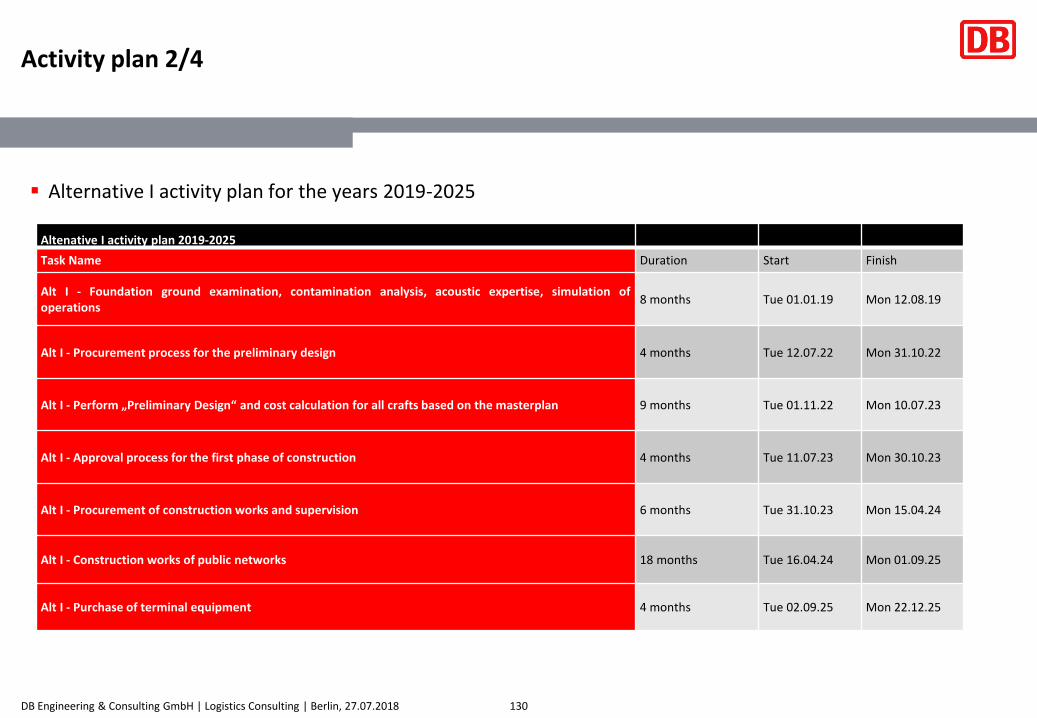
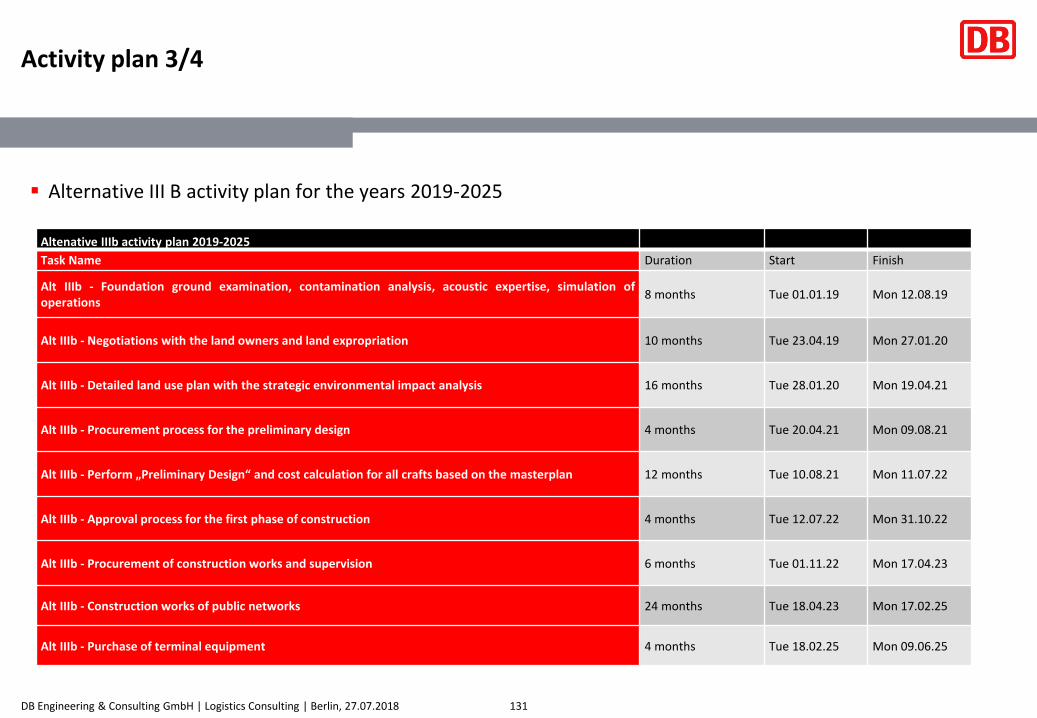
▪ Activity plan consists of necessary preparatory activities such as general examination of the sites, spatial planning activities, environmental analysis, procurement procedures, approval management, construction activities and the terminal equipment purchase
▪ For both alternatives January 1st, 2019 was applied as the starting date. In creating the suitable project execution timeframe, we benchmarked similar projects in Europe and assessed the most common risks in the context of Muuga terminal.
▪ According to the timetable, the phase one of both alternatives, alt I and IIIb, can be finalized by the end of 2025. For the construction phase one (phase 2025 with the start date of RB January 1, 2016) at least four parallel running sequences should be carried out with independent contracts between 2019-2025: base infrastructure construction contract (drainage, embankment etc), communications construction contract (electricity, automatics, telecommunications), train communication and management construction contract, civil engineering construction contract (roads, bridges), rail infrastructure construction contract .
▪ While most of these contracts could be executed as design and build (yellow FIDIC) contracts, there are few crucial elements that probably cannot be done like this. ERTMS and train communication and management systems for example should be fully designed before construction tender. This and other elements of construction management issues should be studied in the form of separate analysis (construction logistics).
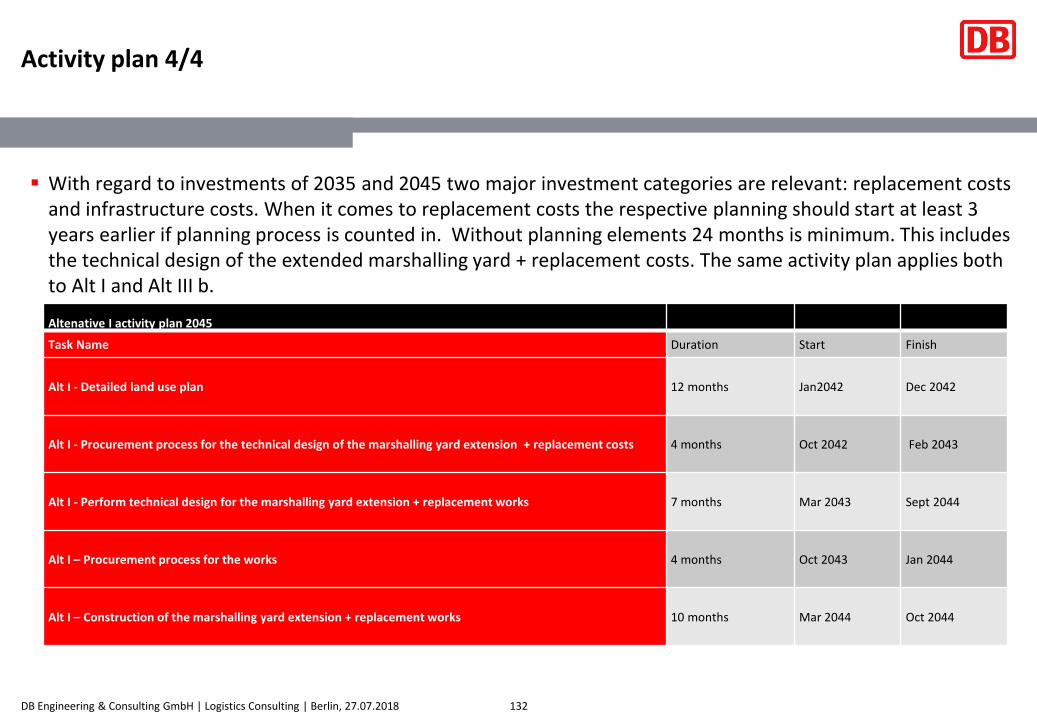
▪ With regard to investments of 2035 and 2045 two major investment categories are relevant: replacement costs and infrastructure costs. When it comes to replacement costs the respective planning should start at least 3 years earlier if planning process is counted in. Without planning elements 24 months is minimum. This includes the technical design of the extended marshalling yard + replacement costs. The same activity plan applies both to Alt I and Alt III b.
Altenative I activity plan 2045
Task Name Duration Start Finish
Alt I - Detailed land use plan 12 months Jan2042 Dec 2042
Alt I - Procurement process for the technical design of the marshalling yard extension + replacement costs 4 months Oct 2042 Feb 2043
Alt I - Perform technical design for the marshalling yard extension + replacement works 7 months Mar 2043 Sept 2044
Alt I – Procurement process for the works 4 months Oct 2043 Jan 2044
Alt I – Construction of the marshalling yard extension + replacement works 10 months Mar 2044 Oct 2044
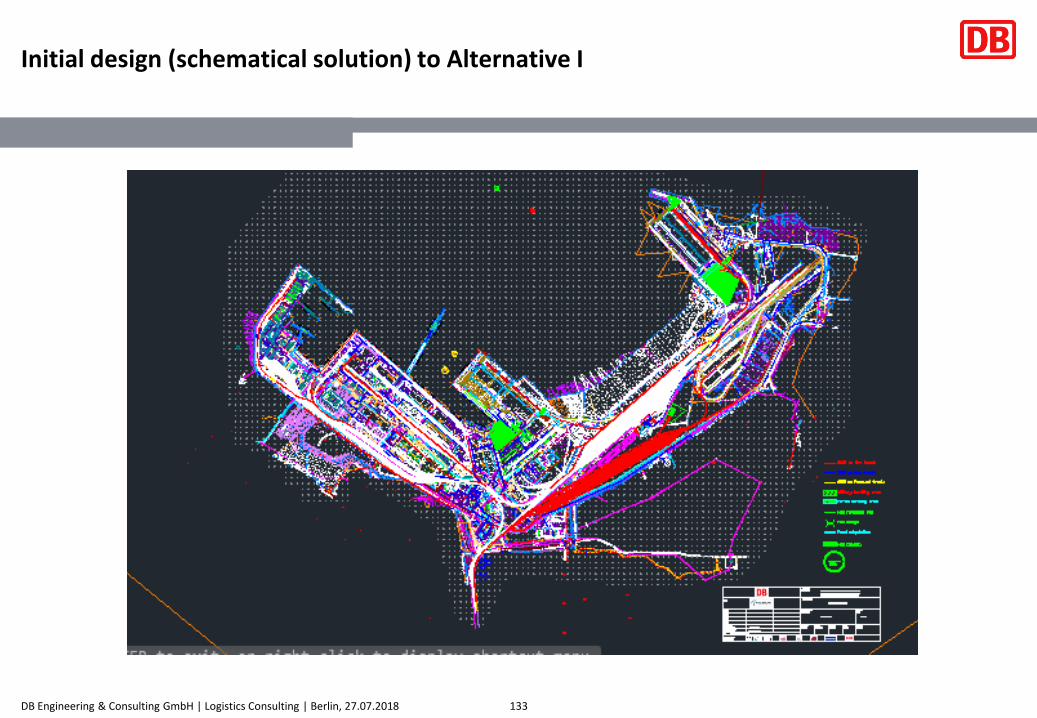
Initial design (schematical solution) to Alternative I