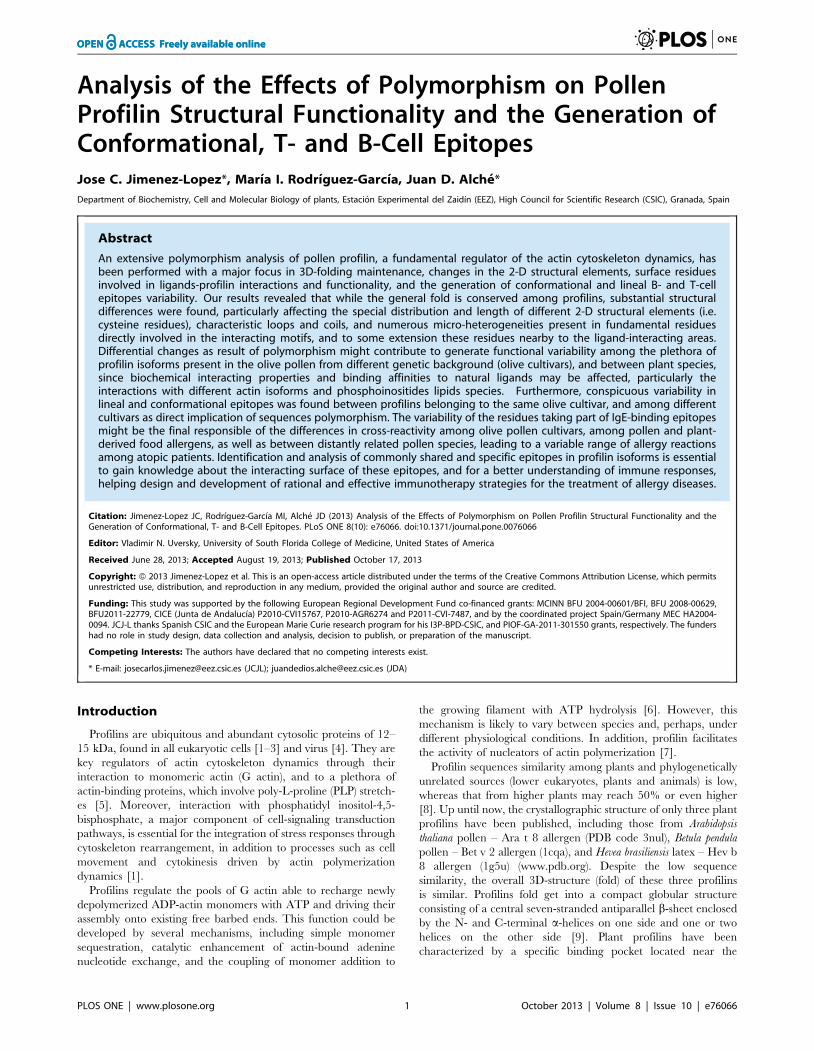
Analysis of the Effects of Polymorphism on Pollen Profilin Structural Functionality and the Generation of Conformational, T- and B-Cell Epitopes Jose C. Jimenez-Lopez*, Marı´a I. Rodrı ´guez-Garcı´a, Juan D. Alche ´ * Department of Biochemistry, Cell and Molecular Biology of plants, Estacio ´ n Experimental del Zaidı ´n (EEZ), High Council for Scientific Research (CSIC), Granada, Spain Abstract An extensive polymorphism analysis of pollen profilin, a fundamental regulator of the actin cytoskeleton dynamics, has been performed with a major focus in 3D-folding maintenance, changes in the 2-D structural elements, surface residues involved in ligands-profilin interactions and functionality, and the generation of conformational and lineal B- and T-cell epitopes variability. Our results revealed that while the general fold is conserved among profilins, substantial structural differences were found, particularly affecting the special distribution and length of different 2-D structural elements (i.e. cysteine residues), characteristic loops and coils, and numerous micro-heterogeneities present in fundamental residues directly involved in the interacting motifs, and to some extension these residues nearby to the ligand-interacting areas. Differential changes as result of polymorphism might contribute to generate functional variability among the plethora of profilin isoforms present in the olive pollen from different genetic background (olive cultivars), and between plant species, since biochemical interacting properties and binding affinities to natural ligands may be affected, particularly the interactions with different actin isoforms and phosphoinositides lipids species. Furthermore, conspicuous variability in lineal and conformational epitopes was found between profilins belonging to the same olive cultivar, and among different cultivars as direct implication of sequences polymorphism. The variability of the residues taking part of IgE-binding epitopes might be the final responsible of the differences in cross-reactivity among olive pollen cultivars, among pollen and plant- derived food allergens, as well as between distantly related pollen species, leading to a variable range of allergy reactions among atopic patients. Identification and analysis of commonly shared and specific epitopes in profilin isoforms is essential to gain knowledge about the interacting surface of these epitopes, and for a better understanding of immune responses, helping design and development of rational and effective immunotherapy strategies for the treatment of allergy diseases. Citation: Jimenez-Lopez JC, Rodrı ´guez-Garcı ´a MI, Alche ´ JD (2013) Analysis of the Effects of Polymorphism on Pollen Profilin Structural Functionality and the Generation of Conformational, T- and B-Cell Epitopes. PLoS ONE 8(10): e76066. doi:10.1371/journal.pone.0076066 Editor: Vladimir N. Uversky, University of South Florida College of Medicine, United States of America Received June 28, 2013; Accepted August 19, 2013; Published October 17, 2013 Copyright: ß 2013 Jimenez-Lopez et al. This is an open-access article distributed under the terms of the Creative Commons Attribution License, which permits unrestricted use, distribution, and reproduction in any medium, provided the original author and source are credited. Funding: This study was supported by the following European Regional Development Fund co-financed grants: MCINN BFU 2004-00601/BFI, BFU 2008-00629, BFU2011-22779, CICE (Junta de Andalucı ´a) P2010-CVI15767, P2010-AGR6274 and P2011-CVI-7487, and by the coordinated project Spain/Germany MEC HA2004- 0094. JCJ-L thanks Spanish CSIC and the European Marie Curie research program for his I3P-BPD-CSIC, and PIOF-GA-2011-301550 grants, respectively. The funders had no role in study design, data collection and analysis, decision to publish, or preparation of the manuscript. Competing Interests: The authors have declared that no competing interests exist. * E-mail: [email protected] (JCJL); [email protected] (JDA) Introduction Profilins are ubiquitous and abundant cytosolic proteins of 12– 15 kDa, found in all eukaryotic cells [1–3] and virus [4]. They are key regulators of actin cytoskeleton dynamics through their interaction to monomeric actin (G actin), and to a plethora of actin-binding proteins, which involve poly-L-proline (PLP) stretch- es [5]. Moreover, interaction with phosphatidyl inositol-4,5- bisphosphate, a major component of cell-signaling transduction pathways, is essential for the integration of stress responses through cytoskeleton rearrangement, in addition to processes such as cell movement and cytokinesis driven by actin polymerization dynamics [1]. Profilins regulate the pools of G actin able to recharge newly depolymerized ADP-actin monomers with ATP and driving their assembly onto existing free barbed ends. This function could be developed by several mechanisms, including simple monomer sequestration, catalytic enhancement of actin-bound adenine nucleotide exchange, and the coupling of monomer addition to the growing filament with ATP hydrolysis [6]. However, this mechanism is likely to vary between species and, perhaps, under different physiological conditions. In addition, profilin facilitates the activity of nucleators of actin polymerization [7]. Profilin sequences similarity among plants and phylogenetically unrelated sources (lower eukaryotes, plants and animals) is low, whereas that from higher plants may reach 50% or even higher [8]. Up until now, the crystallographic structure of only three plant profilins have been published, including those from Arabidopsis thaliana pollen – Ara t 8 allergen (PDB code 3nul), Betula pendula pollen – Bet v 2 allergen (1cqa), and Hevea brasiliensis latex – Hev b 8 allergen (1g5u) (www.pdb.org). Despite the low sequence similarity, the overall 3D-structure (fold) of these three profilins is similar. Profilins fold get into a compact globular structure consisting of a central seven-stranded antiparallel b-sheet enclosed by the N- and C-terminal a-helices on one side and one or two helices on the other side [9]. Plant profilins have been characterized by a specific binding pocket located near the PLOS ONE | www.plosone.org 1 October 2013 | Volume 8 | Issue 10 | e76066
Transcript
Analysis of the Effects of Polymorphism on PollenProfilin Structural Functionality and the Generation ofConformational, T- and B-Cell EpitopesJose C. Jimenez-Lopez*, Marıa I. Rodrıguez-Garcıa, Juan D. Alche*
Department of Biochemistry, Cell and Molecular Biology of plants, Estacion Experimental del Zaidın (EEZ), High Council for Scientific Research (CSIC), Granada, Spain
Abstract
An extensive polymorphism analysis of pollen profilin, a fundamental regulator of the actin cytoskeleton dynamics, hasbeen performed with a major focus in 3D-folding maintenance, changes in the 2-D structural elements, surface residuesinvolved in ligands-profilin interactions and functionality, and the generation of conformational and lineal B- and T-cellepitopes variability. Our results revealed that while the general fold is conserved among profilins, substantial structuraldifferences were found, particularly affecting the special distribution and length of different 2-D structural elements (i.e.cysteine residues), characteristic loops and coils, and numerous micro-heterogeneities present in fundamental residuesdirectly involved in the interacting motifs, and to some extension these residues nearby to the ligand-interacting areas.Differential changes as result of polymorphism might contribute to generate functional variability among the plethora ofprofilin isoforms present in the olive pollen from different genetic background (olive cultivars), and between plant species,since biochemical interacting properties and binding affinities to natural ligands may be affected, particularly theinteractions with different actin isoforms and phosphoinositides lipids species. Furthermore, conspicuous variability inlineal and conformational epitopes was found between profilins belonging to the same olive cultivar, and among differentcultivars as direct implication of sequences polymorphism. The variability of the residues taking part of IgE-binding epitopesmight be the final responsible of the differences in cross-reactivity among olive pollen cultivars, among pollen and plant-derived food allergens, as well as between distantly related pollen species, leading to a variable range of allergy reactionsamong atopic patients. Identification and analysis of commonly shared and specific epitopes in profilin isoforms is essentialto gain knowledge about the interacting surface of these epitopes, and for a better understanding of immune responses,helping design and development of rational and effective immunotherapy strategies for the treatment of allergy diseases.
Citation: Jimenez-Lopez JC, Rodrıguez-Garcıa MI, Alche JD (2013) Analysis of the Effects of Polymorphism on Pollen Profilin Structural Functionality and theGeneration of Conformational, T- and B-Cell Epitopes. PLoS ONE 8(10): e76066. doi:10.1371/journal.pone.0076066
Editor: Vladimir N. Uversky, University of South Florida College of Medicine, United States of America
Received June 28, 2013; Accepted August 19, 2013; Published October 17, 2013
Copyright: � 2013 Jimenez-Lopez et al. This is an open-access article distributed under the terms of the Creative Commons Attribution License, which permitsunrestricted use, distribution, and reproduction in any medium, provided the original author and source are credited.
Funding: This study was supported by the following European Regional Development Fund co-financed grants: MCINN BFU 2004-00601/BFI, BFU 2008-00629,BFU2011-22779, CICE (Junta de Andalucıa) P2010-CVI15767, P2010-AGR6274 and P2011-CVI-7487, and by the coordinated project Spain/Germany MEC HA2004-0094. JCJ-L thanks Spanish CSIC and the European Marie Curie research program for his I3P-BPD-CSIC, and PIOF-GA-2011-301550 grants, respectively. The fundershad no role in study design, data collection and analysis, decision to publish, or preparation of the manuscript.
Competing Interests: The authors have declared that no competing interests exist.
20% of the sequences in Corylus avellana showed Ala in the position
25, 10% and 30% showed Gly in position 69 in Phleum pratense and
Zea mays, respectively, in addition to 90% of the residues in
position 72 in Olea europaea L.
Pollen Profilin Polymorphism
PLOS ONE | www.plosone.org 2 October 2013 | Volume 8 | Issue 10 | e76066
Sequence polymorphism may also be responsible of the changes
in the spatial distribution of the skeleton alpha carbons, which is
reflected in differences between the structures of profilins. These
differences can be measured by superimposition of structures using
the RMSD parameter, which showed the following values: 3nul vs.
1cqa = 0.79 A, 3nul vs. 1g5uA = 0.79 A and 1g5uA vs.
1cqa = 0.87 A.
Furthermore, one of the key forces in the maintenance of the
proteins 3D-structure (the presence of intra-molecular disulphide
bridges) was analyzed. Different number of cysteines was present
in the sequences of different species (Table S3), among which the
olive displayed the largest differences [8]. Depending on the olive
cultivar analyzed, one to three cysteines were detected in 1.03%,
57.74% and 27.83% of the olive sequences, respectively. Further
analysis of the possible combinations of SH-bonds indicated that
the most feasible bond corresponding to that established between
C13–C118 in profilin sequences containing 2 or 3 cysteines (Table
S3A), which are the most energetically favorable.
The analysis of 2-D elements showed the most characteristic
folding motifs of profilin, integrated by 7 b-strands sandwiched
between the N- and C-terminal, nearly parallel N-terminal a-
helices H1 and C-terminal H3 on one side and the middle
perpendicular helix H2 on the other side [10]. Remarkable
differences were found when individual sequences were analyzed.
i.e. the N-terminal a-helix 1 was longer in those profilins of Olea
europaea L. and Betula pendula built on the basis of the 1cqa model,
in comparison to the other models (1g5uA and 3nul) (Table S1).
Our results indicate that polymorphism affected external loops
of the profilins structure, particularly the loop comprised by the
residues 18 to 20 (Figure 1). We found a deletion of one or three
amino acids in those profilin sequences built on the basis of the
1cqa model in Betulaceae or Poaceae species and several other
sequences of Olea europaea L. In addition, we found b-sheet 2
(residues 22 to 28) partially substituted by a a-helix in Betula pendula
profilin sequences, and completely substituted in profilin sequences
for Phleum pratense and Corylus avellana [8].
Moreover, olive profilin sequences which conserved the
complete loop 1, exhibited micro-heterogeneities in this region.
70% of the profilin showed a motif 18HEG20 and 14.5% showed
the sequence 18HED20, changing a neutral residue as Gly (G) by
and acidic residue such as Asp (D), with a voluminous radical.
Betula pendula showed a deletion in this loop, losing the histidine in
position 18, in addition to a micro-heterogeneity in position 20,19QA20 and 19QG20. Two profilin sequences in Corylus avellana
missed the three amino acids motif of this loop, and the rest of
sequences showed a deletion in position 18, displaying the motif19QG20.
The 3-D structure exhibited conspicuous differences (Figure 1).
First, the number of exposed residues of profilin is different
according to the templates used for modeling, making variable the
contact surface of the profilin analyzed (Figure 1A). Second, there
are noticeable differences in the spatial distribution and orienta-
tion of different 2-D elements such as the N-terminal a-helix,
particularly in profilins built based in the 1cqa template. b-sheets
2, 3 and 4 are substituted by three loops in those profilins modeled
on the basis of the 1g5uA model, and b-sheet 5 is shorter in these
profilins compared to the ones built on the basis of the other two
models (1cqa and 3nul). A small a-helix 3 is present in 1g5uA, but
missing in profilins based in the 1cqa and 3nul models (Figure 1B).
A major structural difference between plant profilins and those
profilins from other Fila is the presence of a plant specific solvent-
filled pocket, previously identified in Arabidopsis [10]. This
represents a unique feature of plant profilins, since it is missing
from Acanthamoeba and bovine profilins [20,21]. The conservational
analysis of this signature showed that this is relatively well
conserved among plant profilins. Only few variations were
Figure 1. Surface distribution analysis of the profilin polymorphism. Different colors were used to highlight the different degree ofvariability over the surface for the three models used in this study, A) 1cqa, B) 1g5uA, and C) 3nul models. Residues which variability were high(variability index value, viv.3) were depicted in yellow color. Residues with intermediate (1,viv.3) and low (viv,1) variability were depicted asgreen and blue, respectively [102–104]. Surface residues implicated in ligand-binding domains (actin, PLP and/or PIP) were highlighted withtransparent white shadows over the protein surface and discontinues borders lines. Red dotted circles and red arrows pointed a detailed plantspecific solvent-filled cavity.doi:10.1371/journal.pone.0076066.g001
Pollen Profilin Polymorphism
PLOS ONE | www.plosone.org 3 October 2013 | Volume 8 | Issue 10 | e76066
detected among the residues integrating the pocket, and they were
particularly present in profilins built with the template 1g5uA
(Figure 2).
Polymorphism affecting ligands-binding surfaces: solventaccessible area, electrostatic potential and conservationalanalysis
A comparative analysis of the variability of profilin’s key
residues involved in the interaction with ligands such as actin, PLP
and PIP (Figure 1) was depicted over the surface structure of the
1cqa (Figure 2A), 1g5uA (Figure 2B), and 3nul (Figure 2C),
models. The degree of variability was highlighted with different
colors, i.e. highly variable, viv.3 (yellow color), putative variable,
3,viv.2 (green color), and low variability, viv,1 (blue color).
This analysis showed that most of the variable residues and
putative variable residues (Figure 2) were present across the
surface, and particularly near to the ligand-binding domains
(Figure 1). Few of these variable residues were located within PIP-
interacting areas, or in the regions of contact with actin (Figure 1B
and Figure 2).
Furthermore, the analysis of the polymorphism present in the
individual key amino acids of profilin with a central role in the
[24,25,26] showed that they also have a major contribution in
terms of surface accessibility (SAS.25%) (Figure 1A: left, central
and right panel). In particular, these residues displayed in bold
presented a higher variability. Additionally, olive profilin sequenc-
es also exhibited high variability in the residues G62, Q79 and A82.
Our results indicated that the actin-binding surface was well
conserved in all profilins. Only few variable residues, i.e. H62, Q79
were located in this area directly implicated in the interaction with
actin and taking part of the plant specific solvent-filled pocket
(Figure 1C; Figure 2). Analysis of the adjacent residues, which also
integrate PLP- and PIP-binding regions, and maintain the
connectivity and stability in these binding domains, revealed
differences in the variability index, which may affect the
interacting properties with natural partners [8].
The highest variability was found in the L130 and E131 residues
located in the PIP-binding surface (Table S4A) for the 5 species
analyzed, as well as some particular residues in olive profilins such
as D8 and Q79 (Table S4B).
Figure 2. Profilin structure features, ligand-binding domains and electrostatic potential distribution. Left, central, and right panelrepresent to 1g5uA, 1cqa, and 3nul models, respectively. A) Solvent accessible surface area (SASA) calculated for the residues of each crystallographicmodel. Key amino acids implicated in Actin, PLP and PIP interaction are highlighted with orange, blue and purple arrows, respectively. A red dottedline delimited the residues with SASA.25%. B) Three-dimensional structure of profilin models 1g5uA, 1cqa, and 3nul (from left to right panel)showing two views rotated 180u. Different secondary structural elements such as a-helices, b-sheets, and loops are highlighted with letters H, S,respectively. All structures were depicted as a cartoon diagram. C) Surface representation views of the three models of profilins rotated 90u, showingthe surface residues involved in the different ligand-binding surfaces such as actin (orange), PLP (light blue), and PIP (purple). Residues belonging toactin-PIP and PLP-PIP binding regions are highlighted with red and deep blue colors, respectively. Red dotted circles and red arrows point a detailedof the plant specific solvent-filled cavity. D) 90u rotated views of the electrostatic potential representation on the three profilin models surface,showing the plant specific solvent-filled cavity highlighted by yellow dotted lines and arrows. The surface colors are clamped at red (25) or blue (+5).E) Electrostatic potential (isocontour value of 65 kT/e) surface for the three models of profilins are depicted in 3 rotated 90u views.doi:10.1371/journal.pone.0076066.g002
Pollen Profilin Polymorphism
PLOS ONE | www.plosone.org 4 October 2013 | Volume 8 | Issue 10 | e76066
Furthermore, we analyzed the variability of the 84(A/
V)VIRGKKG(T/S/A)GGIT(V/I)KKT100 motif, found in all
plant profilin but PpPRO1 from Phleum pratense [27], which has
been described to be involved in the phosphatidylinositol-4,5-
bisphosphate functional interaction, and take part of the MAP
kinase phosphorylation domain [28]. Micro-heterogeneities were
found in two positions of the Phl p 12 profilins (A/V84RR, and
I86RT, Uniprot accession number X77583 and DQ663541,
respectively) from Phleum pratense, and five positions of the Ole e 2
profilin (I86RV, DQ317563; I86RT, DQ138358 and DQ663555;
V/S97RS, DQ317574; V/S97RT, DQ317570; and K99RE,
DQ138352 and DQ138354) from Olea europaea L.
Electrostatic potential analysis of profilins revealed a net charge
of 28 (12.78% negative and 6.77% positive) for the group of
profilins built with the template 1cqa, 27 (13.85% negative and
8.46% positive) for 3nul and 6 (12.21% negative and 7.63%
positive) for 1g5uA (Figure 1D: left, central and right panel). These
electrostatic potentials are in agreement with the average
percentage of negative and positive charges for olive sequence:
11.53% and 6.72% for 1cqa, 10.25% and 6.27% for 3nul, 11.98%
and 6.77% for 1g5uA, respectively. Actin surface is dominated by
a negative potential in the five species analyzed. Major differences
were found in the PLP and PIP binding surfaces. The PLP-binding
surface is dominated by positive PB electrostatic potential in
profilin built with the template 1g5uA (Figure 1D: left panel), and
negative charge distribution was found mainly in profilins built
with the other two templates (Figure 1D: central and right panel).
PIP-binding regions displayed no differences (Figure 1D), since
positive and negative residues were equally distributed. Isocontour
values of 65 kT/e were depicted to highlight charge nature of the
profilin ligand-binding regions (Figure 1E).
Consurf conservational analysis of structural and functional key
amino acids showed that residues implicated in plant profilins fold
maintenance were well conserved, but several variable residues
were located in different superficial areas (Figure 3). As previously
pointed out, few residues located in the plant specific binding
pocket exhibited different degree of variability i.e. H62, Q79
(Figure 1 and Figure 3). In addition, particular olive cultivars such
as ‘Bella de Espana’, ‘Sourani’, ‘Picual’ and ‘Lucio’, as well as
maize profilin sequences showed highly variable residue in this
area, i.e. H62 and P82 (Figure 1 and Figure 3).
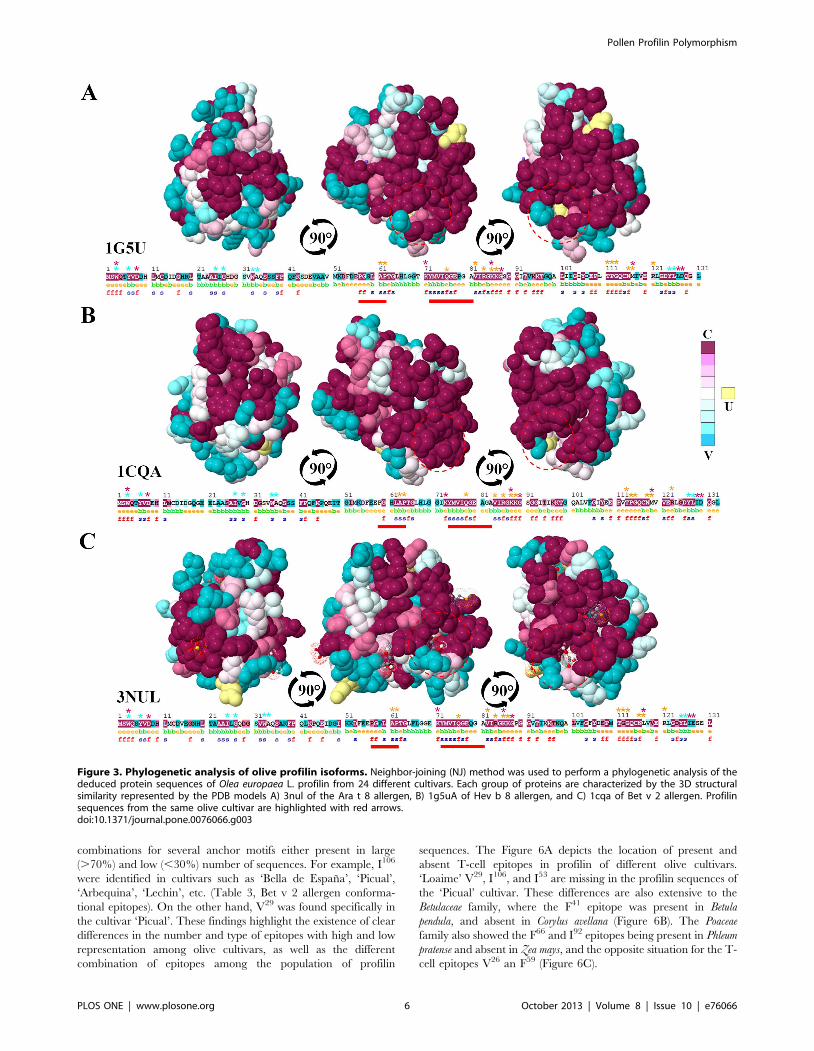
Phylogenetic analysisTo assess the relationships between olive cultivars, and to
perform individual clustering analyses profilins sequences were
grouped according to the 3D-structure template (1cqa, 1g5uA or
3nul) used to build their structure (Table S1). These analyses
showed relationships between olive cultivar sequences, since
different branches of the trees displayed groups of profilins with
similar genetic origin (highlighted with red arrows), similar
physico-chemical properties (Mw and Ip), as well as other
comparable properties such as number and combination of
posttranslational motifs (Figure 4). Figure 4A showed a closed
association for sequences of the cultivar ‘Picual’. Figure 4B
highlighted the association of the cultivars ‘Lechin de Sevilla’,
‘Leccino’ and ‘Sourani’ sequences, and Figure 4C showed the
same association for cultivars such as ‘Verdial de Velez-Malaga’,
‘Verdial de Huevar’, ‘Loaime’, ‘Bella de Espana’ or ‘Farga’.
Identification of highly antigenic regions in plant profilinsPhysicochemical parameters such as hydrophilicity, accessibil-
ity, exposed surface, and antigenic propensity of polypeptide
chains have been used to identify continuous epitopes. In this
study, antigenicity determinants were targeted by locating the
positive peaks in hydrophilicity plots, and identifying the regions of
maximum potential of antigenicity (Figure S1). Kyte-Doolitte scale
[29] was used to search hydrophobic regions in the proteins
(Figure S1, section 1). Welling antigenicity plot [30] was used to
assign an antigenicity value defined as the log of the quotient
between the percentage of antigenicity in a sample of known
antigenic regions and in average proteins (Figure S1, section 2).
Accessibility of residues (Figure S1, section 3), and 2-D structural
elements (Figure S1, section 4) were also plotted and used for the
continue epitopes assessment.
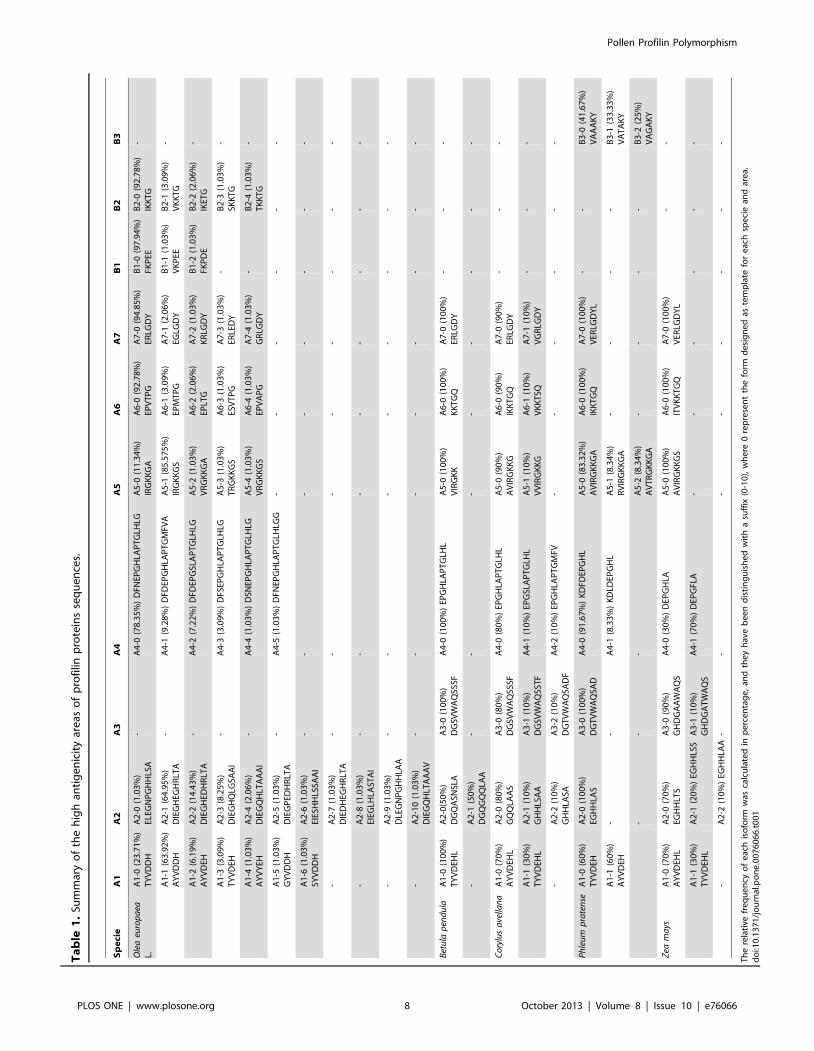
We identified up to 8 regions (A1, A2, A4 to A7, B1, and B2) in
Olea europaea L. profilins with high potential of antigenicity (Figure
S1A), 7 regions (A1 to A7) in Betula pendula (Figure S1B), 7 regions
(A1 to A7) in Corylus avellana (Figure S1C), 8 regions (A1 to A7, B3)
in Phleum pratense (Figure S1D), and 7 regions (A1 to A7) in Zea mays
profilin sequences (Figure S1E). These regions with high
antigenicity correlated well with the B- and T-cell and conforma-
tional epitopes identified and analyzed in the present study. The
most variable species in terms of number of different epitope forms
for each antigenicity region corresponds to Olea europaea L. 10
different variable forms in the regions A2, with percentages of
frequency ranging 64.05% to 1.03% were found, while the lowest
variable specie was Betula pendula with 2 different variable regions
and equal percentage, A2 (50% each antigenic form) (Table 1).
110), 9G4 (117–129), and 3H8 (163–175) prone to B-cell binding
were analyzed in the five species (Table 2). B-cell epitopes were
superimposed over the surface of the protein model 1cqa
(Figure 5A) to compare their surface distribution with T-cell
(Figure 5B) and conformational (Table 3) epitopes.
Polymorphism analysis of B-cell epitopes in olive profilin
showed low variability for 3H8 epitope. Large number of changes
was detected for 10A4, 5F2 and 9G4 epitopes, being 9A7 the most
variable region among all species analyzed (Table 2).
The highest variability in the number of different epitope forms
for each B-cell epitope corresponded to Olea europaea L. profilins,
particularly 5F2, with 10 different variable regions, and percent-
ages of frequency among sequences ranging 82.50% to 1.03%.
From these, 5F2-1 and 5F2-10 represented the higher and lower
widespread variants, respectively. The 9A7 epitope was the second
region with the higher number of epitope forms (precisely 7), with
percentages ranging 56.74% (9A7-1) to 1.03% (9A7-6 and 9A7-7).
The species with the lowest variability was Betula pendula, with only
one region for each B-cell epitope (Table 2).
Identification of T-cell epitopesVariable number of anchor motifs to HLA-DR (T-cell epitopes)
was found in the sequences of profilins of the five species analyzed
(Table 4). T-cell epitopes were superimposed over the surface of
the protein model 1cqa (Figure 5B) to compare their distribution
compared to that of B-cell (Figure 5A) and conformational
(Table 3) epitopes. T-cell epitopes were located in a delimited area
of profilin, with few residues overlapping with B-cell epitopes.
Most profilin sequences analyzed contained commonly shared
anchor motifs of HLA-DR class II (.70%) present in all species
(L70 and M76), while others motifs were species-specific, such as
F41 for Betula pendula, I53 for Olea europaea L., F59 for Zea mays or F66
for Phleum pratense. Corylus avellana was the only species without
specific motifs, although W35 was only shared by the Betulaceae
species (Table 3, Hev b 8 allergen conformational epitopes).
The polymorphism analysis of T-cell epitopes among profilins
sequences of different olive cultivars showed a high number of
Pollen Profilin Polymorphism
PLOS ONE | www.plosone.org 5 October 2013 | Volume 8 | Issue 10 | e76066
combinations for several anchor motifs either present in large
(.70%) and low (,30%) number of sequences. For example, I106
were identified in cultivars such as ‘Bella de Espana’, ‘Picual’,
‘Arbequina’, ‘Lechin’, etc. (Table 3, Bet v 2 allergen conforma-
tional epitopes). On the other hand, V29 was found specifically in
the cultivar ‘Picual’. These findings highlight the existence of clear
differences in the number and type of epitopes with high and low
representation among olive cultivars, as well as the different
combination of epitopes among the population of profilin
sequences. The Figure 6A depicts the location of present and
absent T-cell epitopes in profilin of different olive cultivars.
‘Loaime’ V29, I106, and I53 are missing in the profilin sequences of
the ‘Picual’ cultivar. These differences are also extensive to the
Betulaceae family, where the F41 epitope was present in Betula
pendula, and absent in Corylus avellana (Figure 6B). The Poaceae
family also showed the F66 and I92 epitopes being present in Phleum
pratense and absent in Zea mays, and the opposite situation for the T-
cell epitopes V26 an F59 (Figure 6C).
Figure 3. Phylogenetic analysis of olive profilin isoforms. Neighbor-joining (NJ) method was used to perform a phylogenetic analysis of thededuced protein sequences of Olea europaea L. profilin from 24 different cultivars. Each group of proteins are characterized by the 3D structuralsimilarity represented by the PDB models A) 3nul of the Ara t 8 allergen, B) 1g5uA of Hev b 8 allergen, and C) 1cqa of Bet v 2 allergen. Profilinsequences from the same olive cultivar are highlighted with red arrows.doi:10.1371/journal.pone.0076066.g003
Pollen Profilin Polymorphism
PLOS ONE | www.plosone.org 6 October 2013 | Volume 8 | Issue 10 | e76066
Identification and analysis of conformational profilinepitopes
Profilin conformational epitopes exhibited a wide distribution
over the surface of profilins (Table 3). Several of these
conformational epitopes overlapped, partially or totally with the
sequence of linear B- or T-cells epitopes described in previous
sections.
Up to 11 conformational epitopes were found for profilins built
with the structural template of the Hev b 8 allergen, 9 epitopes for
Figure 4. Profilin conservational analysis. Consurf-conservational analysis of profilin proteins showed in three individual views rotated 90u forthe PDB models A) 1g5uA, B) 1cqa, and C) 3nul, respectively. The conserved and variable residues are presented as space-filled models and coloredaccording to the conservation scores. The strictly conserved and variable residues are depicted in purple and blue, respectively. Red dotted circlesand red arrows point a detailed of the plant specific solvent-filled. The sequence of the protein is depicted with the evolutionary rates color-codedonto each site. The residues of the query sequence are always numbered starting from 1. The predicted burial status of the site (i.e. ‘‘b’’-buried vs. ‘‘e’’-exposed) is annotated under the sequence. Residues predicted to be structurally and functionally important, ‘‘s’’ and ‘‘f’’, are also pointed out underthe sequence. Amino-acid sites categorized as ‘‘Insufficient data’’ are colored in yellow, indicating that the calculation for these sites were generatedusing only a few of the homologous sequences. Orange, light blue and purple starts highlight the key amino acids implicated in the interaction withactin, PLP and PIP, respectively. Red lines under the sequences represent the profilin characteristic motif, which define this family of proteins.C = conserved, V = variable, U = undefined.doi:10.1371/journal.pone.0076066.g004
Pollen Profilin Polymorphism
PLOS ONE | www.plosone.org 7 October 2013 | Volume 8 | Issue 10 | e76066
Ta
ble
1.
Sum
mar
yo
fth
eh
igh
anti
ge
nic
ity
are
aso
fp
rofi
linp
rote
ins
seq
ue
nce
s.
Sp
eci
eA
1A
2A
3A
4A
5A
6A
7B
1B
2B
3
Ole
aeu
rop
aea
L.A
1-0
(23
.71
%)
TY
VD
DH
A2
-0(1
.03
%)
ELEG
NP
GH
HLS
A-
A4
-0(7
8.3
5%
)D
FNEP
GH
LAP
TG
LHLG
A5
-0(1
1.3
4%
)IR
GK
KG
AA
6-0
(92
.78
%)
EPV
TP
GA
7-0
(94
.85
%)
ERLG
DY
B1
-0(9
7.9
4%
)FK
PEE
B2
-0(9
2.7
8%
)IK
KT
G-
A1
-1(6
3.9
2%
)A
YV
DD
HA
2-1
(64
.95
%)
DIE
GH
EGH
RLT
A-
A4
-1(9
.28
%)
DFD
EPG
HLA
PT
GM
FVA
A5
-1(8
5.5
75
%)
IRG
KK
GS
A6
-1(3
.09
%)
EPM
TP
GA
7-1
(2.0
6%
)EG
LGD
YB
1-1
(1.0
3%
)V
KP
EEB
2-1
(3.0
9%
)V
KK
TG
-
A1
-2(6
.19
%)
AY
VD
EHA
2-2
(14
.43
%)
DIE
GH
EDH
RLT
A-
A4
-2(7
.22
%)
DFD
EPG
SLA
PT
GLH
LGA
5-2
(1.0
3%
)V
RG
KK
GA
A6
-2(2
.06
%)
EPLT
GA
7-2
(1.0
3%
)K
RLG
DY
B1
-2(1
.03
%)
FKP
DE
B2
-2(2
.06
%)
IKET
G-
A1
-3(3
.09
%)
TY
VD
EHA
2-3
(8.2
5%
)D
IEG
HQ
LGSA
AI
-A
4-3
(3.0
9%
)D
FSEP
GH
LAP
TG
LHLG
A5
-3(1
.03
%)
TR
GK
KG
SA
6-3
(1.0
3%
)ES
VT
PG
A7
-3(1
.03
%)
ERLE
DY
-B
2-3
(1.0
3%
)SK
KT
G-
A1
-4(1
.03
%)
AY
VY
EHA
2-4
(2.0
6%
)D
IEG
QH
LTA
AA
I-
A4
-4(1
.03
%)
DSN
EPG
HLA
PT
GLH
LGA
5-4
(1.0
3%
)V
RG
KK
GS
A6
-4(1
.03
%)
EPV
AP
GA
7-4
(1.0
3%
)G
RLG
DY
-B
2-4
(1.0
3%
)T
KK
TG
-
A1
-5(1
.03
%)
GY
VD
DH
A2
-5(1
.03
%)
DIE
GP
EDH
RLT
A-
A4
-5(1
.03
%)
DFN
EPG
HLA
PT
GLH
LGG
--
--
--
A1
-6(1
.03
%)
SYV
DD
HA
2-6
(1.0
3%
)EI
ESH
HLS
SAA
I-
--
--
--
-
-A
2-7
(1.0
3%
)D
IED
HEG
HR
LTA
--
--
--
--
-A
2-8
(1.0
3%
)EI
EGLH
LAST
AI
--
--
--
--
-A
2-9
(1.0
3%
)D
LEG
NP
GH
HLA
A-
--
--
--
-
-A
2-1
0(1
.03
%)
DIE
GQ
HLT
AA
AV
--
--
--
--
Bet
ula
pen
du
laA
1-0
(10
0%
)T
YV
DEH
LA
2-0
(50
%)
DG
QA
SNSL
AA
3-0
(10
0%
)D
GSV
WA
QSS
SFA
4-0
(10
0%
)EP
GH
LAP
TG
LHL
A5
-0(1
00
%)
VIR
GK
KA
6-0
(10
0%
)K
KT
GQ
A7
-0(1
00
%)
ERLG
DY
--
-
-A
2-1
(50
%)
DG
QG
QQ
LAA
--
--
--
--
Co
rylu
sa
vella
na
A1
-0(7
0%
)A
YV
DEH
LA
2-0
(80
%)
GQ
QLA
AS
A3
-0(8
0%
)D
GSV
WA
QSS
SFA
4-0
(80
%)
EPG
HLA
PT
GLH
LA
5-0
(90
%)
AV
IRG
KK
GA
6-0
(90
%)
IKK
TG
QA
7-0
(90
%)
ERLG
DY
--
-
A1
-1(3
0%
)T
YV
DEH
LA
2-1
(10
%)
GH
HLS
AA
A3
-1(1
0%
)D
GSV
WA
QSS
TF
A4
-1(1
0%
)EP
GSL
AP
TG
LHL
A5
-1(1
0%
)V
VIR
GK
KG
A6
-1(1
0%
)V
KK
TSQ
A7
-1(1
0%
)V
GR
LGD
Y-
--
-A
2-2
(10
%)
GH
HLA
SAA
3-2
(10
%)
DG
TV
WA
QSA
DF
A4
-2(1
0%
)EP
GH
LAP
TG
MFV
--
--
--
Ph
leu
mp
rate
nse
A1
-0(6
0%
)T
YV
DEH
A2
-0(1
00
%)
EGH
HLA
SA
3-0
(10
0%
)D
GT
VW
AQ
SAD
A4
-0(9
1.6
7%
)K
DFD
EPG
HL
A5
-0(8
3.3
2%
)A
VIR
GK
KG
AA
6-0
(10
0%
)IK
KT
GQ
A7
-0(1
00
%)
VER
LGD
YL
--
B3
-0(4
1.6
7%
)V
AA
AK
Y
A1
-1(6
0%
)A
YV
DEH
--
A4
-1(8
.33
%)
KD
LDEP
GH
LA
5-1
(8.3
4%
)R
VIR
GK
KG
A-
--
-B
3-1
(33
.33
%)
VA
TA
KY
--
-A
5-2
(8.3
4%
)A
VT
RG
KK
GA
--
--
B3
-2(2
5%
)V
AG
AK
Y
Zea
ma
ysA
1-0
(70
%)
AY
VD
EHL
A2
-0(7
0%
)EG
HH
LTS
A3
-0(9
0%
)G
HD
GA
AW
AQ
SA
4-0
(30
%)
DEP
GH
LAA
5-0
(10
0%
)A
VIR
GK
KG
SA
6-0
(10
0%
)IT
VK
KT
GQ
A7
-0(1
00
%)
VER
LGD
YL
--
A1
-1(3
0%
)T
YV
DEH
LA
2-1
(20
%)
EGH
HLS
SA
3-1
(10
%)
GH
DG
AT
WA
QS
A4
-1(7
0%
)D
EPG
FLA
--
--
--
-A
2-2
(10
%)
EGH
HLA
A-
--
--
--
-
Th
ere
lati
vefr
eq
ue
ncy
of
eac
his
ofo
rmw
asca
lcu
late
din
pe
rce
nta
ge
,an
dth
ey
hav
eb
ee
nd
isti
ng
uis
he
dw
ith
asu
ffix
(0-1
0),
wh
ere
0re
pre
sen
tth
efo
rmd
esi
gn
ed
aste
mp
late
for
eac
hsp
eci
ean
dar
ea.
do
i:10
.13
71
/jo
urn
al.p
on
e.0
07
60
66
.t0
01
Pollen Profilin Polymorphism
PLOS ONE | www.plosone.org 8 October 2013 | Volume 8 | Issue 10 | e76066
Bet v 2 allergen, and 10 epitopes for Ara t 8 allergen (Table 3),
with a number of amino acids ranging from 14 to 19, 10 to 19, and
10 to 18, respectively for these templates. As example of
polymorphism, conformational epitope 1 of profilins built with
the 3nul template (Figure S2) integrates part of the plant
characteristic loop situated between the N-terminal a-helix 1
and b-strand 1, which frequently exhibited insertions of three to
six amino acids in plant profilins, an numerous micro-heteroge-
neities in the residues 18 to 21, as previously described in the
current study.
A detailed comparative analysis of conformational and linear
epitopes recognized by B- and T-cell (Table S5) showed a high
degree of overlap. Frequently, both types of linear B- and T-cell
epitopes were partially overlapping in the same conformational
epitope. In addition, conformational epitopes that overlapped only
with B-cell epitopes, (i.e. C1), or T-cell epitopes, (i.e. C8), both in
profilins of Olea europaea L. built with the Hev b 8 allergen model,
were depicted in the Table 5.
Finally, we also found three conformational epitopes (epitope 1
from the model 3nul) in Olea europaea L., Phleum pratense and Corylus
avellana, which did not overlap with either B- or T-cell linear
epitopes. The central residue of this epitope 1, G17, belongs to the
plant profilin characteristic loop situated between the position 18
and 21 (Figure S2), which exhibited high variability in the number
and type of residues.
Discussion
Polymorphism affecting ligand-binding domains andstructural features might contribute to generatefunctional variability among profilin
The identification of profilin sequences in databases has focused
on data comparison searches for sequence homology within the
open reading frames of profilin genes. Profilin sequences from
diverse origins (not only from species distantly related) may show
less than 25% overall homology [31]. Profilins within a given
kingdom display higher sequence homology than those between
different ones. This is particularly evident when the comparison is
made between plant and animal profilins, particularly for the
actin-binding surface of plant profilins, which is only partially
conserved in animal profilins [10].
Profilin from mammals and plants exhibit a well conserved
overall fold. However, major differences have been observed in
structural 2-D elements, particularly when their length and spatial
distribution are compared among different classes of profilin
[9,10,32,33]. Many of these differences are located within three
characteristic loops, which allow distinguishing plant profilins from
those of other kingdoms [10]. Two of these loops form the
characteristic plant solvent-filled pocket, identified for the first time
in Arabidopsis [10]. This pocket integrates part of the actin-binding
domain. Our results indicated that the first loop between b-sheet 4
and 5 showed a high level of polymorphism in the surface residues.
The level of variability was higher compared with the second loop
situated between b-strands 5 and 6, close the PIP binding domain.
In addition, the third loop situated between the N-terminal a-helix
1 and b-strand 1, presented a high degree of variability [10], and a
characteristic insertion of three to six amino acids. This particular
insertion is missing in several olive profilin sequences [8,34,35].
Based on the wide distribution and frequency of micro-heteroge-
neities of plant profilin (i.e. tobacco [36], and olive [8,34,35]), the
presence of both common but also differential functional features
among the plethora of plant profilin isoforms could be expected.
However functional redundancy may be conceivable among these
isoforms, i.e. profilins from unrelated species (plants and mam-
mals) which share low sequence identity (<20%) can fulfill similar
functions [37], in addition to substitute each other in living cells
[38]. These observations are also supported by the structural
similarities observed between Acanthamoeba and mammalian
profilins [39,40].
On the other hand, the analysis of profilin 3D structure and
surface characteristics may point out and supports the existence of
specific isoforms of profilins with differential functionality, due to
specific location of micro-heterogeneities, particularly affecting the
2-D elements and structural interacting surface domains with
natural ligands. Multiple sequences of olive profilin have been
found to exhibit variations in the length of the 2-D elements and
their spatial distribution, variable geometry of the surface-
interacting domains and variation in the electrostatic potential.
These 2-D elements are critical for the interaction with partners
like actin or PLP [10]. In addition, they affect the activity/function
of the protein and regulate these interactions. Local superimpo-
sitions of profilin structures were performed by the Ca of the
amino acid sequences, which allowed distinguish several different
differences affecting these 2-D structural elements. However, only
small dissimilates in RMSD were observed, which confirmed the
conservation of the general fold of the plant profilins. Further-
more, larger differences were observed in the profilin structures
after performing superimpositions using the radical carbons of
each amino acid, which led to major disparities in the contact
surface of the interacting domains. Local differences (stereochem-
ical properties) in 2-D structural elements have been also found in
the N-terminal region (b-sheet 1), which is partially or totally
substituted by and a-helix as consequence of the sequence
variability. This structural substitution is in agreement with one
amino acid deletion found in Betula pendula [8,13], or three residues
in Corylus avellana [8], Phleum pratense [8,35,41], and Zea mays [8,42].
Little is known about the implications of the cysteines in the
protein folding and 3D structure maintenance of profilin. Presence
of hydrogen bonds and electrostatic interaction between different
atoms are also common and important forces orchestrating protein
structure [43]. Dimeric profilin forms of Hevea brasiliensis (crystal
structure 1g5uA) showed 4 hydrogen bonds and 84 non-bonded
contacts in between the a-helices H1 and H4, being these the
major forces involved in maintaining the protein structure. This
also occurs in other proline-rich proteins (http://www.cathdb.
info/pdb/1g5u), while no disulphide bridges were found. Fur-
thermore, human profilin II (hPROFII) contains three cysteine
residues (C12, C15, y C16) located in a conserved loop in between
a-helix H1 and b-sheet S1. No disulphide bridges were found in
this structure, where loop conformation is preserved by a network
of hydrogen bonds [44].
Olive profilins exhibit a variable number of cysteines among
cultivars sequences. The most energetically favorable pair of
cysteines to form a disulfide bridge involved the couple C13–C118
in the sequences containing 2 or 3 cysteines, which is also in
agreement with previous observations [45]. Such a variable
number of cysteines found among olive profilins would suggest
that cysteines might have not a large relevance in profilin 3D
structure and fold preservation. However, the presence of a
disulphide bond would be necessary to maintain the correct
distance between both the C- and N-terminal in order to preserve
the stability of the PLP interacting surface [46]. The present study
suggest that only a restricted number of disulfide bridges (Table
S3) showed thermodynamical and stereological compatible values
[47], particularly for the pair C13–C118 in olive, or C13 and C115/
1117 in Corylus avellana, Phleum pratense and Zea mays.
Experimental data are still waiting for confirmation of profilin
intra and/or intermolecular bonds. Up until now, some results
Pollen Profilin Polymorphism
PLOS ONE | www.plosone.org 9 October 2013 | Volume 8 | Issue 10 | e76066
Figure 5. B- and T-cell epitopes superimposition on the surface of the profilin structures. A) Cartoon representation of profilin model1cqa two views rotated 180u respectively, showing the localization of 5 B-cell epitopes, 10A4 (red), 5F2 (green), 9A7 (blue), 9G4 (yellow), and 3H8(pink), in the 2-D structural elements of the protein. Overlapping sequence of 9A7 and 9G4 epitopes are depicted with vertical yellow lines. Allepitopes are integrated by final part of two a-helices and its corresponding flanking loops, or a b-sheet. Surface superimposition of epitopes shows abroad distribution. B) Cartoon representation of profilin model 1cqa two views rotated 180u respectively, showing the localization of 5 T-cell specie-specific epitopes, I53 (orange) by Olea europaea L., F41 (red) for Betula pendula, F66 (light blue) for Phleum pratense, and F59 (green), for Zea mays, in the2-D structural elements of the protein. Partial overlapping epitopes are I53 and F56. Surface superimposition of epitopes shows the distribution in aspecific area of the protein and not overlapping with B-cell epitopes.doi:10.1371/journal.pone.0076066.g005
Pollen Profilin Polymorphism
PLOS ONE | www.plosone.org 10 October 2013 | Volume 8 | Issue 10 | e76066
have shed some light about the formation of multimeric structures
in human [48], B. pendula and A. vulgaris [49] profilins. Hydrogen
bonds and electrostatic interactions would play an important role
in the formation of this macromolecular complex, since these
forms are resistant to treatments with reducer agents [50].
However, arguments are in favor of the existence of cysteine
bridges protected in cavities or clefts, safe from the effect of
reducing agents. Thus, the formation of Cys - Cys bridges would
be dependent on the cellular red-ox conditions of defined cellular
compartments were they would be localized [51]. Moreover, the
presence of dimeric and multimeric forms of profilin is not
incompatible with a correct profilin functionality, since interaction
with natural ligands still may occurs as previously found in human
profilin I and II, which are able to induce actin polymerization
[52]. Moreover, it has been demonstrated that tetrameric forms of
human profilins are also implicated in the maintenance of cellular
morphology and contribute to signaling pathways [53].
In the present study, the analysis of the polymorphism present in
the olive profilin isoforms, and more precisely, in those motifs
interacting with profilin natural-partners has revealed a different
degree of variability in key residues involved in these interactions.
The extension of this variability also affected to amino acids
localized in close proximity to these interacting areas, with strong
energetic and stereochemical influence in the structural mainte-
nance of these motifs, although not directly implicated in the
interaction surface itself. This variability would affect a number of
interacting properties such as the affinity between profilin and
different ligands (i.e. actin, ATP, PIP [42,54]), generating
differences among isoforms, and therefore contributing to increase
the functional variability of profilins. In this regard, functional
variability would be a cellular mechanism able to face different
stress and physiological conditions [55].
The analysis of the extension of the polymorphism between
profilin isoforms has shown that the actin binding motif is not
totally conserved, particularly these residues located in the plant
specific solvent-filled pocket [10], as well as those residues directly
implicated in the regulation of profilin interactions with PIP [56]
and PI3K [57]. On the contrary, residues involved in binding
PLP-stretches have shown to be not particularly affected by
polymorphism. Interactions of profilin isoforms with numerous
proline-rich proteins are finely regulated by phosphorylation,
which may change the affinity properties of these interactions
Table 2. Summary of the variability in B-cell epitopes of profilin proteins sequences.
The relative frequency of each isoform was calculated in percentage, and they have been distinguished with a suffix (0-10). Variable residues have been highlighted withbold and bigger size letters.doi:10.1371/journal.pone.0076066.t002
Pollen Profilin Polymorphism
PLOS ONE | www.plosone.org 11 October 2013 | Volume 8 | Issue 10 | e76066
[57,58]. Clear examples of targeting residues susceptible of
phosphorylation are tyrosines 6 and 128 in olive cultivars [8].
Changes in these two residues may indicate that polymorphism
somehow is implicated the regulation of these interactions by
generating posttranslational variability instead of a direct implica-
tion in the PLP-profilin interaction, since no residues directly
implicated in this interaction were affected by polymorphism [59].
Thus, phosphorylation variability within PLP domains might be a
fundamental regulatory process, able to generate additional,
differential interacting properties [60], and regulate profilin
activities under different environmental conditions with different
partners [61].
Polymorphism analysis of phosphoinositides lipid interacting
surface in profilin showed high variability, particularly for the
residues Leu130 and Glu131, directly implicated in this interaction.
The variability of these residues may be the final responsible for
the regulation of this interaction [31,52,62], since mutagenesis in
these positions have shown change affinity properties of different
profilin isoforms for different PIP lipids species such as (PI(3,4)P2
and PI(3,4,5)P2) [63]. Thus, differences in the affinity for PIP
molecular interactions would constitute a mechanism to regulate
Table 3. Conformational epitopes of profilin proteins sequences.
Hevea brasiliensis (Hev b 8 allergen)
Epitope Central residue Conformational epitopes sequences N6 of residues
Central residue of each epitope is highlighted with a box. Epitopes were built in the allergenic proteins Hev b 8 (Hevea brasiliensis, AJ243325, Q9LEI8), Bet v 2 (Betulapendula, M65179, P25816), and Ara t 8 (Arabidopsis thaliana, U43325, Q42449).doi:10.1371/journal.pone.0076066.t003
Pollen Profilin Polymorphism
PLOS ONE | www.plosone.org 12 October 2013 | Volume 8 | Issue 10 | e76066
Ta
ble
4.
Co
mp
aris
on
of
anch
or
mo
tifs
toH
LA-D
Rcl
ass
II(T
-ce
lle
pit
op
es)
inth
ese
qu
en
ces
of
pro
filin
pro
tein
sse
qu
en
ces.
A)
Ole
ae
uro
pae
aL
.B
etu
lap
en
du
laC
ory
lus
ave
llan
aP
hle
um
pra
ten
seZ
ea
may
s
V2
9V
28
V2
8-
V2
6
-W
35
W3
5-
-
-F4
1-
--
F45
F44
-F4
2F3
9
I53
--
--
--
--
F59
L68
--
M6
5L6
5
--
-F6
6-
L70
L6
9L
69
V6
7L
67
M7
6M
75
M7
5M
73
M7
3
I86
--
I83
I83
I95
I94
I94
I92
-
B)
Ole
ae
uro
pae
aL
.C
ult
iva
rsF
irst
resi
du
eo
fth
eH
LD
-DR
cla
ssII
an
cho
rm
oti
fs
V2
9F
45
I53
L6
8L
70
M7
6I8
6I9
5I1
06
‘Ace
bu
che
’X
‘Arb
eq
uin
a’X
‘Be
llad
eEs
pan
a’X
‘Bla
nq
ue
ta’
X
‘Le
chin
de
Gra
nad
a’X
‘Le
chin
de
Sevi
lla’
X
‘Mo
rru
t’X
‘Pic
ual
’X
XX
‘Pic
ud
o’
X
‘Se
ville
nca
’X
‘So
ura
ni’
X
‘Ve
rdia
ld
eV
ele
z-M
alag
a’X
A)
Init
iala
min
oac
ido
fth
ean
cho
rm
oti
fsto
HLA
-DR
clas
sII
wit
hh
igh
fre
qu
en
cy(f
req
ue
ncy
.7
0%
)am
on
gp
rofi
linse
qu
en
ces.
Spe
cifi
cm
oti
fsar
eh
igh
ligh
ted
wit
hb
oxe
s,an
dth
ese
com
mo
nsh
are
dam
on
gal
lsp
eci
es
are
hig
hlig
hte
din
bo
ld.
B)
Co
mp
aris
on
of
anch
or
mo
tifs
toH
LA-D
Rcl
ass
IIm
ore
fre
qu
en
tin
the
seq
ue
nce
so
fp
rofi
lins
for
dif
fere
nt
oliv
ecu
ltiv
ars.
Th
ein
itia
lre
sid
ue
of
the
anch
or
mo
tifs
for
spe
cifi
can
dco
mm
on
shar
ed
T-c
ell
ep
ito
pe
s,w
hic
hfr
eq
ue
ncy
inlo
we
rth
an3
0%
amo
ng
pro
filin
seq
ue
nce
so
fd
iffe
ren
tcu
ltiv
ars
are
ind
icat
ed
wit
hX
.d
oi:1
0.1
37
1/j
ou
rnal
.po
ne
.00
76
06
6.t
00
4
Pollen Profilin Polymorphism
PLOS ONE | www.plosone.org 13 October 2013 | Volume 8 | Issue 10 | e76066
Figure 6. Olive cultivars and species specific distribution of T-cell epitopes. A) Cartoon representation of profilin model 3nul two viewsrotated 45u respectively two examples of olive cultivars, ‘Picual’ and ‘Loaime’, to compare the localization in the 2-D structural elements of the proteinof the common shared T-cell epitopes between both cultivars, and the specific epitopes (V29, I53 and I106) only present in Loaime cultivar. All epitopeswere depicted in orange color. Surface superimposition of both, common and not shared epitopes, are depicted in the same color over the model3nul of profilin. Red circles were used to highlight the specific epitopes. B) Cartoon representation of profilin model 1cqa of the same view for bothspecies of the Betulaceae genus, Betula pendula and Corylus avellana, showing the specific T-cell epitope F41, only present in Betula pendula. Presenceor absence of the F41 epitope was located and highlighted in the 2-D structural elements of the protein, as well as over the surface of the model byusing red color and red circles. C) Specific epitopes location and comparison between two species of the genus Poaceae, Phleum pratense and Zeamays, by using cartoon representation of 2-D profilin elements or protein surface over the models 3nul and 1g5uA two views rotated 90u or 180u,respectively. Blue color over the model surface and blue circles were used to highlight Phleum pratense specific T-cell epitopes F66 and I92. Pink circleswere used to highlight the absence of Zea mays specific T-cell epitopes V26 and F59 over the 3nul model. Reciprocity of colors was used to show thepresence or absence of specific epitopes in the model 1g5uA for Zea mays.doi:10.1371/journal.pone.0076066.g006
Pollen Profilin Polymorphism
PLOS ONE | www.plosone.org 14 October 2013 | Volume 8 | Issue 10 | e76066
the cellular integration of signal transduction under different
cellular stresses and physiological conditions.
Polymorphism is responsible of the generation ofmultiple epitopes, which may involve both specific andwide cross-reactivity to profilin isoforms
Pan-allergens as profilin are the most broadly distributed cross-
reactive allergens throughout the animal and plant kingdoms [64].
Profilins have been described in a wide variety of plant sources
[13,17], showing highly conserved and variable regions, features
that may contribute to their wide cross-reactivity, as well as
isoform specific reactions [8, current study].
High degree of polymorphism has been described in plant
pollen allergens from different sources: grass, Poa p 9 [65];
ragweed, Amb a 1 [66]; and trees, Bet v 1 [67], Ole e 1 [68], Ole e
11 [69]. Moreover, four recombinant isoforms of Cor a 1 from
hazel pollen displayed different antigenic and allergenic properties
due to differential changes in few amino acids [70]. The origin of
this polymorphism in olive has been demonstrated for different
allergens, such as Ole e 1 [68] and Ole e 2 [8, current study],
where the genetic background of Olea europaea L. is the major
source of sequences variability. In several cases, allergen
polymorphism has been attributed to the presence of multigene
families [71]. In other allergens, the presence of post-translational
modifications may also determine the presence of multiple
isoforms of the allergen, i.e. Ole e 1 [68], Ole 2 [8], Ole e 11
[69], and also for apple (Malus domestica), where allelic diversity
regarding this allergen (up to 18 Mal d 1 genes), has been
considered as a major explanation for the considerable differences
in allergenicity [72].
Profilin broad distribution has been confirmed among a large
number of botanically unrelated plants, which may be another
important factor responsible of an increasing IgE-mediated risk of
multiple pollen sensitizations [73] and pollen-related food cross-
reactions [74]. Nevertheless, diverse profilin-sensitized patients
only may react to a small number of profilin-containing allergen
sources, probably due to a concomitance with other pollinosis
[75], or sensitization to specific epitopes [76].
B- and T-cell responses have a defining and differential
recognition of antigenic epitopes, and their localization in the
allergen does not necessarily coincide. In the case of the T-cell
receptor, only the linear amino acid sequence is important for
recognition [77]. In contrast, B-cell epitopes recognized by IgE
antibodies are either linear or conformational and are located on
the surface of the molecule accessible to antibodies. Thus,
conformational B-cell epitopes require a proper folded allergen
for efficient binding of inhaled allergens [78]. The extension of the
epitope may range from 5 to 8 or longer amino acids for IgE to be
able of binding to the epitope [79,80,99].
Molecular modeling and sequence polymorphisms character-
ization help identifying specific regions, which could be candidates
for the development of peptide-based immunotherapeutic reagents
for pollen allergy as has already been described for other allergens
[8,69,74,81], while conserved regions could be responsible of the
cross-reaction between pollen and plant derived food allergen
[82]. Epitopes prediction based on knowledge derived from
structural surface features such as increased solvent accessibility
[83], backbone flexibility [84], and hydrophilicity [85] were found
to correlate well with antigenicity in the present study. We have
identified surface patterns (conformational epitopes), as well as
multiple regions (B- and T-cell epitopes) in the olive profilins,
exhibiting differences in length and variability (Table 2, Table 3,
Table 4), depicted in the surface of the allergens Ara t 8, Bet v 2 or
Hev b 8 to show their distribution (Figure 5, Figure 6). In addition,
we have found shared common B- and T-cell epitopes among
cultivars and between species, in addition to epitopes differentially
distributed in specific cultivars and species (Figure 6, Table 2,
Table 3).
Furthermore, we found an extensive correlation between
conformational and B- and T-cell epitopes in olive profilins, in
addition to high variability in their sequences (Table 5, Table S5).
Furthermore, we have identified conformational epitopes in Olea
europaea L. that specifically overlap only with T-cells, i.e. C8(P79),
C7(Q79), or with B-cells, i.e. E1(T5), thus likely playing a
fundamental role in pollen allergen cross-reactivity.
Linear B- and/or T- cell epitopes may play most important
roles in cross-reactivity between food allergens, and between
pollen and food allergens [86], since food processing or digestion
may increase the number or the accessibility of IgE binding
epitopes. Thus, Bet v 1-related food allergens have been described
Table 5. Conformational and lineal epitopes relationships.
A)
Profilin model Conformational and B-cell epitopes overlapping
A) Conformational epitopes overlapping totally or partially with lineal B-cell epitopes. B) Conformational epitopes total or partially overlapping with lineal T-cellepitopes.doi:10.1371/journal.pone.0076066.t005
Pollen Profilin Polymorphism
PLOS ONE | www.plosone.org 15 October 2013 | Volume 8 | Issue 10 | e76066
to led to a loss of some or all the B-cell epitopes (but not the T-cell
epitopes) by denaturalization/digestion [87].
Our study has identified commonly shared conformational B-
cell epitopes in olive (i.e. epitope 1, epitope 2 from Table 5), which
may play an important role in broad cross-reactivity between
pollen allergens of different non-related species. In addition, olive
conformational-T-cell epitopes such as 5, 7, and 8 (Table 5) may
be involved in pollen and/or pollen-food allergens wide cross-
reactivity. The variability in their surface residues might contribute
to generate areas of the protein enable of being differentially
recognized as Th2- inducing antigens. Depending on the location
of these polymorphic residues, recognition by IgE/IgG may be
also affected (i.e. nine Bet v 1 isoforms, sharing an average identity
of 84–99%, displayed different allergenic properties both in vivo
and in vitro) [88].
Furthermore, it is commonly found at structural level the
presence of antigenic determinants integrated in 2-D structure
elements, which protrude from the surface of the protein, such as
coils and loops [69]. Our results have shown that among the three
characteristic loops that distinguish plant profilins from other
species [10], the first loop situated between N-terminal a-helix 1
and b-strand 1 of several olive profilin sequences contains an
insertion of three to six residues, in addition to multiple micro-
heterogeneities [8, current study]. These features have been also
found in profilins of Betula pendula, Corylus avellana, Phleum pratense,
Zea mays [8], current study and other plant species [65,66]. The
length of these structural elements together with the different
degree of variability might be responsible of increasing even more
the variability of molecular epitopes among olive cultivars, and
between species. These differences may additionally increase the
differences and the extension of the allergenic reactions
[8,68,69,89]. Differences in antigenic determinants localized in
structural loops have been shown previously in the Amb t 5
allergen, which exhibited an immune-dominant B-cell epitope
located in the loop 3, responsible for large number of allergy
responses [90]. Other similar examples are the major IgE-binding
regions inter-helix loop of the allergen Pru p 3 [91], or the area
integrated by a P-loop in Bet v 1 [92], which was also found in the
Bet v 1 homologous food allergens [93].
Olive profilins also exhibited two additional loops (between b-
strands 4 and 5 and between b-strands 5 and 6), both of them
taking part of the actin binding surface, situated in the plant
profilin specific solvent-filled pocket. These two loops and their
variability might be also responsible for immune cross-reactivity
between human and plant profilins in atopic patients [64], since
timothy-grass and human profilin exhibit a high similarity in these
two structural loops [9].
Multimeric forms of allergens have been shown as an additional
structural factor responsible for the presence of cross-reactions
among profilins from several species [94]. Dimeric or oligomeric
forms of allergens may favor cross-linking compared to monomers
due to an effective increase of the number of epitopes. Birch
profilin has been described to induce an IgG-subclass2 (IgG2) in
mouse and primates, which is considered a typical response to
Disulphide bridges formation, number and red-ox estate were
analyzed with the DIpro software (scratch.proteomics.ics.uci.edu).
The distances between every two a carbons (Ca) from all cysteines
were measured by using the DeepView/Swiss-PDBViewer v3.7
software (spdbv.vital-it.ch).
Protein models for profilin proteins were submitted to ConSurf
server (consurf.tau.ac.il) in order to generate evolutionary related
conservation scores, helping us to identify functional region in the
proteins. Functional and structural key residues in the profilin
sequences were confirmed by ConSeq server (conseq.tau.ac.il).
Solvent accessible surface area and Poisson–Boltzmannelectrostatic potential
Solvent accessible surface area (SASA), defined as the percent-
age of surface area of a biomolecule that is accessible to a solvent
for each residue was calculated by using the GETAREA v1.1
program (curie.utmb.edu/getarea.html). Relative values were
calculated in relation to the average SASA of the respective
residue in the peptide GXG, being X each amino acid of the
profilin sequence.
The electrostatic Poisson-Boltzmann (PB) potentials for the
structures were obtained using APBS molecular modeling software
implemented in PyMol 0.99 (www.pymol.org) with AMBER99 to
assign the charges and radii to all the atoms (including hydrogens),
and optimized with the Python software package PDB2PQR. Fine
grid spaces of 0.35 A were used to solve the linearized PB equation
in sequential focusing multigrid calculations in a mesh of
130 points per dimension at 310.00 K. The dielectric constants
were 2.00 for the proteins and 80.00 for water. The output mesh
was processed in the scalar OpenDX format to render the
isocontours and maps on the surfaces with PyMOL 0.99. Potential
values are given in units of kT per unit charge (k Boltzmann’s
constant; T temperature).
Allergenicity profile assessmentAllergenicity of profilin sequences was checked by a full FASTA
alignment in the Structural Database of Allergenic Proteins
(SDAP) (Fermi.utmb.edu/SDAP). Allergenicity profile was assess-
ed by combination of different parameters: hydrophobicity,
antigenicity and SASA. This last was compared to absolute
surface area (ASA) of each residue calculated by DSSP program
(swift.cmbi.ru.nl/gv/dssp). These values were transformed to
relative values of ASA and visualized by ASAView (www.netasa.
org/asaview).
Ole e 2 B-cell epitopes analysisChanges in the amino acid sequences of the epitopic immune-
dominant regions to be recognized by IgG and IgE immunoglob-
ulins (B-cell epitopes) were meticulously analyzed for all the
profilin sequences of the five plant species through comparison
with 5 epitopes called 10A4, 5F2, 9A7, 9G4 and 3H8, previously
characterized in recombinant profilin Hel a 2 from sunflower by
using overlapping synthetic peptides and monoclonal antibodies
[99].
Ole e 2 T-cell epitopes identification and analysisThe identification of MHC Class-II binding regions in the
antigen sequences for all the profilin sequences of the five plant
species was performed by using neuronal networks and quantita-
tive matrices derived from published literature. Promiscuous
peptides binding to multiple HLA class II molecules were selected.
The analysis was made by using the TEPITOPE software (www.
bioinformation.net/ted), with a threshold of 5% for the most
common human HLA-DR alleles [DRB1*0101 (DR1),
DRB1*0301(DR3), DRB1*0401 (DR4), DRB1*0701 (DR7),
DRB1*0801(DR8), DRB1*1101 (DR5) and DRB1*1501 (DR2)]
among Caucasian population, and covering a large proportion of
the peptides that bind with human HLA.
Ole e 2 conformational epitopes identification andanalysis
The structure of the allergen Hev b 8 from Hevea brasiliensis latex
profilin (Q9LEI8, model 1g5uA), Bet v 2 from Betula pendula
(Uniprot accession number P25816, model 1cqa), and Ara t 8 from
Arabidopsis thaliana (Q42449, model 3nul) (www.pdb.org), were
used to predict amino acid residues forming potential conforma-
tional epitopes on the surface of the protein. Relative values were
calculated in relation to the average SASA of the respective
residue in the peptide GXG. The distances between residues were
calculated using the Swiss-PDB Viewer (spdbv.vital-it.ch). Resi-
dues contributing to conformational epitopes were predicted by a
structure-based algorithm, which is a modification of a previously
published method [100]. Briefly: i) Protruding residues with
relative SASA.75% were chosen as center of the epitopes. If two
or more of these residues were closer to each other than 0.5 nm,
they were combined to form a single epitope. ii) For each one of
these residues, all partially accessible residues (SASA.20%) within
1 nm distance from the central residue(s) were included in the
epitope. The chosen epitope radius reflects the typical size of an
antigen - antibody contact surface [101]. iii) Finally, single residues
Pollen Profilin Polymorphism
PLOS ONE | www.plosone.org 17 October 2013 | Volume 8 | Issue 10 | e76066
located in the linear sequence between two residues or stretches
that were already part of the epitope were also included. The
reason behind this step to be included was the assumption that an
amino acid will significantly affect the conformation of its
neighbors.
Supporting Information
Figure S1 Diagram representation of highly antigenicregions within profilin protein sequences of the fivespecies studied. Eight areas of high antigenicity are highlighted
with red (shared) and blue (no shared) colored boxes for olive and
birch profilins, and seven areas for the profilins of the rest of the
species, as a result of the combination of parameters such as A)
hydrophobicity (or hydrophilicity), Kyte-Doolitte scale, B) antige-
nicity, Welling method, C) antigenicity, Parker method, D) 2-D
structural elements. Surface accessibility of amino acids
(SASA.25%) (discontinue red line in the left, central and right
panels, respectively, of the Figure 2a) were used as another
parameter to delimit areas of high antigenicity. Reference
sequences are these chosen as reference in the alignments of
profilin proteins for each specie: DQ138336 for Olea europaea L.,
M65179 for Betula pendula, DQ663544 for Corylus avellana,
DQ663535 for Phleum pratense, and DQ663560 for Zea mays.
21. Cedergren-Zeppezauer ES, Goonesekere NC, Rozycki MD, Myslik JC, DauterZ, et al. (1994) Crystallization and structure determination of bovine profilin at
2.0 A. J Mol Biol 240: 459–475.
22. Schluter K, Schleicher M, Jockusch BM (1998) Effects of single amino acid
substitutions in the actin-binding site on the biological activity of bovine profilin
I. J Cell Sci 111: 3261–3273.
23. Lambrechts A, Jonckheere V, Dewitte D, Vandekerckhove J, Ampe C (2002)
Mutational analysis of human profilin I reveals a second PIP2 binding siteneighbouring the poly(L-proline) binding site. BMC Biochem 3: 12.
24. Skare P, Karlsson R (2002) Evidence for two interaction regions for
phosphatidylinositol (4,5)-bisphosphate on mammalian profilin I. FEBS Lett522: 119–124.
25. Lassing I, Lindberg U (1985) Specific interaction between phosphatidylinositol4, 5-bisphosphate and profilactin. Nature 314: 472–474.
26. Fedorov AA, Magnus KA, Graupe MH, Lattman EE, Pollard TD, et al. (1994)
X-ray structures of isoforms of the actin-binding protein profilin that differ intheir affinity for phosphatidylinositol phosphates. Proc Natl Acad Sci USA 91:
8636–8640.
27. Valenta R, Ball T, Vrtala S, Duchene M, Kraft D, et al. (1994) cDNA cloningand expression of timothy grass (Phleum pratense) pollen profilin in Escherichia
coli: comparison with birch pollen profilin. Biochem Biophys Res Commun199: 106–118.
28. Limmongkon A, Giuliani C, Valenta R, Mittermann I, Heberle-Bors E, et al.
29. Kyte J, Doolittle RF (1982) A simple method for displaying the hydropathiccharacter of a protein. J Mol Biol 157: 105–132.
30. Welling GW, Weijer WJ, van der Zee R, Welling-Wester S (1985) Prediction of
sequential antigenic regions in proteins. FEBS Lett 188: 215–218.
31. Schluter K, Jockusch BM, Rothkegel M (1997) Profilins as regulators of actin
dynamics. Biochim Biophys Acta 1359(2): 97–109.
32. Schutt CE, Myslik JC, Rozycki MD, Goonesekere NC, Lindberg U (1993) Thestructure of crystalline profilin-beta-actin. Nature 365(6449): 810–816.
33. Archer SJ, Vinson VK, Pollard TD, Torchia DA (1993) Secondary structureand topology of Acanthamoeba profilin I as determined by heteronuclear
nuclear magnetic resonance spectroscopy. Biochemistry 32(26): 6680–6687.
34. Asturias JA, Arilla MC, Gomez Bayon N, Martınez J, Martınez A, et al. (1997)Cloning and high level expression of Cynodon dactylon (Bermuda grass) pollen
profilin (Cyn d 12) in Escherichia coli: purification and characterization of theallergen. Clin Exp Allergy 27: 1307.
35. Asturias JA, Arilla MC, Gomez Bayon N, Martınez J, Martınez A, et al. (1997)
Cloning and expression of the panallergen profilin and the major allergen (Olee 1) from olive tree pollen. J Allergy Clin Immunol 100: 365.
36. Mittermann I, Swoboda I, Pierson E, Eller N, Kraft D, et al. (1995) Molecularcloning and characterization of profilin from tobacco (Nicotiana tabacum):
Identification of a 60 kDa cross-reactive allergen in pollen and plant-derivedfood. J Allergy Clin Immunol 98(5 Pt 1): 938–947.
50. Babich M, Foti LR, Wong L, Pack GR (2005) In vitro translation and
computational analyses of human profilin multimers. Proc West Pharmacol Soc48: 39–43.
51. Buss F, Temm-Grove C, Henning S, Jockusch BM (1992) Distribution of
profilin in fibroblasts correlates with the presence of highly dynamic actin
filaments. Cell Motil Cytoskeleton 22(1): 51–61.
52. Lambrechts A, Braun A, Jonckheere V, Aszodi A, Lanier LM, et al. (2000)Profilin II is alternatively spliced, resulting in profilin isoforms that are
differentially expressed and have distinct biochemical properties. Mol Cell Biol20(21): 8209–8219.
53. Nodelman IM, Bowman GD, Lindberg U, Schutt CE (1999) X-ray Structure
Determination of Human Profilin II: A Comparative Structural Analysis of
Human Profilins. J Mol Biol 294: 1271–1285.
54. Gibbon BC, Zonia LE, Kovar DR, Hussey PJ, Staiger CJ (1998) Pollen profilinfunction depends on interaction with proline-rich motifs. Plant Cell 10: 981–
993.
55. Jockusch BM, Murk K, Rothkegel M (2007) The profile of profilins. RevPhysiol Biochem Pharmacol 159: 131–149.
56. Skare P, Karlsson R (2002) Evidence for two interaction regions for
phosphatidylinositol (4,5)-bisphosphate on mammalian profilin I. FEBS Lett
522: 119–124
57. Aparicio-Fabre R, Guillen G, Estrada G, Olivares-Grajales J, Gurrola G, et al.(2006) Profilin tyrosine phosphorylation in poly-L-proline-binding regions
inhibits binding to phosphoinositide 3-kinase in Phaseolus vulgaris. Plant J47(4): 491–500.
58. Shao J, Welch WJ, DiProspero NA, Diamond MI (2008) Phosphorylation of
Profilin by ROCK1 Regulates Polyglutamine Aggregation. Mol Cell Biol28(17): 5196–5208.
59. Bjorkegren-Sjogren C, Korenbaum E, Nordberg P, Lindberg U, Karlsson R(1997) Isolation and characterization of two mutants of human profilin I that do
not bind poly(l-proline). FEBS Lett 418(3): 258–264.
60. Sathish K, Padma B, Munugalavadla V, Bhargavi V, Radhika KVN, et al.(2004) Phosphorylation of profilin regulates its interaction with actin and poly
(L-proline). Cellular Signaling 16(5): 589–596.
61. Kovar DR, Drøbak BK, Collings DA, Staiger CJ (2001) The characterizationof ligand-specific maize profilin mutants. Biochem J 358: 49–57
62. Fedorov AA, Ball T, Valenta R, Almo SC (1997) X-ray crystal structures ofbirch pollen profilin and Phl p 2. Int Arch Allergy Immunol 113(1–3): 109–113.
63. Lu PJ, Shieh WR, Rhee SG, Yin HL, Chen CS (1996) Lipid products of
phosphoinositide 3-kinase bind human profilin with high affinity. Biochemistry35: 14027–14034.
64. Valenta R, Duchene M, Ebner C, Valent P, Sillaber C, et al. (1992) Profilins
constitute a novel family of functional plant pan-allergens. The Journal ofexperimental medicine 175(2): 377–385.
65. Silvanovich A, Astwood J, Zhang L, Olsen E, Kisil F, et al. (1991) Nucleotidesequence analysis of three cDNAs coding for Poa p IX isoallergens of Kentucky
bluegrass pollen. J Biol Chem 266(2): 1204–1210.
66. Wopfner N, Gadermaier G, Egger M, Asero R, Ebner C, et al. (2005) Thespectrum of allergens in ragweed and mugwort pollen. Int Arch Allergy
Immunol 138(4): 337–346.
67. Fritsch R, Bohle B, Vollmann U, Wiedermann U, Jahn-Schmid B, et al. (1998)Bet v 1, the major birch pollen allergen, and Mal d 1, the major apple allergen,
cross-react at the level of allergen-specific T helper cells. J Allergy Clin
Immunol 102(4 Pt 1): 679–686.
68. Hamman-Khalifa A, Castro AJ, Jimenez-Lopez JC, Rodrıguez-Garcıa MI,Alche JD (2008) Olive cultivar origin is a major cause of polymorphism for Ole
e 1 pollen allergen. BMC Plant Biol 8: 10.
69. Jimenez-Lopez JC, Kotchoni SO, Rodrıguez-Garcıa MI, Alche JD (2012)Structure and functional features of olive pollen pectin methylesterase using
homology modeling and molecular docking methods. J Mol Model 18: 4965–
4984.
70. Breiteneder H, Ferreira F, Hoffmann-Sommergruber K, Ebner C, BreitenbachM, et al. (1993) Four recombinant isoforms of Cor a I, the major allergen of
hazel pollen, show different IgE-binding properties. Eur J Biochem 212(2):355–362.
71. Bond JF, Garman RD, Keating KM, Briner TJ, Rafnar T, et al. (1991)
Multiple Amb a I allergens demonstrate specific reactivity with IgE and T cells
from ragweed-allergic patients. J Immunol 146: 3380–3385.
72. Gao ZS, van de Weg WE, Schaart JG, van der Meer IM, Kodde L, et al. (2005)Linkage map positions and allelic diversity of two Mal d 3 (non-specific lipid
transfer protein) genes in the cultivated apple (Malus domestica). Theor ApplGenet 110: 479–491.
(2012) Differential immunoreactivity and subcellular distribution reveal the
multifunctional character of pollen profilins as major effects of sequencepolymorphism. In: Current Insights in Pollen Allergens, InTech (Ed.). Chapter
5, pp. 71–102.
74. Jimenez-Lopez JC, Gachomo WE, Ariyo O, Baba-Moussa L, Kotchoni SO(2012) Specific conformational epitope features of pathogenesis-related proteins
mediating cross-reactivity between pollen and food allergens. Mol Biol Rep
39(1): 123–130.
Pollen Profilin Polymorphism
PLOS ONE | www.plosone.org 19 October 2013 | Volume 8 | Issue 10 | e76066
75. Vieths S, Scheurer S, Ballmer-Weber B (2002) Current Understanding of
Cross-Reactivity of Food Allergens and Pollen. Ann NY Acad Sci 964: 47–68.
76. Vieira T, Lopes C, Pereira AM, Araujo L, Moreira A, et al. (2012) Microarray
based IgE detection in poly-sensitized allergic patients with suspected food
allergy - an approach in four clinical cases. Allergol Immunopathol 40(3): 172–
180.
77. Pomes A (2010) Relevant B cell epitopes in allergic disease. Int Arch Allergy
Immunol 152: 1–11.
78. Meno KH (2011) Allergen structures and epitopes. Allergy 66 (Suppl. 95): 19–
21.
79. Bannon GA, Ogawa T (2006) Evaluation of available IgE-binding epitope data
and its utility in bioinformatics. Mol Nutr Food Res 50: 638–644.
80. Tanabe S (2004) IgE-binding abilities of pentapeptides, QQPFP and PQQPF,
in wheat gliadin. J Nutr Sci Vitaminol 50: 367–370.
81. Jimenez-Lopez JC, Rodriguez-Garcia MI, Alche JD (2011) Systematic and
phylogenetic analysis of the Ole e 1 pollen protein family members in plants.
In: Systems and computational biology - bioinformatics and computational
modeling, InTech (Ed.). Chapter 12, pp. 245–260.
82. Radauer C, Willerroider M, Fuchs H, Hoffmann-Sommergruber K,
Thalhamer J, et al. (2006) Cross-reactive and species-specific immunoglobulin
E epitopes of plant profilins: an experimental and structure-based analysis. Clin
Exp Allergy 36(7): 920–929.
83. Thornton JM, Edwards MS, Taylor WR, Barlow DJ (1986) Location of
‘continuous’ antigenic determinants in the protruding regions of proteins.
EMBO J 5: 409–413.
84. Westhof E, Altschuh D, Moras D, Bloomer AC, Mondragon A, et al. (1984)
Correlation between segmental mobility and the location of antigenic
determinants in proteins. Nature 311: 123–126.
85. Hopp TP, Woods KR (1981) Prediction of protein antigenic determinants from
amino acid sequences. Proc Natl Acad Sci USA 78: 3824–3828.
86. Aalberse RC, Akkerdaas J, Van Ree R (2001) Cross-reactivity of IgE antibodies
Gastrointestinal digestion of Bet v 1-homologous food allergens destroys their
mediator-releasing, but not T cell-activating, capacity. J Allergy Clin Immunol
116: 1327–1333.
88. Ferreira F, Hirtenlehner K, Jilek A, Godnick-Cvar J, Breiteneder H, et al.
(1996) Dissection of immunoglobulin E and T lymphocyte reactivity of isoforms
of the major birch pollen allergen Bet v 1: potential use of hypoallergenic
isoforms for immunotherapy. J Exp Med 183: 599–609.
89. Zienkiewicz K, Garcıa-Quiros E, Alche JD, Rodrıguez-Garcıa MI, Castro AJ
(2012) Detection and quantitation of olive pollen allergen isoforms using 2-D
western blotting. In: Current Insights in Pollen Allergens, InTech (Ed.).
Chapter 3, pp. 41–56.
90. Zhu X, Greenstein JL, Rogers BL, Kuo MC (1995) T cell epitope mapping of
ragweed pollen allergen Ambrosia artemisiifolia (Amb a 5) and Ambrosia trifida(Amb t 5) and the role of free sulfhydryl groups in T cell recognition. J Immunol
155(10): 5064–5073.
91. Garcıa-Casado G, Pacios LF, Dıaz-Perales A, Sanchez-Monge R, LombarderoM, et al. (2003) Identification of IgE-binding epitopes of the major peach
allergen Pru p 3. J Allergy Clin Immunol 112(3): 599–605.92. Mirza O, Henriksen A, Ipsen H, Larsen JN, Wissenbach M, et al. (2000)
Dominant epitopes and allergic cross-reactivity: complex formation between a
Fab fragment of a monoclonal murine IgG antibody and the major allergenfrom birch pollen Bet v 1. J Immunol 165: 331–338.
93. Mittag D, Batori V, Neudecker P, Wiche R, Friis EP, et al. (2006) A novelapproach for investigation of specific and cross-reactive IgE epitopes on Bet v 1
and homologous food allergens in individual patients. Mol Immunol 43: 268–278.
94. Psaradellis T, Kao NL, Babich M (2000) Recombinant Zea mays profilin forms
multimers with pan-allergenic potential. Allergol Int 49: 27–35.95. Vrtalaa S, Wiedemanna P, Mittermanna I, Eichlerb HG, Sperrc WR, et al.
(1996) High-Level Expression inEscherichia coliand Purification of Recombi-nant Plant Profilins: Comparison of IgE-Binding Capacity and Allergenic
Activity. Bioch Bioph Res Comm 226(1): 42–50.
96. Wopfner N, Willeroidee M, Hebenstreit D, van Ree R, Aalbers M, et al. (2002)Molecular and immunological characterization of profilin from mugwort
pollen. Biol Chem 383 (11): 1779–1789.97. Babich M, Foti LR, Wong L, Pack GR (2005) In vitro translation and
computational analyses of human profilin multimers. Proc West Pharmacol Soc48: 39–43.
98. Wu S, Zhang Y (2010) SEGMER: identifying protein sub-structural similarity
by segmental threading. Structure 18:858–867.99. Asturias JA, Gomez-Bayon N, Arilla MC, Sanchez-Pulido L, Valencia A, et al.
(2002) Molecular and structural analysis of the panallergen profilin B cellepitopes defined by monoclonal antibodies. Int Immunol 14(9): 993–1001.
100. Kolaskar AS, Kulkarni-Kale U (1999) Prediction of three-dimensional structure
and mapping of conformational epitopes of envelope glycoprotein of Japaneseencephalitis virus. Virology 261(1): 31–42.
101. Laver WG, Air GM, Webster RG, Smith-Gill SJ (1990) Epitopes on proteinantigens: misconceptions and realities. Cell 61: 553–556.
102. Pierce JR (1980) An introduction to information theory: symbols, signals andnoise, 2nd ed Dover Publications, Inc., New York, NY.
103. Schneider TD, Stephens RM (1990) Sequence logos: a new way to display
consensus sequences. Nucleic Acids Res 18: 6097–6100.104. Radauer C, Willerroider M, Fuchs H, Hoffmann-Sommergruber K,
Thalhamer J, et al. (2006) Cross-reactive and species-specific immunoglobulinE epitopes of plant profilins: an experimental and structure-based analysis. Clin
Exp Allergy 36: 920–929.
Pollen Profilin Polymorphism
PLOS ONE | www.plosone.org 20 October 2013 | Volume 8 | Issue 10 | e76066