24
ANALYSIS OF THE ENERGY TRENDS IN THE EUROPEAN UNION & ASIA TO 2030

ANALYSIS OF THE ENERGY TRENDS
IN THE EUROPEAN UNION & ASIA TO 2030

Disclaimer:
This document has been produced by the Centre for Energy‐Environment Resources Development (CEERD), Bangkok, Thailand with the financial assistance of the European Union. The contents of this document are the sole responsibility of the authors and can under no circumstances be regarded as reflecting the position of the European Union.
Printed on recycled paper, Thailand, January 2009

Table of Contents
List of Figures I Introduction
1. About scenarios assumptions and sources of information and data....................... 1 2. Global energy prospects.............................................................................................................. 2
II European Union
1. Primary energy demand ............................................................................................................. 4 2. Primary energy supply ................................................................................................................ 4 3. Final energy demand.................................................................................................................... 5 4. Power generation capacity ........................................................................................................ 7 5. Renewables Outlook..................................................................................................................... 8 6. CO2 emissions .................................................................................................................................. 9 7. Energy investments ...................................................................................................................... 10 8. Energy security ............................................................................................................................... 10
III – Asia
1. Primary energy demand ............................................................................................................. 12 2. Primary energy supply ................................................................................................................ 13 3. Final energy demand.................................................................................................................... 15 4. Power generation........................................................................................................................... 16 5. CO2 emissions .................................................................................................................................. 17 6. Energy investment needs ........................................................................................................... 18 7. Energy security ............................................................................................................................... 18

List of Figures
Figure 1. Increase in World Primary Energy Demand by Fuel in the Reference Scenario ‐ Source: IEA, WEO
2007............................................................................................................................................................................................................2 Figure 2. Cumulative Investment in Energy Infrastructure in the Reference Scenario by Fuel and Region,
2006‐2030 ‐ Source: IEA, WEO 2007........................................................................................................................................2 Figure 3. Incremental World Primary Fossil‐Energy Demand in the Alternative Policy Scenario, 2005‐2030
‐ Source: IEA, WEO 2007..................................................................................................................................................................3 Figure 4. Incremental Energy related CO2 Emissions by Region and Scenario – Source: IEA, WEO 2007 .............3 Figure 5. Primary Energy Requirements by Fuel ‐ Source: EC, DG TREN 2008.....................................................................4 Figure 6. Indigenous Production of Fossil Fuels ‐ Source: EC, DG TREN 2008.......................................................................4 Figure 7. Indigenous Biomass‐Waste Production ‐ Source: EC, DG TREN 2008....................................................................5 Figure 8. Final Energy Demand by Sector ‐ Source: EC, DG TREN 2008 ....................................................................................6 Figure 9. Final Energy Demand by Fuel Type ‐ Source: EC, DG TREN 2008.............................................................................6 Figure 10. Electricity Consumption by Sector ‐ Source: EC, DG TREN 2008...............................................................................7 Figure 11. Power Generation Capacity (Net) by Type of Main Fuel Used ‐ Source: EC, DG TREN 2008......................7 Figure 12. Capacity of Renewables in GW ‐ Source: EC, DG TREN 2008.......................................................................................8 Figure 13. CO2 Emissions by Sector ‐ Source: EC, DG TREN 2008....................................................................................................9 Figure 14. Investment in Power Generation (Net) ‐ Source: EC, DG TREN 2008.................................................................. 10 Figure 15. Nuclear Power Capacities (GW Net) ‐ Source: EC, DG TREN 2008........................................................................ 10 Figure 16. Import Dependence of the EU ‐ Source: EC, DG TREN 2008 ..................................................................................... 11 Figure 17. Total Primary Energy Demand (Reference Scenario) ‐ Mtoe ‐ Source: IEA, WEO 2007 ............................ 12 Figure 18. Total Primary Oil Demand (Reference Scenario) ‐ Mtoe ‐ Source: IEA, WEO 2007...................................... 12 Figure 19. Total Primary Gas Demand (Reference Scenario) ‐ Mtoe ‐ Source: IEA, WEO 2007.................................... 12 Figure 20. Total Primary Coal Demand (Reference Scenario) ‐ Mtoe ‐ Source: IEA, WEO 2007 .................................. 12 Figures 21, 22 & 23. Total Primary Nuclear, Hydro and Biomass‐Waste Demand (Reference Scenario) – Mtoe
Source: IEA, WEO 2007 ................................................................................................................................................................. 13 Figure 24. Oil Production (Reference Scenario) ‐ Million barrels/day ‐ Source: IEA, WEO 2007................................ 13 Figure 25. Natural gas Production (Reference Scenario) ‐ Billion cubic metres ‐ Source: IEA, WEO 2007 ............ 14 Figure 26. Coal Production (Reference Scenario) ‐ Million tonnes of coal eq. ‐ Source: IEA, WEO 2007................. 14 Figure 27. Biofuels Outlook in 2030 – Mtoe – Source: IIEJ, Energy Outlook 2007 ............................................................... 15 Figure 28. Total Final Consumption (Reference Scenario) – Mtoe ‐ Source: IEA, WEO 2007........................................ 15 Figure 29. Number of Vehicles in Asia, 1971‐2030 – Source: IIEJ, Energy Outlook 2007................................................ 15 Figure 30. Electricity generation (Reference Scenario) – TWh ‐ Source: IEA, WEO 2007................................................ 16 Figure 31. Additional electricity generation installed capacity by fuel type for Asia and the Pacific (GW)
Source: UN ESCAP 2008................................................................................................................................................................ 16 Figure 32. Projected Contribution (in 2030) of Developing Asian Economies to Global CO2 Levels – Source IEA,
2006 cited by USAID, 2007.......................................................................................................................................................... 17 Figure 33. CO2 Emissions by Sector in Selected Countries (1980‐2030) ‐ Source: APERC, 2006 cited by
USAID, 2007........................................................................................................................................................................................ 18 Figure 34. Baseline Scenario Energy Investment needs for Asia and the Pacific ‐ Source: UN ESCAP 2008.......... 18

ENERGY TRENDS IN THE EUROPEAN UNION & ASIA TO 2030
1
I. Introduction 1. About Scenarios Assumptions and Sources of Information
(i) Global Context:
o Global Energy trends are based on International Energy Agency (IEA)’s World Energy Outlook 20071 which in addition looks in detail at energy markets in both China and India. As in previous Outlooks, a scenario approach has been adopted to examine future energy developments up to 2030.
o The core projections are derived from a Reference Scenario, which assumes that there are no new energy‐policy interventions by governments. An Alternative Policy Scenario analyses the impact on global energy markets of a package of additional measures to address energy‐security and climate‐change concerns. A High Growth Scenario incorporates significantly higher rates of economic growth in China and India than those in the Reference Scenario allowing highlighting how much their energy demand is sensitive to economic growth rates and what could be the implications for global energy trade and energy‐related greenhouse‐gas emissions.
(ii) European Union: o The Energy trends in the European Union are based on the energy forecasts produced by the Directorate General for Energy and Transport2. The Baseline scenario for the EU and each of its 27 Member‐States simulates current trends and policies as implemented in the Member‐States by the end of 2006. The Baseline scenario finalized in Nov. 2007 gives an update of the previous trend scenarios. It takes into
1 International Energy Agency (IEA), World Energy Outlook 2007, China and India Insight, © OECD / IEA, 2007
2 European Commission, Directorate‐General for Energy and Transport – Trends to 2030 — Update 2007, © European Communities, 2008
account the high energy import price environment of recent years, sustained economic growth and new policies and measures implemented in the Member‐States.
o In this report, European Union comprises the following countries (EU‐27): Austria, Belgium, Bulgaria, Cyprus, the Czech Republic, Denmark, Estonia, Finland, France, Germany, Greece, Hungary, Ireland, Italy, Latvia, Lithuania, Luxembourg, Malta, the Netherlands, Poland, Portugal, Romania, Slovak Republic, Slovenia, Spain, Sweden and the United Kingdom.
(iii) Asia: Otherwise stated, Asian Energy trends are
based on IEA’s World Energy Outlook 20071. Additional sources of information include:
o US Energy Information Administration (EIA)’s International Energy Outlook 20073. EIA’s projections to 2030 are considering along a reference case, alternative growth cases for energy forecast, together with a low and high world oil price cases. In its report, EIA analyses the differences noted with IEA projections, as a result of different models and assumptions, and also the fact that non‐marketed energy sources which play an important role in some developing countries, are not included in EIA’s estimates.
o US Agency for International Development (USAID) report: Clean Energy Solutions for Asia to Address Climate Change, 20074;
o Asia Pacific Energy Research Centre (APERC) report: APEC Energy Demand and Supply Outlook 20065;
o UN Economic and Social Commission for Asia and the Pacific (ESCAP) report: Energy Security and Sustainable
3 Energy Information Administration (EIA), International Energy Outlook 2007, May 2007
4 United States Agency for International Development (USAID), “Clean Energy Solutions for Asia to Address Climate Change” Report, May 2007
5 Asia Pacific Energy Research Centre (APERC), “APEC Energy Demand and Supply Outlook 2006” Report, © 2006 APERC
INTRODUCTION
2
Development in Asia and the Pacific, 20086, presenting a 24‐year forecast of energy demand for two cases: “baseline” and “sustainable energy” which assumptions are similar to those of IEA.
o Institute of Energy Economics, Japan (IEEJ), AsiaWorld Energy Outlook 2007, Nov. 20077;
In this report, Asia comprises the grouping of the following sub‐regions and countries (37):
o Developing Asia: Afghanistan, Bangladesh, Bhutan, Brunei, Cambodia, China, Chinese Taipei, Fiji, French Polynesia, India, Indonesia, Kiribati, the Democratic People’s Republic of Korea, Laos, Macau, Malaysia, Maldives, Mongolia, Myanmar, Nepal, New Caledonia, Pakistan, Papua New Guinea, the Philippines, Samoa, Singapore, Solomon Islands, Sri Lanka, Thailand, Tonga, Vietnam and Vanuatu.
o OECD Pacific: Australia, Japan, South Korea and New Zealand.
2. Global Energy Prospects
(i) World primary energy demand in the Reference Scenario, in which government policies are assumed to remain unchanged from mid‐2007, is projected to grow by 55% between 2005 and 2030, an average annual rate of 1.8%. World demand reaches 17.7 billion tonnes of oil equivalent (toe), compared with 11.4 billion toe in 2005.
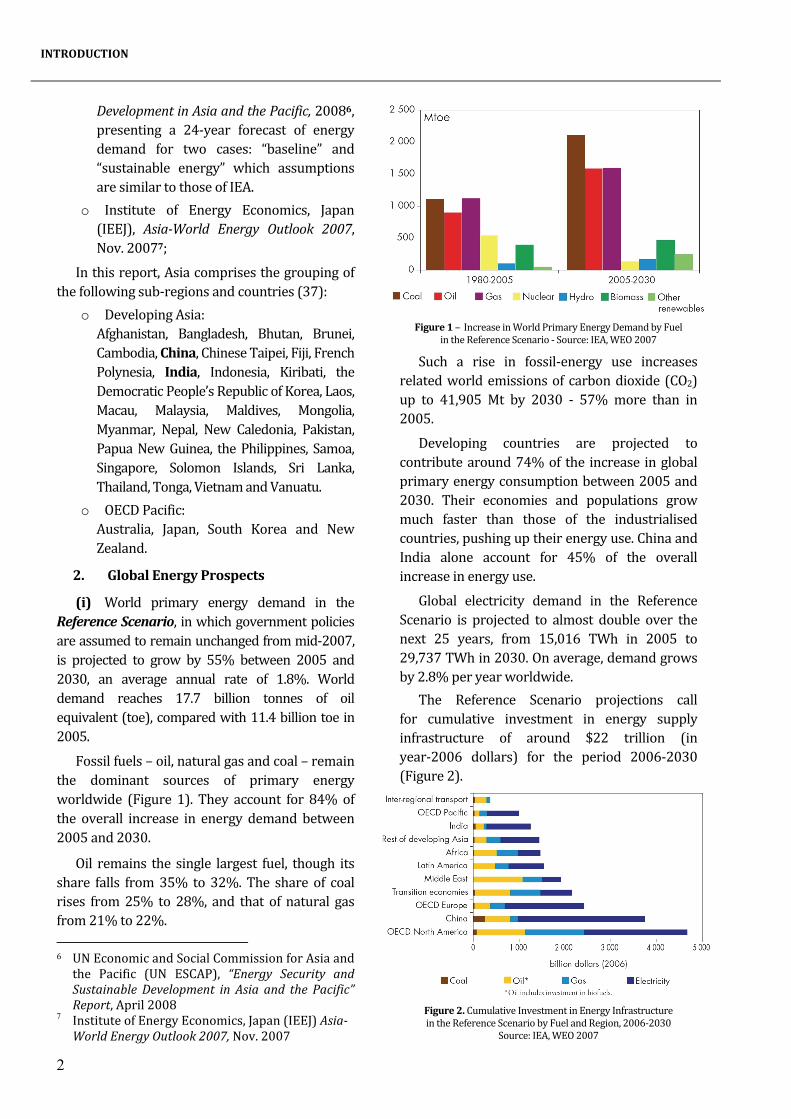
Fossil fuels – oil, natural gas and coal – remain the dominant sources of primary energy worldwide (Figure 1). They account for 84% of the overall increase in energy demand between 2005 and 2030.
Oil remains the single largest fuel, though its share falls from 35% to 32%. The share of coal rises from 25% to 28%, and that of natural gas from 21% to 22%. 6 UN Economic and Social Commission for Asia and the Pacific (UN ESCAP), “Energy Security and Sustainable Development in Asia and the Pacific” Report, April 2008
7 Institute of Energy Economics, Japan (IEEJ) AsiaWorld Energy Outlook 2007, Nov. 2007
Figure 1 – Increase in World Primary Energy Demand by Fuel in the Reference Scenario ‐ Source: IEA, WEO 2007
Such a rise in fossil‐energy use increases related world emissions of carbon dioxide (CO2) up to 41,905 Mt by 2030 ‐ 57% more than in 2005.
Developing countries are projected to contribute around 74% of the increase in global primary energy consumption between 2005 and 2030. Their economies and populations grow much faster than those of the industrialised countries, pushing up their energy use. China and India alone account for 45% of the overall increase in energy use.
Global electricity demand in the Reference Scenario is projected to almost double over the next 25 years, from 15,016 TWh in 2005 to 29,737 TWh in 2030. On average, demand grows by 2.8% per year worldwide.
The Reference Scenario projections call for cumulative investment in energy supply infrastructure of around $22 trillion (in year‐2006 dollars) for the period 2006‐2030 (Figure 2).
Figure 2. Cumulative Investment in Energy Infrastructure in the Reference Scenario by Fuel and Region, 2006‐2030
Source: IEA, WEO 2007

ENERGY TRENDS IN THE EUROPEAN UNION & ASIA TO 2030
3
About half of global energy investment goes to developing countries, where demand and production increases most. China alone needs to invest about $3.7 trillion – 17% of the world total – while India’s investment needs are more than $1.2 trillion most of it – as in developing countries in general – in the power sector.
(ii) In the Alternative Policy Scenario8, global primary energy demand in 2030 reaches 15,783 Mtoe – 1,937 Mtoe, or 11%, less than in the Reference Scenario (Figure 3).
Figure 3. Incremental World Primary Fossil‐Energy Demand in the Alternative Policy Scenario, 2005‐2030
Source: IEA, WEO 2007 Energy demand grows at a rate of 1.3% per
year over 2005‐2030, compared with 1.8% in the Reference Scenario. The gap in demand between the two scenarios widens progressively over the projection period as opportunities grow for retiring and replacing capital equipment using more efficient technologies.
By 2030, global energy‐related CO2 emissions at 33,890 Mt are still 27% higher than in 2005.
The policies and measures analysed in the Alternative Policy Scenario lead to a major shift in the pattern of energy investment. Consumers – households and firms – invest more in energy‐efficient appliances and equipment, while energy suppliers generally invest less in new energy‐production and transport infrastructure in response to lower demand, compared with the Reference Scenario. Overall, the net investment 8 Scenario in which a package of additional measures is addressing energy‐security and climate‐change concerns.
required by the energy sector – ranging from end‐use appliances to production and distribution of energy – is $386 billion less over 2006‐2030 than in the Reference Scenario.
(iii) The High Growth Scenario assumes higher rates of GDP growth in China and India. These higher rates result in faster growth in energy demand in both countries. But it also boosts international trade between each of the two countries and the rest of the world. Higher growth in energy demand, in turn, coupled with supply constraints, drives up international energy prices.
In this scenario, primary energy demand is 23% higher in China and 16% higher in India than in the Reference Scenario. Worldwide, the increase in demand amounts to 6% in 2030 compared to the Reference Scenario.
Globally, coal sees the biggest increase in demand in volume terms, reaching 7,958 Mtce in 2030 – 12% more than in the Reference Scenario. This is mainly because incremental coal use is concentrated in China and India.
China’s energy‐related CO2 emissions are projected to rise to 14,100 Mt by 2030 – 2,600 Mt, or 23% more than in the Reference Scenario, meanwhile India’s CO2 is projected to increase to 3,900 MT – 586 Mt or nearly 18% more than in the Reference Scenario. (Figure 4)
Figure 4 –Incremental Energy related CO2 Emissions by Region and Scenario ‐ Source: IEA, WEO 2007
The higher level of energy demand in the High Growth Scenario boosts investment needs for energy supply infrastructure over 2006‐2030 by almost $2 trillion (in year‐2006 dollars).
EUROPEAN UNION
4
II. European Union
1. Primary Energy Demand
Total EU‐27 energy requirements continue to increase up to 2030. In 2030 primary energy consumption is 11% higher than in 2005. The energy growth rates become smaller over time with consumption almost stabilising post 2020 reflecting lower economic growth and stagnating population in the last decade of the projection period.
Energy intensity9 improvements (1.7 % per year up to 2030) are driven by structural change towards services and lighter industries as well as by efficiency improvements in all sectors.
o by Fuels Most of the primary energy consumption
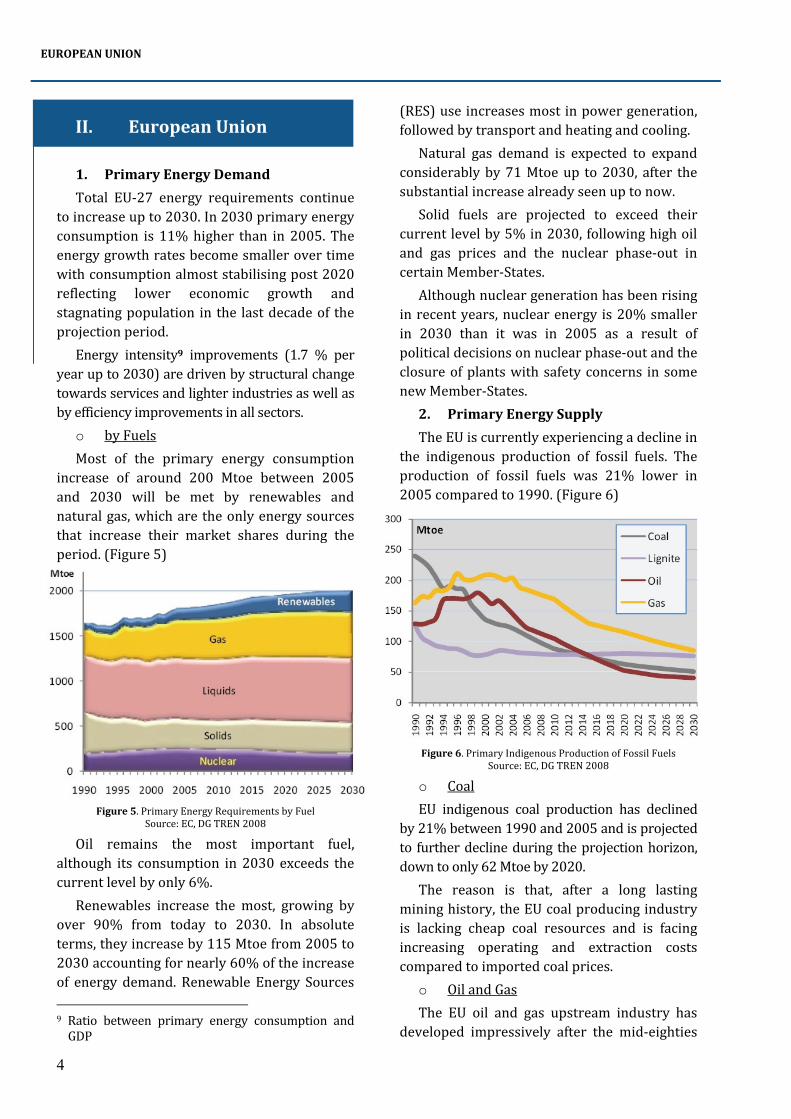
increase of around 200 Mtoe between 2005 and 2030 will be met by renewables and natural gas, which are the only energy sources that increase their market shares during the period. (Figure 5)
Figure 5. Primary Energy Requirements by Fuel Source: EC, DG TREN 2008
Oil remains the most important fuel, although its consumption in 2030 exceeds the current level by only 6%.
Renewables increase the most, growing by over 90% from today to 2030. In absolute terms, they increase by 115 Mtoe from 2005 to 2030 accounting for nearly 60% of the increase of energy demand. Renewable Energy Sources 9 Ratio between primary energy consumption and GDP
(RES) use increases most in power generation, followed by transport and heating and cooling.
Natural gas demand is expected to expand considerably by 71 Mtoe up to 2030, after the substantial increase already seen up to now.
Solid fuels are projected to exceed their current level by 5% in 2030, following high oil and gas prices and the nuclear phase‐out in certain Member‐States.
Although nuclear generation has been rising in recent years, nuclear energy is 20% smaller in 2030 than it was in 2005 as a result of political decisions on nuclear phase‐out and the closure of plants with safety concerns in some new Member‐States. 2. Primary Energy Supply
The EU is currently experiencing a decline in the indigenous production of fossil fuels. The production of fossil fuels was 21% lower in 2005 compared to 1990. (Figure 6)
Figure 6. Primary Indigenous Production of Fossil Fuels Source: EC, DG TREN 2008
o Coal EU indigenous coal production has declined
by 21% between 1990 and 2005 and is projected to further decline during the projection horizon, down to only 62 Mtoe by 2020.
The reason is that, after a long lasting mining history, the EU coal producing industry is lacking cheap coal resources and is facing increasing operating and extraction costs compared to imported coal prices.
o Oil and Gas The EU oil and gas upstream industry has
developed impressively after the mid‐eighties

ENERGY TRENDS IN THE EUROPEAN UNION & ASIA TO 2030
5
but is facing today’s declining resources, despite intensive efforts to increase the recovery rate in mature fields as well as in newer smaller fields. Oil production has peaked in 1999 and will be 77% lower in 2030 than its peak. The peak in gas production took place in 2001 and production will be 59% lower in 2030. There is little evidence that new discoveries in the EU will alter the declining production trend.
o Non‐fossil energy Since nuclear energy also declines in the
Baseline scenario, renewables are the only growing indigenous energy resources. Production of biomass‐waste energy, starting from 4.8% of total indigenous energy production in the EU in 1990, attains a share of 9% in 2005 and is projected to approach 23% by 2030.
Primary production of biomass‐waste is projected to exceed indigenous production of solid fuels by 2025, in energy terms.
Traditionally the main source of biomass used for energy purposes has been wood and wood waste, accounting for 74% of total indigenous biomass‐waste energy in 2005. Its share within total indigenous biomass will decline as its further development is slowly driven by limited additional resources, down to 45% in 2030. (Figure 7)
Figure 7. Indigenous Biomass‐Waste Production Source: EC, DG TREN 2008
Waste used for energy purposes is increasing in importance, facilitated by growing investment in its collection and in waste
processing. Waste energy in the gas form has the smallest potential but its exploitation being more economic than of other types of waste, the projection shows a rapid development of energy applications for landfill gas, mostly in power and steam generation. Municipal and industrial waste is also used for energy purposes. Overall, waste energy maintains a rather constant share in total indigenous biomass‐waste energy, ranging between 17 and 20% throughout the projection period.
The remaining part of indigenous biomass‐waste energy comes from crops and agricultural residues. The use of crops for energy purposes, inexistent in 1990, emerged before 2000, driven by the production of biofuels used in transportation. In primary energy terms, crops for biofuels reached a share of 3.8% of total indigenous biomass‐waste energy in 2005. Their future development, driven by biofuels production, especially with the development of second generation processing technologies for biofuels will take place mainly after 2015. Crops for biofuels are projected to grow by 10.6% per year between 2005 and 2030, and to attain a share of 25% of total indigenous biomass and waste energy.
The Baseline scenario assumes an important development in energy uses of agricultural residues and some kinds of crops, which will be collected at a large scale and transformed into biogas or condensed in pellets for direct combustion. This resource will complement wood and wood waste in a variety of thermal applications and in power and steam generation. Their production is projected to rise considerably in the Baseline scenario, growing by 7.1% per year between 2005 and 2030.
Overall, in the Baseline scenario, total primary indigenous productions of non‐fossil energy forms account for 63.6% of total indigenous production in 2030, up from 42.3% in 2005 and 29.6% in 1990.
3. Final Energy Demand
The Baseline scenario shows an increase of final energy demand by all sectors, driven by economic growth, and despite higher energy

EUROPEAN UNION
6
prices compared to prices prevailing before 2003. The average annual growth rate during 2005‐2030 is 0.75%, up from the 0.58% growth experienced in 1990‐2005.
Energy intensity measured relatively to GDP is projected to decrease steadily during 2005‐2030 at an annual rate of 1.38%, slightly slower than in the period 1990 to 2005.
o by Sectors The transport sector displays the fastest
increase in final energy consumption during 2005‐2030 (0.99% per year) and the slowest improvement of energy efficiency, compared to other sectors. The part of final energy consumed in transportation activity increases steadily attaining 32.9% in 2030, significantly up from 26.1% in 1990 (Figure 8).
Figure 8. Final Energy Demand by Sector Source: EC, DG TREN 2008
Energy demand in industry remains important; and is driven by sustained industrial activity as assumed in the Baseline scenario. Industry maintains a share close to 27.5% of total final energy demand, lower than in 1990, but unchanged compared to 2005. Energy intensity in industry improves at slower pace than in the past (especially compared with the ‘90s when important restructuring and economies of scale took place).
Energy consumed in houses and services buildings accounts for about 40% of total final energy throughout the projection period. The corresponding sectors, i.e. residential and services, display the fastest improving energy efficiency which is a result of combined effects from improved thermal integrity, more efficient
appliances and the use of more advanced heat pumps.
o by Fuels In the Baseline scenario oil products lose
3.1 % points in terms of market share between 2005 and 2030. Oil continues to be predominant in transport as an energy carrier and as feedstock in petrochemicals (the latter not being included in final energy demand). Oil is gradually replaced by gas and at a lesser degree by electricity in all thermal uses (Figure 9).
Figure 9. Final Energy Demand by Fuel Type Source: EC, DG TREN 2008
The use of solid fuels declines in all final energy demand sectors because of lack of cleanliness and easiness of use, despite its competitive price.
The rapid penetration of natural gas experienced in the period up to 2005 is projected to slowdown as a result of loss in competitiveness and also because of increased electrification in some end user applications.
Steam and heat generated by CHP and sold through distribution networks account for a small part of final energy consumption (around 3.5%) but industrial steam generated by on‐site CHP and boilers is more significant.
Renewable energies present the highest rates of increase in terms of final energy consumption. The additional annual needs of renewables in 2030 as compared to 2005 are 48 Mtoe, as high as for gas and for oil products. By far the largest part of this growth is attributed to biomass and waste which are increasingly used in thermal applications and

ENERGY TRENDS IN THE EUROPEAN UNION & ASIA TO 2030
7
on‐site CHP and boilers. Solar energy used for water heating also increases significantly but its share remains low.
Growing electrification of end‐user applications is an important trend which was observed in the past and is projected to continue in the future. In addition, the Baseline scenario involves some degree of fossil fuel substitutions by electrical energy mainly in thermal applications by means of heat pumps. The demand for electricity increases however at a smaller rate than in the past, especially during the last decade of the projection period. This is due to a slowdown in the total energy demand and the growing energy efficiency of electrical equipment and of lighting technology. Nevertheless, the annual demand for electricity in 2030 is 37.5% larger compared to 2005.
o Demand for Electricity Domestic electricity sales, including
consumption by end‐users and the energy sector, are growing throughout the projection period at 1.22% per year, faster than total energy requirements growth. The well established long term trend towards increased electrification continues; however the rates of growth are lower than those observed during the period 1990‐2005. Electricity represents 23% of total final energy demand in 2030, compared to 17% in 1990 and 20% in 2005 (Figure 10).
Figure 10. Electricity Consumption by Sector Source: EC, DG TREN 2008
The Baseline scenario shows a progressive slowdown in the expansion of electricity consumption. In the short term electricity consumption is projected to increase at a rate similar to that observed in the recent past, considering that the proliferation of new electricity uses continues as in the recent past. However, for the longer term, the Baseline scenario takes the view that energy efficiency improvements in appliance design and housing equipment allow for moderate growth of electricity consumption in all sectors.
The structure of electricity sales by sector is rather stable over the projection period, with the exception of the share of industry which slightly decreases (down to 40% of sales) and the share of the services sector and households which increases (up to 55% of total sales). Electricity consumption by the energy sector (excluding self‐consumption of electricity by power plants and electricity losses for pumping) accounts for 4% of total electricity sales and this share is projected to decline because primary production and transformation of fossil fuels go down in the Baseline scenario. 4. Power Generation Capacity
In 2005, total net power generation capacity in the EU was 740 GW, consisting of 61.3% thermal, 18.2% nuclear, 14.8% hydro, 5.5% wind and 0.2% geothermal and solar power generation capacity. (Figure 11)
Figure 11. Power Generation Capacity (Net) by Type of Main Fuel Used Source: EC, DG TREN 2008
EUROPEAN UNION
8
Total net power capacity is projected to increase by 31% between 2005 and 2030 in order to meet power load. Investment in new power plants is larger because, apart from meeting increasing demand, the system has to replace the power plants that are decommissioned.
The share of nuclear will drop along the projection period, reaching 10.6% in 2030 (nearly half of the share in 2000), owing to the incomplete replacement of units to be decommissioned and the phase out policies followed by certain Member‐States.
The combined cycle power technology is shown to continue its penetration attaining a share of 23.5% in 2030. Consequently steam turbines using fossil fuels display a decreasing share attaining 30% of total capacity in 2030. However, the market conditions and the supercritical technology will enable re‐emergence of coal‐based generation in the long term.
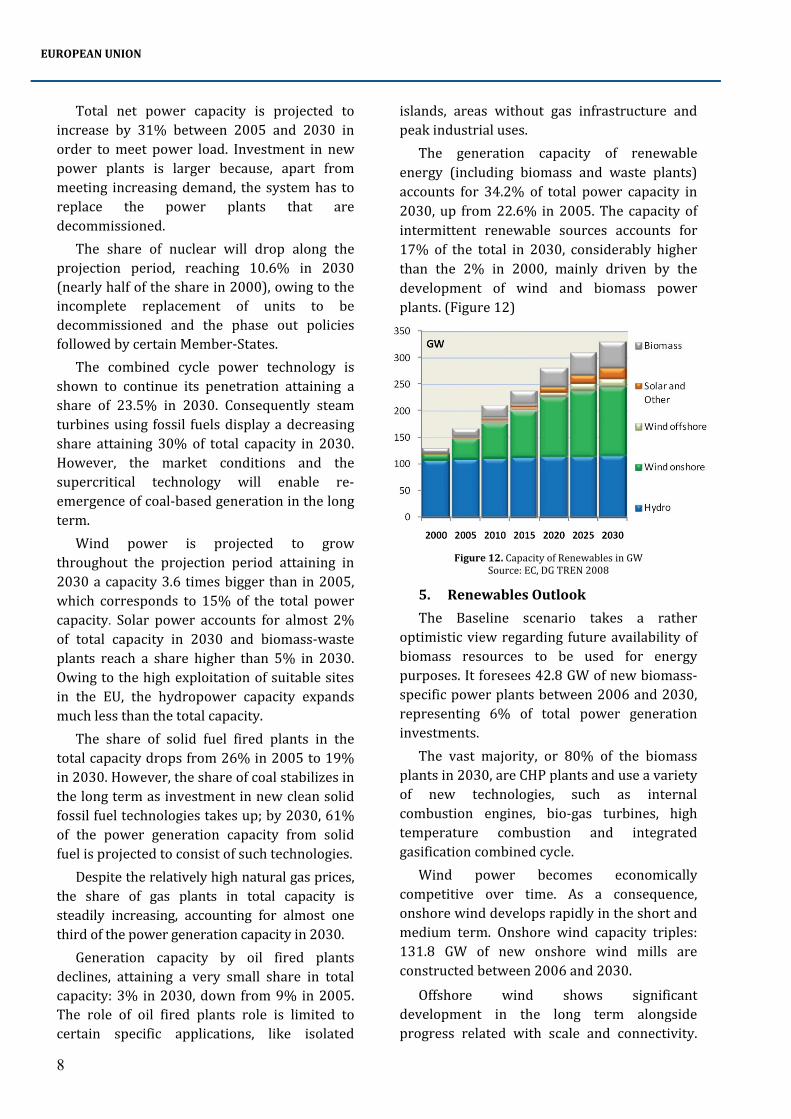
Wind power is projected to grow throughout the projection period attaining in 2030 a capacity 3.6 times bigger than in 2005, which corresponds to 15% of the total power capacity. Solar power accounts for almost 2% of total capacity in 2030 and biomass‐waste plants reach a share higher than 5% in 2030. Owing to the high exploitation of suitable sites in the EU, the hydropower capacity expands much less than the total capacity.
The share of solid fuel fired plants in the total capacity drops from 26% in 2005 to 19% in 2030. However, the share of coal stabilizes in the long term as investment in new clean solid fossil fuel technologies takes up; by 2030, 61% of the power generation capacity from solid fuel is projected to consist of such technologies.
Despite the relatively high natural gas prices, the share of gas plants in total capacity is steadily increasing, accounting for almost one third of the power generation capacity in 2030.
Generation capacity by oil fired plants declines, attaining a very small share in total capacity: 3% in 2030, down from 9% in 2005. The role of oil fired plants role is limited to certain specific applications, like isolated
islands, areas without gas infrastructure and peak industrial uses.
The generation capacity of renewable energy (including biomass and waste plants) accounts for 34.2% of total power capacity in 2030, up from 22.6% in 2005. The capacity of intermittent renewable sources accounts for 17% of the total in 2030, considerably higher than the 2% in 2000, mainly driven by the development of wind and biomass power plants. (Figure 12)
Figure 12. Capacity of Renewables in GW Source: EC, DG TREN 2008
5. Renewables Outlook
The Baseline scenario takes a rather optimistic view regarding future availability of biomass resources to be used for energy purposes. It foresees 42.8 GW of new biomass‐specific power plants between 2006 and 2030, representing 6% of total power generation investments.
The vast majority, or 80% of the biomass plants in 2030, are CHP plants and use a variety of new technologies, such as internal combustion engines, bio‐gas turbines, high temperature combustion and integrated gasification combined cycle.
Wind power becomes economically competitive over time. As a consequence, onshore wind develops rapidly in the short and medium term. Onshore wind capacity triples: 131.8 GW of new onshore wind mills are constructed between 2006 and 2030.
Offshore wind shows significant development in the long term alongside progress related with scale and connectivity.

ENERGY TRENDS IN THE EUROPEAN UNION & ASIA TO 2030
9
A total capacity of 17 GW offshore wind mills is projected in the Baseline scenario in 2030.
Although considerable technology improvement has been assumed for solar power generation technology, solar energy, mainly photovoltaic (PV) technology, penetrates slowly. In total 13.7 GW of new PV units are built between 2006 and 2030, one third of which correspond to projects that are already decided and included in national plans.
Regarding hydroelectric power plants, around 5.9 GW of new investments are foreseen to take place between 2006 and 2030, of which 2.3 GW concern hydro power with reservoir. The vast majority of new hydro investments correspond to already decided or planned projects.
Other RES such as tidal/wave energy and high enthalpy geothermal energy for power generation play a minor role; they develop in some countries, where specific potential exists. Tidal/wave energy is projected to develop mainly after 2015 reaching 2.4 GW of installed capacity by 2030, while some 440 MW of new geothermal power stations are anticipated. 6. CO2 emissions
The Baseline scenario projects a steady increase in the CO2 emissions from energy combustion by 2030. In 2020, the emissions will be 5.1% higher compared to 1990 and in 2030 5.4% higher. The CO2 emissions are projected to grow by 0.31% per year during 2005‐2030.
The main driver for the emissions rise is the EU sustained economic growth, which includes a non declining industrial component, according to the Baseline scenario. The projected energy efficiency improvement alone (including the transport sector) is not sufficient to avoid the emissions growth.
The carbon intensity of energy10 which is projected to decrease at a slower pace during the projection period compared to the past, has a limited contribution to lowering the 10 Carbon intensity of energy: amount of CO2 emitted per unit of energy consumed or produced accounted in tons of CO2 / tons of oil equivalent (toe) or MWh
emissions level. Three factors explain this change of pace: the slowdown in the penetration of gas, the limited development of nuclear, and the re‐emergence of coal in the long term. These factors offset the effects of continued penetration of renewables on carbon intensity of energy.
CO2 emissions from transportation activity are projected to increase at 0.73% per year between 2005 and 2030 (1% between 2005 and 2020), significantly down from 1.75%, observed between 1990 and 2005. This is due to the deceleration of activity growth, especially regarding passenger transport, and the improvement of energy efficiency of transportation means. (Figure 13)
Figure 13. CO2 Emissions by Sector Source: EC, DG TREN 2008
The effects from the penetration of biofuels are small, because of their small share. The effects of biofuels on overall CO2 emissions are also small because of the energy consumed for their production.
The power generation sector faces a continuous deterioration of price competitiveness of gas vis‐à‐vis coal during the projection period. As a consequence, coal re‐emerges in the power sector in the long term, pushing upwards CO2 emissions.
The CO2 emissions in the power generation sector increase by 0.23% per year between 2005 and 2030. However, the carbon intensity of power generation decreases by 0.95% per year, during the same period, as a result of
EUROPEAN UNION
10
technology progress in thermal power units and the penetration of renewables. 7. Energy Investment
The Baseline scenario assumes that power generation investment takes place in the context of a well functioning market so as to deliver sufficient new capacity to replace plants which are closing and to meet additional demand with a sufficient reserve margin.
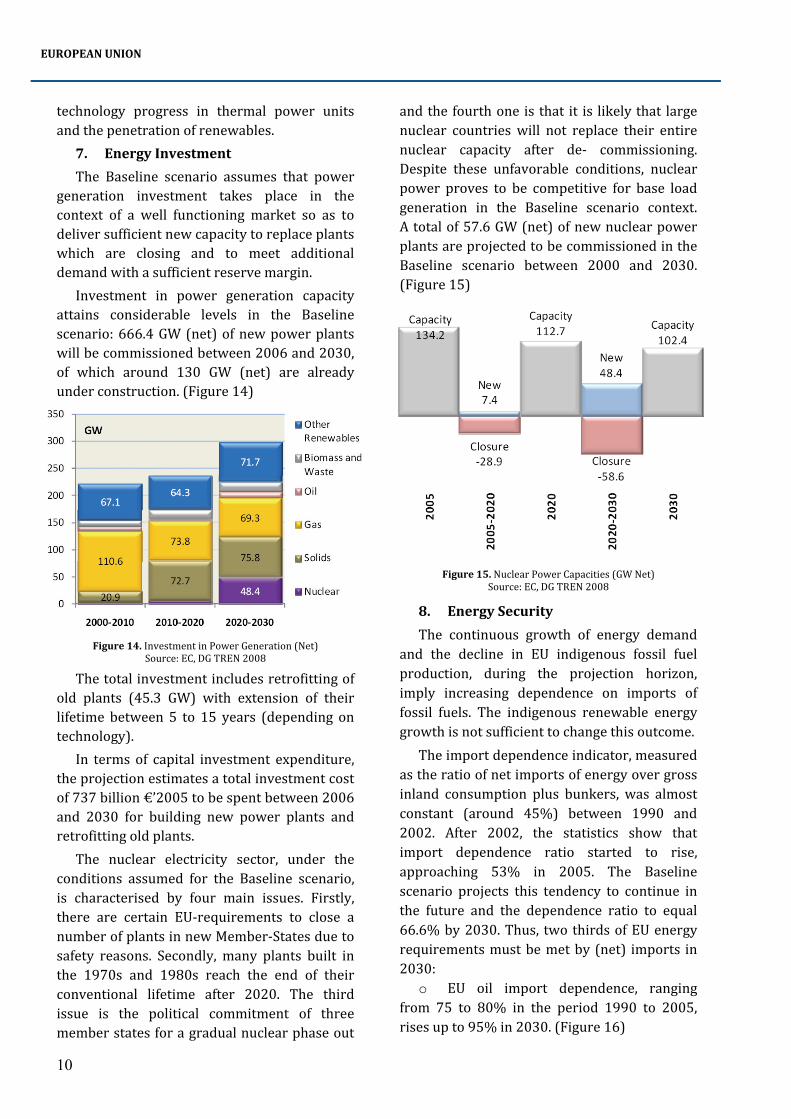
Investment in power generation capacity attains considerable levels in the Baseline scenario: 666.4 GW (net) of new power plants will be commissioned between 2006 and 2030, of which around 130 GW (net) are already under construction. (Figure 14)
Figure 14. Investment in Power Generation (Net) Source: EC, DG TREN 2008
The total investment includes retrofitting of old plants (45.3 GW) with extension of their lifetime between 5 to 15 years (depending on technology).
In terms of capital investment expenditure, the projection estimates a total investment cost of 737 billion €’2005 to be spent between 2006 and 2030 for building new power plants and retrofitting old plants.
The nuclear electricity sector, under the conditions assumed for the Baseline scenario, is characterised by four main issues. Firstly, there are certain EU‐requirements to close a number of plants in new Member‐States due to safety reasons. Secondly, many plants built in the 1970s and 1980s reach the end of their conventional lifetime after 2020. The third issue is the political commitment of three member states for a gradual nuclear phase out
and the fourth one is that it is likely that large nuclear countries will not replace their entire nuclear capacity after de‐ commissioning. Despite these unfavorable conditions, nuclear power proves to be competitive for base load generation in the Baseline scenario context. A total of 57.6 GW (net) of new nuclear power plants are projected to be commissioned in the Baseline scenario between 2000 and 2030. (Figure 15)
Figure 15. Nuclear Power Capacities (GW Net) Source: EC, DG TREN 2008
8. Energy Security
The continuous growth of energy demand and the decline in EU indigenous fossil fuel production, during the projection horizon, imply increasing dependence on imports of fossil fuels. The indigenous renewable energy growth is not sufficient to change this outcome.
The import dependence indicator, measured as the ratio of net imports of energy over gross inland consumption plus bunkers, was almost constant (around 45%) between 1990 and 2002. After 2002, the statistics show that import dependence ratio started to rise, approaching 53% in 2005. The Baseline scenario projects this tendency to continue in the future and the dependence ratio to equal 66.6% by 2030. Thus, two thirds of EU energy requirements must be met by (net) imports in 2030:
o EU oil import dependence, ranging from 75 to 80% in the period 1990 to 2005, rises up to 95% in 2030. (Figure 16)

ENERGY TRENDS IN THE EUROPEAN UNION & ASIA TO 2030
11
Figure 16. Import Dependence of the EU Source: EC, DG TREN 2008
o Imports of natural gas are projected to rise beyond 50% throughout the projection period and to cover 83.6% of the EU gas needs in 2030. By 2010, gas import dependence will already exceed 60%.
o For hard coal, net imports have already been higher than indigenous production in 2004. Hard coal import dependence is expected to attain 80.5% in 2030, while the solid fuels dependence increases to 62.5%.
For EU coal imports in 2005, first four suppliers were South‐Africa (26%), Russia (17%), South‐America and Australia (15% each) and the projections up to 2030 show still widely spread suppliers. (EIA, IEO 2007)3
The expected rise in EU gas imports is much sharper than in the case of oil. Russia is currently the largest oil supplier to the EU (over 30% of imports and 25% of total supply) and natural gas (close to 40% of EU imports and 24% of total supply). Norway and North Africa also have significant shares (around 15% of EU imports each for oil and over 40% together for natural gas). These countries will remain the key suppliers to the EU, but their future shares are somewhat uncertain.
However, higher EU energy import dependence does not necessarily imply lower energy security, provided import sources and routes are secured and diversified. Oil infrastructure in Europe is well developed, and most countries can rapidly switch to alternative suppliers and sources and rely on oil stockpiling emergency systems.
The situation with natural gas is somewhat different as the large majority of trade relies on pipelines. In this sense the dependence on Russian and Caspian natural gas may raise attention to other risk mitigation measures11, such as:
o Strengthening partnerships with energy producers;
o Improving the efficiency of energy trading markets and implementing the Energy Charter Treaty (ECT);
o Reducing transportation bottlenecks by diversifying export routes (pipeline projects);
o Developing LNG facilities. The recent policy developments in the EU in
the climate and energy area are likely to affect the EU's energy trends. In its recent Communication on "Europe's current and future energy position: Demand, resources, investments"12, the Commission examines how the EU targets, namely a reduction of 20% in the greenhouse gas emissions, might affect the EU's future energy situation.
11 Centre for Social and Economic Research (CASE), The Economic Aspects of the Energy Sector in CIS Countries, © European Communities, 2008
12 Document {COM(2008) 744} http://ec.europa.eu/energy/strategies/2008/doc/2008_11_ser2/strategic_energy_review_wd_future_position2.pdf
ASIA
12
III. Asia
1. Primary Energy Demand
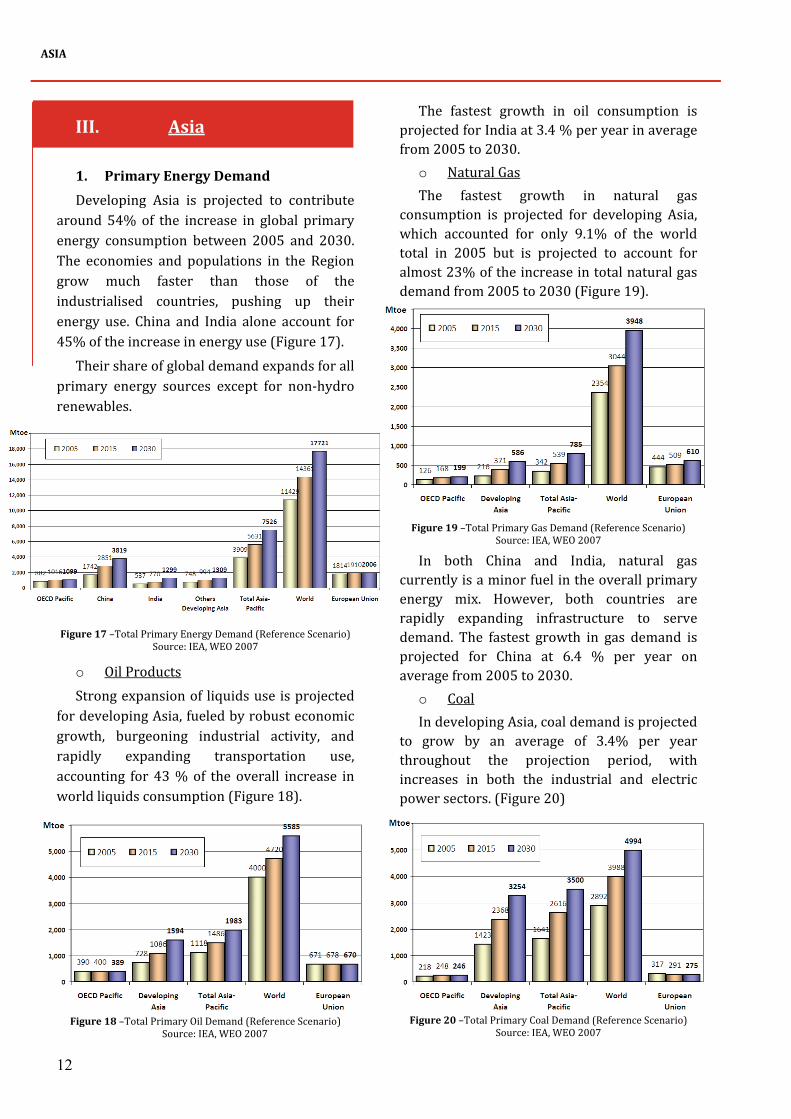
Developing Asia is projected to contribute around 54% of the increase in global primary energy consumption between 2005 and 2030. The economies and populations in the Region grow much faster than those of the industrialised countries, pushing up their energy use. China and India alone account for 45% of the increase in energy use (Figure 17).
Their share of global demand expands for all primary energy sources except for non‐hydro renewables.
Figure 17 –Total Primary Energy Demand (Reference Scenario) Source: IEA, WEO 2007
o Oil Products Strong expansion of liquids use is projected
for developing Asia, fueled by robust economic growth, burgeoning industrial activity, and rapidly expanding transportation use, accounting for 43 % of the overall increase in world liquids consumption (Figure 18).
Figure 18 –Total Primary Oil Demand (Reference Scenario) Source: IEA, WEO 2007
The fastest growth in oil consumption is projected for India at 3.4 % per year in average from 2005 to 2030.
o Natural Gas The fastest growth in natural gas
consumption is projected for developing Asia, which accounted for only 9.1% of the world total in 2005 but is projected to account for almost 23% of the increase in total natural gas demand from 2005 to 2030 (Figure 19).
Figure 19 –Total Primary Gas Demand (Reference Scenario) Source: IEA, WEO 2007
In both China and India, natural gas currently is a minor fuel in the overall primary energy mix. However, both countries are rapidly expanding infrastructure to serve demand. The fastest growth in gas demand is projected for China at 6.4 % per year on average from 2005 to 2030.
o Coal In developing Asia, coal demand is projected
to grow by an average of 3.4% per year throughout the projection period, with increases in both the industrial and electric power sectors. (Figure 20)
Figure 20 –Total Primary Coal Demand (Reference Scenario) Source: IEA, WEO 2007

ENERGY TRENDS IN THE EUROPEAN UNION & ASIA TO 2030
13
China and India together account for 81% of the projected increase in world coal demand from 2005 to 2030 as much of the increase in their demand for energy is expected to be met by coal.
o Renewables Nuclear power is an option, especially for
China and India where it is expected to take off after 2010 and give them a share of 32% in the region by 2030. (Figure 21)
Figure 21 –Total Primary Nuclear Demand (Reference Scenario) Source: IEA, WEO 2007
In hydropower, China and India are ahead of other economies and their advantage will continue. (Figure 22)
Figure 22 –Total Primary Hydro Demand (Reference Scenario) Source: IEA, WEO 2007
The demand for biomass and waste is likely to be relatively flat. (Figure 23)
Figure 23 –Total Primary Biomass_Waste Demand (Reference Scenario) ‐ Source: IEA, WEO 2007
2. Primary Energy Supply
Asia and the Pacific is rich in energy resources – with more than 50% of the world’s proven resources of natural gas and coal, 25% of oil reserves, and close to 60% of uranium reserves. The region is also well‐endowed with renewable energy resources. It has 40% of the world’s total hydroelectric potential and about 35% of its annual solar and high temperature geothermal energy potential. It has also substantial potentials of biomass and wind energy. In 2005, the largest contributions to total primary energy production were in primary solid and gaseous fuels. (UN ESCAP, 2008)6
o Oil (Figure 24) First ranked in the region, China’s oil
production is projected to decline slightly, to about 3.4 million barrels per day in 2030.
Figure 24 –Oil Production (Reference Scenario) Source: IEA, WEO 2007
Some oil producers in the region are expected to increase their production volumes as a result of enhanced exploration and extraction technologies. Vietnam’s long‐term production potential is viewed with considerable optimism. Output from Vietnamese fields is projected to reach 504,000 barrels per day in 2015. Exploration and test‐well activity have pointed to some production potential for Bangladesh and Myanmar, but significant output is not expected until after 2010. (EIA, IEO 2007)3
Malaysia is not expected to find significant new reserves; its output has already peaked and is expected to decline gradually through the end of the projection period, to less than 500,000 barrels per day in 2030. Indonesia’s
ASIA
14
production (OPEC) is also expected to decline over the projection period. (EIA, IEO 2007)3
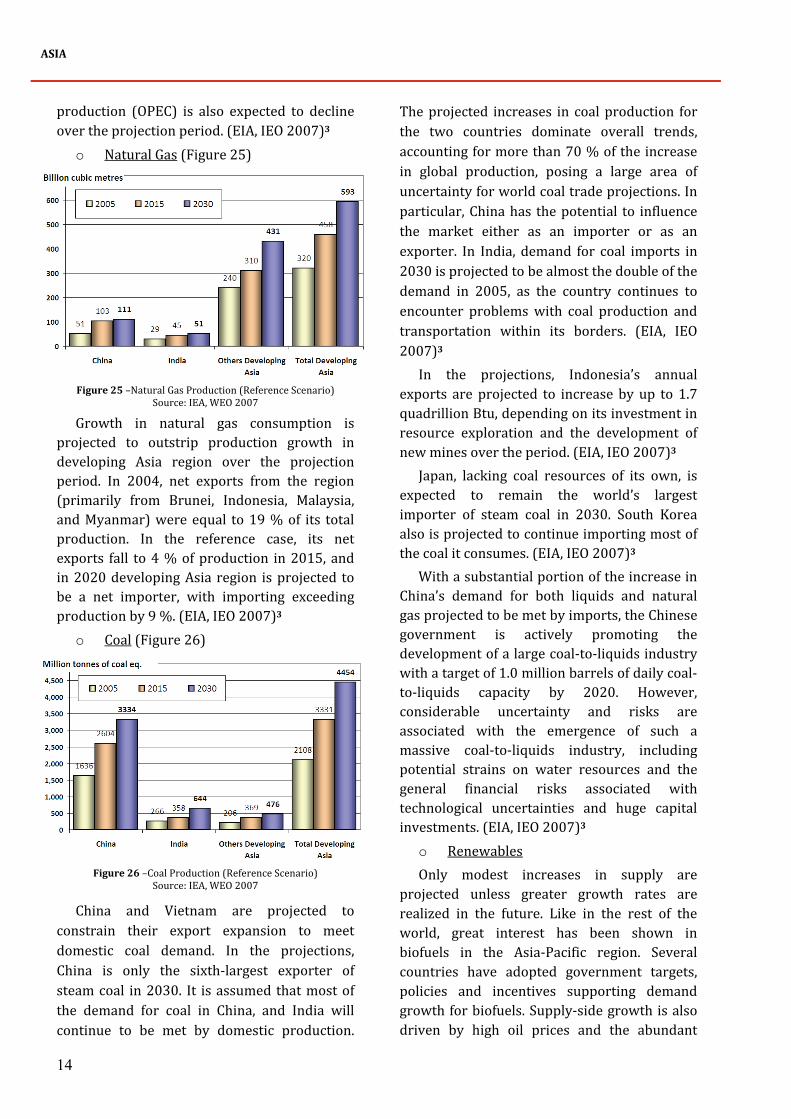
o Natural Gas (Figure 25)
Figure 25 –Natural Gas Production (Reference Scenario) Source: IEA, WEO 2007
Growth in natural gas consumption is projected to outstrip production growth in developing Asia region over the projection period. In 2004, net exports from the region (primarily from Brunei, Indonesia, Malaysia, and Myanmar) were equal to 19 % of its total production. In the reference case, its net exports fall to 4 % of production in 2015, and in 2020 developing Asia region is projected to be a net importer, with importing exceeding production by 9 %. (EIA, IEO 2007)3
o Coal (Figure 26)
Figure 26 –Coal Production (Reference Scenario) Source: IEA, WEO 2007
China and Vietnam are projected to constrain their export expansion to meet domestic coal demand. In the projections, China is only the sixth‐largest exporter of steam coal in 2030. It is assumed that most of the demand for coal in China, and India will continue to be met by domestic production.
The projected increases in coal production for the two countries dominate overall trends, accounting for more than 70 % of the increase in global production, posing a large area of uncertainty for world coal trade projections. In particular, China has the potential to influence the market either as an importer or as an exporter. In India, demand for coal imports in 2030 is projected to be almost the double of the demand in 2005, as the country continues to encounter problems with coal production and transportation within its borders. (EIA, IEO 2007)3
In the projections, Indonesia’s annual exports are projected to increase by up to 1.7 quadrillion Btu, depending on its investment in resource exploration and the development of new mines over the period. (EIA, IEO 2007)3
Japan, lacking coal resources of its own, is expected to remain the world’s largest importer of steam coal in 2030. South Korea also is projected to continue importing most of the coal it consumes. (EIA, IEO 2007)3
With a substantial portion of the increase in China’s demand for both liquids and natural gas projected to be met by imports, the Chinese government is actively promoting the development of a large coal‐to‐liquids industry with a target of 1.0 million barrels of daily coal‐to‐liquids capacity by 2020. However, considerable uncertainty and risks are associated with the emergence of such a massive coal‐to‐liquids industry, including potential strains on water resources and the general financial risks associated with technological uncertainties and huge capital investments. (EIA, IEO 2007)3
o Renewables Only modest increases in supply are
projected unless greater growth rates are realized in the future. Like in the rest of the world, great interest has been shown in biofuels in the Asia‐Pacific region. Several countries have adopted government targets, policies and incentives supporting demand growth for biofuels. Supply‐side growth is also driven by high oil prices and the abundant

ENERGY TRENDS IN THE EUROPEAN UNION & ASIA TO 2030
15
supply of biofuel feed stocks. In 2005, China was the third largest producer of fuel ethanol in the world, after Brazil and the US. Commercial scale production could also be found in India, Thailand and Australia. Numerous biodiesel plants are under construction or in the planning phase in Malaysia, Indonesia and the Philippines, where ample supplies of palm oil are supporting the industry. (Figure 27)
Figure 27 –Biofuel Outlook in 2030 Source: IIEJ, Energy Outlook, Nov. 2007
These countries see not only domestic demand but also growing export opportunities as potential source of income (IEA, MediumTerm Oil Market Report, 2006)13. 3. Final Energy Demand
Currently, much of the projected demand for energy in Asia‐Pacific will be met with fossil fuels. (Figure 28)
Figure 28 –Total Final Consumption in Asia Pacific (Reference Scenario) ‐ Source: IEA, WEO 2007
13 International Energy Agency (IEA), MediumTerm Oil Market Report – A Focus on the AsiaPacific Region, © OECD / IEA, 2006
o by Sector Among the various sectors, transport is
expected to be one of the fastest growing at 4.6 % a year, primarily driven by increased urbanization and rising per capita incomes, both of which increase demand for personal motorized transport. In China alone, there will be 201 million more vehicles on the road by 2030, 57% of the Asian fleet increase over the period 2005‐2030. (Figure 29)
Figure 29 –Number of Vehicles in Asia, 1971‐2030 Source: IIEJ, Energy Outlook, Nov. 2007
As a result oil consumption by transport sector is expected to increase its share in developing Asia’s final oil consumption from 45% to 59 % over the projection period.
Robust economic growth in the region is expected to boost demand for electricity to run newly purchased home appliances for air conditioning, cooking, space and water heating, refrigeration and to support the expansion of commercial services, including hospitals, office buildings, and shopping malls. China will continue to lead in residential and commercial energy demand growth with a projected growth rate of 6 % annually in household appliances. Between 2002 and 2030, commercial energy demand in the region is projected to grow 2.5 % annually while residential energy demand will grow 1.6 % per year. (APERC, 2006)5
Industrial energy demand is expected to double by 2030, primarily driven by China’s and India’s high economic growth, thus highlighting the need for technology transfer and energy efficiency measures to reduce industrial energy intensities. (APERC, 2006)5
ASIA
16
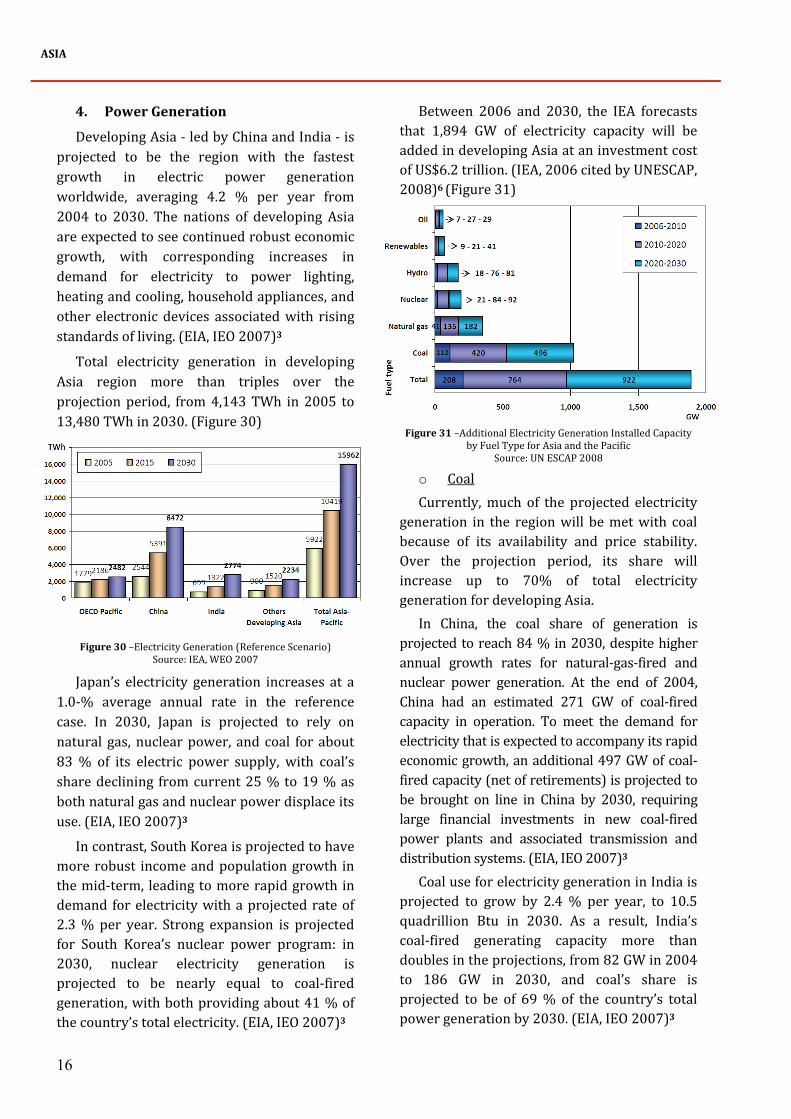
4. Power Generation
Developing Asia ‐ led by China and India ‐ is projected to be the region with the fastest growth in electric power generation worldwide, averaging 4.2 % per year from 2004 to 2030. The nations of developing Asia are expected to see continued robust economic growth, with corresponding increases in demand for electricity to power lighting, heating and cooling, household appliances, and other electronic devices associated with rising standards of living. (EIA, IEO 2007)3
Total electricity generation in developing Asia region more than triples over the projection period, from 4,143 TWh in 2005 to 13,480 TWh in 2030. (Figure 30)
Figure 30 –Electricity Generation (Reference Scenario) Source: IEA, WEO 2007
Japan’s electricity generation increases at a 1.0‐% average annual rate in the reference case. In 2030, Japan is projected to rely on natural gas, nuclear power, and coal for about 83 % of its electric power supply, with coal’s share declining from current 25 % to 19 % as both natural gas and nuclear power displace its use. (EIA, IEO 2007)3
In contrast, South Korea is projected to have more robust income and population growth in the mid‐term, leading to more rapid growth in demand for electricity with a projected rate of 2.3 % per year. Strong expansion is projected for South Korea’s nuclear power program: in 2030, nuclear electricity generation is projected to be nearly equal to coal‐fired generation, with both providing about 41 % of the country’s total electricity. (EIA, IEO 2007)3
Between 2006 and 2030, the IEA forecasts that 1,894 GW of electricity capacity will be added in developing Asia at an investment cost of US$6.2 trillion. (IEA, 2006 cited by UNESCAP, 2008)6 (Figure 31)
Figure 31 –Additional Electricity Generation Installed Capacity by Fuel Type for Asia and the Pacific
Source: UN ESCAP 2008
o Coal Currently, much of the projected electricity
generation in the region will be met with coal because of its availability and price stability. Over the projection period, its share will increase up to 70% of total electricity generation for developing Asia.
In China, the coal share of generation is projected to reach 84 % in 2030, despite higher annual growth rates for natural‐gas‐fired and nuclear power generation. At the end of 2004, China had an estimated 271 GW of coal‐fired capacity in operation. To meet the demand for electricity that is expected to accompany its rapid economic growth, an additional 497 GW of coal‐fired capacity (net of retirements) is projected to be brought on line in China by 2030, requiring large financial investments in new coal‐fired power plants and associated transmission and distribution systems. (EIA, IEO 2007)3
Coal use for electricity generation in India is projected to grow by 2.4 % per year, to 10.5 quadrillion Btu in 2030. As a result, India’s coal‐fired generating capacity more than doubles in the projections, from 82 GW in 2004 to 186 GW in 2030, and coal’s share is projected to be of 69 % of the country’s total power generation by 2030. (EIA, IEO 2007)3

ENERGY TRENDS IN THE EUROPEAN UNION & ASIA TO 2030
17
In the electric power sector, significant growth in coal consumption is expected in Taiwan, Vietnam, Indonesia, and Malaysia, where considerable amounts of new coal‐fired generating capacity are either planned or under construction. (EIA, IEO 2007)3
o Oil The liquids share of electricity generation
in developing Asia is projected to fall from 4 % in 2004 to 2 % in 2030. In both China and India, consumption of petroleum liquids for electricity generation is projected to remain modest, as relatively high world oil prices make other fuels economically more attractive. Some increases in oil use for electricity generation are projected for other countries in the region, because many rural areas that currently do not have access to transmission lines are expected to replace non‐commercial energy sources with electricity from diesel‐fired generators until transmission infrastructure can be put into place. (EIA, IEO 2007)3
o Nuclear Developing Asia is expected to lead the world
in the installation of new nuclear capacity over the projection period, accounting for 51 % of the projected net increment in nuclear capacity worldwide. China is projected to add 36 GW of nuclear capacity by 2030, India 17 GW, and the other countries of developing Asia a combined 6 GW. Strong growth in nuclear capacity in China and India will help both countries improve fuel diversification in their power sectors, although thermal generation will continue to dominate in both countries. In China, the nuclear share of total electricity generation is projected to rise from 2 % in 2004 to 5 % in 2030, and in India it is projected to rise from 2 % to 8 %. (EIA, IEO 2007)3
o Renewables Although electricity generation from
renewable energy sources is projected to grow at an average annual rate of 2.0 %, the renewable share of total generation declines as the shares of fossil fuels and nuclear power
grow more strongly in the region. The renewable share of developing Asia generation falls from 16 % in 2004 to 9 % in 2030. (EIA, IEO 2007)3
Much of the growth in developing Asia’s renewable energy consumption is projected to come from mid‐ to large‐scale hydroelectric facilities. Several countries in the region have hydropower facilities either planned or under construction, like India, with about 12,020 megawatts of hydroelectric capacity and also China with the 18,200‐megawatt Three Gorges Dam project (expected to be fully operational by 2009) and the 12,600‐megawatt Xiluodu project on the Jisha River (scheduled for completion in 2020). (EIA, IEO 2007)3
5. CO2 emissions
Asia's energy use is placing a severe strain on the local environment and increasingly contributing to global climate change, with its growing emissions of air pollutants and GHGs. This situation will be exacerbated as the contribution of Asia’s developing economies to global CO2 emissions rises from its 2002 level of 23 % to nearly 50 % by 2030 (Figure 32). (IEA, 2006 cited by USAID, 2007)4
Figure 32 –Projected Contribution (in 2030) of Developing Asian Economies to Global CO2 levels
Source: IEA, 2006
The highest growth rate in the non‐OECD regions is projected for China, at 3.4 % annually from 2004 to 2030, reflecting the country’s continued heavy reliance on fossil fuels, especially coal, over the projection period. By 2030, CO2 emissions from China and India combined are projected to account for 31% of total world emissions, with China alone responsible for 26% of the world total. (EIA, IEO 2007)3
ASIA
18
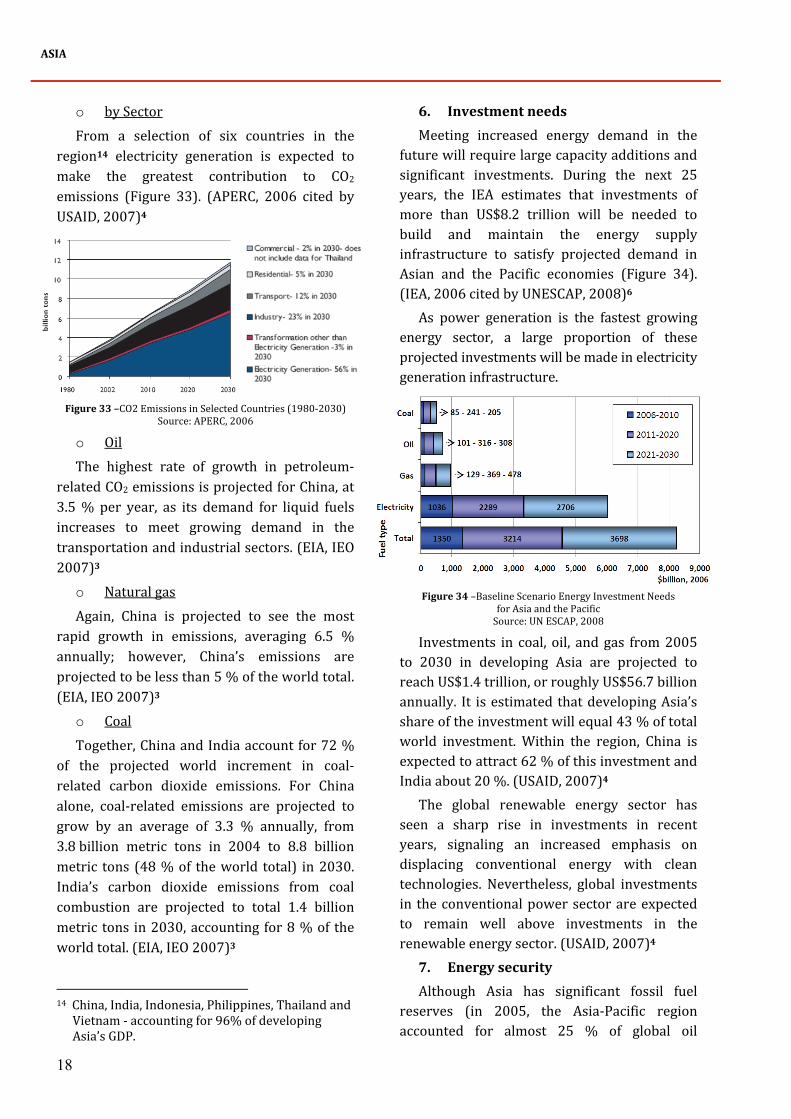
o by Sector From a selection of six countries in the
region14 electricity generation is expected to make the greatest contribution to CO2
emissions (Figure 33). (APERC, 2006 cited by USAID, 2007)4
Figure 33 –CO2 Emissions in Selected Countries (1980‐2030) Source: APERC, 2006
o Oil The highest rate of growth in petroleum‐
related CO2 emissions is projected for China, at 3.5 % per year, as its demand for liquid fuels increases to meet growing demand in the transportation and industrial sectors. (EIA, IEO 2007)3
o Natural gas Again, China is projected to see the most
rapid growth in emissions, averaging 6.5 % annually; however, China’s emissions are projected to be less than 5 % of the world total. (EIA, IEO 2007)3
o Coal Together, China and India account for 72 %
of the projected world increment in coal‐related carbon dioxide emissions. For China alone, coal‐related emissions are projected to grow by an average of 3.3 % annually, from 3.8 billion metric tons in 2004 to 8.8 billion metric tons (48 % of the world total) in 2030. India’s carbon dioxide emissions from coal combustion are projected to total 1.4 billion metric tons in 2030, accounting for 8 % of the world total. (EIA, IEO 2007)3
14 China, India, Indonesia, Philippines, Thailand and Vietnam ‐ accounting for 96% of developing Asia’s GDP.
6. Investment needs
Meeting increased energy demand in the future will require large capacity additions and significant investments. During the next 25 years, the IEA estimates that investments of more than US$8.2 trillion will be needed to build and maintain the energy supply infrastructure to satisfy projected demand in Asian and the Pacific economies (Figure 34). (IEA, 2006 cited by UNESCAP, 2008)6
As power generation is the fastest growing energy sector, a large proportion of these projected investments will be made in electricity generation infrastructure.
Figure 34 –Baseline Scenario Energy Investment Needs
for Asia and the Pacific Source: UN ESCAP, 2008
Investments in coal, oil, and gas from 2005 to 2030 in developing Asia are projected to reach US$1.4 trillion, or roughly US$56.7 billion annually. It is estimated that developing Asia’s share of the investment will equal 43 % of total world investment. Within the region, China is expected to attract 62 % of this investment and India about 20 %. (USAID, 2007)4
The global renewable energy sector has seen a sharp rise in investments in recent years, signaling an increased emphasis on displacing conventional energy with clean technologies. Nevertheless, global investments in the conventional power sector are expected to remain well above investments in the renewable energy sector. (USAID, 2007)4 7. Energy security
Although Asia has significant fossil fuel reserves (in 2005, the Asia‐Pacific region accounted for almost 25 % of global oil

ENERGY TRENDS IN THE EUROPEAN UNION & ASIA TO 2030
19
reserves, 55 % of global gas reserves, and 54 % of coal reserves, with sizeable renewable resources, IEA 2006), energy security is a growing concern for governments in the region, especially in the oil sector. As domestic oil supplies trail demand, increases in oil prices in recent years have more than doubled energy import bills. Malaysia and Indonesia, which have traditionally been oil exporting countries, are now net importers of oil. Between 2002 and 2025, the oil import dependency of Southeast Asian nations will increase from 10 % to nearly 70 %. (USAID, 2007)4
The most important source of oil is the Middle East: in 2006, 80 % of the oil imported from outside the Asia Pacific region came from the Middle East. Yet despite efforts to diversify energy consumption away from oil and to diversify the region’s oil supply away from the Middle East, this level of dependence makes Asia Pacific economies extremely vulnerable to policy change, political upheaval, or warfare in Middle‐Eastern countries that could interrupt oil supplies. Another vulnerability for the region is its high level of dependence on sea transport through the Malacca Strait. Today, more than 90% of oil imported into Asia and the Pacific is transported by sea tanker through this narrow channel. (East West Center (EWC), 2008)15
According to EWC, the following six policy measures could make a significant contribution to energy security15:
o Initiate joint ventures with oil producers (oil exploration and production projects, refineries, storage facilities…);
o Improve the efficiency of domestic oil markets (energy deregulation, reconsideration of subsidies…);
o Build‐up strategic oil stocks (OECD/IEA standard…);
o Strengthen regional cooperation (APSA, APEC members, ASEAN‐Plus3…);
o Reduce transportation bottlenecks (oil pipelines, new port facilities…);
o Establish a regional oil futures market. 15 East-West Center Analysis, Asia Pacific Issues
No 85, August 2008
Another challenge could be the World LNG expanding demand in which Europe and the USA LNG share is expected to exceed that of Asia by 2020. While World LNG demand and supply are forecasted to be balanced up to 2030, any delay in the development of new projects under consideration could result in a tightened LNG market after 2010. (IEEJ, 2007)7
The future picture of the Asian energy sector is one of considerable demand increasing across all countries through 2030, most of it met with fossil fuels. Oil is the dominant fuel within the ASEAN region while coal is the dominant fuel in India and China. However, in response to the relatively stable price and supply advantages offered by coal over oil and gas, Asian nations are also emphasizing coal in their energy sector expansion plans. In this business‐as‐usual scenario, the projected constraints on future fossil fuel supplies and significant climate and health risks resulting from fossil fuel use call into question the viability of such an unrestrained expansion of fossil fuels. (USAID, 2007)4
The economic advantages (low generation cost, reduced air pollutions, and low exposure to price volatility from the operation of nuclear energy) are likely to contribute to considerable growth in nuclear energy over the outlook period, including Viet Nam after 2015. (APERC, 2006)5. Nuclear is now also considered as a potential option in Thailand, Malaysia and Indonesia.
While recent trends suggest that clean energy options and energy efficiency investments are gaining ground, the vast majority of investments continue to be directed towards conventional technologies and systems. Energy infrastructure is long‐lived (25‐50 years); therefore, it is critical that Asia does not become locked into inefficient and polluting energy technology that is dependent on imported fuels. To change the current course and realize the benefits of clean energy, Asia’s energy sector stakeholders will need a blend of enabling policies, incentives, and financial resources. (USAID, 2007)4

ENERGY TRENDS IN THE EUROPEAN UNION & ASIA TO 2030
20
BLANK


