26 September 2014 Analysis of the EU fruit and vegetables sector EU production and exports to Russia (2011-2013) Recent market trends and measures taken to address market disruptions following the Russian import ban EU production and exports to Russia In the EU-28, the fruit and vegetables sector accounts for 17% of the total agricultural output value, of which 10% corresponds to vegetables and the remaining 7% to fruits. The importance of the sector is higher in most of the southern Member States, representing between one third and one quarter of their total agricultural output (on average for the period 2011-2013, more than 30% in Greece, Cyprus, Malta and Portugal, and between 25% and 30% in Spain, Italy and Romania). Most of the EU's production of fresh fruit and vegetables is consumed internally: overall, only 15% of the total fruit production and 7% of the vegetables production is exported outside the EU (in value). In terms of quantities of fresh fruit produced, the EU exports around 32% of the production of kiwis, 15.5% of pears, 12-13% of apples and nectarines, 6-8% of peaches, lemons and table grapes, and 5.5% or less of the production of apricots, cherries, strawberries, oranges, melons and watermelons. In the case of vegetables, EU exports represent around 12.5% of the production of onions, 5-6% of sweet peppers and mushrooms, and less than 5% of the production of tomatoes, potatoes, cucumbers, carrots, cauliflowers and broccoli, cabbages and eggplants. EU exports to Russia only account for 5% of total EU fruit production and 2% of the vegetable production (in value). In quantities, about 9% of the production of pears and kiwis, 6-7% of apples and nectarines and 3-4% of the production of peaches and mushrooms is exported to Russia. Russia represents however the main export market for the EU's fruit and vegetables production, currently buying about one third (34%) of our fresh fruit exports (EUR 1 225 million) and one quarter (26%) of the fresh vegetable exports (EUR 734 million). For many fruit and vegetable products, Russia is the top destination: this is the case for cherries, mushrooms and cabbages (70% of extra-EU exports, in quantities), pears, peaches, eggplants, tomatoes and carrots (60- 64%), nectarines, strawberries, apples and cucumbers (around 50%), and apricots, potatoes and sweet peppers (40%). One third of the exports of lemons and table grapes are also sent to Russia. Between 2011 and 2013, exports to Russia significantly increased for some products (especially for apples, cherries, strawberries, melons and watermelons, in the case of fruits, and for tomatoes, cucumbers, sweet peppers, cauliflowers and broccoli, and eggplants among the
Transcript
26 September 2014
Analysis of the EU fruit and vegetables
sector
EU production and exports to Russia (2011-2013)
Recent market trends and measures taken to address market disruptions following the Russian import ban
EU production and exports to Russia
In the EU-28, the fruit and vegetables sector accounts for 17% of the total agricultural output
value, of which 10% corresponds to vegetables and the remaining 7% to fruits. The importance
of the sector is higher in most of the southern Member States, representing between one third
and one quarter of their total agricultural output (on average for the period 2011-2013, more
than 30% in Greece, Cyprus, Malta and Portugal, and between 25% and 30% in Spain, Italy and
Romania).
Most of the EU's production of fresh fruit and vegetables is consumed internally: overall, only
15% of the total fruit production and 7% of the vegetables production is exported outside the EU
(in value). In terms of quantities of fresh fruit produced, the EU exports around 32% of the
production of kiwis, 15.5% of pears, 12-13% of apples and nectarines, 6-8% of peaches, lemons
and table grapes, and 5.5% or less of the production of apricots, cherries, strawberries, oranges,
melons and watermelons. In the case of vegetables, EU exports represent around 12.5% of the
production of onions, 5-6% of sweet peppers and mushrooms, and less than 5% of the
production of tomatoes, potatoes, cucumbers, carrots, cauliflowers and broccoli, cabbages and
eggplants.
EU exports to Russia only account for 5% of total EU fruit production and 2% of the vegetable
production (in value). In quantities, about 9% of the production of pears and kiwis, 6-7% of
apples and nectarines and 3-4% of the production of peaches and mushrooms is exported to
Russia.
Russia represents however the main export market for the EU's fruit and vegetables production,
currently buying about one third (34%) of our fresh fruit exports (EUR 1 225 million) and one
quarter (26%) of the fresh vegetable exports (EUR 734 million). For many fruit and vegetable
products, Russia is the top destination: this is the case for cherries, mushrooms and cabbages
(70% of extra-EU exports, in quantities), pears, peaches, eggplants, tomatoes and carrots (60-
64%), nectarines, strawberries, apples and cucumbers (around 50%), and apricots, potatoes and
sweet peppers (40%). One third of the exports of lemons and table grapes are also sent to
Russia.
Between 2011 and 2013, exports to Russia significantly increased for some products (especially
for apples, cherries, strawberries, melons and watermelons, in the case of fruits, and for
tomatoes, cucumbers, sweet peppers, cauliflowers and broccoli, and eggplants among the
Analysis of the EU fruit and vegetables sector
26 September 2014 2
vegetables), decreasing in other cases (pears, peaches, nectarines and apricots, and also
potatoes, cabbages and onions). In the same period, production of fruit and vegetables in the EU
remained quite stable.
The main EU exporters of fresh fruit to Russia are Poland, Belgium, Lithuania and Spain: Poland is
the origin of 41% of the exports, whereas the other three countries account for 10-13% each (in
quantities). For vegetables, the main exporters to Russia are the Netherlands, Lithuania and
Poland, representing 34%, 25% and 16% of the exports, respectively (in quantities).
Nonetheless, these figures (based on Comext data), do not always reflect the real origin (i.e. the
producing country) of the products, as they are influenced by the intra-EU trade: actually, with
very little production (and almost no production of fruit), Lithuania is an important channel for re-
exports to Russia of fresh fruit and vegetables imported from other EU producers such as Spain,
the Netherlands and Germany; Poland and Belgium play a similar role for specific products.
Without considering this internal trade, the main EU suppliers to Russia of fresh fruits are Poland
(7%), Spain (6%), Greece (4%), Italy (3%) and Belgium (2%). For fresh vegetables the
Netherlands (10%), Poland (9%), Spain (8%) and Belgium (2%) are the main suppliers (all these
figures in value, average 2012-2013, based on Comtrade data1).
EU market trends
Market trends for the more relevant products exported to Russia, in the main exporting EU countries
up to the third week of September can be summarised as follows:
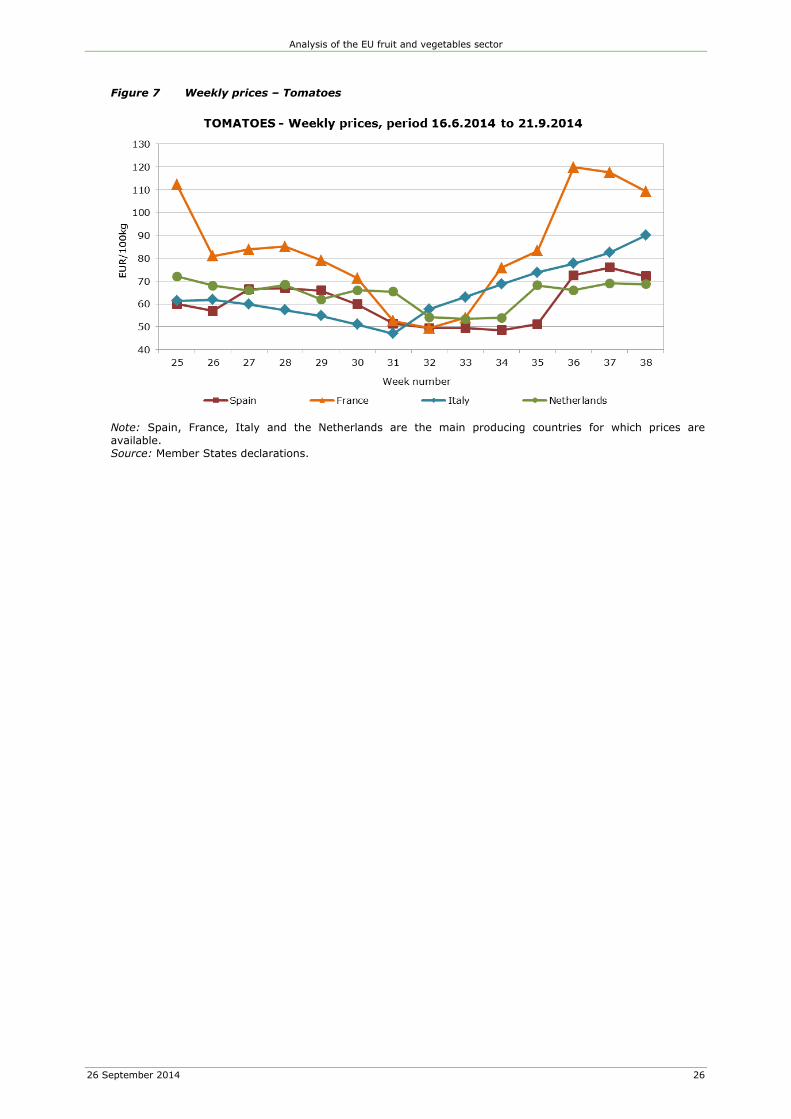
The recent positive trend observed in the last weeks for tomatoes is confirmed, with steady price
increases; prices are above average prices of previous campaigns. Prices for peaches and
nectarines are also recovering, after very low prices in August, but are still lower than in previous
campaigns; the season is almost over for these fruits.
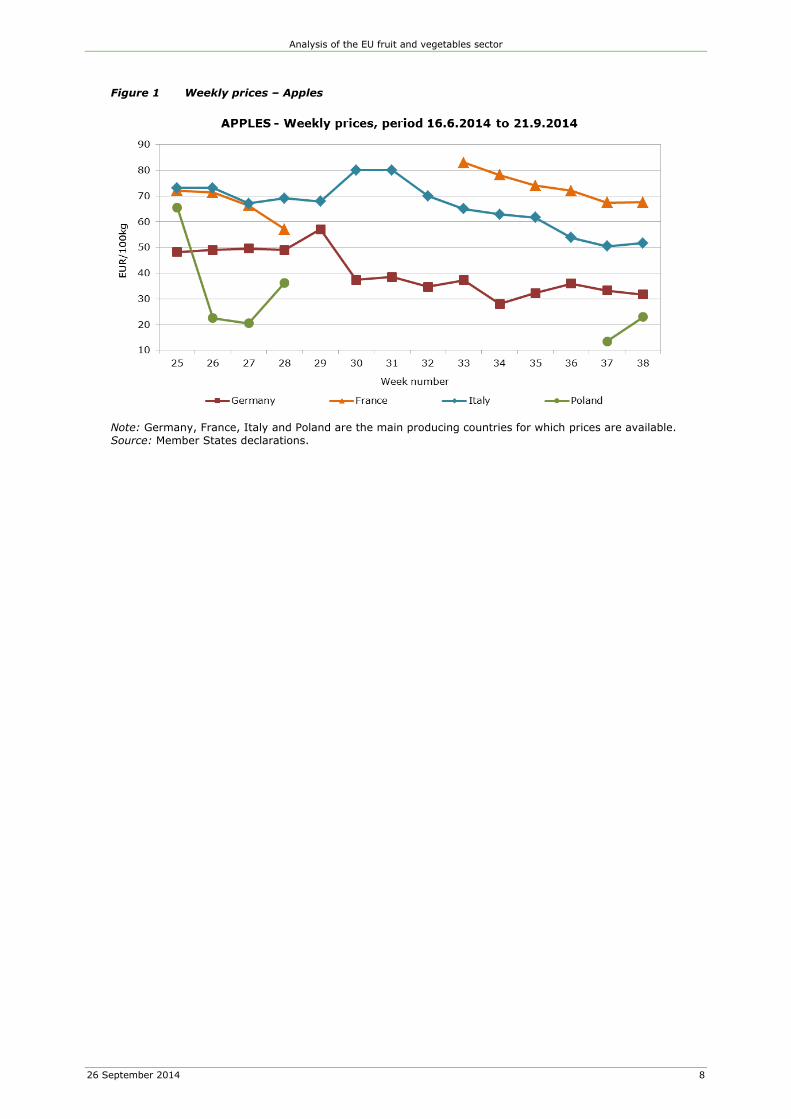
Prices for pears, apples and table grapes have been falling since August with a slight recovery last
week; prices are still lower than in previous marketing years.
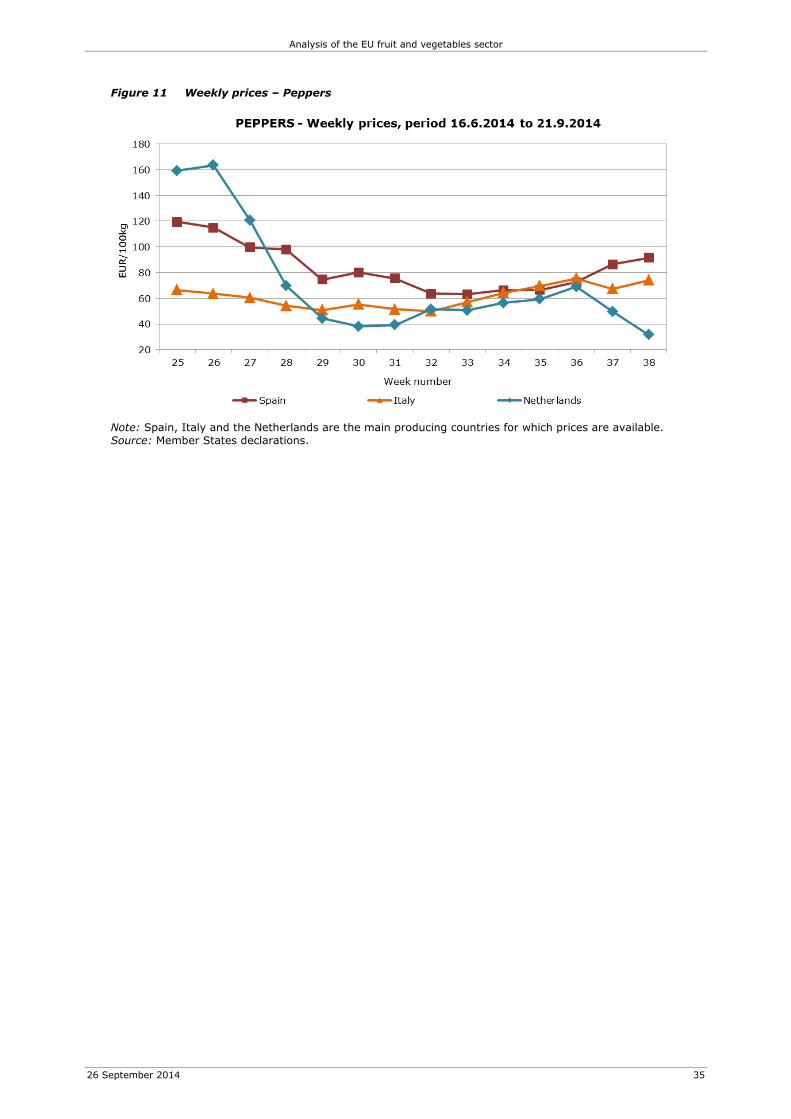
For peppers, prices are following the trends of previous campaigns.
Measures taken following the Russian import ban
The European Commission has adopted measures to support the market. Commission Delegated
Regulation (EU) No 913/2014 of 21 August 2014 lays down temporary exceptional support measures
for producers of peaches and nectarines. These measures apply retro-actively as from 11 August
2014. The uptake until now is around 26 000 t (of which 15 000 t for free distribution) and Union
financial assistance around EUR 10 million.
Since the announcement of import restrictions by Russia on 6 August 2014, the Commission
immediately reacted and presented proposals for exceptional support measures for Union producers
of perishable fruit and vegetables. On 29 August 2014 the Commission adopted Commission
kiwis, apples and pears. These products are primarily harvested at this time of the year. The
measures have been based on taking into account the exports to Russia of fruits and vegetables from
August up to the winter period.
1 In Comtrade, the UN international trade database, Russia declares more often the country of origin of the products, removing partly the effect of re-exports of products originating from a different EU Member State.
Analysis of the EU fruit and vegetables sector
26 September 2014 3
The measures aim at stabilising the market through the support of market withdrawals, especially for
free distribution, and compensation for non-harvesting and green harvesting. The measures are open
to all producers regardless whether they are members of a producer organisation or not. The Union
contribution to members of producer organisations is set at 75%, and for non-members it is 50%, of
the fixed withdrawal prices, except on withdrawal for free distribution where the EU contribution is
100% for all producers. The measures have a retroactive effect as from August 18, with a budget
foreseen of up to EUR 125 million. However, on 10 September the Commission announced that it
would not receive further notifications from Member States, due to a disproportionate surge in claims
(Notifications reached EUR 167.5 million of which 89% from Poland).
The Commission is following the market developments for all products concerned very closely and will
adopt shortly a new scheme more targeted based on average exported quantities per Member State,
in order to supplement the previous one.
This document does not necessarily represent the official views of the European Commission
Contact: DG Agriculture and Rural Development, Unit Agricultural Modelling and Outlook
Source: Eurostat - Agricultural production, Economic Accounts for Agriculture (table aact_eaa01). Total is the
sum of 10000 - Crop output and 13000 - Animal output. Fruits correspond to 06000 - Fresh fruit. Vegetables is
the sum of 04100 - Fresh vegetables and 05000 - Potatoes (including seeds), i.e. excluding plants and
flowers.
VALUES
Agricultural output - Average 2011-2013
F&V Fruits Vegetables
Analysis of the EU fruit and vegetables sector
26 September 2014 5
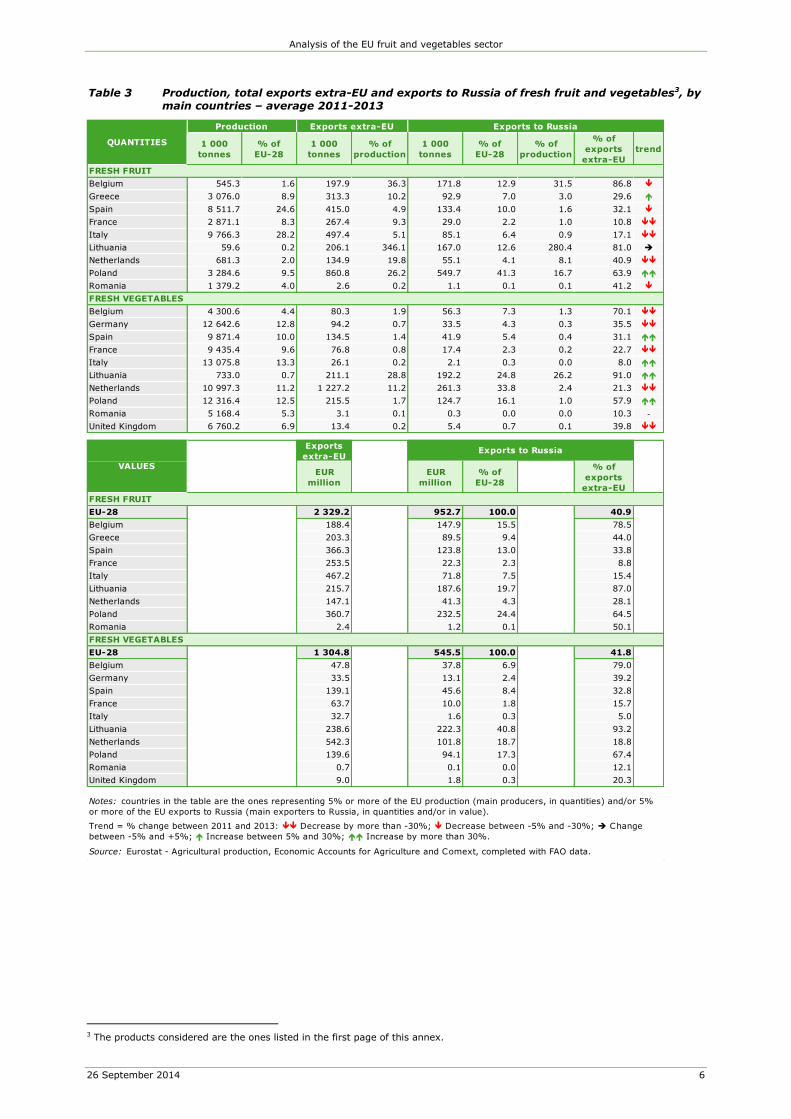
Table 2 Production, total exports extra-EU and exports to Russia of fresh fruit and vegetables, by
main product2 – EU-28, average 2011-2013
2 All together, these products represented about 78% and 74% respectively of the value of exports of fresh fruit and vegetables to Russia in the period analysed.
1 000
tonnestrend
1 000
tonnes
% of
productiontrend
1 000
tonnes
% of
production
% of
exports
extra-EU
trend
Apples 11 429.2 1 428.2 12.5 690.5 6.0 48.3
Pears 2 480.3 383.6 15.5 236.4 9.5 61.6
Peaches 2 522.6 164.4 6.5 99.9 4.0 60.8
Nectarines 1 251.8 163.3 13.0 84.1 6.7 51.5
Apricots 654.2 21.3 3.3 8.5 1.3 39.8
Cherries 799.3 24.1 3.0 17.0 2.1 70.3
Strawberries 1 070.2 59.0 5.5 29.3 2.7 49.6
Oranges 6 176.5 290.6 4.7 31.2 0.5 10.7
Lemons 1 223.0 77.4 6.3 25.6 2.1 33.0
Table grapes 1 753.2 134.5 7.7 42.9 2.4 31.9
Melons 1 938.4 41.0 2.1 3.2 0.2 7.8
Watermelons 2 681.7 47.8 1.8 2.6 0.1 5.5
Kiwis 687.5 222.1 32.3 59.3 8.6 26.7
Tomatoes 15 337.9 276.7 1.8 167.0 1.1 60.3
Potatoes 59 875.0 681.9 1.1 252.3 0.4 37.0
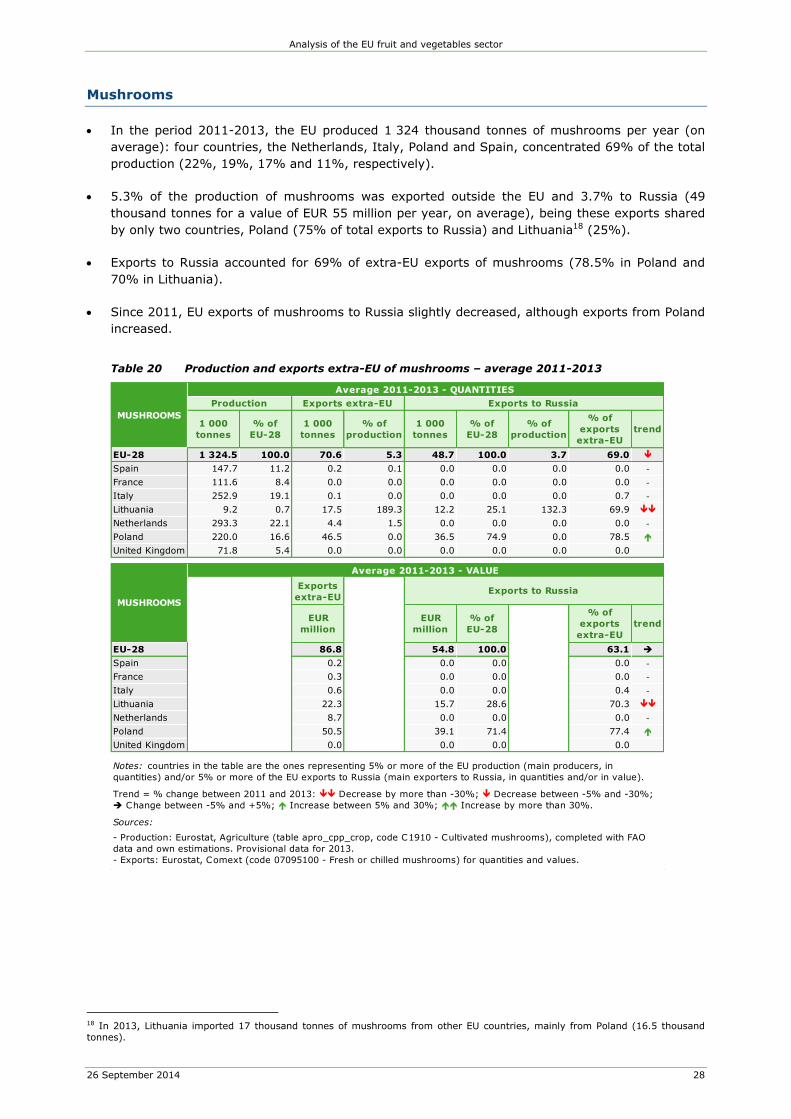
Mushrooms 1 324.5 70.6 5.3 48.7 3.7 69.0
Cucumbers 2 151.9 60.3 2.8 27.6 1.3 45.7
Carrots 5 216.0 98.8 1.9 58.5 1.1 59.2
Sweet peppers 2 259.2 132.0 5.8 49.5 2.2 37.5
Cauliflowers and broccoli 2 211.7 55.2 2.5 22.7 1.0 41.1
Cabbages 3 567.2 58.1 1.6 40.4 1.1 69.6
Eggplants 723.5 25.9 3.6 16.6 2.3 63.9
Onions 5 948.7 745.0 12.5 90.9 1.5 12.2
Production
EUR millionEUR
million
% of
production
EUR
million
% of
production
% of
exports
extra-EU
Apples 4 368.1 777.9 17.8 322.8 7.4 41.5
Pears 1 534.2 297.0 19.4 178.2 11.6 60.0
Peaches 1 764.4 161.6 9.2 104.6 5.9 64.7
Nectarines : 154.7 : 80.8 : 52.2
Apricots : 31.2 : 11.9 : 38.1
Cherries : 45.2 : 28.5 : 63.0
Strawberries : 153.2 : 62.4 : 40.7
Oranges 1 835.9 168.2 9.2 22.6 1.2 13.5
Lemons 531.5 66.8 12.6 22.3 4.2 33.4
Table grapes 989.3 191.6 19.4 62.0 6.3 32.4
Melons : 45.1 : 3.5 : 7.7
Watermelons : 25.0 : 2.0 : 8.1
Kiwis : 211.8 : 51.1 : 24.1
Total selection : 2 329.2 : 952.7 : 40.9
Total fresh fruit 24 373.0 3 627.1 14.9 1 225.2 5.0 33.8
Tomatoes 5 428.5 344.1 6.3 192.0 3.5 55.8
Potatoes 9 718.5 204.9 2.1 86.2 0.9 42.1
Mushrooms : 86.8 : 54.8 : 63.1
Cucumbers : 64.6 : 30.4 : 47.1
Carrots : 35.6 : 17.9 : 50.3
Sweet peppers : 248.1 : 74.5 : 30.0
Cauliflowers and broccoli 881.8 56.5 6.4 17.3 2.0 30.5
Notes: countries in the table are the ones representing 5% or more of the EU production (main producers, in quantities) and/or 5%
or more of the EU exports to Russia (main exporters to Russia, in quantities and/or in value).
Trend = % change between 2011 and 2013: Decrease by more than -30%; Decrease between -5% and -30%; Change
between -5% and +5%; Increase between 5% and 30%; Increase by more than 30%.
Source: Eurostat - Agricultural production, Economic Accounts for Agriculture and Comext, completed with FAO data.
Production Exports extra-EU Exports to Russia
VALUES
Exports to Russia
QUANTITIES
FRESH FRUIT
FRESH VEGETABLES
FRESH FRUIT
FRESH VEGETABLES
Analysis of the EU fruit and vegetables sector
26 September 2014 7
Fruits
Apples
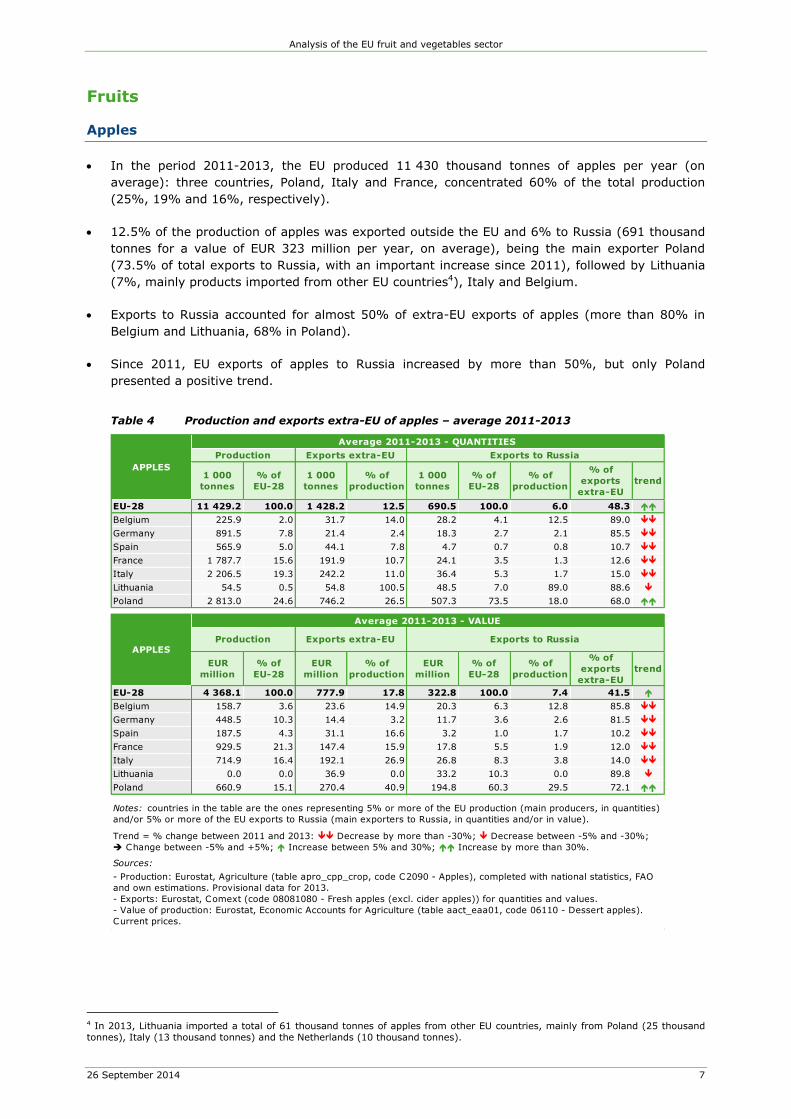
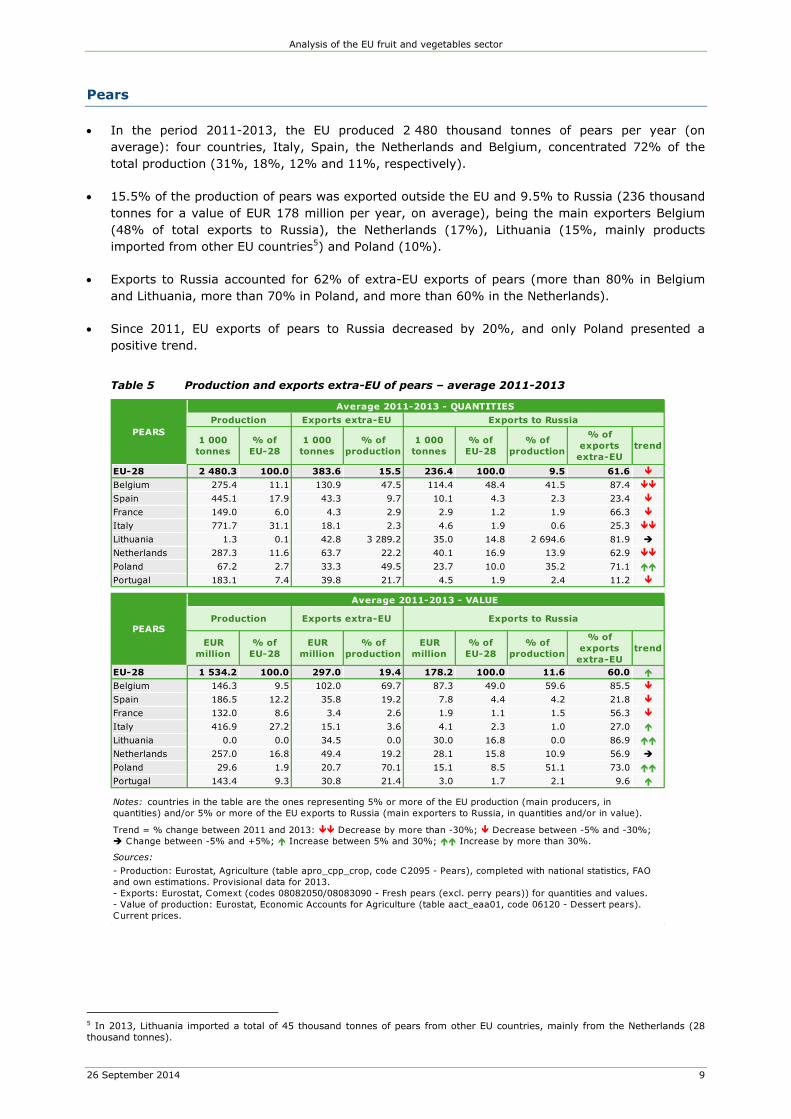
In the period 2011-2013, the EU produced 11 430 thousand tonnes of apples per year (on
average): three countries, Poland, Italy and France, concentrated 60% of the total production
(25%, 19% and 16%, respectively).
12.5% of the production of apples was exported outside the EU and 6% to Russia (691 thousand
tonnes for a value of EUR 323 million per year, on average), being the main exporter Poland
(73.5% of total exports to Russia, with an important increase since 2011), followed by Lithuania
(7%, mainly products imported from other EU countries4), Italy and Belgium.
Exports to Russia accounted for almost 50% of extra-EU exports of apples (more than 80% in
Belgium and Lithuania, 68% in Poland).
Since 2011, EU exports of apples to Russia increased by more than 50%, but only Poland
presented a positive trend.
Table 4 Production and exports extra-EU of apples – average 2011-2013
4 In 2013, Lithuania imported a total of 61 thousand tonnes of apples from other EU countries, mainly from Poland (25 thousand tonnes), Italy (13 thousand tonnes) and the Netherlands (10 thousand tonnes).
- Production: Eurostat, Agriculture (table apro_cpp_crop, code C2095 - Pears), completed with national statistics, FAO
and own estimations. Provisional data for 2013.
- Exports: Eurostat, Comext (codes 08082050/08083090 - Fresh pears (excl. perry pears)) for quantities and values.
- Value of production: Eurostat, Economic Accounts for Agriculture (table aact_eaa01, code 06120 - Dessert pears).
Current prices.
Trend = % change between 2011 and 2013: Decrease by more than -30%; Decrease between -5% and -30%;
Change between -5% and +5%; Increase between 5% and 30%; Increase by more than 30%.
PEARS
Average 2011-2013 - QUANTITIES
Production Exports extra-EU Exports to Russia
PEARS
Average 2011-2013 - VALUE
Exports extra-EUProduction
Notes: countries in the table are the ones representing 5% or more of the EU production (main producers, in
quantities) and/or 5% or more of the EU exports to Russia (main exporters to Russia, in quantities and/or in value).
Analysis of the EU fruit and vegetables sector
26 September 2014 10
Figure 2 Weekly prices – Pears
Note: Belgium, Spain and Italy are the main producing countries for which prices are available.
Source: Member States declarations.
Analysis of the EU fruit and vegetables sector
26 September 2014 11
Peaches
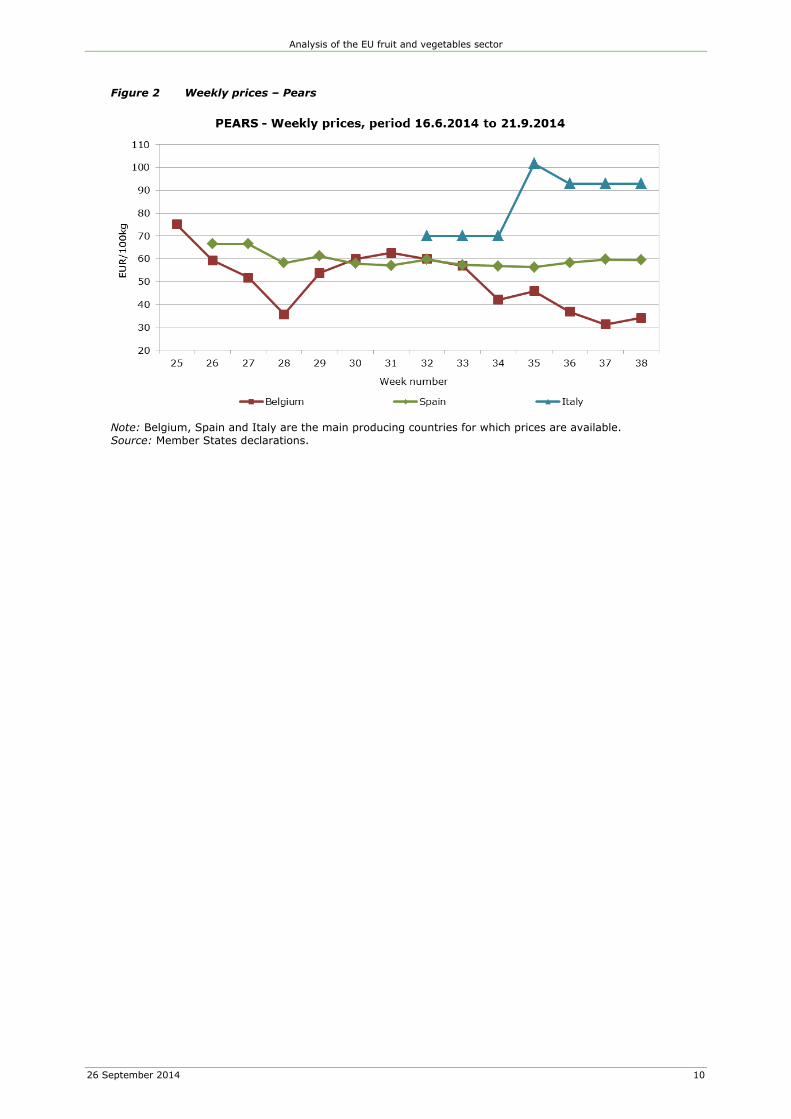
In the period 2011-2013, the EU produced 2 523 thousand tonnes of peaches per year (on
average): three countries, Italy, Spain and Greece, concentrated 90% of the total production
(37%, 31% and 21%, respectively).
6.5% of the production of peaches was exported outside the EU and 4% to Russia (100 thousand
tonnes for a value of EUR 105 million per year, on average), being the main exporters Spain
(41.5% of total exports to Russia) and Greece (27%); with no production of peaches, Belgium
and Lithuania contributed with 11-12% each (exports to Russia from these two countries contain
products imported from other EU countries6).
Exports to Russia accounted for 61% of extra-EU exports of peaches (95% in Belgium, 82% in
Lithuania, and 72% in Spain).
Since 2011, EU exports of peaches to Russia slightly decreased, and only Belgium and Greece
presented a positive trend.
Table 6 Production and exports extra-EU of peaches – average 2011-2013
6 In 2013, Lithuania imported a total of 16 thousand tonnes of peaches from other EU countries, mainly from Spain (7 thousand tonnes) and the Netherlands (5 thousand tonnes), whereas Belgium imported 33 thousand tonnes, mainly from Spain (26 thousand tonnes).
- Production: Eurostat, Agriculture (table apro_cpp_crop, code C2180 - Peaches), completed with national statistics.
Provisional data for 2013.
- Exports: Eurostat, Comext (code 08093090 - Fresh peaches) for quantities and values.
- Value of production: Eurostat, Economic Accounts for Agriculture (table aact_eaa01, code 06130 - Peaches). Current
prices.
Trend = % change between 2011 and 2013: Decrease by more than -30%; Decrease between -5% and -30%;
Change between -5% and +5%; Increase between 5% and 30%; Increase by more than 30%.
PEACHES
Average 2011-2013 - QUANTITIES
Production Exports extra-EU Exports to Russia
PEACHES
Average 2011-2013 - VALUE
Production
Notes: countries in the table are the ones representing 5% or more of the EU production (main producers, in
quantities) and/or 5% or more of the EU exports to Russia (main exporters to Russia, in quantities and/or in value).
Analysis of the EU fruit and vegetables sector
26 September 2014 12
Figure 3 Weekly prices – Peaches
Note: Greece, Spain, France and Italy are the main producing countries for which prices are available.
Source: Member States declarations.
Analysis of the EU fruit and vegetables sector
26 September 2014 13
Nectarines
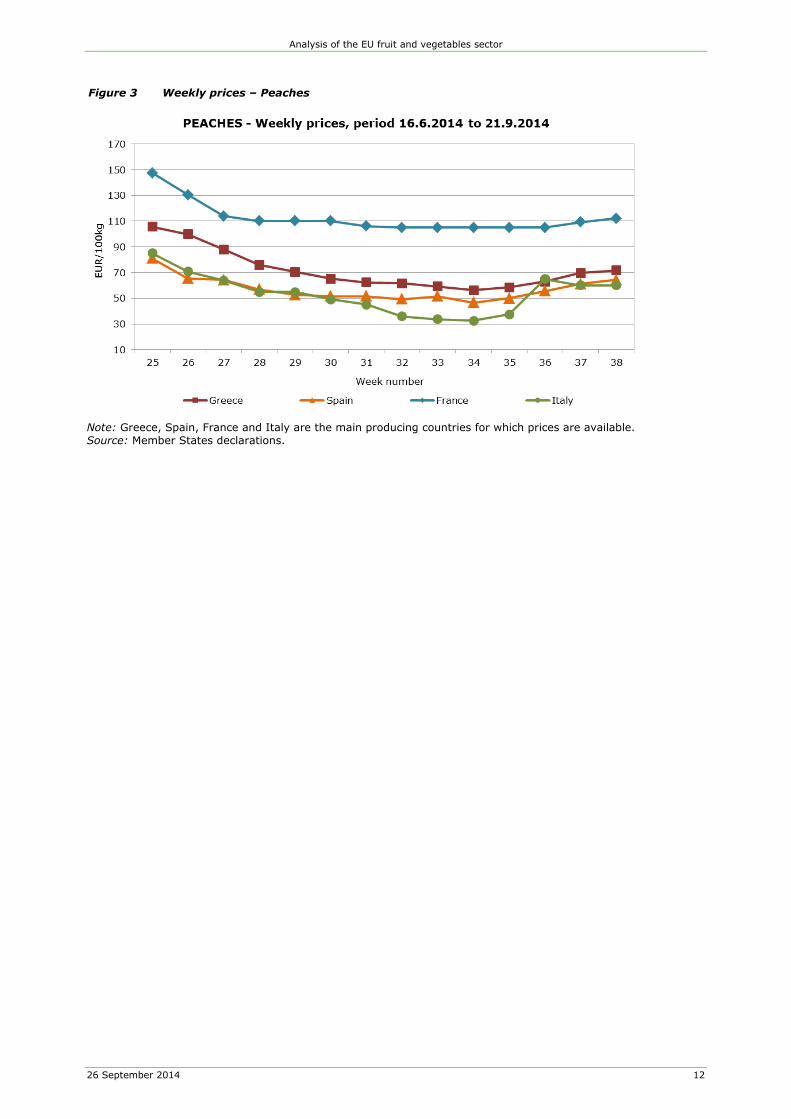
In the period 2011-2013, the EU produced 1 252 thousand tonnes of nectarines per year (on
average): 99% of the production was concentrated in four countries, Italy, Spain, France and
Greece (42%, 39%, 10.5% and 8%, respectively).
13% of the production of nectarines was exported outside the EU and 6.7% to Russia (84
thousand tonnes for a value of EUR 81 million per year, on average), being the main exporters
Spain (42.5% of total exports to Russia), Greece and Italy (11-14%) and two non-producer
countries, Belgium and Lithuania (13-15% of the exports, mainly products imported from other
EU countries7).
Exports to Russia accounted for 51.5% of extra-EU exports of nectarines (96% in Belgium, 80%
in Lithuania, and 61% in Spain).
Since 2011, EU exports of nectarines to Russia decreased by 18%, and only Greece presented a
positive trend.
Table 7 Production and exports extra-EU of nectarines – average 2011-2013
7 In 2013, Lithuania imported a total of 16 thousand tonnes of nectarines from other EU countries, mainly from Spain (7 thousand tonnes), the Netherlands (4 thousand tonnes) and Italy (3 thousand tonnes), whereas Belgium imported 42 thousand tonnes, mainly from Spain (27 thousand tonnes).
- Production: Eurostat, Agriculture (table apro_cpp_crop, code C2221 - Nectarines), completed with national statistics
and own estimations. Provisional data for 2013.
- Exports: Eurostat, Comext (code 08093010 - Fresh nectarines) for quantities and values.
Trend = % change between 2011 and 2013: Decrease by more than -30%; Decrease between -5% and -30%;
Change between -5% and +5%; Increase between 5% and 30%; Increase by more than 30%.
Average 2011-2013 - VALUE
Notes: countries in the table are the ones representing 5% or more of the EU production (main producers, in
quantities) and/or 5% or more of the EU exports to Russia (main exporters to Russia, in quantities and/or in value).
NECTARINES
Average 2011-2013 - QUANTITIES
Production Exports extra-EU Exports to Russia
NECTARINESExports to Russia
Analysis of the EU fruit and vegetables sector
26 September 2014 14
Figure 4 Weekly prices – Nectarines
Note: Greece, Spain, France and Italy are the main producing countries for which prices are available.
Source: Member States declarations.
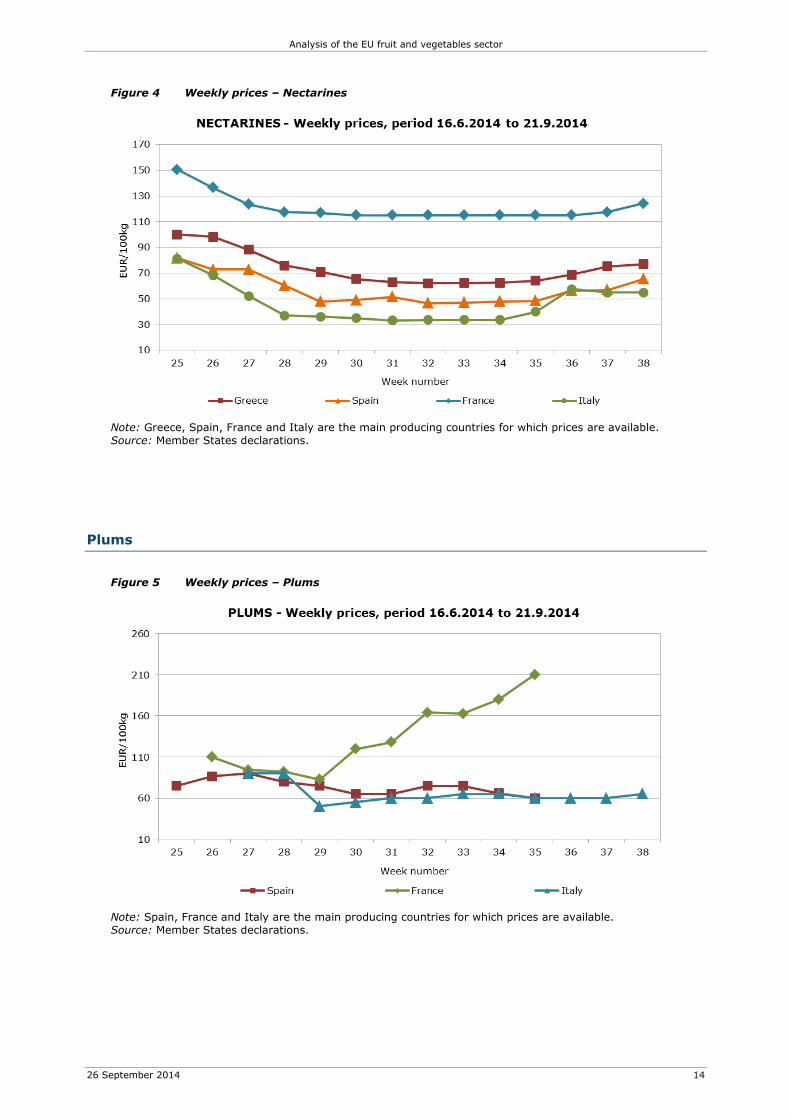
Plums
Figure 5 Weekly prices – Plums
Note: Spain, France and Italy are the main producing countries for which prices are available.
Source: Member States declarations.
Analysis of the EU fruit and vegetables sector
26 September 2014 15
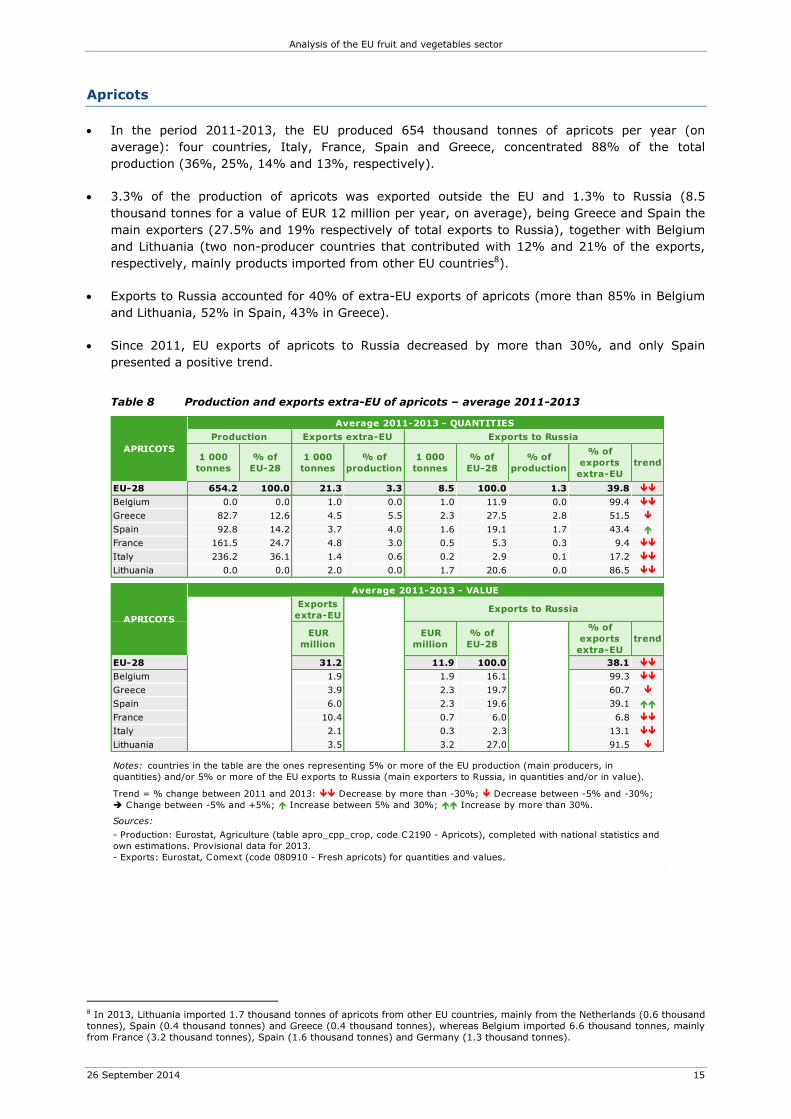
Apricots
In the period 2011-2013, the EU produced 654 thousand tonnes of apricots per year (on
average): four countries, Italy, France, Spain and Greece, concentrated 88% of the total
production (36%, 25%, 14% and 13%, respectively).
3.3% of the production of apricots was exported outside the EU and 1.3% to Russia (8.5
thousand tonnes for a value of EUR 12 million per year, on average), being Greece and Spain the
main exporters (27.5% and 19% respectively of total exports to Russia), together with Belgium
and Lithuania (two non-producer countries that contributed with 12% and 21% of the exports,
respectively, mainly products imported from other EU countries8).
Exports to Russia accounted for 40% of extra-EU exports of apricots (more than 85% in Belgium
and Lithuania, 52% in Spain, 43% in Greece).
Since 2011, EU exports of apricots to Russia decreased by more than 30%, and only Spain
presented a positive trend.
Table 8 Production and exports extra-EU of apricots – average 2011-2013
8 In 2013, Lithuania imported 1.7 thousand tonnes of apricots from other EU countries, mainly from the Netherlands (0.6 thousand tonnes), Spain (0.4 thousand tonnes) and Greece (0.4 thousand tonnes), whereas Belgium imported 6.6 thousand tonnes, mainly from France (3.2 thousand tonnes), Spain (1.6 thousand tonnes) and Germany (1.3 thousand tonnes).
1 000
tonnes
% of
EU-28
1 000
tonnes
% of
production
1 000
tonnes
% of
EU-28
% of
production
% of
exports
extra-EU
trend
EU-28 654.2 100.0 21.3 3.3 8.5 100.0 1.3 39.8
Belgium 0.0 0.0 1.0 0.0 1.0 11.9 0.0 99.4
Greece 82.7 12.6 4.5 5.5 2.3 27.5 2.8 51.5
Spain 92.8 14.2 3.7 4.0 1.6 19.1 1.7 43.4
France 161.5 24.7 4.8 3.0 0.5 5.3 0.3 9.4
Italy 236.2 36.1 1.4 0.6 0.2 2.9 0.1 17.2
Lithuania 0.0 0.0 2.0 0.0 1.7 20.6 0.0 86.5
Exports
extra-EU
EUR
million
EUR
million
% of
EU-28
% of
exports
extra-EU
trend
EU-28 31.2 11.9 100.0 38.1
Belgium 1.9 1.9 16.1 99.3
Greece 3.9 2.3 19.7 60.7
Spain 6.0 2.3 19.6 39.1
France 10.4 0.7 6.0 6.8
Italy 2.1 0.3 2.3 13.1
Lithuania 3.5 3.2 27.0 91.5
Trend = % change between 2011 and 2013: Decrease by more than -30%; Decrease between -5% and -30%;
Change between -5% and +5%; Increase between 5% and 30%; Increase by more than 30%.
Exports to Russia
Exports to Russia
APRICOTS
Average 2011-2013 - VALUE
Notes: countries in the table are the ones representing 5% or more of the EU production (main producers, in
quantities) and/or 5% or more of the EU exports to Russia (main exporters to Russia, in quantities and/or in value).
Sources:
- Production: Eurostat, Agriculture (table apro_cpp_crop, code C2190 - Apricots), completed with national statistics and
own estimations. Provisional data for 2013.
- Exports: Eurostat, Comext (code 080910 - Fresh apricots) for quantities and values.
APRICOTS
Average 2011-2013 - QUANTITIES
Production Exports extra-EU
Analysis of the EU fruit and vegetables sector
26 September 2014 16
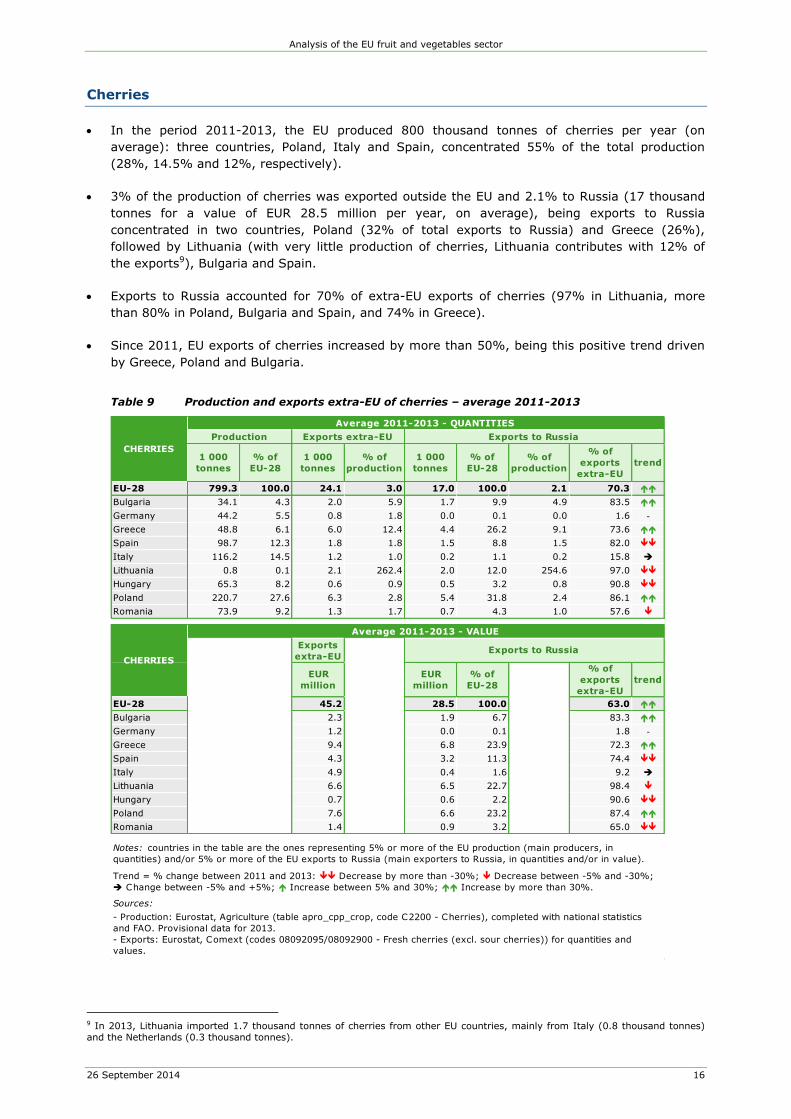
Cherries
In the period 2011-2013, the EU produced 800 thousand tonnes of cherries per year (on
average): three countries, Poland, Italy and Spain, concentrated 55% of the total production
(28%, 14.5% and 12%, respectively).
3% of the production of cherries was exported outside the EU and 2.1% to Russia (17 thousand
tonnes for a value of EUR 28.5 million per year, on average), being exports to Russia
concentrated in two countries, Poland (32% of total exports to Russia) and Greece (26%),
followed by Lithuania (with very little production of cherries, Lithuania contributes with 12% of
the exports9), Bulgaria and Spain.
Exports to Russia accounted for 70% of extra-EU exports of cherries (97% in Lithuania, more
than 80% in Poland, Bulgaria and Spain, and 74% in Greece).
Since 2011, EU exports of cherries increased by more than 50%, being this positive trend driven
by Greece, Poland and Bulgaria.
Table 9 Production and exports extra-EU of cherries – average 2011-2013
9 In 2013, Lithuania imported 1.7 thousand tonnes of cherries from other EU countries, mainly from Italy (0.8 thousand tonnes) and the Netherlands (0.3 thousand tonnes).
1 000
tonnes
% of
EU-28
1 000
tonnes
% of
production
1 000
tonnes
% of
EU-28
% of
production
% of
exports
extra-EU
trend
EU-28 799.3 100.0 24.1 3.0 17.0 100.0 2.1 70.3
Bulgaria 34.1 4.3 2.0 5.9 1.7 9.9 4.9 83.5
Germany 44.2 5.5 0.8 1.8 0.0 0.1 0.0 1.6 -
Greece 48.8 6.1 6.0 12.4 4.4 26.2 9.1 73.6
Spain 98.7 12.3 1.8 1.8 1.5 8.8 1.5 82.0
Italy 116.2 14.5 1.2 1.0 0.2 1.1 0.2 15.8
Lithuania 0.8 0.1 2.1 262.4 2.0 12.0 254.6 97.0
Hungary 65.3 8.2 0.6 0.9 0.5 3.2 0.8 90.8
Poland 220.7 27.6 6.3 2.8 5.4 31.8 2.4 86.1
Romania 73.9 9.2 1.3 1.7 0.7 4.3 1.0 57.6
Exports
extra-EU
EUR
million
EUR
million
% of
EU-28
% of
exports
extra-EU
trend
EU-28 45.2 28.5 100.0 63.0
Bulgaria 2.3 1.9 6.7 83.3
Germany 1.2 0.0 0.1 1.8 -
Greece 9.4 6.8 23.9 72.3
Spain 4.3 3.2 11.3 74.4
Italy 4.9 0.4 1.6 9.2
Lithuania 6.6 6.5 22.7 98.4
Hungary 0.7 0.6 2.2 90.6
Poland 7.6 6.6 23.2 87.4
Romania 1.4 0.9 3.2 65.0
Trend = % change between 2011 and 2013: Decrease by more than -30%; Decrease between -5% and -30%;
Change between -5% and +5%; Increase between 5% and 30%; Increase by more than 30%.
Exports to Russia
Notes: countries in the table are the ones representing 5% or more of the EU production (main producers, in
quantities) and/or 5% or more of the EU exports to Russia (main exporters to Russia, in quantities and/or in value).
CHERRIES
Average 2011-2013 - QUANTITIES
Production Exports extra-EU Exports to Russia
CHERRIES
Average 2011-2013 - VALUE
Sources:
- Production: Eurostat, Agriculture (table apro_cpp_crop, code C2200 - Cherries), completed with national statistics
and FAO. Provisional data for 2013.
- Exports: Eurostat, Comext (codes 08092095/08092900 - Fresh cherries (excl. sour cherries)) for quantities and
values.
Analysis of the EU fruit and vegetables sector
26 September 2014 17
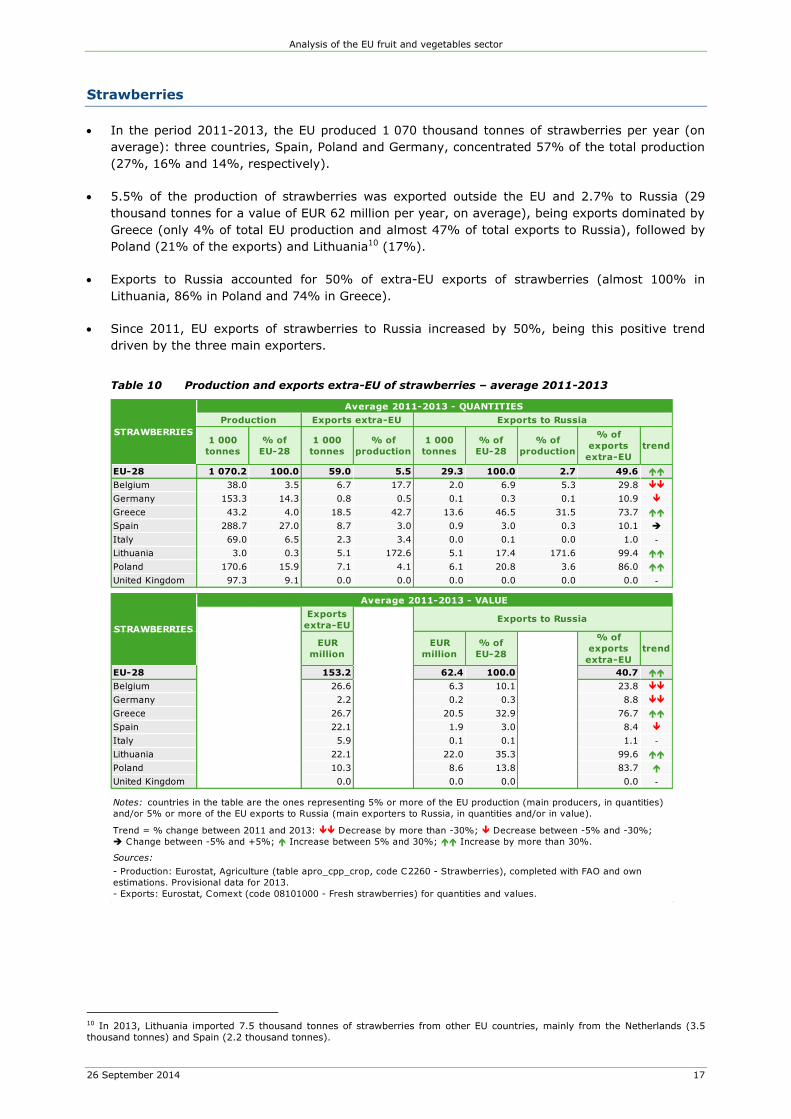
Strawberries
In the period 2011-2013, the EU produced 1 070 thousand tonnes of strawberries per year (on
average): three countries, Spain, Poland and Germany, concentrated 57% of the total production
(27%, 16% and 14%, respectively).
5.5% of the production of strawberries was exported outside the EU and 2.7% to Russia (29
thousand tonnes for a value of EUR 62 million per year, on average), being exports dominated by
Greece (only 4% of total EU production and almost 47% of total exports to Russia), followed by
Poland (21% of the exports) and Lithuania10 (17%).
Exports to Russia accounted for 50% of extra-EU exports of strawberries (almost 100% in
Lithuania, 86% in Poland and 74% in Greece).
Since 2011, EU exports of strawberries to Russia increased by 50%, being this positive trend
driven by the three main exporters.
Table 10 Production and exports extra-EU of strawberries – average 2011-2013
10 In 2013, Lithuania imported 7.5 thousand tonnes of strawberries from other EU countries, mainly from the Netherlands (3.5 thousand tonnes) and Spain (2.2 thousand tonnes).
1 000
tonnes
% of
EU-28
1 000
tonnes
% of
production
1 000
tonnes
% of
EU-28
% of
production
% of
exports
extra-EU
trend
EU-28 1 070.2 100.0 59.0 5.5 29.3 100.0 2.7 49.6
Belgium 38.0 3.5 6.7 17.7 2.0 6.9 5.3 29.8
Germany 153.3 14.3 0.8 0.5 0.1 0.3 0.1 10.9
Greece 43.2 4.0 18.5 42.7 13.6 46.5 31.5 73.7
Spain 288.7 27.0 8.7 3.0 0.9 3.0 0.3 10.1
Italy 69.0 6.5 2.3 3.4 0.0 0.1 0.0 1.0 -
Lithuania 3.0 0.3 5.1 172.6 5.1 17.4 171.6 99.4
Poland 170.6 15.9 7.1 4.1 6.1 20.8 3.6 86.0
United Kingdom 97.3 9.1 0.0 0.0 0.0 0.0 0.0 0.0 -
Exports
extra-EU
EUR
million
EUR
million
% of
EU-28
% of
exports
extra-EU
trend
EU-28 153.2 62.4 100.0 40.7
Belgium 26.6 6.3 10.1 23.8
Germany 2.2 0.2 0.3 8.8
Greece 26.7 20.5 32.9 76.7
Spain 22.1 1.9 3.0 8.4
Italy 5.9 0.1 0.1 1.1 -
Lithuania 22.1 22.0 35.3 99.6
Poland 10.3 8.6 13.8 83.7
United Kingdom 0.0 0.0 0.0 0.0 -
Trend = % change between 2011 and 2013: Decrease by more than -30%; Decrease between -5% and -30%;
Change between -5% and +5%; Increase between 5% and 30%; Increase by more than 30%.
Exports to Russia
STRAWBERRIES
Average 2011-2013 - QUANTITIES
Production Exports extra-EU Exports to Russia
STRAWBERRIES
Average 2011-2013 - VALUE
Notes: countries in the table are the ones representing 5% or more of the EU production (main producers, in quantities)
and/or 5% or more of the EU exports to Russia (main exporters to Russia, in quantities and/or in value).
Sources:
- Production: Eurostat, Agriculture (table apro_cpp_crop, code C2260 - Strawberries), completed with FAO and own
estimations. Provisional data for 2013.
- Exports: Eurostat, Comext (code 08101000 - Fresh strawberries) for quantities and values.
Analysis of the EU fruit and vegetables sector
26 September 2014 18
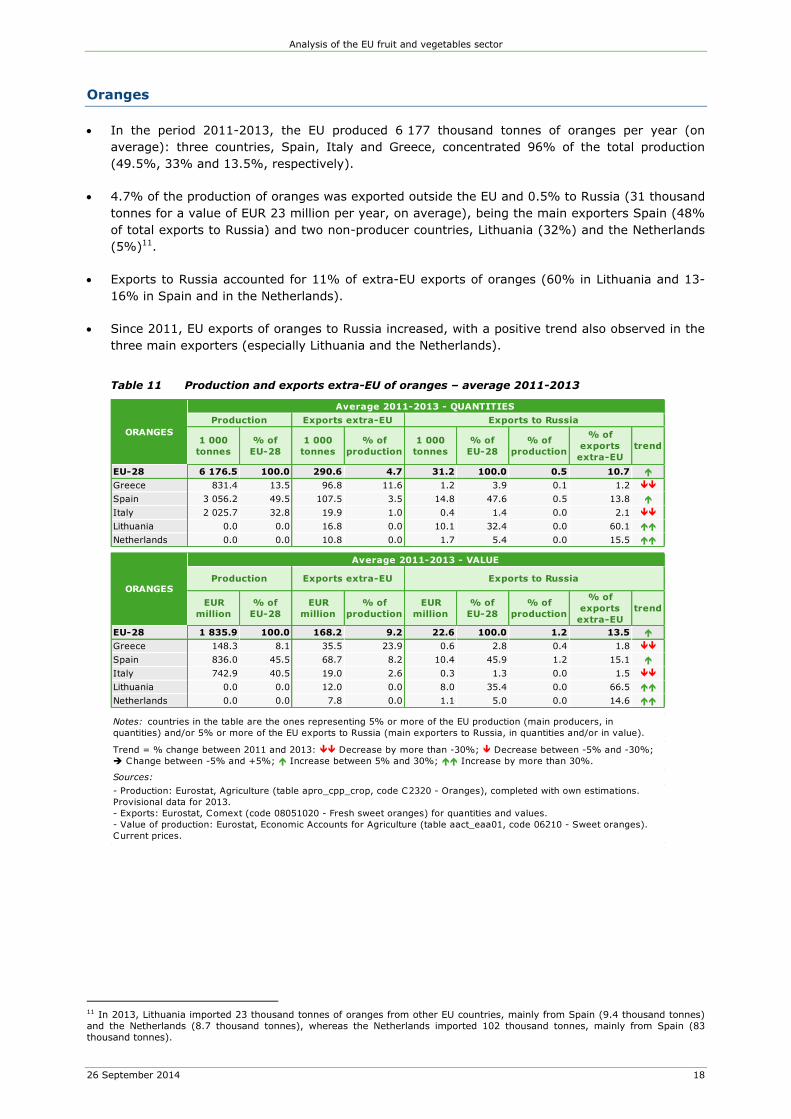
Oranges
In the period 2011-2013, the EU produced 6 177 thousand tonnes of oranges per year (on
average): three countries, Spain, Italy and Greece, concentrated 96% of the total production
(49.5%, 33% and 13.5%, respectively).
4.7% of the production of oranges was exported outside the EU and 0.5% to Russia (31 thousand
tonnes for a value of EUR 23 million per year, on average), being the main exporters Spain (48%
of total exports to Russia) and two non-producer countries, Lithuania (32%) and the Netherlands
(5%)11.
Exports to Russia accounted for 11% of extra-EU exports of oranges (60% in Lithuania and 13-
16% in Spain and in the Netherlands).
Since 2011, EU exports of oranges to Russia increased, with a positive trend also observed in the
three main exporters (especially Lithuania and the Netherlands).
Table 11 Production and exports extra-EU of oranges – average 2011-2013
11 In 2013, Lithuania imported 23 thousand tonnes of oranges from other EU countries, mainly from Spain (9.4 thousand tonnes) and the Netherlands (8.7 thousand tonnes), whereas the Netherlands imported 102 thousand tonnes, mainly from Spain (83 thousand tonnes).
1 000
tonnes
% of
EU-28
1 000
tonnes
% of
production
1 000
tonnes
% of
EU-28
% of
production
% of
exports
extra-EU
trend
EU-28 6 176.5 100.0 290.6 4.7 31.2 100.0 0.5 10.7
Greece 831.4 13.5 96.8 11.6 1.2 3.9 0.1 1.2
Spain 3 056.2 49.5 107.5 3.5 14.8 47.6 0.5 13.8
Italy 2 025.7 32.8 19.9 1.0 0.4 1.4 0.0 2.1
Lithuania 0.0 0.0 16.8 0.0 10.1 32.4 0.0 60.1
Netherlands 0.0 0.0 10.8 0.0 1.7 5.4 0.0 15.5
EUR
million
% of
EU-28
EUR
million
% of
production
EUR
million
% of
EU-28
% of
production
% of
exports
extra-EU
trend
EU-28 1 835.9 100.0 168.2 9.2 22.6 100.0 1.2 13.5
Greece 148.3 8.1 35.5 23.9 0.6 2.8 0.4 1.8
Spain 836.0 45.5 68.7 8.2 10.4 45.9 1.2 15.1
Italy 742.9 40.5 19.0 2.6 0.3 1.3 0.0 1.5
Lithuania 0.0 0.0 12.0 0.0 8.0 35.4 0.0 66.5
Netherlands 0.0 0.0 7.8 0.0 1.1 5.0 0.0 14.6
Trend = % change between 2011 and 2013: Decrease by more than -30%; Decrease between -5% and -30%;
Change between -5% and +5%; Increase between 5% and 30%; Increase by more than 30%.
ORANGES
Average 2011-2013 - QUANTITIES
Production Exports extra-EU Exports to Russia
ORANGES
Average 2011-2013 - VALUE
Production Exports extra-EU Exports to Russia
Notes: countries in the table are the ones representing 5% or more of the EU production (main producers, in
quantities) and/or 5% or more of the EU exports to Russia (main exporters to Russia, in quantities and/or in value).
Sources:
- Production: Eurostat, Agriculture (table apro_cpp_crop, code C2320 - Oranges), completed with own estimations.
Provisional data for 2013.
- Exports: Eurostat, Comext (code 08051020 - Fresh sweet oranges) for quantities and values.
- Value of production: Eurostat, Economic Accounts for Agriculture (table aact_eaa01, code 06210 - Sweet oranges).
Current prices.
Analysis of the EU fruit and vegetables sector
26 September 2014 19
Lemons
In the period 2011-2013, the EU produced 1 223 thousand tonnes of lemons per year (on
average): two countries, Spain and Italy, concentrated 93% of the total production (58% and
34.5%, respectively).
6.3% of the production of lemons was exported outside the EU and 2.1% to Russia (26 thousand
tonnes for a value of EUR 22 million per year, on average), being exports dominated by Spain
(72% of total exports to Russia) and Lithuania (non-producer country12, contributes with 22% of
the exports to Russia).
Exports to Russia accounted for 33% of extra-EU exports of lemons (74% in Lithuania, 44% in
Spain).
Since 2011, EU exports of lemons to Russia remained stable.
Table 12 Production and exports extra-EU of lemons – average 2011-2013
12 In 2013, Lithuania imported 7 thousand tonnes of lemons from other EU countries, mainly from Spain (2.9 thousand tonnes) and the Netherlands (1.5 thousand tonnes).
1 000
tonnes
% of
EU-28
1 000
tonnes
% of
production
1 000
tonnes
% of
EU-28
% of
production
% of
exports
extra-EU
trend
EU-28 1 223.0 100.0 77.4 6.3 25.6 100.0 2.1 33.0
Spain 712.2 58.2 41.8 5.9 18.4 72.0 2.6 44.0
Italy 421.9 34.5 1.8 0.4 0.0 0.1 0.0 1.5 -
Lithuania 0.0 0.0 7.4 0.0 5.5 21.6 0.0 74.3
EUR
million
% of
EU-28
EUR
million
% of
production
EUR
million
% of
EU-28
% of
production
% of
exports
extra-EU
trend
EU-28 531.5 100.0 66.8 12.6 22.3 100.0 4.2 33.4
Spain 207.4 39.0 30.5 14.7 13.0 58.1 6.3 42.5
Italy 274.8 51.7 2.1 0.7 0.0 0.1 0.0 1.1 -
Lithuania 0.0 0.0 9.1 0.0 7.5 33.7 0.0 83.1
Production
Trend = % change between 2011 and 2013: Decrease by more than -30%; Decrease between -5% and -30%;
Change between -5% and +5%; Increase between 5% and 30%; Increase by more than 30%.
Exports extra-EU Exports to RussiaLEMONS
Average 2011-2013 - VALUE
LEMONS
Average 2011-2013 - QUANTITIES
Production Exports extra-EU Exports to Russia
Notes: countries in the table are the ones representing 5% or more of the EU production (main producers, in
quantities) and/or 5% or more of the EU exports to Russia (main exporters to Russia, in quantities and/or in value).
Sources:
- Production: Eurostat, Agriculture (table apro_cpp_crop, code C2370 - Lemons and acid limes), completed with own
estimations. Provisional data for 2013.
- Exports: Eurostat, Comext (code 080550 - Fresh or dried lemons) for quantities and values.
- Value of production: Eurostat, Economic Accounts for Agriculture (table aact_eaa01, code 06230 - Lemons). Current
prices.
Analysis of the EU fruit and vegetables sector
26 September 2014 20
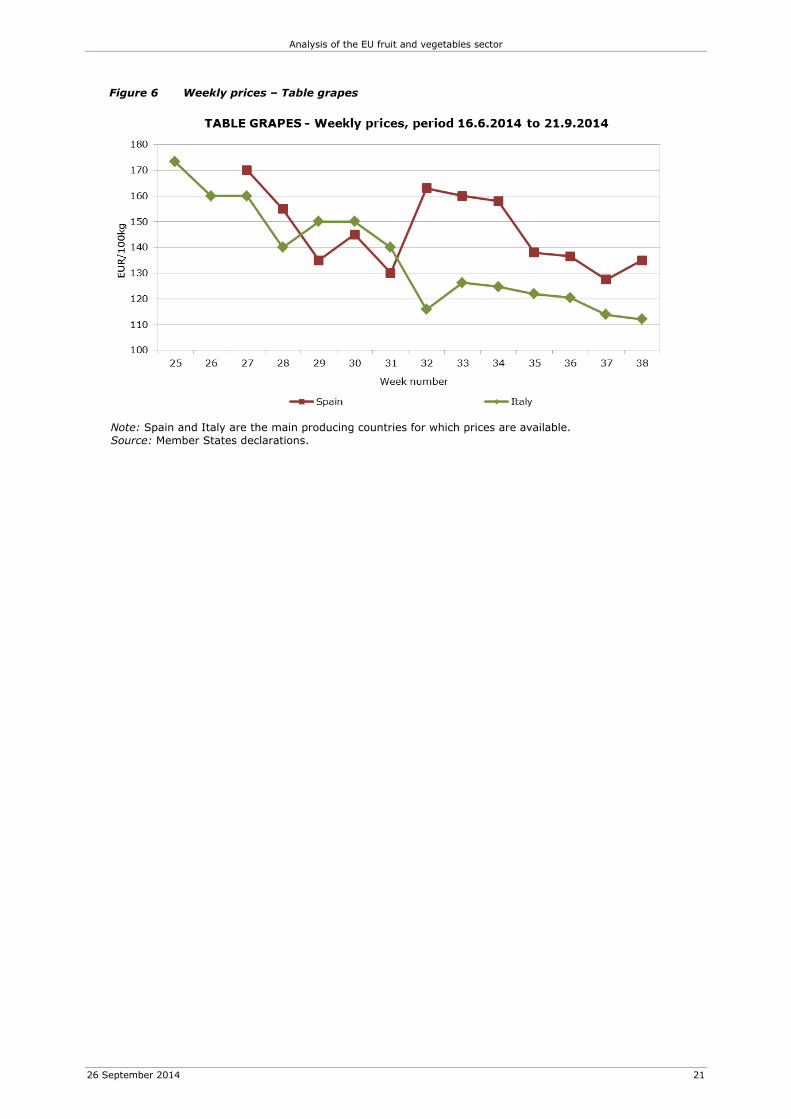
Table grapes
In the period 2011-2013, the EU produced 1 753 thousand tonnes of table grapes per year (on
average): three countries, Italy, Spain and Greece, concentrated 92% of the total production
(64%, 14% and 13%, respectively).
7.7% of the production of table grapes was exported outside the EU and 2.4% to Russia (43
thousand tonnes for a value of EUR 62 million per year, on average), being the main exporters
Lithuania (non-producer country, concentrates almost 50% of the exports to Russia13) and Italy
(34% of the exports).
Exports to Russia accounted for 32% of extra-EU exports of table grapes (80.5% in Lithuania,
26.5% in Italy).
Since 2011, EU exports of table grapes to Russia increased, mainly due to increases in from the
two main exporters.
Table 13 Production and exports extra-EU of table grapes – average 2011-2013
13 In 2013, Lithuania imported 39 thousand tonnes of table grapes from other EU countries, mainly from Italy (23 thousand tonnes).
1 000
tonnes
% of
EU-28
1 000
tonnes
% of
production
1 000
tonnes
% of
EU-28
% of
production
% of
exports
extra-EU
trend
EU-28 1 753.2 100.0 134.5 7.7 42.9 100.0 2.4 31.9
Greece 233.4 13.3 5.4 2.3 0.5 1.1 0.2 8.6
Spain 245.9 14.0 15.7 6.4 3.4 8.0 1.4 22.0
France 47.5 2.7 4.4 9.3 0.3 0.6 0.5 5.7
Italy 1 125.8 64.2 55.6 4.9 14.7 34.3 1.3 26.5
Lithuania 0.0 0.0 26.0 0.0 21.0 48.9 0.0 80.5
Netherlands 0.0 0.0 9.6 0.0 1.7 3.9 0.0 17.4
Romania 52.2 3.0 0.2 0.3 0.0 0.1 0.1 27.5 -
EUR
million
% of
EU-28
EUR
million
% of
production
EUR
million
% of
EU-28
% of
production
% of
exports
extra-EU
trend
EU-28 989.3 100.0 191.6 19.4 62.0 100.0 6.3 32.4
Greece 84.8 8.6 5.5 6.5 0.4 0.6 0.5 7.2
Spain 154.0 15.6 25.2 16.4 4.7 7.6 3.1 18.8
France 87.6 8.8 9.1 10.4 0.4 0.6 0.4 3.9
Italy 564.9 57.1 74.2 13.1 17.4 28.1 3.1 23.5
Lithuania 0.0 0.0 39.2 0.0 33.5 54.0 0.0 85.6
Netherlands 0.0 0.0 19.9 0.0 3.3 5.4 0.0 16.7
Romania 50.6 5.1 0.2 0.3 0.1 0.1 0.1 34.5 -
TABLE
GRAPES
Exports to Russia
Average 2011-2013 - VALUE
Production
Trend = % change between 2011 and 2013: Decrease by more than -30%; Decrease between -5% and -30%;
Change between -5% and +5%; Increase between 5% and 30%; Increase by more than 30%.
Exports extra-EU Exports to Russia
Average 2011-2013 - QUANTITIES
Production Exports extra-EUTABLE
GRAPES
Notes: countries in the table are the ones representing 5% or more of the EU production (main producers, in
quantities) and/or 5% or more of the EU exports to Russia (main exporters to Russia, in quantities and/or in value).
Sources:
- Production: Eurostat, Agriculture (table apro_cpp_crop, code C2420 - Vineyards for table grapes), completed with
national statistics and own estimations. Provisional data for 2013.
- Exports: Eurostat, Comext (code 08061010 - Fresh table grapes) for quantities and values.
- Value of production: Eurostat, Economic Accounts for Agriculture (table aact_eaa01, code 06410 - Dessert grapes).
Current prices.
Analysis of the EU fruit and vegetables sector
26 September 2014 21
Figure 6 Weekly prices – Table grapes
Note: Spain and Italy are the main producing countries for which prices are available.
Source: Member States declarations.
Analysis of the EU fruit and vegetables sector
26 September 2014 22
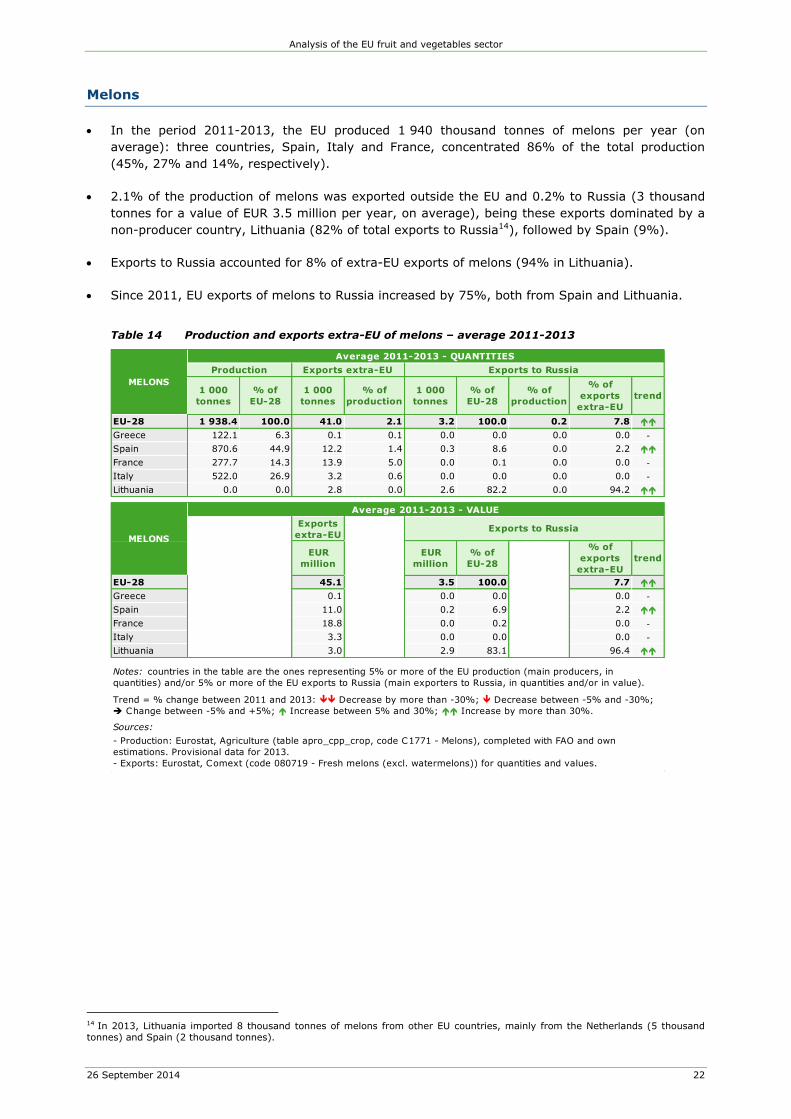
Melons
In the period 2011-2013, the EU produced 1 940 thousand tonnes of melons per year (on
average): three countries, Spain, Italy and France, concentrated 86% of the total production
(45%, 27% and 14%, respectively).
2.1% of the production of melons was exported outside the EU and 0.2% to Russia (3 thousand
tonnes for a value of EUR 3.5 million per year, on average), being these exports dominated by a
non-producer country, Lithuania (82% of total exports to Russia14), followed by Spain (9%).
Exports to Russia accounted for 8% of extra-EU exports of melons (94% in Lithuania).
Since 2011, EU exports of melons to Russia increased by 75%, both from Spain and Lithuania.
Table 14 Production and exports extra-EU of melons – average 2011-2013
14 In 2013, Lithuania imported 8 thousand tonnes of melons from other EU countries, mainly from the Netherlands (5 thousand tonnes) and Spain (2 thousand tonnes).
1 000
tonnes
% of
EU-28
1 000
tonnes
% of
production
1 000
tonnes
% of
EU-28
% of
production
% of
exports
extra-EU
trend
EU-28 1 938.4 100.0 41.0 2.1 3.2 100.0 0.2 7.8
Greece 122.1 6.3 0.1 0.1 0.0 0.0 0.0 0.0 -
Spain 870.6 44.9 12.2 1.4 0.3 8.6 0.0 2.2
France 277.7 14.3 13.9 5.0 0.0 0.1 0.0 0.0 -
Italy 522.0 26.9 3.2 0.6 0.0 0.0 0.0 0.0 -
Lithuania 0.0 0.0 2.8 0.0 2.6 82.2 0.0 94.2
Exports
extra-EU
EUR
million
EUR
million
% of
EU-28
% of
exports
extra-EU
trend
EU-28 45.1 3.5 100.0 7.7
Greece 0.1 0.0 0.0 0.0 -
Spain 11.0 0.2 6.9 2.2
France 18.8 0.0 0.2 0.0 -
Italy 3.3 0.0 0.0 0.0 -
Lithuania 3.0 2.9 83.1 96.4
Trend = % change between 2011 and 2013: Decrease by more than -30%; Decrease between -5% and -30%;
Change between -5% and +5%; Increase between 5% and 30%; Increase by more than 30%.
Exports to Russia
MELONS
Average 2011-2013 - QUANTITIES
Production Exports extra-EU Exports to Russia
MELONS
Average 2011-2013 - VALUE
Sources:
- Production: Eurostat, Agriculture (table apro_cpp_crop, code C1771 - Melons), completed with FAO and own
estimations. Provisional data for 2013.
- Exports: Eurostat, Comext (code 080719 - Fresh melons (excl. watermelons)) for quantities and values.
Notes: countries in the table are the ones representing 5% or more of the EU production (main producers, in
quantities) and/or 5% or more of the EU exports to Russia (main exporters to Russia, in quantities and/or in value).
Analysis of the EU fruit and vegetables sector
26 September 2014 23
Watermelons
In the period 2011-2013, the EU produced 2 682 thousand tonnes of watermelons per year (on
average): four countries, Spain, Greece, Romania and Italy, concentrated 88% of the total
production (31%, 22%, 21% and 14.5%, respectively).
1.8% of the production of watermelons was exported outside the EU and 0.1% to Russia (3
thousand tonnes for a value of EUR 2 million per year, on average), being these exports
dominated by a non-producer country, Lithuania (68% of total exports to Russia15), followed by
Spain (14.5%).
Exports to Russia accounted for 5.5% of extra-EU exports of watermelons (96% in Lithuania).
Since 2011, EU exports of watermelons to Russia increased by 45%, mainly due to an increase of
exports from Lithuania.
Table 15 Production and exports extra-EU of watermelons – average 2011-2013
15 In 2013, Lithuania imported 18 thousand tonnes of watermelons from other EU countries, mainly from Hungary (9 thousand tonnes), the Netherlands (3 thousand tonnes) and Greece (2 thousand tonnes).
1 000
tonnes
% of
EU-28
1 000
tonnes
% of
production
1 000
tonnes
% of
EU-28
% of
production
% of
exports
extra-EU
trend
EU-28 2 681.7 100.0 47.8 1.8 2.6 100.0 0.1 5.5
Greece 593.9 22.1 10.3 1.7 0.0 0.5 0.0 0.1 -
Spain 835.7 31.2 14.8 1.8 0.4 14.5 0.0 2.6
Italy 390.2 14.5 9.8 2.5 0.0 0.3 0.0 0.1 -
Lithuania 0.0 0.0 1.8 0.0 1.8 67.7 0.0 96.3
Hungary 179.6 6.7 0.1 0.1 0.1 4.5 0.1 86.3
Poland 0.0 0.0 0.3 0.0 0.2 7.5 0.0 75.7
Romania 551.4 20.6 0.0 0.0 0.0 0.0 0.0 0.0 -
Exports
extra-EU
EUR
million
EUR
million
% of
EU-28
% of
exports
extra-EU
trend
EU-28 25.0 2.0 100.0 8.1
Greece 2.7 0.0 0.4 0.3 -
Spain 8.2 0.3 13.3 3.3
Italy 5.3 0.0 0.2 0.1 -
Lithuania 1.4 1.4 67.4 97.8
Hungary 0.1 0.1 4.7 95.1
Poland 0.2 0.2 8.5 81.4
Romania 0.0 0.0 0.0 0.0 -
Trend = % change between 2011 and 2013: Decrease by more than -30%; Decrease between -5% and -30%;
Change between -5% and +5%; Increase between 5% and 30%; Increase by more than 30%.
Exports to Russia
WATERMELONS
Average 2011-2013 - QUANTITIES
Production Exports extra-EU Exports to Russia
WATERMELONS
Average 2011-2013 - VALUE
Notes: countries in the table are the ones representing 5% or more of the EU production (main producers, in quantities)
and/or 5% or more of the EU exports to Russia (main exporters to Russia, in quantities and/or in value).
Sources:
- Production: Eurostat, Agriculture (table apro_cpp_crop, code C1777 - Watermelons), completed with FAO and own
estimations. Provisional data for 2013.
- Exports: Eurostat, Comext (code 080711 - Fresh watermelons) for quantities and values.
Analysis of the EU fruit and vegetables sector
26 September 2014 24
Kiwis
In the period 2011-2013, the EU produced 688 thousand tonnes of kisis per year (on average):
three countries, Italy, Greece and France, concentrated 94% of the total production (62%, 22.5%
and 10%, respectively).
32.3% of the production of kiwis was exported outside the EU and 8.6% to Russia (59 thousand
tonnes for a value of EUR 51 million per year, on average), being these exports dominated by
Greece (49% of total exports to Russia), followed by Italy (26%) and a non-producer country,
Lithuania (19%16).
Exports to Russia accounted for 27% of extra-EU exports of kiwis (67% in Lithuania and 50% in
Greece).
Since 2011, EU exports of kiwis to Russia remained stable, being the decrease in exports from
Italy and Lithuania compensated by an important increase in exports from Greece.
Table 16 Production and exports extra-EU of kiwis – average 2011-2013
Table 17 Weekly prices - Kiwis
Notes: Italy – the biggest producer, no price communication. France – one of the biggest producers, no price
communication. According to Reg. 543/2011, there is an obligation to communicate prices on kiwis for Italy,
France, Greece and Portugal.
Source: Member States declarations.
16 In 2013, Lithuania imported 18.5 thousand tonnes of kiwis from other EU countries, mainly from Italy (12 thousand tonnes).
1 000
tonnes
% of
EU-28
1 000
tonnes
% of
production
1 000
tonnes
% of
EU-28
% of
production
% of
exports
extra-EU
trend
EU-28 687.5 100.0 222.1 32.3 59.3 100.0 8.6 26.7
Greece 154.4 22.5 57.2 37.1 28.8 48.6 18.6 50.3
France 66.3 9.6 9.1 13.7 0.1 0.1 0.1 0.8
Italy 424.4 61.7 107.8 25.4 15.3 25.8 3.6 14.2
Lithuania 0.0 0.0 17.0 - 11.5 19.3 - 67.2
Exports
extra-EU
EUR
million
EUR
million
% of
EU-28
% of
exports
extra-EU
trend
EU-28 211.8 51.1 100.0 24.1
Greece 42.7 23.9 46.8 56.0
France 14.3 0.1 0.1 0.4
Italy 114.2 12.8 25.1 11.2
Lithuania 15.3 11.2 22.0 73.5
Notes: countries in the table are the ones representing 5% or more of the EU production (main producers, in quantities)
and/or 5% or more of the EU exports to Russia (main exporters to Russia, in quantities and/or in value).
Trend = % change between 2011 and 2013: Decrease by more than -30%; Decrease between -5% and -30%;
Change between -5% and +5%; Increase between 5% and 30%; Increase by more than 30%.
Sources:
- Production: Eurostat, Agriculture (table apro_cpp_crop, code C2285 - Kiwis), completed with FAO and own estimations.
Provisional data for 2013.
- Exports: Eurostat, Comext (code 081050 - Fresh kiwifruit) for quantities and values.
KIWIS
Average 2011-2013 - QUANTITIES
Production Exports extra-EU Exports to Russia
KIWIS
Average 2011-2013 - VALUE
Exports to Russia
25 26 27
Greece 117.0 117.0 117.0
Portugal 125.0 125.0 125.0
Weekly prices, period 16.6.2014 to
6.7.2014
WeeksKIWIS
Analysis of the EU fruit and vegetables sector
26 September 2014 25
Vegetables
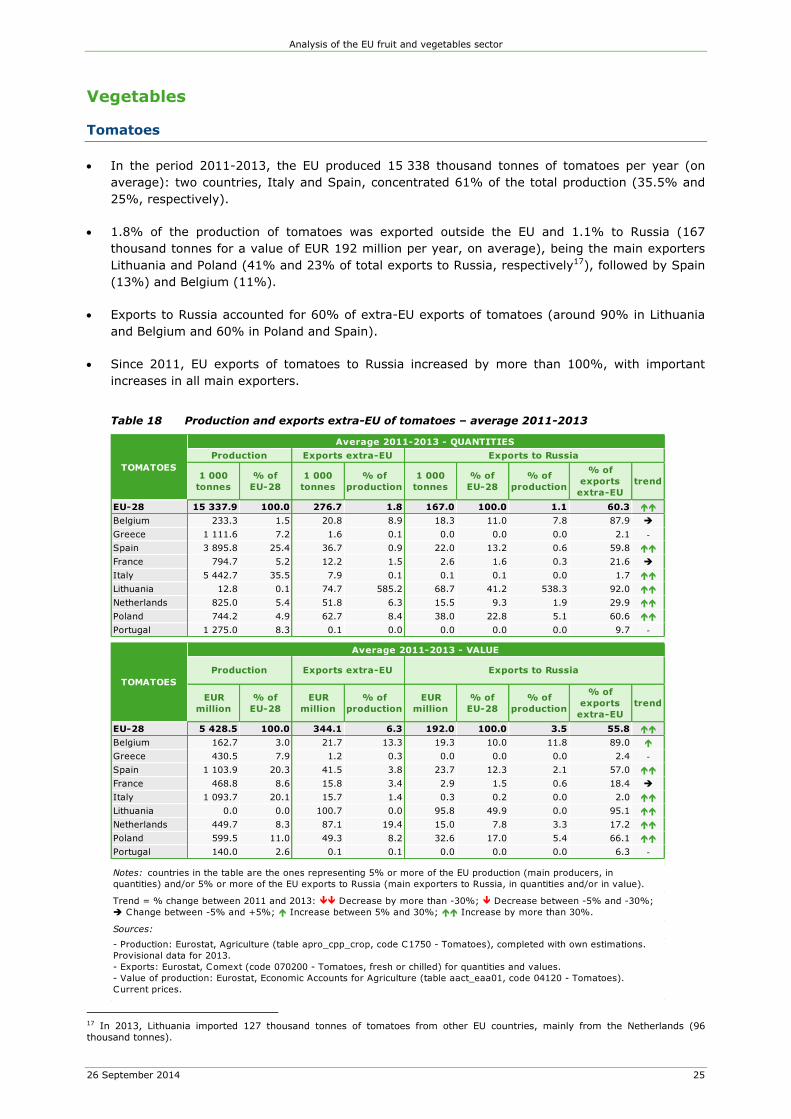
Tomatoes
In the period 2011-2013, the EU produced 15 338 thousand tonnes of tomatoes per year (on
average): two countries, Italy and Spain, concentrated 61% of the total production (35.5% and
25%, respectively).
1.8% of the production of tomatoes was exported outside the EU and 1.1% to Russia (167
thousand tonnes for a value of EUR 192 million per year, on average), being the main exporters
Lithuania and Poland (41% and 23% of total exports to Russia, respectively17), followed by Spain
(13%) and Belgium (11%).
Exports to Russia accounted for 60% of extra-EU exports of tomatoes (around 90% in Lithuania
and Belgium and 60% in Poland and Spain).
Since 2011, EU exports of tomatoes to Russia increased by more than 100%, with important
increases in all main exporters.
Table 18 Production and exports extra-EU of tomatoes – average 2011-2013
17 In 2013, Lithuania imported 127 thousand tonnes of tomatoes from other EU countries, mainly from the Netherlands (96 thousand tonnes).
data and own estimations. Provisional data for 2013.
- Exports: Eurostat, Comext (code 07095100 - Fresh or chilled mushrooms) for quantities and values.
Trend = % change between 2011 and 2013: Decrease by more than -30%; Decrease between -5% and -30%;
Change between -5% and +5%; Increase between 5% and 30%; Increase by more than 30%.
MUSHROOMS
Average 2011-2013 - QUANTITIES
Production Exports extra-EU Exports to Russia
MUSHROOMS
Average 2011-2013 - VALUE
Notes: countries in the table are the ones representing 5% or more of the EU production (main producers, in
quantities) and/or 5% or more of the EU exports to Russia (main exporters to Russia, in quantities and/or in value).
Analysis of the EU fruit and vegetables sector
26 September 2014 29
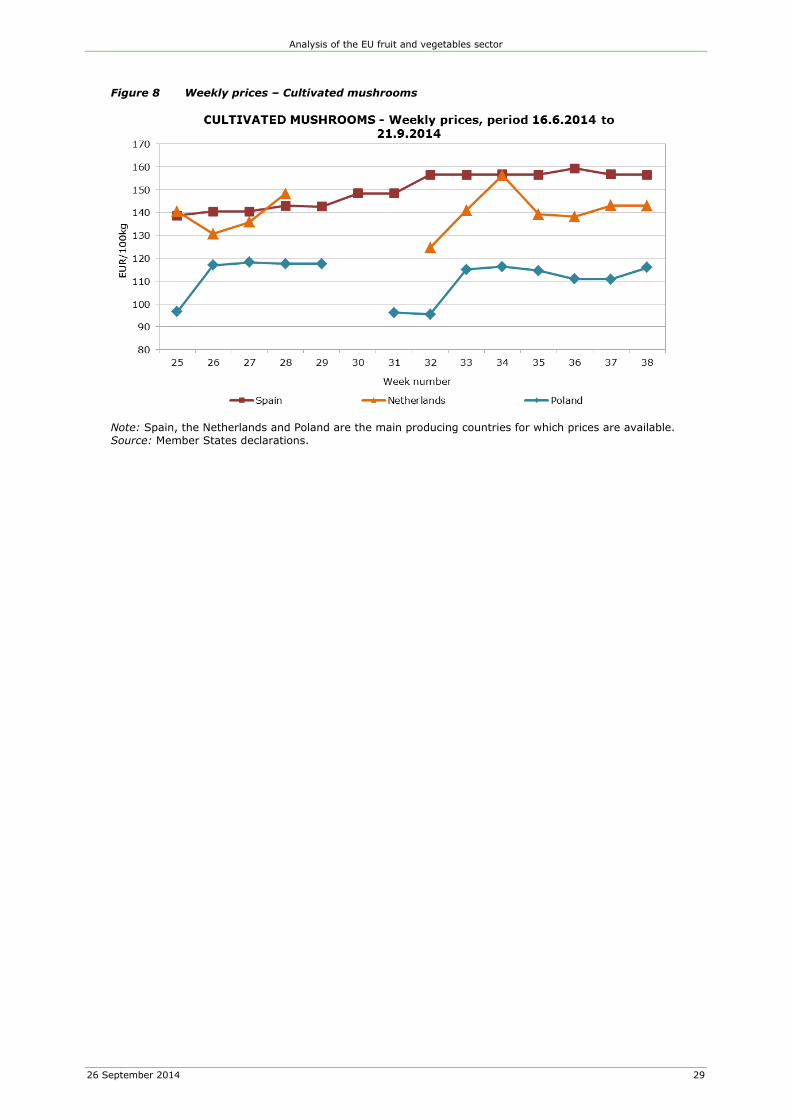
Figure 8 Weekly prices – Cultivated mushrooms
Note: Spain, the Netherlands and Poland are the main producing countries for which prices are available.
Source: Member States declarations.
Analysis of the EU fruit and vegetables sector
26 September 2014 30
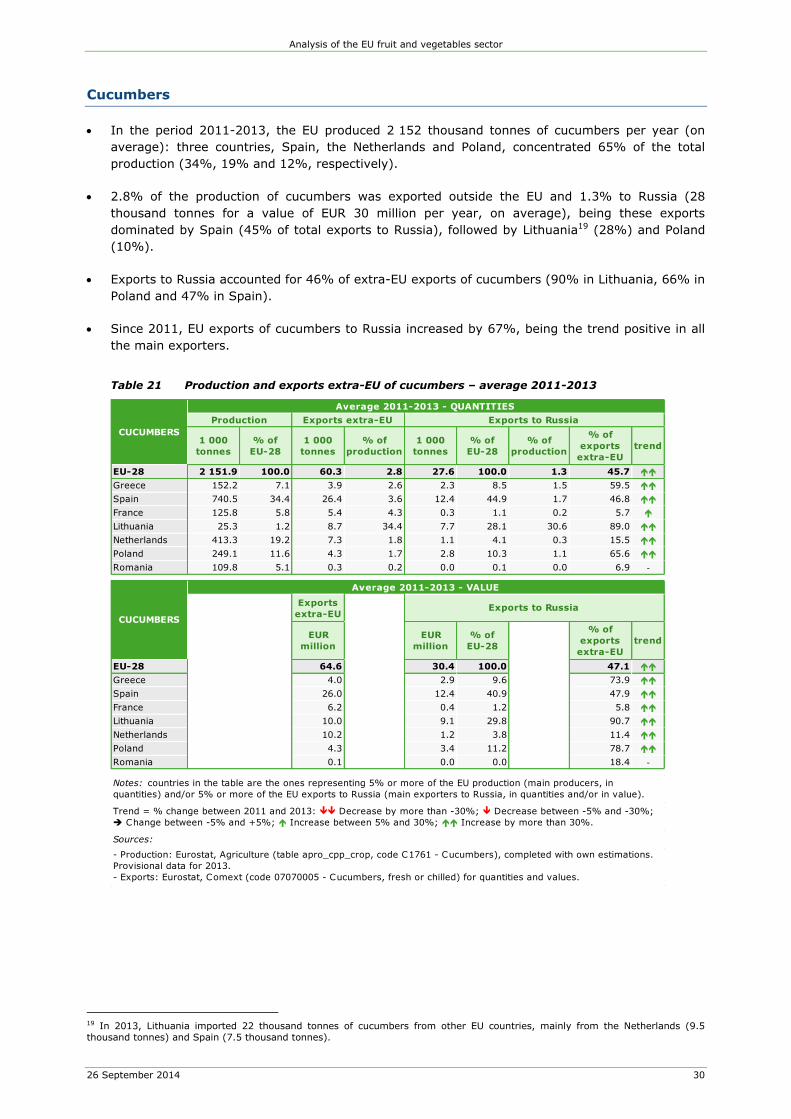
Cucumbers
In the period 2011-2013, the EU produced 2 152 thousand tonnes of cucumbers per year (on
average): three countries, Spain, the Netherlands and Poland, concentrated 65% of the total
production (34%, 19% and 12%, respectively).
2.8% of the production of cucumbers was exported outside the EU and 1.3% to Russia (28
thousand tonnes for a value of EUR 30 million per year, on average), being these exports
dominated by Spain (45% of total exports to Russia), followed by Lithuania19 (28%) and Poland
(10%).
Exports to Russia accounted for 46% of extra-EU exports of cucumbers (90% in Lithuania, 66% in
Poland and 47% in Spain).
Since 2011, EU exports of cucumbers to Russia increased by 67%, being the trend positive in all
the main exporters.
Table 21 Production and exports extra-EU of cucumbers – average 2011-2013
19 In 2013, Lithuania imported 22 thousand tonnes of cucumbers from other EU countries, mainly from the Netherlands (9.5 thousand tonnes) and Spain (7.5 thousand tonnes).
1 000
tonnes
% of
EU-28
1 000
tonnes
% of
production
1 000
tonnes
% of
EU-28
% of
production
% of
exports
extra-EU
trend
EU-28 2 151.9 100.0 60.3 2.8 27.6 100.0 1.3 45.7
Greece 152.2 7.1 3.9 2.6 2.3 8.5 1.5 59.5
Spain 740.5 34.4 26.4 3.6 12.4 44.9 1.7 46.8
France 125.8 5.8 5.4 4.3 0.3 1.1 0.2 5.7
Lithuania 25.3 1.2 8.7 34.4 7.7 28.1 30.6 89.0
Netherlands 413.3 19.2 7.3 1.8 1.1 4.1 0.3 15.5
Poland 249.1 11.6 4.3 1.7 2.8 10.3 1.1 65.6
Romania 109.8 5.1 0.3 0.2 0.0 0.1 0.0 6.9 -
Exports
extra-EU
EUR
million
EUR
million
% of
EU-28
% of
exports
extra-EU
trend
EU-28 64.6 30.4 100.0 47.1
Greece 4.0 2.9 9.6 73.9
Spain 26.0 12.4 40.9 47.9
France 6.2 0.4 1.2 5.8
Lithuania 10.0 9.1 29.8 90.7
Netherlands 10.2 1.2 3.8 11.4
Poland 4.3 3.4 11.2 78.7
Romania 0.1 0.0 0.0 18.4 -
Sources:
- Production: Eurostat, Agriculture (table apro_cpp_crop, code C1761 - Cucumbers), completed with own estimations.
Provisional data for 2013.
- Exports: Eurostat, Comext (code 07070005 - Cucumbers, fresh or chilled) for quantities and values.
Trend = % change between 2011 and 2013: Decrease by more than -30%; Decrease between -5% and -30%;
Change between -5% and +5%; Increase between 5% and 30%; Increase by more than 30%.
Average 2011-2013 - VALUE
CUCUMBERS
Average 2011-2013 - QUANTITIES
Production Exports extra-EU Exports to Russia
CUCUMBERS
Exports to Russia
Notes: countries in the table are the ones representing 5% or more of the EU production (main producers, in
quantities) and/or 5% or more of the EU exports to Russia (main exporters to Russia, in quantities and/or in value).
Analysis of the EU fruit and vegetables sector
26 September 2014 31
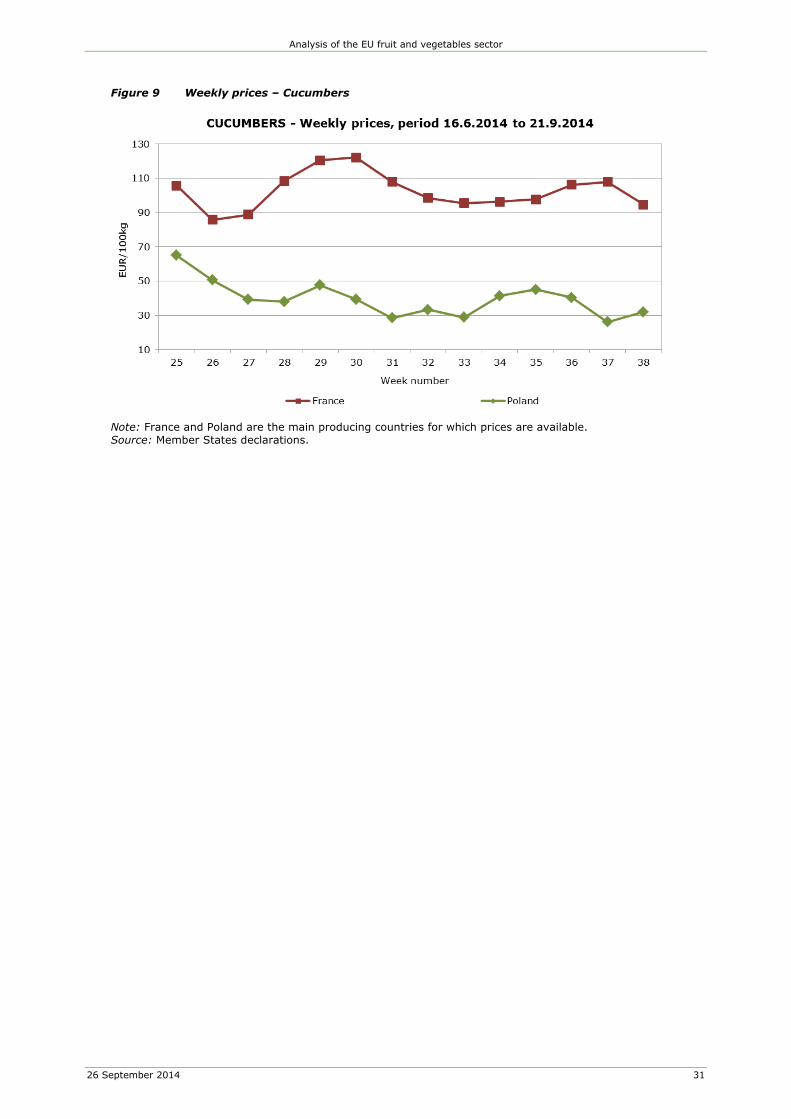
Figure 9 Weekly prices – Cucumbers
Note: France and Poland are the main producing countries for which prices are available.
Source: Member States declarations.
Analysis of the EU fruit and vegetables sector
26 September 2014 32
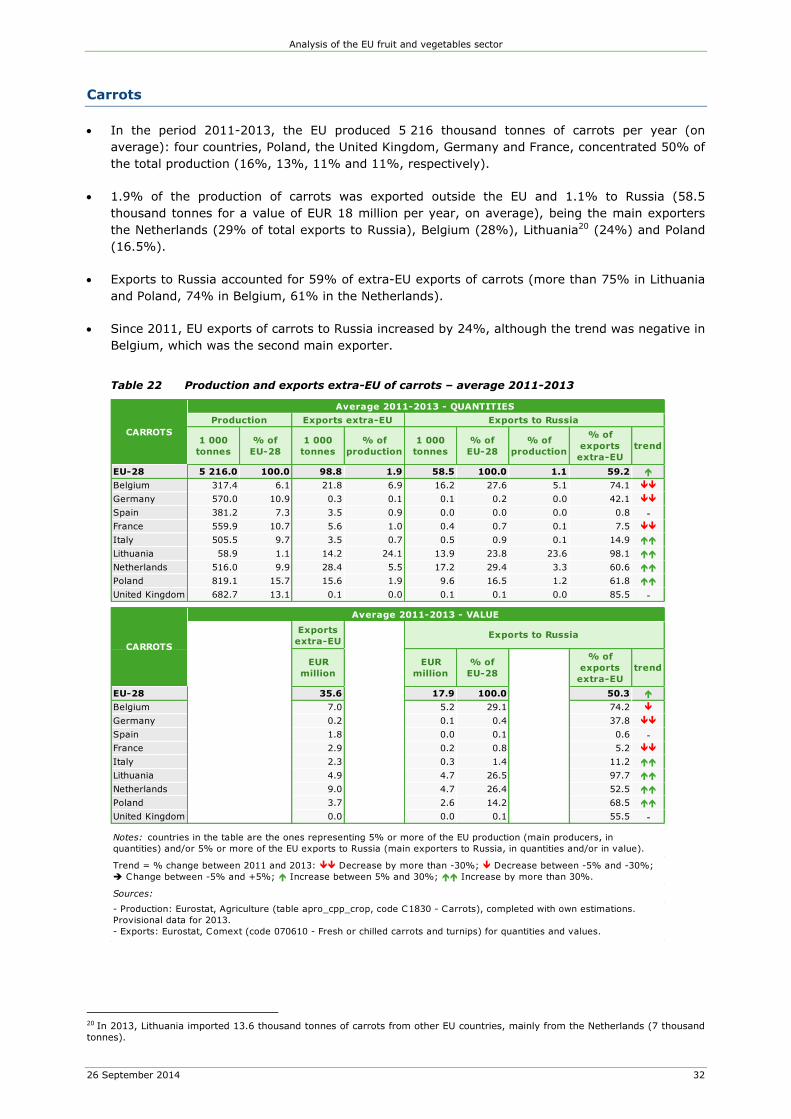
Carrots
In the period 2011-2013, the EU produced 5 216 thousand tonnes of carrots per year (on
average): four countries, Poland, the United Kingdom, Germany and France, concentrated 50% of
the total production (16%, 13%, 11% and 11%, respectively).
1.9% of the production of carrots was exported outside the EU and 1.1% to Russia (58.5
thousand tonnes for a value of EUR 18 million per year, on average), being the main exporters
the Netherlands (29% of total exports to Russia), Belgium (28%), Lithuania20 (24%) and Poland
(16.5%).
Exports to Russia accounted for 59% of extra-EU exports of carrots (more than 75% in Lithuania
and Poland, 74% in Belgium, 61% in the Netherlands).
Since 2011, EU exports of carrots to Russia increased by 24%, although the trend was negative in
Belgium, which was the second main exporter.
Table 22 Production and exports extra-EU of carrots – average 2011-2013
20 In 2013, Lithuania imported 13.6 thousand tonnes of carrots from other EU countries, mainly from the Netherlands (7 thousand tonnes).
Trend = % change between 2011 and 2013: Decrease by more than -30%; Decrease between -5% and -30%;
Change between -5% and +5%; Increase between 5% and 30%; Increase by more than 30%.
Exports to Russia
Notes: countries in the table are the ones representing 5% or more of the EU production (main producers, in
quantities) and/or 5% or more of the EU exports to Russia (main exporters to Russia, in quantities and/or in value).
Sources:
- Production: Eurostat, Agriculture (table apro_cpp_crop, code C1830 - Carrots), completed with own estimations.
Provisional data for 2013.
- Exports: Eurostat, Comext (code 070610 - Fresh or chilled carrots and turnips) for quantities and values.
CARROTS
Average 2011-2013 - QUANTITIES
Production Exports extra-EU Exports to Russia
CARROTS
Average 2011-2013 - VALUE
Analysis of the EU fruit and vegetables sector
26 September 2014 33
Figure 10 Weekly prices – Carrots
Note: France and Poland are the main producing countries for which prices are available.
Source: Member States declarations.
Analysis of the EU fruit and vegetables sector
26 September 2014 34
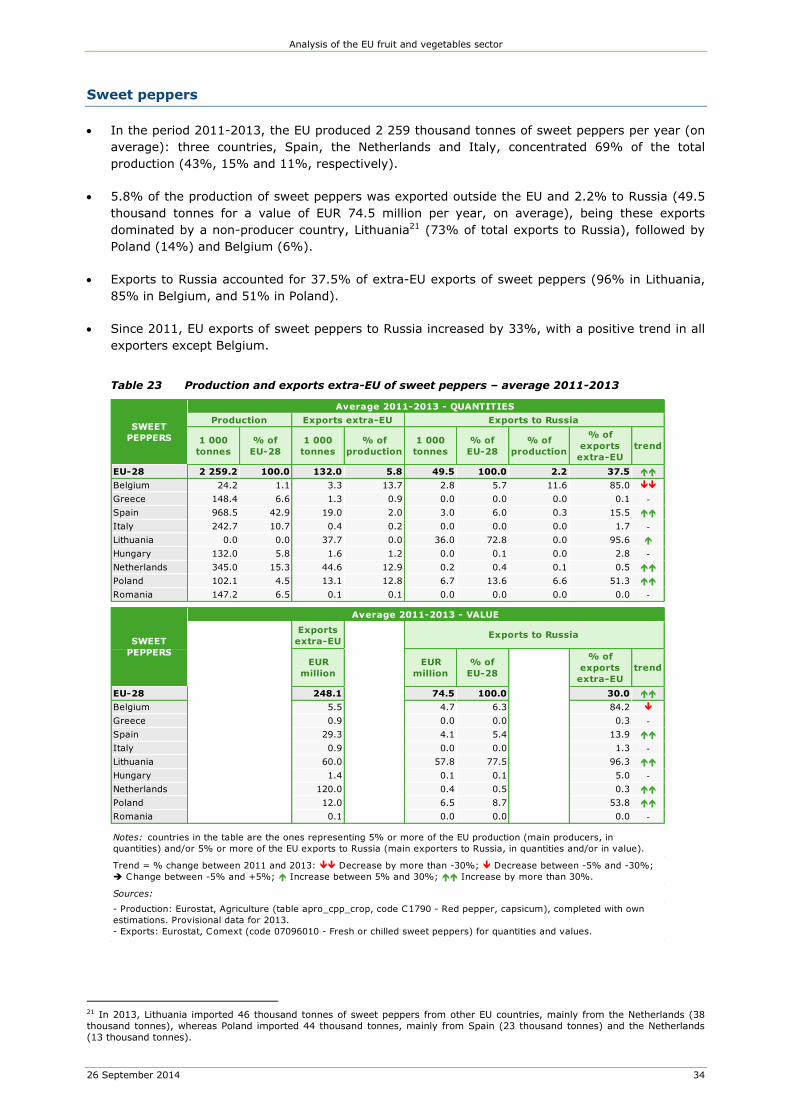
Sweet peppers
In the period 2011-2013, the EU produced 2 259 thousand tonnes of sweet peppers per year (on
average): three countries, Spain, the Netherlands and Italy, concentrated 69% of the total
production (43%, 15% and 11%, respectively).
5.8% of the production of sweet peppers was exported outside the EU and 2.2% to Russia (49.5
thousand tonnes for a value of EUR 74.5 million per year, on average), being these exports
dominated by a non-producer country, Lithuania21 (73% of total exports to Russia), followed by
Poland (14%) and Belgium (6%).
Exports to Russia accounted for 37.5% of extra-EU exports of sweet peppers (96% in Lithuania,
85% in Belgium, and 51% in Poland).
Since 2011, EU exports of sweet peppers to Russia increased by 33%, with a positive trend in all
exporters except Belgium.
Table 23 Production and exports extra-EU of sweet peppers – average 2011-2013
21 In 2013, Lithuania imported 46 thousand tonnes of sweet peppers from other EU countries, mainly from the Netherlands (38 thousand tonnes), whereas Poland imported 44 thousand tonnes, mainly from Spain (23 thousand tonnes) and the Netherlands (13 thousand tonnes).
1 000
tonnes
% of
EU-28
1 000
tonnes
% of
production
1 000
tonnes
% of
EU-28
% of
production
% of
exports
extra-EU
trend
EU-28 2 259.2 100.0 132.0 5.8 49.5 100.0 2.2 37.5
Belgium 24.2 1.1 3.3 13.7 2.8 5.7 11.6 85.0
Greece 148.4 6.6 1.3 0.9 0.0 0.0 0.0 0.1 -
Spain 968.5 42.9 19.0 2.0 3.0 6.0 0.3 15.5
Italy 242.7 10.7 0.4 0.2 0.0 0.0 0.0 1.7 -
Lithuania 0.0 0.0 37.7 0.0 36.0 72.8 0.0 95.6
Hungary 132.0 5.8 1.6 1.2 0.0 0.1 0.0 2.8 -
Netherlands 345.0 15.3 44.6 12.9 0.2 0.4 0.1 0.5
Poland 102.1 4.5 13.1 12.8 6.7 13.6 6.6 51.3
Romania 147.2 6.5 0.1 0.1 0.0 0.0 0.0 0.0 -
Exports
extra-EU
EUR
million
EUR
million
% of
EU-28
% of
exports
extra-EU
trend
EU-28 248.1 74.5 100.0 30.0
Belgium 5.5 4.7 6.3 84.2
Greece 0.9 0.0 0.0 0.3 -
Spain 29.3 4.1 5.4 13.9
Italy 0.9 0.0 0.0 1.3 -
Lithuania 60.0 57.8 77.5 96.3
Hungary 1.4 0.1 0.1 5.0 -
Netherlands 120.0 0.4 0.5 0.3
Poland 12.0 6.5 8.7 53.8
Romania 0.1 0.0 0.0 0.0 -
Trend = % change between 2011 and 2013: Decrease by more than -30%; Decrease between -5% and -30%;
Change between -5% and +5%; Increase between 5% and 30%; Increase by more than 30%.
Exports to Russia
Notes: countries in the table are the ones representing 5% or more of the EU production (main producers, in
quantities) and/or 5% or more of the EU exports to Russia (main exporters to Russia, in quantities and/or in value).
SWEET
PEPPERS
Average 2011-2013 - QUANTITIES
Production Exports extra-EU Exports to Russia
SWEET
PEPPERS
Average 2011-2013 - VALUE
Sources:
- Production: Eurostat, Agriculture (table apro_cpp_crop, code C1790 - Red pepper, capsicum), completed with own
estimations. Provisional data for 2013.
- Exports: Eurostat, Comext (code 07096010 - Fresh or chilled sweet peppers) for quantities and values.
Analysis of the EU fruit and vegetables sector
26 September 2014 35
Figure 11 Weekly prices – Peppers
Note: Spain, Italy and the Netherlands are the main producing countries for which prices are available.
Source: Member States declarations.
Analysis of the EU fruit and vegetables sector
26 September 2014 36
Cauliflowers and broccoli
In the period 2011-2013, the EU produced 2 212 thousand tonnes of cauliflowers and broccoli per
year (on average): four countries, Spain, Italy, France and Poland, concentrated 71% of the total
production (23.5%, 18%, 17% and 13%, respectively).
2.5% of the production of cauliflowers and broccoli was exported outside the EU and 1% to
Russia (23 thousand tonnes for a value of EUR 17 million per year, on average), being these
exports dominated by a country with very little production, Lithuania22 (54% of total exports to
Russia), followed by Poland (14%) and France (13%).
Exports to Russia accounted for 41% of extra-EU exports of cauliflowers and broccoli (almost
100% in Lithuania, 70% in Poland, and 53% in France).
Since 2011, EU exports of cauliflowers and broccoli to Russia increased by 40%, with positive
trends in all main exporters.
Table 24 Production and exports extra-EU of cauliflowers and broccoli – average 2011-2013
22 In 2013, Lithuania imported 17 thousand tonnes of cauliflowers and broccoli from other EU countries, mainly from the Netherlands (13 thousand tonnes).
1 000
tonnes
% of
EU-28
1 000
tonnes
% of
production
1 000
tonnes
% of
EU-28
% of
production
% of
exports
extra-EU
trend
EU-28 2 211.7 100.0 55.2 2.5 22.7 100.0 1.0 41.1
Belgium 97.9 4.4 1.7 1.7 1.5 6.7 1.5 88.6
Germany 158.3 7.2 0.4 0.3 0.0 0.0 0.0 1.9 -
Spain 520.1 23.5 16.8 3.2 0.5 2.0 0.1 2.7
France 369.9 16.7 5.7 1.5 3.0 13.2 0.8 52.9
Italy 395.8 17.9 7.8 2.0 0.7 3.0 0.2 8.6
Lithuania 2.0 0.1 12.4 617.5 12.3 54.0 612.8 99.2
Netherlands 53.7 2.4 3.7 7.0 1.3 5.8 2.5 35.4
Poland 291.9 13.2 4.6 1.6 3.2 14.0 1.1 69.2
EUR
million
% of
EU-28
EUR
million
% of
production
EUR
million
% of
EU-28
% of
production
% of
exports
extra-EU
trend
EU-28 881.8 100.0 56.5 6.4 17.3 100.0 2.0 30.5
Belgium 57.6 6.5 1.3 2.2 1.1 6.5 1.9 88.8
Germany 48.0 5.4 0.4 0.9 0.0 0.1 0.0 2.3 -
Spain 211.2 23.9 21.0 9.9 0.4 2.5 0.2 2.1
France 93.3 10.6 5.7 6.1 1.9 10.9 2.0 33.3
Italy 197.8 22.4 9.1 4.6 0.4 2.6 0.2 4.9
Lithuania 0.0 0.0 10.3 0.0 10.2 59.1 0.0 99.3
Netherlands 24.1 2.7 3.9 16.1 0.9 5.1 3.7 22.7
Poland 53.2 6.0 3.2 5.9 2.0 11.6 3.8 63.6
Production Exports extra-EU
Trend = % change between 2011 and 2013: Decrease by more than -30%; Decrease between -5% and -30%;
Change between -5% and +5%; Increase between 5% and 30%; Increase by more than 30%.
Exports to Russia
CAULIFLOWERS
AND BROCCOLI
Average 2011-2013 - QUANTITIES
Production Exports extra-EU Exports to Russia
CAULIFLOWERS
AND BROCCOLI
Average 2011-2013 - VALUE
Notes: countries in the table are the ones representing 5% or more of the EU production (main producers, in quantities)
and/or 5% or more of the EU exports to Russia (main exporters to Russia, in quantities and/or in value).
Sources:
- Production: Eurostat, Agriculture (table apro_cpp_crop, code C1620 - Cauliflower and broccoli), completed with own
estimations. Provisional data for 2013.
- Exports: Eurostat, Comext (code 070410 - Fresh or chilled cauliflowers and headed broccoli) for quantities and values.
- Value of production: Eurostat, Economic Accounts for Agriculture (table aact_eaa01, code 04110 - Cauliflowers).
Current prices.
Analysis of the EU fruit and vegetables sector
26 September 2014 37
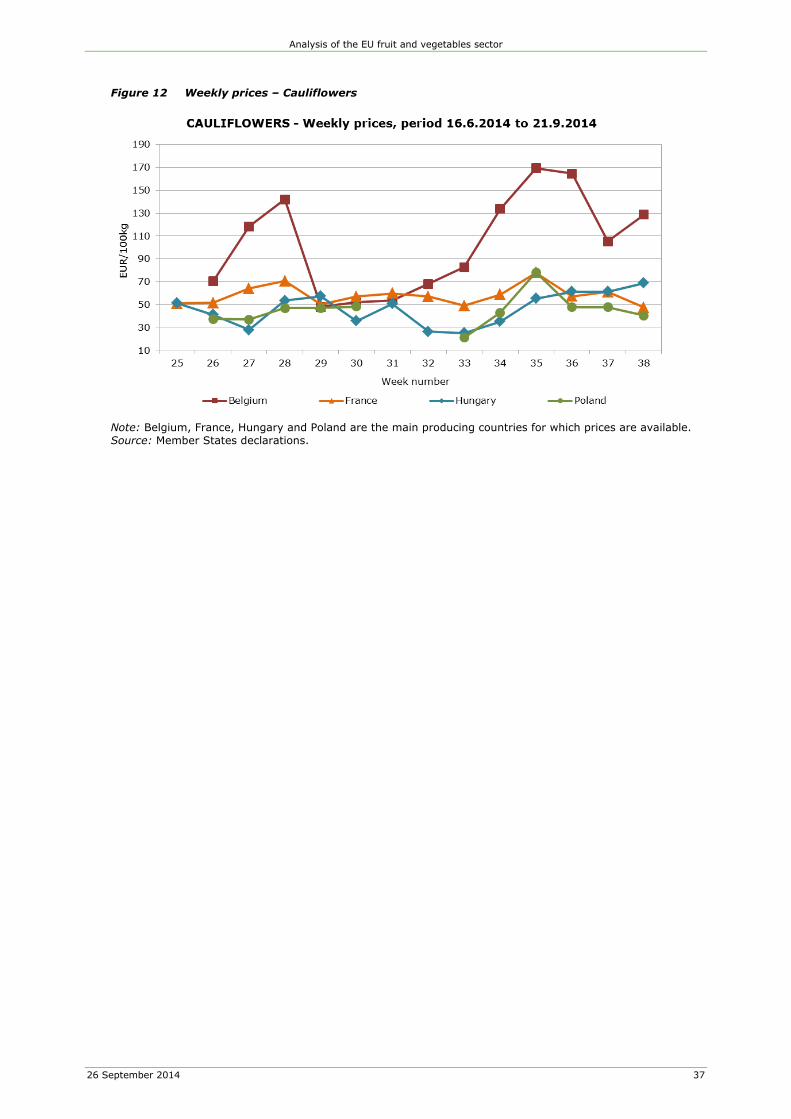
Figure 12 Weekly prices – Cauliflowers
Note: Belgium, France, Hungary and Poland are the main producing countries for which prices are available.
Source: Member States declarations.
Analysis of the EU fruit and vegetables sector
26 September 2014 38
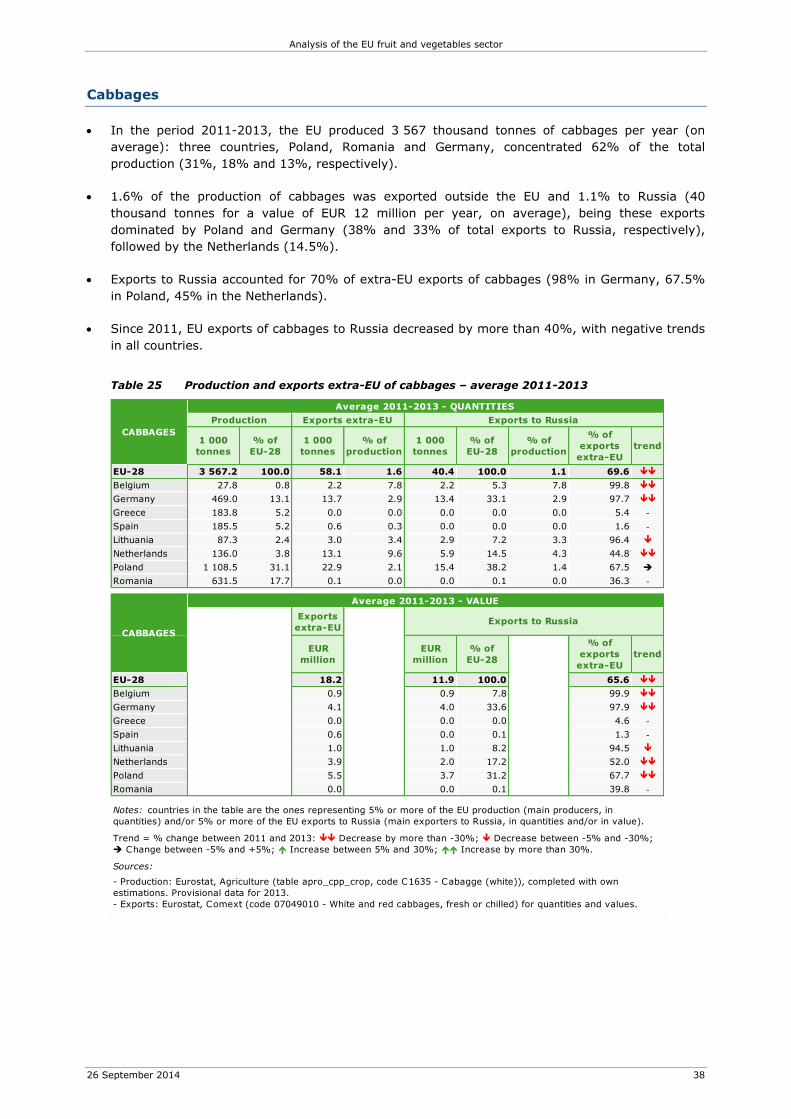
Cabbages
In the period 2011-2013, the EU produced 3 567 thousand tonnes of cabbages per year (on
average): three countries, Poland, Romania and Germany, concentrated 62% of the total
production (31%, 18% and 13%, respectively).
1.6% of the production of cabbages was exported outside the EU and 1.1% to Russia (40
thousand tonnes for a value of EUR 12 million per year, on average), being these exports
dominated by Poland and Germany (38% and 33% of total exports to Russia, respectively),
followed by the Netherlands (14.5%).
Exports to Russia accounted for 70% of extra-EU exports of cabbages (98% in Germany, 67.5%
in Poland, 45% in the Netherlands).
Since 2011, EU exports of cabbages to Russia decreased by more than 40%, with negative trends
in all countries.
Table 25 Production and exports extra-EU of cabbages – average 2011-2013
1 000
tonnes
% of
EU-28
1 000
tonnes
% of
production
1 000
tonnes
% of
EU-28
% of
production
% of
exports
extra-EU
trend
EU-28 3 567.2 100.0 58.1 1.6 40.4 100.0 1.1 69.6
Belgium 27.8 0.8 2.2 7.8 2.2 5.3 7.8 99.8
Germany 469.0 13.1 13.7 2.9 13.4 33.1 2.9 97.7
Greece 183.8 5.2 0.0 0.0 0.0 0.0 0.0 5.4 -
Spain 185.5 5.2 0.6 0.3 0.0 0.0 0.0 1.6 -
Lithuania 87.3 2.4 3.0 3.4 2.9 7.2 3.3 96.4
Netherlands 136.0 3.8 13.1 9.6 5.9 14.5 4.3 44.8
Poland 1 108.5 31.1 22.9 2.1 15.4 38.2 1.4 67.5
Romania 631.5 17.7 0.1 0.0 0.0 0.1 0.0 36.3 -
Exports
extra-EU
EUR
million
EUR
million
% of
EU-28
% of
exports
extra-EU
trend
EU-28 18.2 11.9 100.0 65.6
Belgium 0.9 0.9 7.8 99.9
Germany 4.1 4.0 33.6 97.9
Greece 0.0 0.0 0.0 4.6 -
Spain 0.6 0.0 0.1 1.3 -
Lithuania 1.0 1.0 8.2 94.5
Netherlands 3.9 2.0 17.2 52.0
Poland 5.5 3.7 31.2 67.7
Romania 0.0 0.0 0.1 39.8 -
Trend = % change between 2011 and 2013: Decrease by more than -30%; Decrease between -5% and -30%;
Change between -5% and +5%; Increase between 5% and 30%; Increase by more than 30%.
CABBAGES
Average 2011-2013 - QUANTITIES
Production Exports extra-EU Exports to Russia
CABBAGES
Average 2011-2013 - VALUE
Exports to Russia
- Production: Eurostat, Agriculture (table apro_cpp_crop, code C1635 - Cabagge (white)), completed with own
estimations. Provisional data for 2013.
- Exports: Eurostat, Comext (code 07049010 - White and red cabbages, fresh or chilled) for quantities and values.
Notes: countries in the table are the ones representing 5% or more of the EU production (main producers, in
quantities) and/or 5% or more of the EU exports to Russia (main exporters to Russia, in quantities and/or in value).
Sources:
Analysis of the EU fruit and vegetables sector
26 September 2014 39
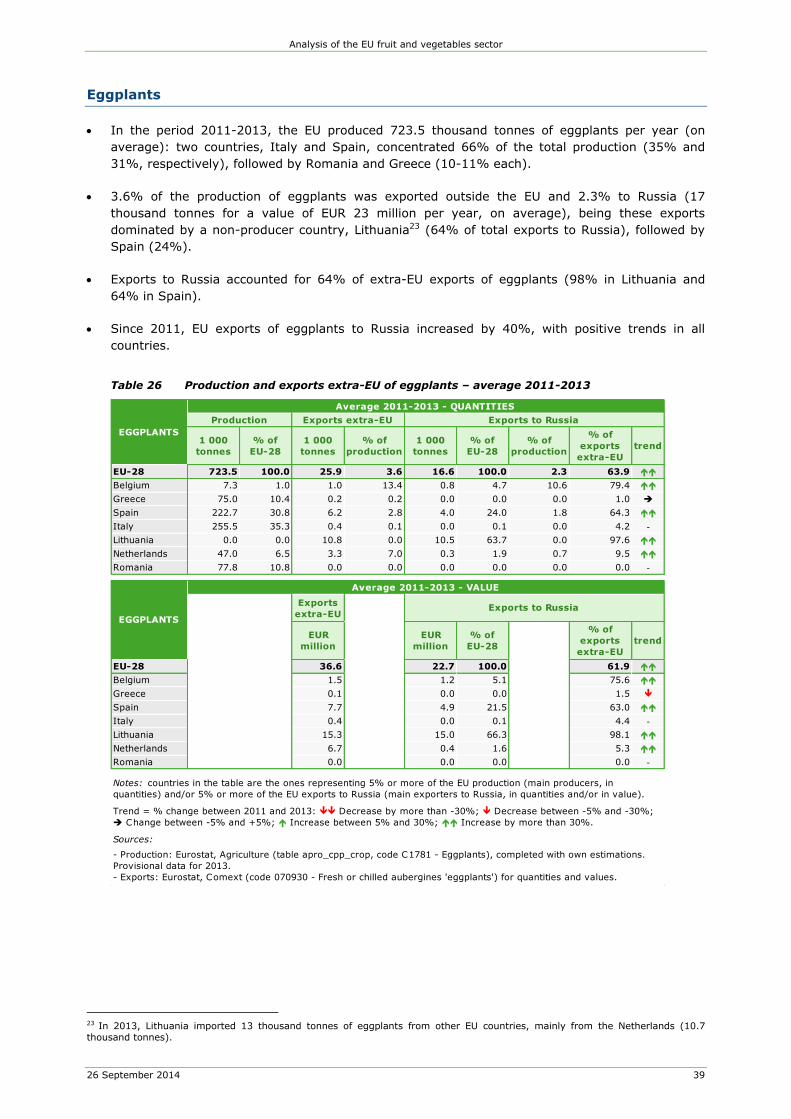
Eggplants
In the period 2011-2013, the EU produced 723.5 thousand tonnes of eggplants per year (on
average): two countries, Italy and Spain, concentrated 66% of the total production (35% and
31%, respectively), followed by Romania and Greece (10-11% each).
3.6% of the production of eggplants was exported outside the EU and 2.3% to Russia (17
thousand tonnes for a value of EUR 23 million per year, on average), being these exports
dominated by a non-producer country, Lithuania23 (64% of total exports to Russia), followed by
Spain (24%).
Exports to Russia accounted for 64% of extra-EU exports of eggplants (98% in Lithuania and
64% in Spain).
Since 2011, EU exports of eggplants to Russia increased by 40%, with positive trends in all
countries.
Table 26 Production and exports extra-EU of eggplants – average 2011-2013
23 In 2013, Lithuania imported 13 thousand tonnes of eggplants from other EU countries, mainly from the Netherlands (10.7 thousand tonnes).
1 000
tonnes
% of
EU-28
1 000
tonnes
% of
production
1 000
tonnes
% of
EU-28
% of
production
% of
exports
extra-EU
trend
EU-28 723.5 100.0 25.9 3.6 16.6 100.0 2.3 63.9
Belgium 7.3 1.0 1.0 13.4 0.8 4.7 10.6 79.4
Greece 75.0 10.4 0.2 0.2 0.0 0.0 0.0 1.0
Spain 222.7 30.8 6.2 2.8 4.0 24.0 1.8 64.3
Italy 255.5 35.3 0.4 0.1 0.0 0.1 0.0 4.2 -
Lithuania 0.0 0.0 10.8 0.0 10.5 63.7 0.0 97.6
Netherlands 47.0 6.5 3.3 7.0 0.3 1.9 0.7 9.5
Romania 77.8 10.8 0.0 0.0 0.0 0.0 0.0 0.0 -
Exports
extra-EU
EUR
million
EUR
million
% of
EU-28
% of
exports
extra-EU
trend
EU-28 36.6 22.7 100.0 61.9
Belgium 1.5 1.2 5.1 75.6
Greece 0.1 0.0 0.0 1.5
Spain 7.7 4.9 21.5 63.0
Italy 0.4 0.0 0.1 4.4 -
Lithuania 15.3 15.0 66.3 98.1
Netherlands 6.7 0.4 1.6 5.3
Romania 0.0 0.0 0.0 0.0 -
Trend = % change between 2011 and 2013: Decrease by more than -30%; Decrease between -5% and -30%;
Change between -5% and +5%; Increase between 5% and 30%; Increase by more than 30%.
Exports to Russia
EGGPLANTS
Average 2011-2013 - VALUE
EGGPLANTS
Average 2011-2013 - QUANTITIES
Production Exports extra-EU Exports to Russia
Sources:
Notes: countries in the table are the ones representing 5% or more of the EU production (main producers, in
quantities) and/or 5% or more of the EU exports to Russia (main exporters to Russia, in quantities and/or in value).
- Production: Eurostat, Agriculture (table apro_cpp_crop, code C1781 - Eggplants), completed with own estimations.
Provisional data for 2013.
- Exports: Eurostat, Comext (code 070930 - Fresh or chilled aubergines 'eggplants') for quantities and values.
Analysis of the EU fruit and vegetables sector
26 September 2014 40
Onions
In the period 2011-2013, the EU produced 5 949 thousand tonnes of onions per year (on
average): three countries, the Netherlands, Spain and Poland, concentrated 55% of the total
production (24%, 21% and 10%, respectively).
12.5% of the production of onions was exported outside the EU and 1.5% to Russia (91 thousand
tonnes for a value of EUR 38 million per year, on average), being these exports dominated by the
Netherlands (78% of total exports to Russia), followed by Lithuania (9%) and Poland (7%).
Exports to Russia accounted for 12% of extra-EU exports of onions (94% in Lithuania and 50% in
Poland but only 10% in the Netherlands).
Since 2011, EU exports of onions to Russia decreased by 30%, mainly due to a decrease of
exports in the main exporter, the Netherlands.
Table 27 Production and exports extra-EU of onions – average 2011-2013