Analysis of the Sunflower Value Chain in Zambia’s Eastern Province by Mary Lubungu, William J. Burke and Nicholas J. Sitko Working Paper 85 September 2014 Indaba Agricultural Policy Research Institute (IAPRI) Lusaka, Zambia Downloadable at: http://www.iapri.org.zm or http://www.aec.msu.edu/fs2/zambia/index.htm
Transcript
Analysis of the Sunflower Value Chain in Zambia’s Eastern Province
by Mary Lubungu, William J. Burke and Nicholas J. Sitko
Working Paper 85 September 2014
Indaba Agricultural Policy Research Institute (IAPRI) Lusaka, Zambia Downloadable at: http://www.iapri.org.zm or http://www.aec.msu.edu/fs2/zambia/index.htm
ii
Analysis of the Sunflower Value Chain in Zambia’s Eastern Province
by
Mary Lubungu, William Burke, and Nicholas Sitko
Working Paper No. 85
September 2014
Indaba Agricultural Policy Research Institute (IAPRI) 26a Middleway, Kabulonga,
Lusaka, Zambia Lubungu is a research associate with Indaba Agricultural Policy Research Institute, Lusaka Zambia, Burke is a research scholar at Stanford University’s Center on Food Security and the Environment and, Sitko is assistant professor, International Development, in the Department of Agricultural, Food, and Resource Economics at Michigan State University, currently on long-term assignment with the Indaba Agricultural Policy Research Institute in Lusaka, Zambia.
iii
ACKNOWLEDGMENTS
The Indaba Agricultural Policy Research Institute (IAPRI) is a non-profit company limited by guarantee and collaboratively works with public and private stakeholders. IAPRI exists to carry out agricultural policy research and outreach, serving the agricultural sector in Zambia so as to contribute to sustainable pro-poor agricultural development. We wish to acknowledge the financial and substantive support of the Swedish International Development Agency (Sida) and the United States Agency for International Development (USAID) in Lusaka. We further would like to acknowledge the technical and capacity building support from Michigan State University and its researchers. The authors would also like to thank Patricia Johannes for her helpful formatting and editing assistance. Any views expressed or remaining errors are solely the responsibility of the authors. Comments and questions should be directed to: The Executive Director Indaba Agricultural Policy Research Institute 26A Middleway, Kabulonga, Lusaka. Telephone: +260 211 261194; Telefax +260 211 261199; Email: [email protected]
iv
INDABA AGRICULTURAL POLICY RESEARCH INSTITUTE TEAM MEMBERS
The Zambia-based Indaba Agricultural Policy Research Institute (IAPRI) research team is comprised of Chance Kabaghe, Nicholas Sitko, Rhoda Mofya-Mukuka, Munguzwe Hichaambwa, Stephen Kabwe, Auckland Kuteya, Mary Lubungu, Brian Mulenga, Solomon Tembo, and Jordan Chamberlin. Michigan State University-based researchers associated with IAPRI are Thomas S. Jayne, Margaret Beaver, Eric Crawford, Steve Haggblade, Chewe Nkonde, Melinda Smale, Nicole Mason, and David Tschirley.
v
EXECUTIVE SUMMARY
The United States Agency for International Development (USAID) has a stated goal of lifting more than a quarter of millions of rural farmers out of poverty in Zambia’s Eastern Province through the implementation of the Feed the Future program (FtF). Part of the program’s goal will be achieved through investments in several key value chains in the agricultural sector. Investing in sunflower may be ideal for promoting rural welfare, however much poverty reducing potential may go unrealized in Zambia’s rural areas if the current status quo is unchanged. This includes rural access to input markets, processors and output markets. The main purpose of this study is to describe the sunflower oil chain from the input supply to retail level, and to identify the major challenges affecting smallholder sunflower production and marketing. The study also identifies the potential lever points for policy makers, including those implementing the FtF. The main findings presented in this paper stem primarily from qualitative research that included interviews with key actors at each stage of the value chain in Eastern Province of Zambia as well as in Lusaka. To inform our discussion, the study also used data from several different surveys. These included the Crop Forecast Surveys (CFS), Supplemental Surveys to Zambian Post Harvest Surveys (SS), and Rural Agricultural Livelihoods Survey (RALS), all of which have been carried out by or with the assistance of Zambia’s Central Statistical Office (CSO). Sunflower has the potential to improve the welfare of smallholder farmers. However, productivity still remains a challenge. This is mainly due to low utilization of yield improving inputs. Smallholder farmers predominately use recycled sunflower seed which is often retained from one’s own harvest. Low yields are also related to crop management practices that are more focused on maize, such as late sunflower planting, high weed competition, seed rates more dense than local recommendations and use of lower potential seed (often recycled or counterfeit). In addition to these challenges, sensitivity analysis results show that returns to labor, are fairly elastic with respect to oil prices and yield. A 10% increase in oil price results in greater than a 13% increase in returns (and vice versa). Along with observed intra-seasonal price variation, this sensitivity suggests that (for oil sellers) timing of sale can make a difference of up to 20% in the net returns to labor per hectare. The highlighted production challenges suggest that yield improving technologies such as use of first generation seeds, fertilizers, fungicides or other inputs could have a potentially very large impact on the livelihood of sunflower growers (and particularly sellers). In addition, production methods such as earlier plantings, and weeding should be part of the intervention strategies (or should at least address the reasons that sunflower seems to take a back-seat to maize production despite the evidence of sunflower’s profitability. Reasons may include a lack of business training or the extension focus on maize production). Since sunflower oil offers more benefits compared to selling sunflower seed, there is need to promote commercialization through education and business training. Lastly, one final way of helping smallholder farmers to benefit from sunflower production would be to encourage enforcement of the current seed laws against those who knowingly contaminate or counterfeit seed sales. This could be done through promoting awareness of smallholder rights under the Laws of Zambia Seed Act, or, perhaps, supporting local governments in enforcing these laws.
vi
TABLE OF CONTENTS
ACKNOWLEDGMENTS ....................................................................................................... iiiINDABA AGRICULTURAL POLICY RESEARCH INSTITUTE TEAM MEMBERS ..... ivEXECUTIVE SUMMARY ....................................................................................................... vList of Figures ......................................................................................................................... viiList of Tables .......................................................................................................................... viiAcronyms ............................................................................................................................... viii1. INTRODUCTION ................................................................................................................. 12. DATA AND METHODS ...................................................................................................... 23. INPUT SUPPLY .................................................................................................................... 4
3.1. Seed Sources and Transaction Types .............................................................................. 43.2. Demand for Sunflower Seed and Prices ......................................................................... 53.3. Constraints on Performance of the Input Sector ............................................................. 7
4. PRODUCTION OF SUNFLOWER ...................................................................................... 84.1. Production Levels and Trends ........................................................................................ 84.2. Sunflower Production at District Level .......................................................................... 94.3. Importance of Sunflower in Relation with Other Food Crops ...................................... 104.4. Sunflower Production Management ............................................................................. 10
4.4.1. Hectares Allocated to Sunflower Production and Crop Losses ............................. 104.4.2. Planting Timing ..................................................................................................... 114.4.3. Seed Rates .............................................................................................................. 124.4.4. Use of other Inputs ................................................................................................. 124.4.5. Weed Control ......................................................................................................... 12
4.5. Production Constraints .................................................................................................. 135. SUNFLOWER MARKETING AND PROCESSING ......................................................... 14
5.2.1. Small-scale Oil Extraction Process ........................................................................ 14 5.2.2. Milling Process .......................................................................................................15
5.2.3. Oil Extraction Charges ............................................................................................ 155.2.4. Structure of Small-scale Milling Market ............................................................... 165.2.5. Return to Labour .................................................................................................... 185.2.6. Large Scale Processing .......................................................................................... 20
5.3. Constraints to Processing .............................................................................................. 216. CONCLUSION AND RECOMMENDATIONS ................................................................ 22APPENDIX Three-year Profitability of Outgrower Scheme Described in Box 1 ................................... 24 REFERENCES ........................................................................................................................ 25
vii
LIST OF FIGURES
FIGURE PAGE 1. Map Showing Eastern Province and the Districts..................................................................2 2. Sources of Sunflower Seed, 2011 .......................................................................................... 4 3. Sunflower Varieties Planted by Smallholders in Zambia’s Eastern Province ....................... 54. Sources of Local Sunflower Seed .......................................................................................... 65. Transaction Type for Local Sunflower Seed Sourced from Fellow Farmers ........................ 66. Average Sunflower Yield over Time, Eastern Province ........................................................ 87. Average Hectares under Sunflower Production per Household by Districts ....................... 108. Reasons for not Harvesting the Whole Area Planted ........................................................... 119. Planting Dates for Sunflower in Eastern Province .............................................................. 1110. Number of Weeks the Household Finished the First Weeding after Planting ................... 1311. Number of Complete Weeding in Sunflower Fields .......................................................... 1312. Sensitivity Analysis for Table 5 ......................................................................................... 19
LIST OF TABLES
TABLE PAGE 1. Smallholder Sunflower Production over Time by Province .................................................. 82. Number of Households in Eastern Province Producing Sunflower by District ..................... 93. Total Sunflower Production Trends by District, Eastern Province ........................................ 94. Cost and Revenue Model for a Rural Sunflower Miller ...................................................... 175. Returns to Labor Model for One Hectare of Rural Sunflower Production .......................... 18
LIST OF BOXES Box 1. A Story of Would-be Sunflower Out-Growers and the Discount Rate of Small
CFS Crop Forecast Surveys CSO Central Statistical Office FSRP Food Security Research Project FtF Feed the Future Ha Hectare IAPRI Indaba Agricultural Policy Research Institute Kg Kilogram Kg/ha Kilogram per hectare Km Kilometer L Litres MAL Ministry of Agriculture and Livestock ml Mililitre OPV Open Pollinated Varieties RALS Rural Agricultural Livelihoods Survey SS Post-Harvest Supplemental Surveys USAID United States Agency for International Development ZARI Zambia Agriculture and Research Institute ZMW Zambian Kwacha (rebased currency) ZMK Zambian Kwacha (old currency)
1
1. INTRODUCTION
The United States Agency for International Development (USAID) is implementing the Feed the Future program (FtF) in Zambia’s Eastern Province. The program has the stated goal of lifting more than a quarter of a million rural farmers out of poverty by 2015 (USAID, 2011). A major part of this effort is dedicated to upgrading several key value chains in the agricultural sector. The sunflower value chain has been identified as one such key based on the income generating potential for poorer farmers, especially women. The purpose of this study is to describe the sunflower oil chain from the input supply to retail level, and to identify the major challenges affecting smallholder sunflower production and marketing. In addition, the study identifies the potential intervention levers for policy makers, including those implementing FtF. Sunflower has long been recognized for its potential benefits for smallholders. It can be fairly easily grown with relatively little use of inorganic fertilizers and it can be locally processed to near commercial quality oil and cake either on the farm or at nearby processors. Moreover, sunflower is best grown on the same types of soils as maize, Zambia’s staple crop. The sunflower value chain in the rural areas of Zambia’s Eastern Province is largely self-contained with the spheres of input production and supply, oilseed1 production, processing and oil and cake consumption frequently overlapping and, especially in the case of oil, seldom interacting with urban markets outside the Province. As will be described in this report, seeds are often recycled and shared or sold within farming communities, oilseed is produced with local labor and few other inputs, most oil is processed at small, rural mills and either consumed on the farm or sold within the community. Rural access to input markets, processors and output markets suggests sunflower may be an ideal crop for promoting rural welfare, however much poverty reducing potential may go unrealized in Zambia’s rural areas if the current status quo is unchanged. As this report will discuss, this is largely due to relatively low yields, an uncompetitive milling sector and the transfer costs that isolate rural areas from larger markets.
The insights in this study stem primarily from qualitative research that included interviews with key stakeholders at each stage of the value chain in Eastern Province of Zambia. The study also used data from different surveys to inform our discussion. The different survey data include the Crop Forecast Surveys (CFS), Post-Harvest Supplemental Surveys (SS), and Rural Agricultural Livelihoods Survey (RALS), all of which have been carried out by or with the assistance of Zambia’s Central Statistical Office (CSO).
This report is organized such that each stage of the value chain (input supply, production, marketing and processing) is discussed in its own section, followed by a summary section and brief conclusion that highlights potential intervention levers.
1 For the purposes of this report, seed refers to sunflower seed that is intended for planting and oilseed refers to sunflower seed that is intended for processing into oil and cake. Sunflower seeds are very seldom grown for human consumption as a grain.
2
2. DATA AND METHODS
The primary data used in this study were collected from qualitative research that was conducted in five districts of Eastern Province of Zambia, namely Petauke, Katete, Chipata, Chadiza, and Ludazi (Figure 1). The qualitative data were collected through guided interviews with relevant actors at each node of the value chain which include input supply, production, assembling, wholesaling, processing and retailing. The interviews for this study were conducted in March and April, 2012, during two week-long field visits. Each field trip involved two primary investigators and two research assistants.
At input supply stage, interviews were conducted with three regional directors for the three major corporate seed companies (Zamseed, Seedco, and Pannar) operating in the province and multiple smaller agro-dealers in the five districts. At production level, seven organized farmer focus group discussions were conducted with between 30 and 70 farmers in each (e.g.,
picture on the left). In addition to focus group discussion, key informant interviews with several individual farmers in Katete and Petauke districts respectively were conducted. Two key informant interviews with sunflower traders and five small-scale milling operations were done at the assembly and processing stages. In addition, interviews were conducted with five large processing companies in Lusaka (Novatek animal feeds, Tiger feeds, High Protein Foods, Mount Meru, and Unified Chemicals). Lastly, the personnel in Ministry of
Agriculture and Livestock District Agricultural Coordinator Offices in the five districts provided valuable information regarding the sunflower value chain.
Figure 1. Map Showing Eastern Province and the Districts
Source: Lubungu, Burke, and Sitko (2013).
3
To augment our qualitative analysis, we also used data from different national representative surveys. The survey data include various years of the Crop Forecast Surveys (CFS) carried out by the Central Statistical Office (CSO) and Ministry of Agriculture and Livestock (MAL). Other survey data used include, the Post-Harvest Supplemental Surveys (SS) of 2004 and 2008, and Rural Agricultural Livelihoods Survey (RALS) conducted in 2012 by the Food Security Research Project and Indaba Agricultural Policy Research Institute (FSRP and IAPRI respectively) in collaboration with CSO and MAL.
4
3. INPUT SUPPLY
Agricultural inputs if used appropriately have a great potential to leverage the efforts of hard-working farmers. This section discusses demand and various access points for sunflower seeds and other inputs. We also discuss transaction types and examine the constraints on the input sector performance. 3.1. Seed Sources and Transaction Types Farmers in Eastern Province acquire sunflower seed through various channels. These include from their own harvest, fellow farmers, agro-dealers and seed companies among many sources. However, as shown in Figure 2, the major source of sunflower seed is from their own harvest followed by fellow farmers. Over 60% of smallholder households growing sunflower in Eastern Province use seed from own harvest while about 10% acquire seed from commercial sources. Farmers can acquire commercial seed produced by seed companies through different channels, including seed companies themselves, agro-dealers/seed retailers or the rural agents of both. The major commercial seed suppliers are ZamSeed and Pannar (Seedco notably does not sell sunflower seeds) in Chipata. In addition to running agricultural supply shops, these corporations supply numerous agro-dealers throughout the districts. There is at least one such dealer in Lundazi, ten in Chipata, two in Katete, and five in Petauke districts. Seed retailers/agro-dealers can be classified based on whether or not they are officially registered with a commercial seed company. Understanding the differences between registered and unregistered seed retailers/agro-dealers is important for understanding the broader constraints to seed access among smallholders. For more details about the agro- Figure 2. Sources of Sunflower Seed, 2011
63%
26%
9%2% 1%10
2030405060708090
100
Ow
nha
rves
t
Fello
wfa
rmer
agro
-dea
ler
Seed
com
pany
Oth
erso
urce
s
Perc
enta
ge o
f ho
useh
olds
Source: RALS 2012. Note: other sources include out growers, conservation farming unit, cooperative/farmer group etc. The household might have multiple sources of seed but this figure reflects the source of seed for the largest transaction.
5
dealer typology, the reader is referred to the soya value chain study done by Lubungu, Burke, and Sitko (2013); most sunflower seed retailers/agro-dealers are the same as those selling soya seed, and each crop’s seed faces similar challenges.
In addition to agro-dealers in district towns, there are a number of small-scale agro-dealers and rural agents in more remote areas. Rural agents purchase large quantities of seed in the district capitals and re-sell the in rural areas. According to the commercial seed companies, however, the rural agents account for less than 1% of sales. Whatever the source, improved seed is mainly sold to farmers in spot market transactions (See Box 1 for the story of a rare exception). All transactions at corporate seed stores or depots and the majority of those with agro-dealers are on a cash basis. In the rare case that an agro-dealer will sell on credit, it is expected that payment will be made in a matter of days or weeks, not at the end of the growing season. 3.2. Demand for Sunflower Seed and Prices Sunflower can be grown from either hybrid or open pollinated variety (OPV) seeds. The former are more productive, but more expensive, whereas the latter are far more popular because of they can be recycled for multiple growing seasons. As shown in Figure 3, about 2/3 of the seed used in Eastern Province is recycled local seed, which farmer focus groups confirmed is usually later generations of Zamseed’s Milika OPV. According to farmers and Zamseed officials, Milika can be recycled for as many as five growing seasons before productivity diminishes to a point where farmers have the incentive to purchase new seed, but most recycle just one or two times.2 Figure 3. Sunflower Varieties Planted by Smallholders in Zambia’s Eastern Province
MILIKA 20%
Hybrid11%
Local 61%
Recycled hybrid 7%
other OPV 1%
Source: RALS 2012.
2 New seed is more productive because it is genetically much closer to the germplasm the varieties are based upon, while recycled seed will have unavoidably been contaminated by exposure to other elements of the ecosystem. Seed plants are grown under very specific conditions designed to minimize contamination.
6
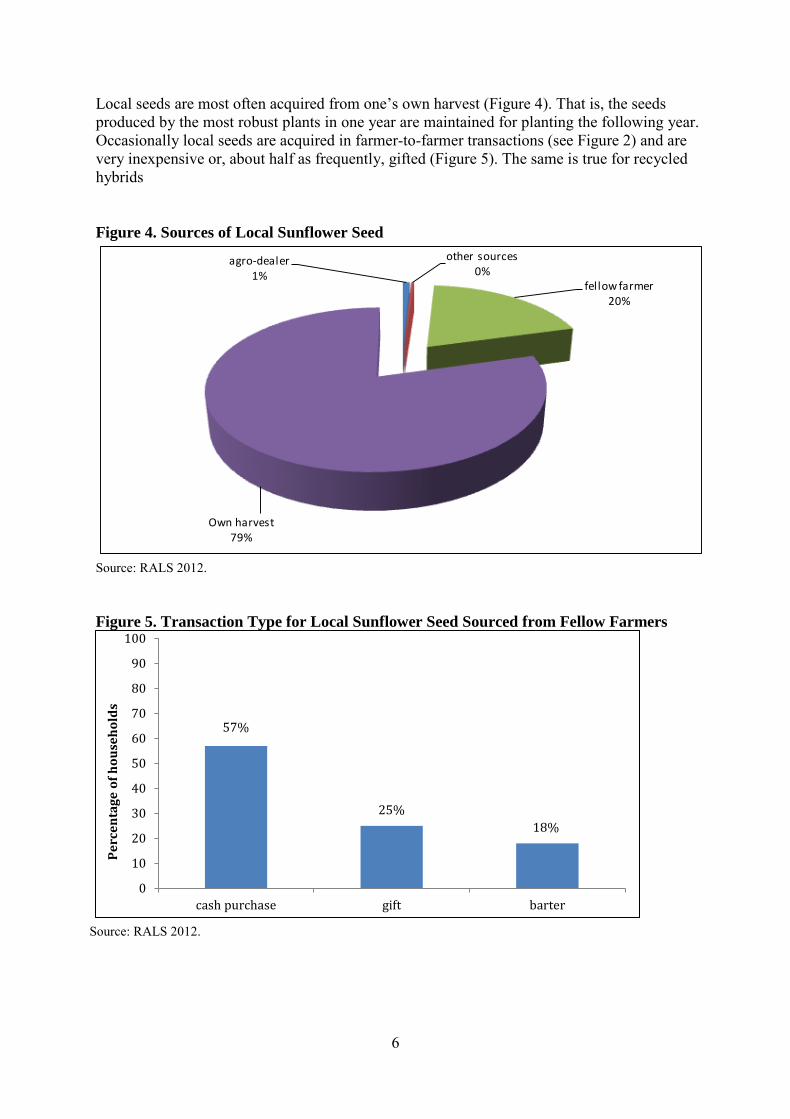
Local seeds are most often acquired from one’s own harvest (Figure 4). That is, the seeds produced by the most robust plants in one year are maintained for planting the following year. Occasionally local seeds are acquired in farmer-to-farmer transactions (see Figure 2) and are very inexpensive or, about half as frequently, gifted (Figure 5). The same is true for recycled hybrids Figure 4. Sources of Local Sunflower Seed
Source: RALS 2012. Figure 5. Transaction Type for Local Sunflower Seed Sourced from Fellow Farmers
Source: RALS 2012.
agro-dealer 1%
other sources0%
fellow farmer20%
Own harvest79%
57%
25% 18%
0
10
20
30
40
50
60
70
80
90
100
cash purchase gift barter
Perc
enta
ge o
f hou
seho
lds
7
Figure 3 shows that farmers in Eastern Province predominately use local sunflower varieties. However, of the hybrid varieties used, Milika from ZamSeed is the most common. Sunflower hybrid seed prices are fairly consistent geographically and made known by radio advertisements. Agro-dealers in multiple districts report a 5kg bag of Milika was sold in 2011 for 40-45 Zambian Kwacha Rebased (ZMW, roughly 8-9 US Dollars), but in the time of shortages prices ranged as high as 65 ZMW. The less popular Pannar hybrid cost 190 ZMW per 5kg bag. 3.3. Constraints on Performance of the Input Sector Despite the proliferation of agro-dealers in the districts, availability of higher productivity seed is a constraint to crop production in Eastern Province. This is less of an issue for sunflower as it is for other oilseed crops, especially soybeans, because of a strong preference for recycled seed. Most farmers however, say they would prefer using more improved seeds and most dealers clear all stocks well before the end of the seed marketing season. Commercial seed has been unavailable by late January for the past several years, forcing some farmers to use local seed. Supply of seed is low for several reasons very similar to those described in Lubungu, Burke, and Sitko (2013).
Seed contamination is also a major concern in the input sector for most crops in Eastern Province, including sunflower3. There are various stages at which this could occur. First, it can occur at seed multiplication stage. Though multiplication process for seed produced by corporations in Zambia is regulated and inspected by Seed Control and Certification Institute it is still possible for seed multipliers to co-mingle pure seed with non-seed in order to give the appearance of greater seed production. The seed retail level is another potential source of seed contamination. Farmers claim that agro-dealers, particularly the unregistered ones, can go well beyond contamination and counterfeit entire bags of seed. Despite farmers having the right to report seed contamination and counterfeiting, very few farmers are aware of this right or how to exercise it, and almost none actually do. Under the laws of Zambia Seed Laws Act the government has the authority to confiscate any commercially sold seed for testing.
3 Seed contamination is the mixing of seeds used for agriculture with oilseeds of the same crop. Barring a trained eye, the less expensive oilseeds, meant for consumption and less productive if planted, can be mistaken for seed
8
4. PRODUCTION OF SUNFLOWER
4.1. Production Levels and Trends Sunflower is grown in nearly all the parts of Zambia, though production levels vary. Like soybeans (see Lubungu, Burke, and Sitko 2013), the Eastern Province has lead the country in smallholder sunflower production in every recent harvest season (Table 1). In fact, from 2001 to 2010, over 40% of all sunflower produced by Zambian smallholders was grown in the Eastern Province. Other provinces with substantial production include Central, Northern and Southern Provinces. The total sunflower production in Eastern Province ranges from about 4,500 tonnes to about 25,000 tonnes depending on the year, while average yields have usually remained less than 0.6 tonnes per hectare planted (Figure 6). The average yields are much lower than the yields achieved by commercial farmers or hybrid seed users. Average commercial yields for OPVs vary between 1.5 to 1.8 tonnes/ha while hybrid seeds can even go up to 2 tonnes/ha (ZARI 2002).
Sunflower is a popular crop in Eastern Province because it is considered to grow well despite limited attention and input use (e.g. there is very little weeding or fertilization of sunflower fields). Also, sunflower can be planted in rotation with maize, the primary staple crop grown by 97% of smallholder households in Eastern Province (RALS 2012), and produce economically viable yields (albeit comparably low ones in terms of value).
Districts with the largest number of producers in Eastern Province are Chipata, Lundazi, Petauke and Katete, with each holding more than 10,000 sunflower farming households annually, on average, since 2001 (with some fluctuation, see Table 2). Sunflower is also an important crop in Chadiza district. Though grown by fewer farmers in Chadiza, there is a much lower population in the district. For example, 45% of households in the district grew sunflower for the 2012 harvest (RALS 2012). Production of sunflower is also concentrated in Lundazi, Chipata, Petauke Katete and Chadiza (Table 3). Over the period 2001 to 2011, production fluctuated in all the districts with highest production levels recorded in 2008. Table 2. Number of Households in Eastern Province Producing Sunflower by District
District Year 2001 2002 2003 2004 2005 2006 2007 2008 2009 2010 2011
4.3. Importance of Sunflower in Relation with Other Food Crops Production of Sunflower in Eastern Province is relatively important to Zambia’s sunflower total production. However, at household level, Sunflower is the third most important crop in terms of number of households growing it, tonnage and area planted after maize and groundnuts (see Lubungu, Burke, and Sitko 2013 Figures 8-10). Though it is the third most important crop, it has lower relative value in terms of commercialization with a greater share of sunflower being retained for home consumption compared to, for example, soya beans. Anecdotally, about 37% of sunflower produced in Eastern Province is sold and about 63% is retained at household. The retained sunflower is processed into oil and cake, which is consumed at household (by either people or livestock) or sold within the communities. Details of sunflower processing are discussed in the next section. 4.4. Sunflower Production Management As noted earlier, smallholder sunflower yields where local seeds are used are far much below the yields of other farmers, and thus probably much lower than their own potential. In addition to seed variety, there are a number of factors that affect productivity of sunflower farmers. These include planting dates, plant population (and relatedly lack of plant thinning), weed control, and soil type4. This section will discuss some of these aspects of production. 4.4.1. Hectares Allocated to Sunflower Production and Crop Losses While sunflower is third most important crop based on total value of production and area cultivated (Lubungu, Burke, and Sitko (2013), at household level, sunflower is grown on less than one hectare per sunflower producing household in all the districts of Eastern Province (Figure 6). Moreover, not all the area planted under sunflower is harvested. with about 7% of the total area planted lost on average (RALS 2012). Some of the reasons for not harvesting the entire area include bad soils, poor crop management (such as planting late, late weeding, and lack of thinning), droughts and poor seed (Figure 7). Poor seed could be attributed to the continuous use of recycled seed or the aforementioned contamination risks. Figure 7. Average Hectares under Sunflower Production per Household by Districts
Source: RALS 2012. Note: only sunflower producing households are included in this figure. 4 Thinning is the removal of some plants to make room for the growth of other plants.
11
Figure 8. Reasons for not Harvesting the Whole Area Planted
5101520253035
Poor
man
agem
ent
Soils
gen
eral
lyba
d
Drou
ght
Floo
ds/w
ater
logg
ing
Bad
seed
Anim
al/b
irdde
stru
ctio
n
Not
eno
ugh
labo
r
Lack
of f
ertil
izer
Thef
t
Perc
enta
ge o
f hou
seho
lds
Source: RALS 2012. 4.4.2. Planting Timing Late planting is one the reasons why farmers do not harvest the entire planted area. The Zambia Agricultural Research Institute (ZARI) recommends that planting of sunflower should begin around November (assuming the rainy season has begun) and ideally completed by December. In contrast, Figure 8 shows that the majority of smallholder farmers plant sunflower from December through to January with some households planting as late as February and March. Focus group discussion with farmers revealed that those who plant late do so as more time earlier in the planting season is allocated to maize, the primary staple crop. Planting late negatively affects both the oilseed yield as well as the oil content of oilseeds that are harvested. Local research has shown that “sunflower yields decline an average of 15% for each 2 weeks delay beyond recommended planting dates (Figure 9). Late planted sunflower crops also lose 5-15% in oil content” (ZARI n.d.). Figure 9. Planting Dates for Sunflower in Eastern Province
10
38 39
12
15101520253035404550
September October November December January February March
2011 2012
Perc
enta
ge o
f hou
seho
lds
Source: RALS 2012.
12
4.4.3. Seed Rates Plant population density is a one of the critical aspect in maximizing crop production efficiency. For the varieties that are available in Zambia, ZARI recommends a seed rate of 5-8kg/ha of hybrid seed, while survey data shows that the average seed rate is about 17kg/ha (RALS 2012). The seed rates are equally higher than the recommended even among households planting commercial seed. Higher seed rates coupled with lack of thinning results into higher plant population densities. Fields that are more densely populated are likely to have plants with weaker stalks, increased lodging, and more vulnerability to disease, all of which can lead to lower yields5. 4.4.4. Use of other Inputs Figure 8 shows that bad (infertile) soils are second the major reason cited by farmers for not harvesting the whole area planted. Therefore, depending on soil conditions, inputs such as lime, fertilizers and seed treatments may be beneficial to sunflower production (Hussain et al. 2011), but these are seldom used, if ever, in Zambia’s Eastern Province6. For example, ZARI recommends applying 200kg of either D or X compound as basal dressing and 100kg of either Urea or Ammonium Nitrate as top dressing per hectare of sunflower planted (ZARI n.d.). In fact, less than 1% of smallholder farmers growing sunflower used fertilizer on their sunflower in 2010/2011 agricultural season (RALS 2012). 4.4.5. Weed Control One of the advantages of sunflower is that its growth rate and mature plant size make it less vulnerable to competition with most weeds compared to other crops. However, if weeds reach maturity before the sunflower plant, competition can result in the significant yield loss (Gesimba and Langat 2005). Thus weeding during the first four weeks after crop emergence is critical to minimize yield losses. Studies have shown that weed competition during the first 4 weeks after emergence could cause 10-15% yield reduction and this could go up to 30% if weeding is delayed for 6 weeks. No weeding at all could result in yield losses of 30 to 75% (ZARI n.d.). Figure 10 shows that close to 90% of farmers in 2010/2011 cropping season had indeed completed the first weeding of sunflower fields within the four weeks after planting. That said, ZARI (n.d.) indicates that two timely manual weeding are needed in order to provide adequate weed control, whereat the majority of sunflower producers (over 60%) had their fields weeded only once in the 2010/2011 agricultural season (Figure 11)7.
5 Lodging is the state of permanent displacement of plant stems from upright position (Pinthus 1973) 6 Sunflower seed treatment with appropriate fungicides or insecticides may also increase productivity (Mrđa et al. 2011). 7 Weeds can also be managed through the use of herbicides. However, very few (2%) sunflower producing households in Eastern Province used herbicides on their field in 2011/2011 agriculture season (RALS 2012).
13
Figure 10. Number of Weeks the Household Finished the First Weeding after Planting
0
5
10
15
20
25
30
35
40
less than1 week
1 2 3 4 5 6 7 Did notweed
Perc
enta
ge o
f hou
seho
lds
Number of weeks
Source: RALS 2012. Figure 11. Number of Complete Weeding in Sunflower Fields
61.2%
35.1%
3.5%0.2%
.0
10.0
20.0
30.0
40.0
50.0
60.0
70.0
1 2 3 4
Perc
enta
ge o
f hou
seho
lds
Number of complete weedings
Source: RALS 2012. 4.5. Production Constraints Smallholder sunflower productivity has remained stagnantly low. This is mainly due to production challenges associated with low yield improving input use, especially hybrid seeds. Low yields are also related to crop management practices, such as late planting, insufficient weed control and dense seed rates.
14
5. SUNFLOWER MARKETING AND PROCESSING
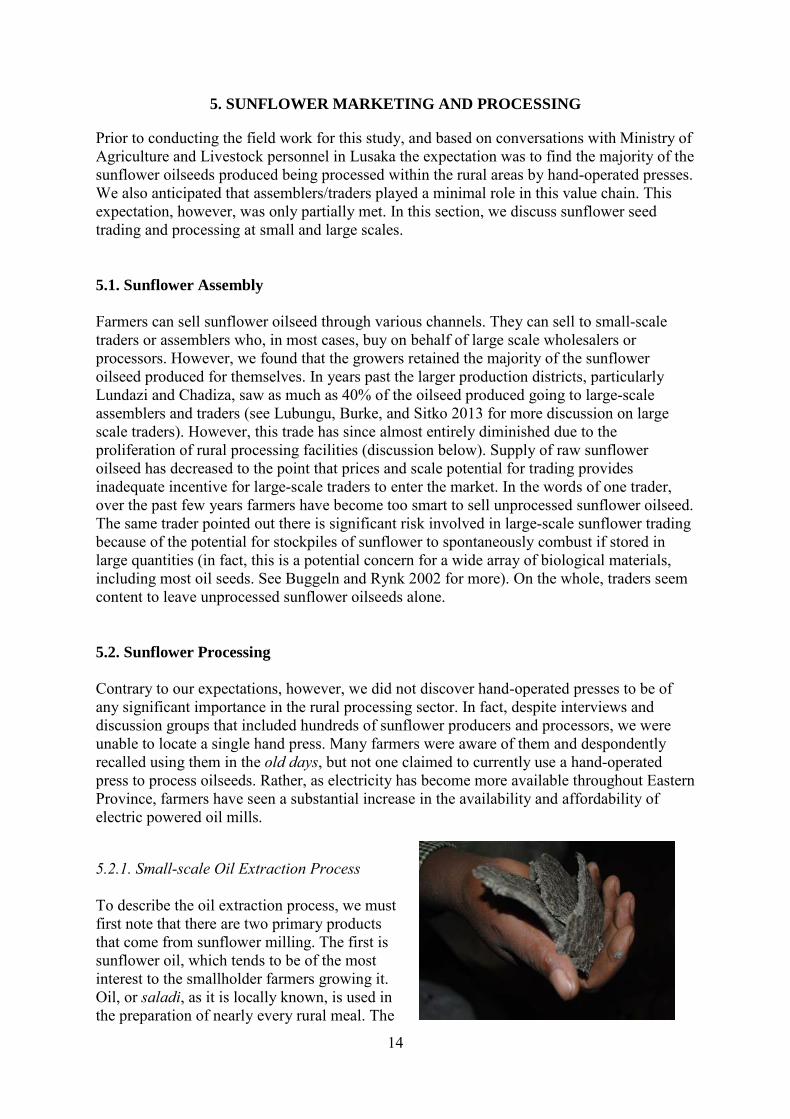
Prior to conducting the field work for this study, and based on conversations with Ministry of Agriculture and Livestock personnel in Lusaka the expectation was to find the majority of the sunflower oilseeds produced being processed within the rural areas by hand-operated presses. We also anticipated that assemblers/traders played a minimal role in this value chain. This expectation, however, was only partially met. In this section, we discuss sunflower seed trading and processing at small and large scales. 5.1. Sunflower Assembly Farmers can sell sunflower oilseed through various channels. They can sell to small-scale traders or assemblers who, in most cases, buy on behalf of large scale wholesalers or processors. However, we found that the growers retained the majority of the sunflower oilseed produced for themselves. In years past the larger production districts, particularly Lundazi and Chadiza, saw as much as 40% of the oilseed produced going to large-scale assemblers and traders (see Lubungu, Burke, and Sitko 2013 for more discussion on large scale traders). However, this trade has since almost entirely diminished due to the proliferation of rural processing facilities (discussion below). Supply of raw sunflower oilseed has decreased to the point that prices and scale potential for trading provides inadequate incentive for large-scale traders to enter the market. In the words of one trader, over the past few years farmers have become too smart to sell unprocessed sunflower oilseed. The same trader pointed out there is significant risk involved in large-scale sunflower trading because of the potential for stockpiles of sunflower to spontaneously combust if stored in large quantities (in fact, this is a potential concern for a wide array of biological materials, including most oil seeds. See Buggeln and Rynk 2002 for more). On the whole, traders seem content to leave unprocessed sunflower oilseeds alone. 5.2. Sunflower Processing Contrary to our expectations, however, we did not discover hand-operated presses to be of any significant importance in the rural processing sector. In fact, despite interviews and discussion groups that included hundreds of sunflower producers and processors, we were unable to locate a single hand press. Many farmers were aware of them and despondently recalled using them in the old days, but not one claimed to currently use a hand-operated press to process oilseeds. Rather, as electricity has become more available throughout Eastern Province, farmers have seen a substantial increase in the availability and affordability of electric powered oil mills.
5.2.1. Small-scale Oil Extraction Process To describe the oil extraction process, we must first note that there are two primary products that come from sunflower milling. The first is sunflower oil, which tends to be of the most interest to the smallholder farmers growing it. Oil, or saladi, as it is locally known, is used in the preparation of nearly every rural meal. The
15
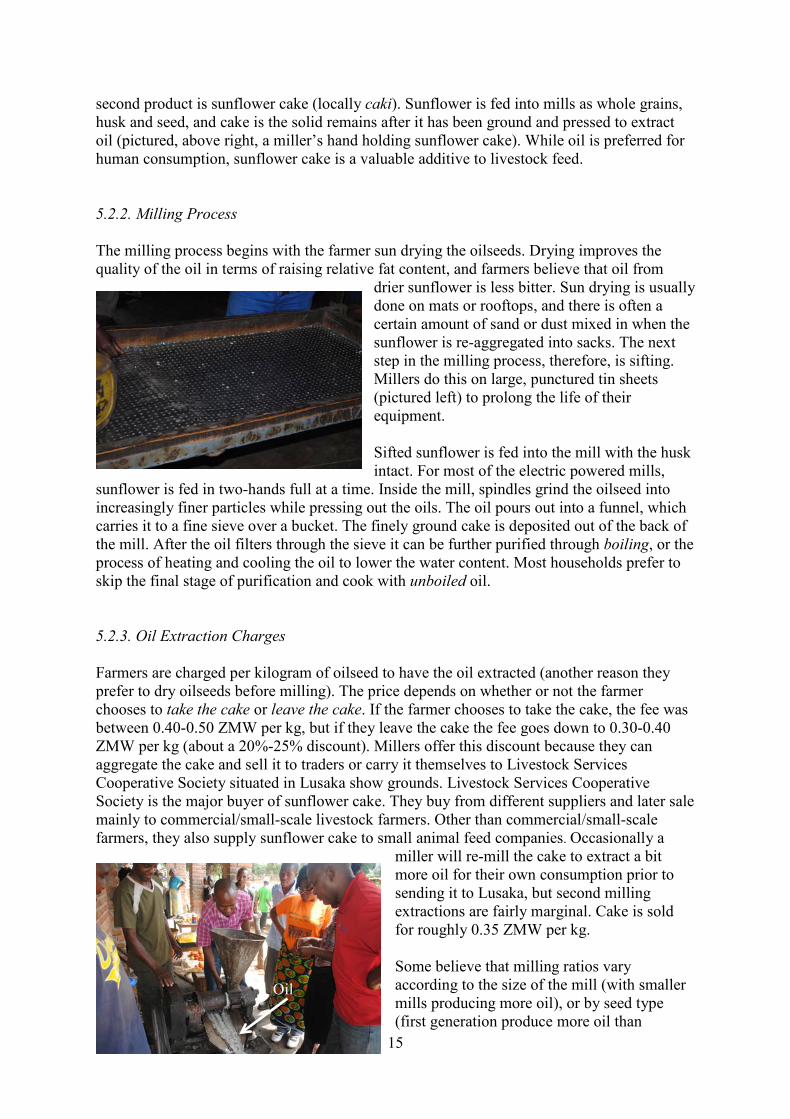
second product is sunflower cake (locally caki). Sunflower is fed into mills as whole grains, husk and seed, and cake is the solid remains after it has been ground and pressed to extract oil (pictured, above right, a miller’s hand holding sunflower cake). While oil is preferred for human consumption, sunflower cake is a valuable additive to livestock feed. 5.2.2. Milling Process The milling process begins with the farmer sun drying the oilseeds. Drying improves the quality of the oil in terms of raising relative fat content, and farmers believe that oil from
drier sunflower is less bitter. Sun drying is usually done on mats or rooftops, and there is often a certain amount of sand or dust mixed in when the sunflower is re-aggregated into sacks. The next step in the milling process, therefore, is sifting. Millers do this on large, punctured tin sheets (pictured left) to prolong the life of their equipment. Sifted sunflower is fed into the mill with the husk intact. For most of the electric powered mills,
sunflower is fed in two-hands full at a time. Inside the mill, spindles grind the oilseed into increasingly finer particles while pressing out the oils. The oil pours out into a funnel, which carries it to a fine sieve over a bucket. The finely ground cake is deposited out of the back of the mill. After the oil filters through the sieve it can be further purified through boiling, or the process of heating and cooling the oil to lower the water content. Most households prefer to skip the final stage of purification and cook with unboiled oil. 5.2.3. Oil Extraction Charges Farmers are charged per kilogram of oilseed to have the oil extracted (another reason they prefer to dry oilseeds before milling). The price depends on whether or not the farmer chooses to take the cake or leave the cake. If the farmer chooses to take the cake, the fee was between 0.40-0.50 ZMW per kg, but if they leave the cake the fee goes down to 0.30-0.40 ZMW per kg (about a 20%-25% discount). Millers offer this discount because they can aggregate the cake and sell it to traders or carry it themselves to Livestock Services Cooperative Society situated in Lusaka show grounds. Livestock Services Cooperative Society is the major buyer of sunflower cake. They buy from different suppliers and later sale mainly to commercial/small-scale livestock farmers. Other than commercial/small-scale farmers, they also supply sunflower cake to small animal feed companies. Occasionally a
miller will re-mill the cake to extract a bit more oil for their own consumption prior to sending it to Lusaka, but second milling extractions are fairly marginal. Cake is sold for roughly 0.35 ZMW per kg. Some believe that milling ratios vary according to the size of the mill (with smaller mills producing more oil), or by seed type (first generation produce more oil than
Oil
16
recycled, for example) but on average each kg of sunflower oilseed will produce 200-225 ml of oil and 800-820 grams of cake. Milling ratios will also vary according to how worn are the spindles inside the mill, where more worn spindles produce a higher cake to oil ratio. 5.2.4. Structure of Small-scale Milling Market In terms of the number of mills in rural areas and the overall availability of services, the milling sector of the sunflower value chain performs well. Mills service farmers for up to a 30 km radius, and there are several mills in each district. In most cases a small milling sector has developed shortly after electricity was introduced to a village or area. That said, the sector’s conduct and performance vis-à-vis competitiveness is less clear at first glance. Our research with small-scale millers revealed minor variations in milling fees from district to district. On the contrary, there is noticeably little variation in milling fees within a district. Wherever interviews were conducted, all of the millers within a day’s walk or so were charging the same price with the same discount for leaving cake behind. In theory this could represent either a very competitive or a very collusive market. There are two ways to gather evidence as to which prevails. First, high profits would be evidence of collusive behavior, but unless the case is very strong such an argument is unavoidably subjective (more later). More definitive evidence can be obtained by simply asking how prices are set. For the most part millers candidly discussed how they meet and set prices collectively, usually every few weeks, but prices tend not to change within a season once they are agreed upon. When asked why a farmer, if prices are the same, would come to their mill instead of another the main answer was either more favorable scales or customer loyalty that is usually paid for with differing levels of unspoken incentive, or mbasela, a local word meaning a little extra for loyal customers (e.g. the last kg or so gets milled free of charge). To examine the degree to which the mbasela and scale rigging counteracts collusive pricing we consider a model for milling profits. First, to establish some parameters, millers tell us that, depending on how many farmers come to the mill and the size of the machine, a single mill can process between 60 and 180 tonnes of sunflower oilseed per month and that the peak milling season lasts about 3 months8. The milling machines themselves cost between 15,000 and 22,000 ZMW, and the rollers or spindles within them need to be replaced on a nearly monthly basis. Again, the cost of replacement can vary widely depending on the type of mill and the number of rollers, but most estimate monthly costs between 700 and 1,200 ZMW. Belts and ball bearings are replaced after roughly four months of use at an average cost of 30 ZMW for each. As recently as 10 years ago a miller would have to travel to Tanzania to buy a mill for replacement parts, but now mills can be purchased in Lusaka and most replacement parts are available in Chipata.
8 15 minutes per 50kg (which is feasible), this means a 10 hour non-stop operating day, 30 days per month.
Cake
17
The electricity to operate a mill costs between 200 and 500 ZMW per month. This depends on use and mill size, although many millers pay a flat rate (within the same range) because Zambia Electricity Supply Corporation, the electricity provider, lacks monitoring capacity. Millers hire 2-4 laborers during the height of the milling season at a fairly standard rate of 300 ZMW per month. To the best of our knowledge, this is an exhaustive list of the costs associated with starting and running a sunflower oil mill. Based on these parameters, Table 4 provides a model of the costs and revenues for two hypothetical mills: one small mill with all of the low parameters for costs and revenue and one large mill with all of the high-end parameters. According to these descriptions, the monthly operational costs for a small mill is roughly 1,500 ZMW per month and those for a large mill are nearly twice that figure. Monthly revenue, on the other hand, when we combine the milling fees and cake sales (note this is assuming all farmers leave the cake, as the vast majority do), monthly revenue for the small mill is 37,800 ZMW and that for the large mill is over 114,000 ZMW. Table 4. Cost and Revenue Model for a Rural Sunflower Miller Small Mill Large Mill Operational Cost (ZMW/Month) Roller replacement 700.00 1,200.00 Labor 600.00 1,200.00 Electricity 200.00 500.00 Belt replacement 7.50 7.50 Bearing replacement 7.50 7.50 Total Monthly cost 1,515.00 2,915.00
Operational Revenue (ZMW/Month) Processing fees 21,000.00 63,000.00 Cake sales 16,800.00 51,660.00 Total Monthly revenue 37,800.00 114,660.00 Monthly profit 36,285.00 111,745.00 Number of months 3.00 3.00 Cost of Machine 15,000.00 22,000.00 Annual License 250.00 250.00 First year profit (ZMW) 93,605.00 312,985.00 First year profit ($) 18,721.00 62,597.00
Parameters Sunflower processed (kgs) 60,000 180,000 Oil per kg (ml) 250 225 Oil produced (liters) 15,000 45,000 Cake per kg (kg) 0.8 0.82 Cake (kgs) 48,000 147,600 Process fee (ZMW/kg) 0.35 0.35 Cake sell price (ZMW/kg) 0.35 0.35
Source: Authors notes and calculations.
18
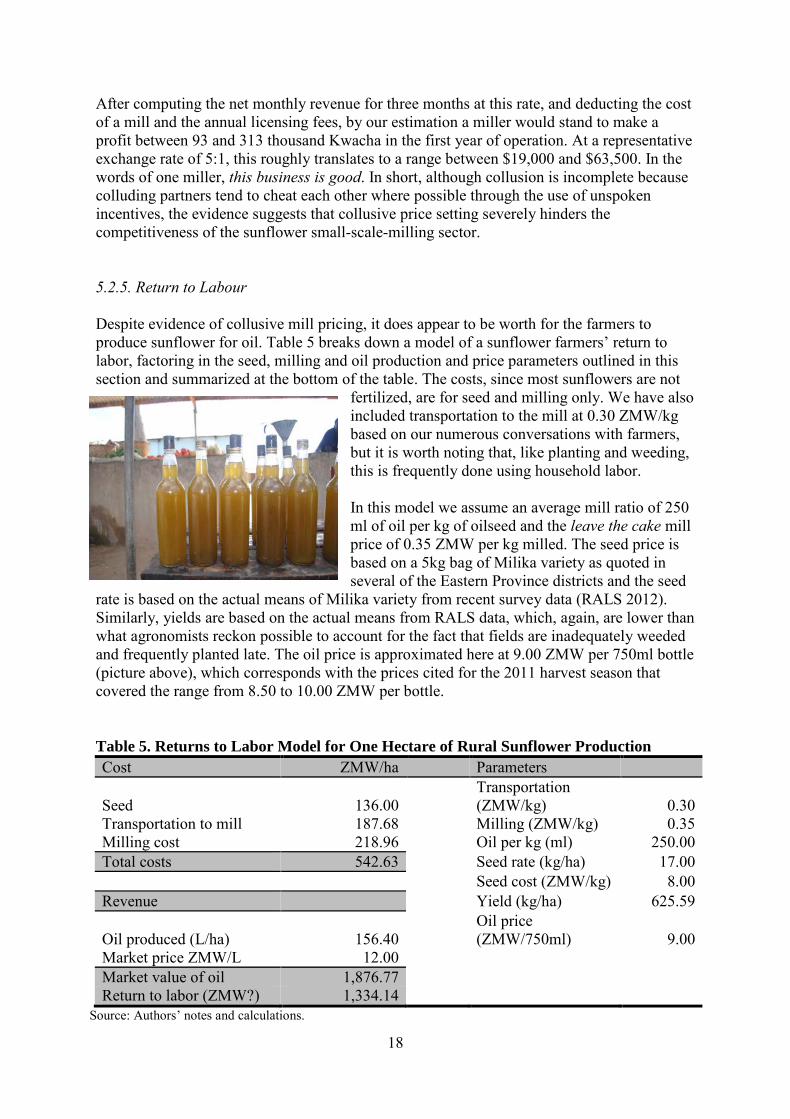
After computing the net monthly revenue for three months at this rate, and deducting the cost of a mill and the annual licensing fees, by our estimation a miller would stand to make a profit between 93 and 313 thousand Kwacha in the first year of operation. At a representative exchange rate of 5:1, this roughly translates to a range between $19,000 and $63,500. In the words of one miller, this business is good. In short, although collusion is incomplete because colluding partners tend to cheat each other where possible through the use of unspoken incentives, the evidence suggests that collusive price setting severely hinders the competitiveness of the sunflower small-scale-milling sector. 5.2.5. Return to Labour Despite evidence of collusive mill pricing, it does appear to be worth for the farmers to produce sunflower for oil. Table 5 breaks down a model of a sunflower farmers’ return to labor, factoring in the seed, milling and oil production and price parameters outlined in this section and summarized at the bottom of the table. The costs, since most sunflowers are not
fertilized, are for seed and milling only. We have also included transportation to the mill at 0.30 ZMW/kg based on our numerous conversations with farmers, but it is worth noting that, like planting and weeding, this is frequently done using household labor. In this model we assume an average mill ratio of 250 ml of oil per kg of oilseed and the leave the cake mill price of 0.35 ZMW per kg milled. The seed price is based on a 5kg bag of Milika variety as quoted in several of the Eastern Province districts and the seed
rate is based on the actual means of Milika variety from recent survey data (RALS 2012). Similarly, yields are based on the actual means from RALS data, which, again, are lower than what agronomists reckon possible to account for the fact that fields are inadequately weeded and frequently planted late. The oil price is approximated here at 9.00 ZMW per 750ml bottle (picture above), which corresponds with the prices cited for the 2011 harvest season that covered the range from 8.50 to 10.00 ZMW per bottle. Table 5. Returns to Labor Model for One Hectare of Rural Sunflower Production Cost ZMW/ha
Parameters
Seed 136.00
Transportation (ZMW/kg) 0.30
Transportation to mill 187.68
Milling (ZMW/kg) 0.35 Milling cost 218.96
Oil per kg (ml) 250.00
Total costs 542.63
Seed rate (kg/ha) 17.00
Seed cost (ZMW/kg) 8.00
Revenue
Yield (kg/ha) 625.59
Oil produced (L/ha) 156.40
Oil price (ZMW/750ml) 9.00
Market price ZMW/L 12.00 Market value of oil 1,876.77 Return to labor (ZMW?) 1,334.14 Source: Authors’ notes and calculations.
19
Given these parameters, we compute a net return to labor for producing 1 hectare of sunflower to be 1,397 ZMW. According to Burke et al. (2011), this is greater than the net revenue per hectare for maize for about 50% of the farmers producing it in Zambia.9 As Burke et al. (2011) showed, agricultural productivity and the returns to land and labor can vary substantially within Zambia. We thus subject the findings from our hypothetical model to sensitivity analysis. This will not only demonstrate the robustness of our conclusion that sunflower production has meaningful positive returns at the farm level, but also allows us to highlight potential areas of policy intervention. Figure 12 shows sensitivity analysis by graphing the percentage change in the returns to labor per hectare on the vertical axis against a 10% change in four determinants of net returns in our model (oil price, seed price, milling price and yields). Hence, a relatively flat line in Figure 12 is associated with a net revenue determinant where a 10% change has a relatively low impact. The flattest of these lines is that for seed prices. Our model shows that, with all other parameters fixed, a 10% decrease in seed price would have less than a 0.5% increase in net returns to labor per hectare (and vice versa). Figure 12 also shows that net returns are fairly inelastic with respect to the previously described collusive milling price. A 10% decrease in milling price would result in an in increase in returns to labor per hectare of just 1.5%. Figure 12. Sensitivity Analysis for Table 5
Source: Authors’ notes and calculations. 9 This is according to the figures in Burke et al. (2011) that are reported in Table 4, but revised to use a commercial price for maize of 800 ZMK per kg (which is 0.80 ZMW), to be consistent with the commercial oil and milling prices used in our model. Burke et al. (2011) itself was based on the FRA price of 1,300 ZMK per kg (1.30 ZMW)
-15.00%
-10.00%
-5.00%
0.00%
5.00%
10.00%
15.00%
-10% 0 10%
Chan
ge in
Ret
urn
to L
abor
Change in Return to Labor Determinants
Returns to Labor Sensitivity Analysis
Oil price
Seed Price
Mill Price
Yield
20
Returns to labor, according to Figure 12, are far more elastic with respect to oil prices and yield. A 10% increase in oil price results in greater than a 13% increase in returns (and vice versa). It is worth noting that plus or minus 10% from the figure in our model (9.25 ZMW per bottle) is very close to the intra-seasonal price range revealed during farmer focus group discussions, indicating that (for oil sellers) timing of sale can make a difference of up to 20% in the net returns to labor per hectare. Also according to Figure 12, a 10% increase in yields will correspond to a 10% increase in returns to labor per hectare. As reported in the previous section, sunflower yields in the Eastern Province are highly variable and well below potential yields. This suggests that yield improving technologies could have a potentially very large impact on the livelihood of sunflower growers. 5.2.6. Large Scale Processing Traditionally, the main non-food uses for fats and oils have been in the manufacture of soaps and detergents and in the production of greases, lubricants, and candles. However, the edible oil and stock feed industry have also provided significant use of oilseeds such as sunflower and soybeans. The extent at which sunflower is being used at large scale processing especially in the edible oil industry is slowly diminishing. The large scale edible oil processing companies that were interviewed revealed that soybean is now taking centre stage. This is partly because sunflower oilseeds are not in surplus supply and such raw materials for edible oil production are not profitable from an economical point of view. For instance, the High Protein Foods Company (that manufactures vegetable oils among other products) are now only processing soya bean because of the low supply of sunflower. In addition, solvent extraction of oil from sunflower has a long process compared to solvent extraction of oil from soybean. Extraction of oil from sunflower entails additional equipment for de-hulling which is an added cost on the part of processors. A recently installed plant for oil extraction for Mount Meru Company for example, only extracts oil from soya beans because of the specialized nature of their de-hulling equipment. Rather than processing, other companies have also opted to go into refinery. For example, Unified Chemicals Company (producers of Olé oil) import crude oil which is later refined into final products. Like the oil processing companies, large animal feed companies also depend on soya as the main source of protein. They equally echoed on the insufficient quantity of sunflower seed or sunflower cake. This is at least partially attributed to the fact that sunflower cake is mostly supplied by the small-scale millers whose industry they termed as fragmented, which raises the cost of doing business. In addition to the insufficient quantities, sunflower cake produced from mechanical extraction is considered of low quality. As discussed earlier, small-scale millers crush sunflower grains whole (including the husks). This leaves sunflower cake with more fibre than protein or fat, whereas the feed industry (especially the poultry sector) is more interested in the latter. The protein content is higher in the soya cake (which is extracted using solvents) as compared to sunflower cake (which is mechanically extracted). The solvent extracted cake gives about 36 to 38% of protein compared to 18 to 20% of mechanical extraction. Even though sunflower cake has low protein content, it is still a cheap source of protein for some small feed companies and commercial/medium-scale livestock farmers. As mentioned
21
earlier, the small scale millers sell their aggregated sunflower cake to Livestock Services Cooperative Society situated in Lusaka show grounds. Livestock Services Cooperative Society which is the major buyer of sunflower cake mainly sells to commercial/medium-scale livestock farmers and small animal feed companies. 5.3. Constraints to Processing Large-scale oil processers do not operate at full capacity due to the limited supply of sunflower, indicating there is substantial unmet demand. The large-scale animal feed industry, on the other hand, remains focused on using relatively high-protein soya cake. Moreover, soya-based oil production uses a solvent-based extraction process that is not suitable for sunflower based oil production. The sunk costs on investments already made on equipment made for soya oil solvent extraction make processors unlikely to shift to sunflower based oil production any time soon. That said, large-scale oil and feed processing are of fringe importance to the current sunflower value chain in Eastern Province, which is almost entirely self-contained in rural areas. The vast majority of sunflower production is milled into oil and cake by small-to-medium scale millers located in electrified regions of the province. We estimate the returns to labor make sunflower farming worthwhile within the current value chain, but we also find substantial evidence of collusive price behavior amongst millers. This results in a disproportionately large share of the profits in the value chain being captured at the milling stage. More rigorous regulation of competitiveness would ensure a more egalitarian distribution of benefits.
22
6. CONCLUSION AND RECOMMENDATIONS
Sunflower is a crop that could potentially improve income levels of smallholder farmers in Eastern Province. It can be fairly easily grown with relatively little use of inorganic fertilizers though land productivity is probably much lower than potential yields. In addition, sunflower can be locally processed to near commercial quality oil on the farm or at nearby small-scale processors. Returns to labor are fairly elastic with respect to oil prices and yield. A 10% increase in oil price results in greater than a 13% increase in returns (and vice versa) suggesting that (for oil sellers) timing of sale can make a difference of up to 20% in the net returns to labor per hectare. Since sunflower oil offers more benefits compared to selling sunflower seed, there is need to promote commercialization through education on how to identify potential markets. Also, smallholder sunflower yields have remained stagnantly low. This is mainly due to production challenges associated with low yield improving input use, especially seeds. In addition to the focus on using local or recycled seeds, farmers claim they are often victims of counterfeiting. Additional productivity constraints come from poor crop management practices such as late planting, inadequate weed control and seed rates at higher densities than local recommendations. Further, the evidence suggests that collusive price setting hinders the competitiveness of the sunflower small-scale milling sector, and that the vast majority of the profit in the rural value chain is captured by small-scale millers. That said, despite uncompetitive pricing, the small-scale milling sector of the sunflower value chain performs well in terms of the number of mills in rural areas. Also, it does appear to be worthwhile for the farmers to produce sunflower for oil even in the current value chain setting. Thus, poverty reducing potential remains in the production and processing of sunflower oilseeds in Zambia’s rural areas The production challenges highlighted suggests that yield improving technologies could have a potentially very large impact on the livelihood of sunflower growers (and particularly sellers). Technologies may include the use of first generation seeds, fertilizers, fungicides or other inputs. Alternatively, production methods such as earlier plantings, and more frequent weeding should form part of the intervention strategies (or should at least address the reasons that sunflower seems to take a back-seat to maize production despite the evidence of sunflower’s profitability, such as a lack of business training or the extension focus on maize production). One final way of helping smallholder farmers to benefit from sunflower production would be to encourage enforcement of the current seed laws against those who knowingly contaminate or counterfeit seed sales. This could be done through promoting awareness of smallholder rights under the Laws of Zambia Seed Act, or, perhaps, supporting local governments in enforcing these laws.
23
Box 1 – A Story of Would-be Sunflower Out-growers and the Discount Rate of Small Farmers While the vast majority of improved sunflower seed is sold in spot transactions, we did find one entrepreneurial group of young investors attempting an out-grower scheme. Their plan was to start-up during the 2011/12 agricultural season and work with 75 farmers that were identified through local cooperatives as reliable partners. The deal for each farmer was a 5 kg bag of seed at planting time, worth a total of 30 ZMW, in exchange for 2 ½ 50 kg sacks of oilseed, worth 55 ZMW each, at harvest time with any additional harvest being kept by the farmer. The group was willing to accept the cash equivalent, 137.50 ZMW, in lieu of oilseed if any farmer was unable to hand over the 2 ½ sacks. After collecting the roughly 190 bags they were due, the plan was to buy a mill and press it all into oil to be sold in district capital at market prices. They would re-invest the net revenue from the first year (which would still be positive after paying for the seed and mill, barring an unlikely collapse in the price of oil) by expanding their farmer base in the following year. They surmised that if they could double the farmer base two years in a row, their venture would yield between a 600% and 800% return on initial investment of about $3,250 over a three year period (depending on the stability of seed, oil and cake prices). Potential economies of scale limitations notwithstanding, their endeavor had all the markings of a profitable business plan (see appendix). The flaw in their strategy, they learned, was the willingness to accept cash-in-lieu of oilseed as repayment from their farmers. Most of their farmers realized they could pay another mill to press 2 ½ bags of oilseed into oil, pay their debt to the group of lenders and have a bit remaining for themselves. As a result, the lenders did not have enough oilseed at the end of the first year’s harvest to justify buying a mill (they wisely hedged the risk of not collecting enough oilseed and put off buying the mill until after harvest). Fortunately, they did collect cash from most of those who did not bring oilseed, which, combined with the sales of the oilseed they did collect, did result in a modest profit for their failed venture. They plan on revising their incentive structure and trying again next year. This story has two important lessons. First, the income generating potential of investments in the production and sale of sunflower oil is potentially very large. If, for example, a farmer cooperative had the capital and coordination mechanisms in place to run an enterprise similar to the one described here, the shared profits would dramatically increase member incomes (also see the discussion of miller profits in Section 5). Secondly, this story tells us the somewhat startling revealed preference of farmers for present versus future value. Accepting 30ZMW worth of seed in exchange for 137.50 ZMW worth of oilseed in four months' time is equivalent to taking a loan out at a 46.3% compounded monthly interest rate. Notably, all of the farmers that took the deal last year would apparently be willing to do so again. It stands to reason that there would be a strong and positive correlation between poverty and discount rate. This story shows evidence of that correlation quite clearly.
24
APPENDIX Three-year Profitability of Outgrower Scheme Described in Box 1 YEAR 1 Parameters (USD) Number of farmers 75 Cost of seeds distributed to farmers (ZMW) 2,250 450 Bags received from farmers at harvest 187.5 Kg/bag 35 Oil per kg (L) 0.25 Cake/kg (kg) 0.81 Oil price (ZMW/L) 12 2 Cake price (ZMW/kg) 0.35 0 Oil revenue 19,688 3,938 Cake revenue 1,860 372 Mill price 14,000 2,800 Mill Operations 700 140 Net Revenue (Year 1) 4,598 920 YEAR 2 Number of farmers 150 Seed cost 4,500 900 Bags received 375 Oil Revenue 39,375 7,875 Cake Revenue 3,721 744 Mill operations 1,500 300 Net Revenue (Year2) 37,096 7,419 YEAR 3 Number of farmers 300 Seed cost 9,000 1,800 Bags received 750 Oil Revenue 78,750 15,750 Cake Revenue 7,442 1,488 Mill operations 3,000 600 Net Revenue (Year3) 74,192 14,838 3-year Totals 3-Year Net Revenue 115,886 23,177 Value of depreciated mill after 3 years of operation 20% annual depreciation)
7,168 1,434
Total 3-year profit 123,054 24,611 Nominal return on initial investment 757%
Note: costs within each year are in lightly shaded rows. All USD conversions assume an exchange rate of 5 ZMW per USD.
25
REFERENCES
Buggeln, R. and R. Rynk. 2002. Self-Heating in Yard Trimmings: Conditions Leading to Spontaneous Combustion. Compost Science and Utilization 10.2: 162-82.
Burke, W. J., M. Hichaambwa, D. Banda, T.S. Jayne. 2011.The Cost of Maize Production by
Smallholder Farmers in Zambia. FSRP Working Paper No. 50. Lusaka: Food Security Research Project. Accessed July, 2013 at http://fsg.afre.msu.edu/zambia/wp50.pdf
CSO/MAL. 2010. Crop Forecast Survey. Lusaka: CSO. CSO/MAL. Various years. Crop Forecast Survey. Lusaka: CSO. Gesimba, R.M. and M.C. Langat. 2005. A Review on Weeds and Weed Control in Oil Crops
with Special Reference to Soybean (Glycine max L.) in Kenya. Agricultura Tropical ET Subtropica 38.2: 56-61.
Hussain, S.S., F.A. Misger, A. Kumar, and M.H. Baba. 2011. Response of Nitrogen and
Sulphur on Biological and Economic Yield of Sunflower (Helianthus annuus L.) Research of Journal of Agricultural Sciences 2.2: 308-10.
Lubungu, M., W. Burke, and N. Sitko. 2013. Analysis of Soya Bean Value Chain in Eastern
Province of Zambia. IAPRI Working Paper No. 74. Lusaka: Indaba Agricultural Policy Research Institute.
Mrđa, J., J. Crnobarac, B. Dedić, V. Miklič. 2011. Field Emergence of Differently Storaged
Sunflower Seed. Research Journal of Agricultural Science 43.1: 120-25. Accessed August 2013 at http://www.rjas.ro/index.php/rjas/article/view/1343/1140
Pinthus, M.J. 1973. Lodging in Wheat, Barley, and Oats: The Phenomenon-Its Causes and
Preventative Measures. Advances in Agronomy 25: 209-63. RALS. 2012. Rural Agricultural Livelihood Survey of 2012. Lusaka: IAPRI and Government
of Zambia. ZARI. 2002. Sunflower Production Guide. Mount Makulu Central Research Station. Lusaka:
ZARI. ZARI. n.d.. National Oil Seeds Research and Development Programme. Lusaka: ZARI.
Accessed July 2013 at http://www.zari.gov.zm/Oilseed.php