137
Analysis of the TEPCO Fukushima Daiichi NPS Accident Interim Report (Provisional Translation) October 2014 Nuclear Regulation Authority, Japan

Analysis of the TEPCO Fukushima Daiichi NPS Accident
Interim Report
(Provisional Translation)
October 2014
Nuclear Regulation Authority, Japan
Contents
Executive Summary
1. Introduction 1.1 Background 1.2 Aim of the Report
2. Review by the Nuclear Regulation Authority
2.1 Issues Addressed in the Review 2.2 Organization and Approach of the Review
3. Analytical Results, Discussion and Conclusion of the Review
3.1 Possibility of Small-scale Coolant Leaks in Unit 1 3.2 Functional Loss of Emergency Power System A of Unit 1
3.3 Water Leak on the 4th Floor of the Reactor Building of Unit 1 3.4 Possibility of Disabling Safety Relief Valve due to Small-scale LOCA in Unit 1 3.5 Operating Status of the Isolation Condenser of Unit 1 3.6 Possibility of Criticality in SFP of Unit 3 and White Smoke from Unit 3
3.7 Hydrogen Explosion in the Reactor Building of Unit 4 4. Future Regulatory Activities

Executive Summary
The NRA considers it important to technically analyze the nuclear accident of the
Fukushima Daiichi Nuclear Power Station continuously by using the analysis results of the accident, conducting mid- and long-term investigation, and reflect necessary safety knowledge and information in the safety regulations.
Among the various issues and unexplained issues raised by several reports, the NRA has selected the unexplained issues that the National Diet Investigation Commission requires regulatory bodies to conduct empirical investigations and examinations of those issues with sufficient evidences. The NRA conclusions in this report are as follows:
(1) Possibility of Small-scale Coolant Leaks in Unit 1
The National Diet Investigation Commission Report states: "A small-scale LOCA, from small through-wall crack(s) in the piping and a subsequent leak of coolant, would not noticeably affect the variations in the water level or pressure of a reactor. If this kind of small-scale LOCA were to remain uncontrolled for 10 hours or so, tens of tons of coolant would be lost, leading to core damage or core melt."
The NRA could not find any plant data indicating coolant leak from the reactor pressure boundary between the earthquake occurrence and the tsunami arrival. Even if a coolant leak would have occurred, it could not be exceeding the leak rate defined as LCO, as based on analytic calculations of pressure in the PCV. Even if a leak with the leak rate defined as LCO would have been left for 10 hours, the total amount of coolant leak is at most 2.3 m3 (= 2.3 tons), which is much less than "several tens of tons" pointed out by the National Diet Investigation Commission or 205 m3 of reactor coolant volume of Unit 1. Therefore, the NRA concluded that such a small quantity of coolant leak for 10 hours with other safety functions including power supply could not result in core damage.
(2) Functional Loss of Emergency Power System A of Unit 1
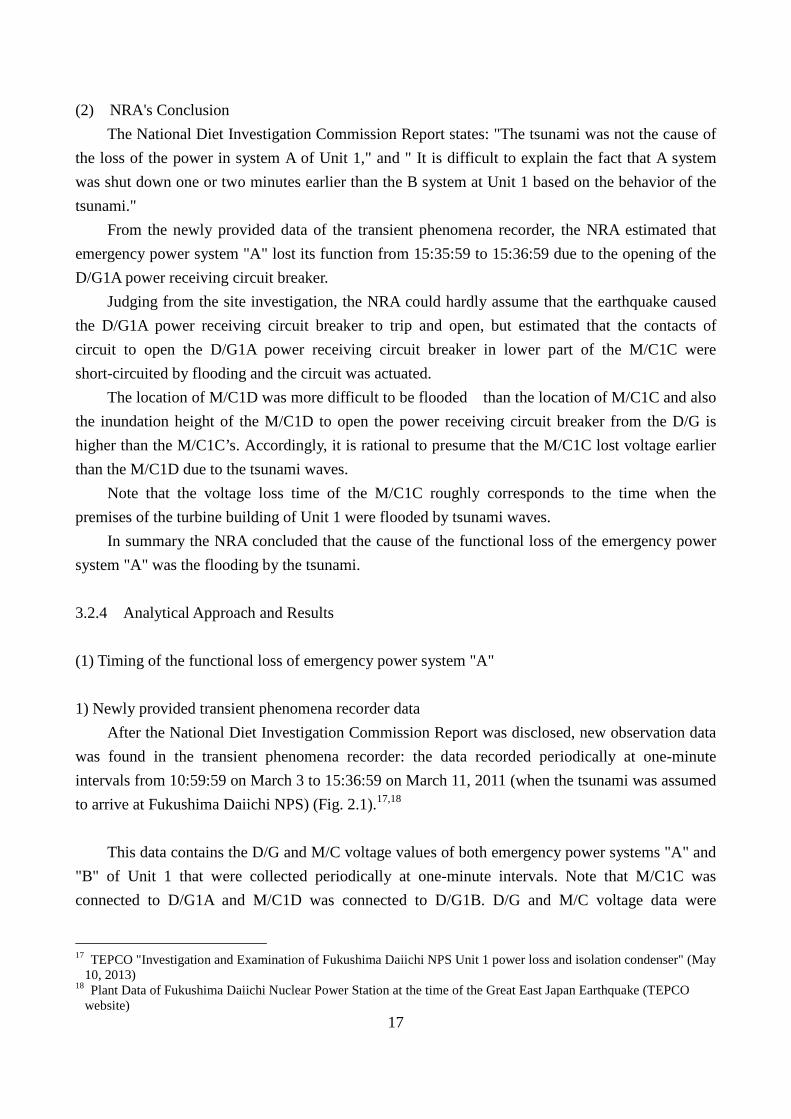
The National Diet Investigation Commission Report states: "The tsunami was not the cause of the loss of the power in system A of Unit 1," and " It is difficult to explain the fact that A system was shut down one or two minutes earlier than the B system at Unit 1 based on the behavior of the tsunami."
From the newly provided data of the transient phenomena recorder, the NRA estimated that emergency power system "A" lost its function from 15:35:59 to 15:36:59 due to the opening of the D/G1A power receiving circuit breaker.
Judging from the site investigation, the NRA could hardly assume that the earthquake caused the D/G1A power receiving circuit breaker to trip and open, but estimated that the contacts of circuit to open the D/G1A power receiving circuit breaker in lower part of the M/C1C were

short-circuited by flooding and the circuit was actuated. The location of M/C1D was more difficult to be flooded than the location of M/C1C and also
the inundation height of the M/C1D to open the power receiving circuit breaker from the D/G is higher than the M/C1C’s. Accordingly, it is rational to presume that the M/C1C lost voltage earlier than the M/C1D due to the tsunami waves.
Note that the voltage loss time of the M/C1C roughly corresponds to the time when the premises of the turbine building of Unit 1 were flooded by tsunami waves.
In summary the NRA concluded that the cause of the functional loss of the emergency power system "A" was the flooding by the tsunami.
(3) Water Leak on the 4th Floor of the Reactor Building of Unit 1
Regarding the water leak on the 4th floor of Unit 1 immediately after the earthquake, the National Diet Investigation Commission Report states: "NAIIC believes that this leak was not due to water sloshing out of the spent fuel pool on the fifth floor. However, since we (NAIIC) cannot go inside the facility and perform an on-site inspection, the source of the water leakage remains unconfirmed." Based on the results of site investigation and analysis, the NRA estimated that the water leak on the 4th floor of Unit 1 occurred by water that jetted out through gaps in the panel joints of the overflow chamber caused by the pressure of water overflowing into the overflow chamber due to sloshing in the SFP. (4) Possibility of Disabling Safety Relief Valve due to Small-scale LOCA in Unit 1
The National Diet Investigation Commission Report states: "We found that no control room operator in charge of Unit 1 heard the sound of the Unit 1 SRV opening. There is therefore a possibility that the SRV did not work in Unit 1. In this case, a small-scale LOCA caused by the earthquake motion could have taken place in Unit 1."
From the results of analysis, the NRA estimated that the possibility that all safety valve functions of SRV lost is extremely low judging from the valve structures. Moreover, the SRVs were not actuated since the RPV pressure had been controlled by the IC before the tsunami arrival. On the other hand, as the result of numerical analyses in consideration of a small-scale LOCA after the tsunami arrival, in case the maximum calculated RPV pressure was under the working pressure of the safety valve function of the SRV, the calculated pressure quickly dropped and vastly diverged from the RPV pressure measured 5.4 hours after the earthquake. Furthermore, the RPV pressure measured 5.4 hours after the earthquake occurrence was roughly equivalent to the working pressure of the safety valve function of the SRV, the NRA estimated that the safety valve function of the SRV had been working normally (to open and close repeatedly) at least until then. From these results, the NRA considers it rational that the SRV had actually worked.
As for the sound of the SRV opening, the NRA considers it natural that the IC of Unit 1 was working normally and the relief valve function of the SRV was not actuated before the tsunami arrival. On the other hand, the relief valve function of the SRV of Unit 2 was working normally (to open and close repeatedly). The NRA estimated that the operators could hear the sounds of the SRV

opening of Unit 2. After the tsunami arrival, the NRA considers it highly likely that the safety valve function of
the SRV was actuated as the RPV pressure increased. The NRA also estimated that the sounds of the relief valve opening and safety valve opening of SRV are different due to the different valve structures and the different situation of discharged steam. As for the sounds of SRV opening in Unit 2 and Unit 3 that the National Diet Investigation Commission report pointed out, the time of the sound was not clear. Therefore, the NRA will investigate the sounds of the SRV opening again when the evidence data of the National Diet Investigation Commission report is disclosed. (5) Operating Status of the Isolation Condenser of Unit 1
The National Diet Investigation Commission report states: "There is no possible scenario proving the Government’s Investigation Committee’s presumption that “for an unknown reason, the AC power kept working even after the loss of DC power.“" Based on the analyses, the NRA estimated that the scenario exists that "the AC-driven valve was closed since the AC power supply kept working even after DC power supply for the IC rupture detection circuit was lost," as reported by the Government Investigation Committee. The NRA estimated that it is hard to confirm whether this scenario actually occurred because it is not clear when each power panel lost in detailed. However, the status of the isolation valves and the flooded condition of station’s power equipment in the site investigation could suggest the possibility that the theoretical scenario described above had actually occurred.
As for the working status of the IC after all power supplies were lost, the Government Investigation Committee Report states: "The actual degrees to which the isolation valves (MO-1A and 4A) were open inside the containment were small and thus the rate of steam flow of the IC (system A) was not enough to fully perform its cooling function." The National Diet Investigation Commission Report conversely states: "The reason that the IC system (A) did not respond properly to the operator actions was not because MO-1A and MO-4A were disabled at the closed position by the failsafe feature." Judging from the analyses, the NRA estimated that the isolation valves (2A and 2B) outside the PCV were closed, but isolation valves (1B and 4B) of the IC (system "B") in the PCV remained open. However, the operating status (open/close) of isolation valves (1A and 4A) of the IC (system "A") in the PCV is not clear. It is therefore necessary to continue analyses of this issue. (6) Possibility of Criticality in SFP of Unit 3 and White Smoke from Unit 3
The National Diet Investigation Commission Report states: "Observation of the spent fuel pool after the explosion shows the possibility of substantial damage to the fuel." Based on the underwater pictures of the SFP in Unit 3 taken by TEPCO after the National Diet Investigation Commission report was disclosed, the NRA estimated that there is no severe damage to the fuel storage racks and fuel assemblies, though there are the concrete and steel frame debris on the top of the racks.
The report also states: "What was the source of the massive amount of heat that caused

intermittent water evaporation in the form of white smoke to come out of the pool? There was the possibility of damaged fuel inside the pool causing temporary massive heat generation." From the analysis results, the NRA estimated that the white smoke from the reactor building of Unit 3 came from the adjacent area of the dryer separator pit and reactor well cover, where opposite side to the SFP across the reactor. The possible cause of heat generation was the steam coming from inside the reactor through sealed portions deteriorated by heat or the water hosed out from fire engine heated at the outside walls of the PCV. Note that no rain was confirmed.
The report also states: "If the pool was impacted from the hydrogen explosion, it is probable that the used and unspent fuel assemblies were moved closer together and became compressed against one another, creating a condition of criticality inside the pool." From the analysis, the NRA estimated that, when fuel assemblies moved in the racks, percent change of the effective multiplication factors were less than 1% (i.e. a little higher for aluminum racks, a little lower for boron-added aluminum racks). (7) Hydrogen Explosion in the Reactor Building of Unit 4
The National Diet Investigation Commission Report states: "The exploded hydrogen could have come from Unit 3 as well as the Unit 4 spent fuel pool, but no quantitative evaluation can be given at this stage." From the analysis results, the NRA estimated that it takes at least about 400 kg of hydrogen to damage the walls on the 4th and 5th floors of the reactor building of Unit 4. The hydrogen gas caused this explosion was generated in Unit 3 and then entered (back-flown) into the reactor building of Unit 4 through the SGTS. The NRA also estimated that it is unlikely that the hydrogen generated by the radiolysis of water in the SFP of Unit 4 quoted by the National Diet Investigation Commission report is main source of the hydrogen explosion in Unit 4.
1
1. Introduction
1.1 Background
On March 11, 2011 Great East Japan Earthquake and incidental tsunami hit the Fukushima Daiichi Nuclear
Power Station (NPS) of Tokyo Electric Power Co. Inc. (TEPCO), resulting in the extremely serious accident and
contamination in the vast area of the region.
Based on the lessons learnt from this accident, the Nuclear Regulation Authority (NRA) was
established in September 2012, and as one of the affairs under its jurisdiction, the Act for Establishment of the Nuclear Regulation Authority stipulates, "About investigations of the causes of accidents due to reactor operations (hereinafter, "nuclear accident") and damage induced by the nuclear accident" (in Article 4 (1)-10). Therefore, one of very important duties of the NRA is to continue analyzing the TEPCO Fukushima Daiichi NPS accident (hereinafter, "Fukushima Daiichi accident").
The NRA considers it important to technically analyze the nuclear accident continuously by
using the analysis results of the accident (at the time of occurrence), conducting mid- and long-term investigation and analysis of inside the reactor, and reflecting necessary safety knowledge and information in the safety regulations. The NRA also considers it important to analyze the accident’s and its subsequent response actions’ effects on the reactor, equipment and other apparatus from the standpoint of securing safety.
To accomplish the duties and purposes above-mentioned, the NRA has established an
organization to analyze the Fukushima Daiichi accident and has undertaken continuously mid- and long-term analyses.
The Fukushima Daiichi accident has been investigated, examined, and reported by the National
Diet of Japan Fukushima Nuclear Accident Independent Investigation Commission (hereinafter, "the National Diet Investigation Commission“), the Investigation Committee on the Accident at the Fukushima Nuclear Power Stations of Tokyo Electric Power Company (hereinafter, "the Government Investigation Committee"), the Independent Investigation Commission on the Fukushima Nuclear Accident (hereinafter, "the Nongovernmental Investigation Committee"), and the TEPCO Fukushima Nuclear Accident Investigation Committee (hereinafter, "TEPCO Investigation Committee"), respectively. Moreover, the then Nuclear and Industrial Safety Agency (NISA) also collected and arranged facts and causes on the occurrence of the accident and its propagation in sequence, and then compiled the results of related technical examinations. These accident investigation reports above-mentioned summarize the basic situation and propagation of the nuclear accident. However, there still remain not a few technical issues that need conclusive
2
evidence and time, but the restriction of site accessibility still limits further efforts because of extensive damage and high level of radiation at the Fukushima Daiichi NPS.
1.2 Aim of the Report
Among the various issues and unexplained issues raised in the reports by the National Diet
Investigation Commission, the Government Investigation Committee, the Nongovernmental Investigation Committee, and TEPCO Investigation Committee, the NRA has selected the unexplained issues that the National Diet Investigation Commission requires regulatory bodies to conduct empirical investigations and examinations of those issues with sufficient evidences, and then report its views. This report is the first one, and THE NRA continues to submitting report with the progress of the investigation and review.
2. Review by the Nuclear Regulation Authority 2.1 Issues Addressed in the Review
Next Issues (1) to (6) are outstanding unexplained issues that the National Diet Investigation
Commission required regulatory bodies to conduct empirical investigations. The issues below are all abstracted from the report issued by the National Diet Investigation Commission.
Note that the data in parenthesis after each issue refer to the relevant page and item in the National Diet Investigation Commission report, while the information in brackets indicates the related chapter in this report.
(1) It is thought that the earthquake ground motion from the earthquake was strong enough to
cause damage to some key safety facilities, because very few of the seismic back checks against the design basis earthquake ground motions and anti-seismic reinforcement works had been done. (P.207, 2.2-1)
(2) A small-scale LOCA, from small through-wall crack(s) in the piping and a subsequent leak
of coolant, would not noticeably affect the variations in the water level or pressure of a reactor. If this kind of small-scale LOCA were to remain uncontrolled for 10 hours or so, tens of tons of coolant would be lost, leading to core damage or core melt. (P207, 2.2-2) [3.1 Possibility of Small-scale Coolant Leaks in Unit 1]
(3) The government-run investigation committee’s interim report, NISA’s “Technical
Findings,” and TEPCO’s interim report all concluded that the loss of emergency AC power “was caused by flooding from the tsunami.” TEPCO’s report says the first wave of the
3
tsunami reached the site at 15:27 and the second at 15:35. However, these are not the times of when the tsunami waves actually reached the plant. This suggests that at least the loss of emergency AC power supply A at Unit 1 might not have been caused by flooding. (P207, 2.2-3) [3.2 Functional Loss of Emergency Power System A of Unit 1]
(4) Several TEPCO vendor workers working on the fourth floor of the nuclear reactor building
at Unit 1 at the time of the earthquake witnessed a water leak on the same floor immediately after the occurrence of the earthquake. NAIIC believes that this leak was not due to water sloshing out of the spent fuel pool on the fifth floor. However, since we cannot go inside the facility and perform an on-site inspection, the source of the water leakage remains unconfirmed. (P207, 2.2-4) [3.3 Water Leak on the 4th Floor of the Reactor Building of Unit 1]
(5) The isolation condensers (A and B systems) of Unit 1 were automatically activated at 14:52,
but the operators of Unit 1 manually stopped both IC systems only 11 minutes later. TEPCO has consistently maintained that the explanation for the manual suspension was that “it was judged that reactor coolant temperature change rate could not be kept within 55 °C/ hour (100 °F/ hour), which was the benchmark provided by the operational manual. However, according to several control room operators directly involved in the manual suspension of IC who responded to NAIIC’s hearing investigation, they stopped IC to check whether coolant was leaking from IC and other pipes because the reactor pressure was falling rapidly. The operator’s explanations are reasonable and their judgment was appropriate, while TEPCO’s explanation does not make sense. (P.208, 2.2-5)
(6) There is a possibility that the SRV did not work in Unit 1. In this case, a small-scale LOCA
caused by the earthquake motion could have taken place in Unit 1. (P208, 2.2-6) [3.4 Possibility of Disabling Safety Relief Valve due to Small-scale LOCA in Unit 1]
Among the issues above, the NRA have selected and analyzed Issues (2) to (4) and (6), and
then compiled the results in this report. As for Issue (1), "very few of the seismic back checks against the design basis earthquake ground motions and anti-seismic reinforcement works had been done." is true. By the reason of this fact, however, the NRA cannot say "It is thought that the earthquake ground motion from the earthquake was strong enough to cause damage to some key safety facilities." It is valid to say "there is possibility that the earthquake ground motion from the earthquake might cause damage to some key safety facilities." Accordingly, in this report, the NRA decided to analyze only Issues (2) to (4) and (6), which addressed equipment damages. As for Issue (5), prior to its analyses, the NRA applied for information disclosure to the National Diet Library for accessing the National Diet Investigation Commission investigation testimony records and justified data since the records were archived by the National Diet Library. However, the National
4
Diet Library responded as follows: "This library is one of the organizations belonging to the National Diet of Japan and will not
disclose official information under the Freedom of Information Act: You can normally make freedom-of-information requests to read documents in this library according to "the National Diet Library Office Document Disclosure Rules,” but the requested documents of the National Diet Investigation Committee will not be disclosed because they fall under "documents related to lawmaking and investigations pertaining to lawmaking" to which the disclosure rules do not apply, and the lawmaking-related documents are not within the discretionary power of the director of this library who made the Rules." For this reason, the NRA could not have an access to any testimony records of the operators concerned for advancing the NRA’s analyses. In the future, when the documents are to be disclosed, the NRA will resume the activity.
The NRA has also analyzed the following unexplained issues in the National Diet Investigation
Commission report, and compiled the results. The issues below are all abstracted from the report submitted by the National Diet Investigation Commission. (Note that the data in parenthesis after each issue refer to the relevant page and item in the National Diet Investigation Commission report, while the information in brackets indicates the related chapter in the this report.)
(7) As for the IC isolation valve, there is no possible scenario proving the Government’s
Investigation Committee’s presumption that “for an unknown reason, the AC power kept working even after the loss of DC power.” (P.238 2.2-4 2)-c.) [3.5 Operating Status of the Isolation Condenser of Unit 1]
(8) Observation of the spent fuel pool after the explosion shows the possibility of substantial
damage to the fuel. What was the source of the massive amount of heat that caused intermittent water evaporation in the form of white smoke to come out of the pool? The white smoke was generated not only immediately after the hydrogen explosion but on both of the next two days. There was, therefore, the possibility of damaged fuel inside the pool causing temporary massive heat generation. If the pool was impacted from the hydrogen explosion, it is probable that the used and unspent fuel assemblies were moved closer together and became compressed against one another, creating a condition of criticality inside the pool.(P.244, 2.2-4 4)-b.) [3.6 Possibility of Criticality in SFP of Unit 3 and White Smoke from Unit 3]
(9) The exploded hydrogen could have come from Unit 3 as well as the Unit 4 spent fuel pool,
but no quantitative evaluation can be given at this stage. (P.245, 2.2-4 4)-c.) [3.7 Hydrogen Explosion in the Reactor Building of Unit 4]
5
2.2 Organization and Approach of the Review
For analyses of issues above, the NRA dispatched its staff members and other relevant specialist for the site investigation to the Fukushima Daiichi NPS and interviewed the persons concerned as needed. The NRA also asked the Japan Nuclear Energy Safety Organization (JNES, merged into the NRA in March 2014) to analyze the necessary matters. In addition, the NRA has been received the reports from TEPCO about their investigations. Note that the NRA received a report from TEPCO that they have no findings and data to overturn this report and will immediately release and report if they get the new facts through their investigation.
For analyses of issues above, the NRA established the review team on Accident Analysis of
Fukushima Daiichi Nuclear Power Station on March 27, 2013. The members of this team consisted of NRA commissioner, NRA staff, outside professionals, JNES staff, and Japan Atomic Energy Agency (JAEA) staff.
The NRA wishes to express its appreciation to all relevant persons for this analyses and the site
investigation. This report was prepared under the responsibility of the NRA.
6
3. Analytical Results, Discussion and Conclusion of the Review
3.1 Possibility of Small-scale Coolant Leaks in Unit 1
3.1.1 The Issue raised by the National Diet Investigation Commission
The National Diet Investigation Commission Report states: "The reactor pressure and water level record before the tsunami hit makes it obvious that a massive loss of coolant accident (LOCA) did not occur immediately following the occurrence of the earthquake."; However, it also states: "A small-scale LOCA, from small through-wall crack(s) in the piping and a subsequent leak of coolant, would not noticeably affect the variations in the water level or pressure of a reactor. If this kind of small-scale LOCA were to remain uncontrolled for 10 hours or so, tens of tons of coolant would be lost, leading to core damage or core melt."1
The Government Investigation Committee Report, on the other hand, states: "This does not go so far as to deny the possibility that a leakage of the size nearly equivalent to a leakage specified in the Operational Safety Program occurred with the RPV or its Peripherals in the period after the earthquake until the arrival of the tsunami. But at the very least it is natural to assume that damage which would impair the containment function of the RPV had not occurred." 2 3.1.2 Scope and Objectives of the Analysis
The NRA estimated the possibility of small-scale coolant leaks in Unit 1 between the earthquake occurrence and the tsunami arrival based on the following analyses of data and calculations:
(1) Pressure and water level in the reactor pressure vessel (RPV)
The NRA estimated the possibility of small-scale coolant leaks based on the measured pressure and water level in the RPV.
(2) Drain sump water level in the primary containment vessel (PCV)
The NRA estimated the possibility of small-scale coolant leaks based on the measured drain sump water level in the PCV.
(3) Pressure in the PCV
The NRA estimated the possibility of small-scale coolant leaks based on the measured pressure in the PCV. The NRA conducted analysis to evaluate the upward tendency of measured pressure and
1 The National Diet Investigation Commission Report (pp.207 to 208) 2 The Government Investigation Committee Final Report; Annex II-1-1 (p.9)

7
also compared the measured pressure with calculated pressure under the assumption of a leak rate that requires any safety measures, i.e. the leak rate defined as Limiting Conditions for Operation (LCO) (hereinafter, "the leak rate defined as LCO") 3.
(4) Alarming in the reactor building
The NRA estimated the possibility of coolant leaks into the reactor building based on judging whether alarms were sounded in the reactor building, and by checking the actual working conditions. 3.1.3 Summary Results and NRA’s Conclusion (1) Summary Results
As for the possibility of small-scale coolant leaks in Unit 1 between the earthquake occurrence and the tsunami arrival, the NRA concluded as follows, based on the pressure and water level of the RPV, the drain sump water level of the PCV, and the pressure in the PCV, etc. (For details, see Section 3.1.4):
- There was no such a coolant leak from the reactor pressure boundary that might expose and damage the core before the tsunami arrival.
- There was no coolant leak that might change the drain sump water level in the PCV. - In the evaluation of measured and calculated pressure in the PCV, the calculated pressure is
well reproduced the measured pressure under the assumption of no coolant leak from the reactor pressure boundary. Conversely, the calculated pressure deviated greatly from the measured pressure under the assumption of 0.23 m3/h of the leak rate defined as LCO. 0.23 m3/h of a leak rate of reactor coolant is equivalent to 2.0 mm2 for liquid-phase leaking portion, and 8.0 mm2 for a gas-phase leaking portion.
- No plant data indicating a steam leak from the reactor pressure boundary to the reactor building, e.g. alarm data, was found.
From these results, the NRA could not find any plant data indicating coolant leak from the
reactor pressure boundary between the earthquake occurrence and the tsunami arrival. Even if a coolant leak would have occurred, it could not be exceeding the leak rate defined as LCO.
(2) NRA's Conclusion
The National Diet Investigation Commission Report states: "A small-scale LOCA, from small through-wall crack(s) in the piping and a subsequent leak of coolant, would not noticeably affect the variations in the water level or pressure of a reactor. If this kind of small-scale LOCA were to remain uncontrolled for 10 hours or so, tens of tons of coolant would be lost, leading to core 3 Technical Specification of the Fukushima Daiichi NPS requires any safety measure when 0.23 m3/h of a leak rate
from unknown place is detected.
8
damage or core melt." The NRA could not find any plant data indicating coolant leak from the reactor pressure
boundary between the earthquake occurrence and the tsunami arrival. Even if a coolant leak would have occurred, it could not be exceeding the leak rate defined as LCO, as based on analytic calculations of pressure in the PCV. Even if a leak with the leak rate defined as LCO would have been left for 10 hours, the total amount of coolant leak is at most 2.3 m3 (= 2.3 tons), which is much less than "several tens of tons" pointed out by the National Diet Investigation Commission or 205 m3 of reactor coolant volume of Unit 1. Therefore, the NRA concluded that such a small quantity of coolant leak for 10 hours with other safety functions including power supply could not result in core damage. 3.1.4 Analytical Approach and Results
(1) Pressure and water level in the RPV The measured RPV pressure had changed between the earthquake occurrence and the tsunami
arrival as follows: - The pressure dropped to about 6.0 MPa after the reactor scram. - Then it rose and later quickly dropped below 5.0 MPa after the isolation condenser (IC) was actuated, followed by cyclic fluctuations in the range of about 6 to 7 MPa caused by IC actuation and stoppage operation[4](Fig.1.1).
Similarly, the RPV water level dropped immediately after the reactor scram, rose to the
original level, and then repeatedly fluctuated up and down in coincidence with IC actuation and stoppage operation [4](Fig. 1.2)
During this period, there was no such a coolant leak from the reactor pressure boundary that might expose and damage the core.
4 TEPCO Investigation Committee report, Attachment 6-1(5), June 2012

9
Figure 1.1 Behavior of RPV Pressure (including IC actuation and stop timing)
Figure 1.2 Behavior of RPV Water Level (including IC actuation and stop timing)
(2) Drain sump water level in the Primary Containment Vessel (PCV)
It was assumed that the water level of the drain sump on the drywell floor rises in case RPV coolant leaks. After the earthquake occurrence, the measured water level of the drain sump on the drywell floor was fluctuating (possibly caused by the sloshing of water due to the earthquake), but the center of the water fluctuation level remained the same level and the NRA could not find any increase in the water level (Fig. 1.3). When reactor coolant leaked over the leak rate (0.23 m3/h) defined as LCO, a leak alarm (connected to emergency power system) was designed to be output.

10
However, the NRA cannot confirm whether a leak alarm was issued or not. If a coolant leak occurred at such a leak rate (0.23 m3/h), it is expected that the water level of the floor drain sump would rise at a rate of about 7.5 cm/h and such behavior would be apparent on the water level behavior chart. However, the chart indicated no such increase in the water level. Although reactor coolant did not leak structurally into the equipment drain sump, the NRA checked the measured water level of the equipment drain sump and confirmed no increase rate (gradient) in its water level.
From these findings, the NRA estimated that there was no such coolant leak that could change
the water level of the drain sump from the RPV in that time period. However, if a very small amount of coolant leaking from the liquid phase fully evaporated and did not flow as liquid into the drain sump, a leak might not be detected. If gaseous coolant (i.e. steam evaporated from the liquid phase or steam from the gas phase) leaked from the RPV, it might increase the PCV pressure. The NRA analyzed further this point in the next Item (3) PCV pressure.
Figure 1.3 Water Levels of Drywell Floor Drain Sumps and Equipment Drain Sumps 5
5 TEPCO Investigation Committee Report, Attachment 6-1 (13)
Reference: Virtual value assuming a change (7.5 cm/h) in floor drain sump water level in case of the leak rate (0.23 m3/h) defined as LCO.

11
(3) PCV pressure
The measured PCV pressure had increased about 2.0 kPa from the earthquake occurrence to the tsunami arrival (Fig. 1.4). In addition, the "High PCV pressure (13.7 kPa)" alarm was not generated. 6
Figure 1.4 Behavior of PCV Pressure
The measured PCV pressure increased gradually and slightly after the earthquake occurrence
(Fig. 1-4). The NRA considered that it was appropriate to explain this behavior was caused by the fact: the PCV cooler stopped operation due to loss of the off-site power source that was caused by the earthquake; and heat radiated from the RPV increased PCV pressure. To verify this, the NRA analyzed how PCV pressure was changed by heat radiated from the RPV (Fig. 1.5). In this analysis, the NRA adopted a 0.02-MW heat source, extrapolating from the rate of estimated heat loss at the rated reactor operation. Further the NRA took into consideration of heat radiation from the PCV and the condensation of steam on the inner wall of the PCV, assuming that some structures (made of carbon steel and concrete) were situated between the PCV and the building.
The NRA consequently found that the calculated PCV pressure well reproduced the measured
pressure, unless coolant leaked from the reactor pressure boundary. Therefor the NRA estimated that the major factors contributed to the pressure increase in PCV (shown as measured pressure values) were heat radiated from the RPV and the functional loss of the PCV cooler.
6 The Government Investigation Committee Final Report, Annex II-1-1 (p.13)
0
1
2
3
4
5
6
7
8
9
13:55 14:09 14:24 14:38 14:52 15:07 15:21 15:36
PCV
pre
ssur
e (k
Pa)
Time
Occ
urre
nce
of e
arth
quak
e
Arr
ival
of t
suna
mi

12
Figure 1.5 Behavior of PCV Pressure after the Earthquake Occurred (assuming that the PCV contains a 0.02-MWt heat source
and the PCV cooler stopped when the earthquake occurred)
The NRA cannot judge whether micro leaks existed, even if we analyze measured pressure and
calculated pressure. Therefore, the NRA analyses concentrated on the behavior of calculated PCV pressures in comparison with the measured one in a coolant leak at the leak rate (0.23 m3/h) defined as LCO.
As the result of analysis, the calculated PCV pressure increased due to the leak above (0.23
m3/h) is much higher than the measured pressure around the tsunami arrival (about 55 minutes after the earthquake occurrence). The leak opening area equivalent to the leak rate of 0.23 m3/h is 2.0 mm2 for a leak from the liquid phase, and 8.0 mm2 for a leak from the gas phase.7
Judging from the above observation, the NRA estimated that even if a coolant leak would have occurred, it could not exceed a leak with the leak rate (0.23 m3/h) defined as LCO. 8
Note that even if a leak with the leak rate (0.23 m3/h) defined as LCO, is left for 10 hours, the total amount of coolant leak is at most 2.3 m3 (= 2.3 tons), which is much less than "several tens of tons" pointed out by the National Diet Investigation Commission or 205 m3 of reactor coolant volume of Unit 1. Therefore, the NRA concluded that such a small quantity of coolant leak for 10 hours, with the provision of other safety functions including power supply, could not challenge the core damage.
(4) Alarming in the reactor building
7 Calculated assuming reactor pressure of approx. 7 MPa in normal operation (By the way, the pressure of the Unit 1
remained in the range of 5 to 7 MPa even after the reactor scram caused by the earthquake.) 8 "Analysis of Reactor Water Level and Containment Vessel Pressure and Temperature by assuming small leakage
from a pipe connected to the Pressure Vessel" - "(2) Analysis of PCV pressure and temperature by MELCOR code" by JNES, and "Technical Workshop on TEPCO's Fukushima Daiichi NPP Accident Handouts" (July 2012)
0.1
0.105
0.11
0.115
0.12
0 10 20 30 40 50 60
測定値漏洩無し +熱源0.02MW (解析値)
2.0mm2液相 +熱源0.02MW(解析値)
8.0mm2気相 +熱源0.02MW (解析値)
時間(分)
格納容器圧力 (MPa・abs)
Measurement value
No leak + 0.02-MW heat source (analytic value)
2.0 mm2 leak from liquid phase + 0.02-MW heat source (analytic value)
8.0 mm2 leak from gas phase + 0.02-MW heat source (analytic value) PCV
pre
ssur
e (M
Pa・
abs)
Time (in minutes)

13
The process radiation monitoring system and the area radiation monitoring system would issue alarms in case coolant leaked from the reactor pressure boundary into the reactor building outside the PCV caused by an earthquake, because both DC and AC power supplies were available between the earthquake occurrence and the tsunami arrival. However, it was recorded that these alarms were not issued.9
At 14:47 (approximately when the earthquake occurred), the process computer received alarms
from the main stack radiation monitoring system and the standby gas treatment system (SGTS) exhaust radiation monitoring system. The chart of the main stack radiation monitoring system showed that the measured radiation level instantaneously exceeded the preset alarm level at about 14h:47m, and then dropped to the original level.10 In addition, "main steam pipe broken" and other alarm signals were output before and after the main steam isolation valve was closed. The NRA estimated that these alarm signals were issued due to the loss of external power source caused by the earthquake. The NRA could not find any increase in the steam rate or other symptoms due to the break in the main steam pipe.11
Judging from the above, the NRA estimated that alarms from the main stack radiation
monitoring system and the SGTS exhaust radiation monitoring system were actuated due to the loss of an external power, instead of an increasing spatial dose level due to the leak from the PCV or main steam pipe. The NRA could not find any other radiation-related alarms.
The NRA also confirmed that some operators were working in the reactor building from 18:30
to about 20:00 on March 11.12 Therefore, the NRA estimated that there was no such a steam leak that disturbed work in the reactor building.
In summary, the NRA could not find any plant data (such as alarm data) indicating a steam leak from the reactor pressure boundary to the reactor building before the tsunami arrival.
9 The Government Investigation Committee Final Report, Annex II-1-1 (p.10) 10 Results of hearing from TEPCO and data obtained from TEPCO 11 TEPCO Investigation Committee Report, Attachment 6-1(4)(1/3), June 2012 12 The Government Investigation Committee Final Report, Annex II-1-1, (p.15)

14
3.2 Functional Loss of Emergency Power System A of Unit 1
3.2.1 The Issue raised by the National Diet Investigation Commission
When struck by the Great East Japan Earthquake in 2011, the TEPCO Fukushima Daiichi NPS was disabled from receiving power from an external power supply. Consequently, the emergency diesel generator (D/G) of each reactor started automatically to cool each reactor and its spent fuel pool (SFP). After that the D/G, D/G seawater pump (DGSW pump), and power supply panel of Units 1 to 5 were disabled. These events shut down the water cooling system that was driven by the AC power supply.
As for the functional losses of these D/Gs, DGSW pumps, and power supply panels, the Government Investigation Committee report and TEPCO Investigation Committee report state that the first tsunami arrived at the Fukushima Daiichi NPS at about 15:27, and the second tsunami at about 15:35. Both reports show similar results in most parts with respect to the D/Gs, DGSW pumps, and power supply panels being flooded and submerged by the tsunami, and the emergency power systems of reactor units 1 to 5 consequently being disabled.13
The National Diet Investigation Commission Report conversely states: "All of these past reports took their data from the TEPCO report, which states that the first wave arrived at 15:27 and the second wave arrived at 15:35. However, it must be taken into account that these records were taken by a wave gauge that is located 1.5km off- shore." The report also points out: "It is likely that the second tsunami reached the ocean area near Unit 4 at around 15:37. It also took some time for the tsunami to move forwards and submerge the emergency power generation devices on the 10m high platform." Judging from the above, the report concludes: "The tsunami was not the cause of the loss of the power in system A of Unit 1, which occurred at 15:35 or 15:36 according to the NAIIC hearings." 14 In addition, the report states: "It is difficult to explain the fact that A system was shut down one or two minutes earlier than the B system at Unit 1 based on the behavior of the tsunami, even when the second wave arrived earlier than 15:37, considering layout of the emergency power generation devices."
Note that TEPCO explained that the tsunami arrival times above mentioned (about 15:27 for the first one and about 15:35 for the second) were timing when the tsunami waves passed by the wave gauge. 15 For an evaluation of the time when the tsunami waves struck the NPS premises, TEPCO analyzed the accuracy of a clock built in the wave gauge, photos showing the tsunami waves striking the NPS premises, and the plant data for evaluating the tsunami arrival time. Based
13 The Government Investigation Committee Interim Report (December 26, 2011) pp.90 & 91, The Government
Investigation Committee Final Report (July 23, 2012) pp.87 & 88, TEPCO Investigation Committee Report (June 20, 2012) Exhibit 2.
14 The National Diet Investigation Commission Report (July 5, 2012) II P.225 to P.227, II Reference Documents (pp.61 to 82)
15 Evaluation of the situation regarding the cores and containment vessels of Units 1 to 3 at the Fukushima Daiichi Nuclear Power Station, and examination of unsolved issues in propagation of the accident --- Progress Report No.1 (December 13, 2013)

15
on its analysis, TEPCO reported that the second tsunami wave arrived the NPS premises at the 15:36 level as determined from the photographing date and time recorded on the photos of flooded tanks at the height of O.P.+ 10 m, and the time when pumps at the height of O.P.+ 4 m ceased to function.
3.2.2 Scope and Objectives of the Analysis
The NRA estimated the timing and causes of the functional loss of emergency power system "A" of Unit 1 based on the following analysis of the data and calculations;
(1) Timing of the functional loss of emergency power system "A" The NRA identified the timing when the voltage of the relevant apparatus was lost
from newly provided data of the transient phenomena recorder of the emergency power apparatus.
(2) Cause of the functional loss of emergency power system "A"
The NRA estimated cause of the functional loss of emergency power system "A" based on the operating conditions, physical damage, and flooding state of circuit breakers and relays on the power supply panel in the field.
(3) Cause of the functional loss of emergency power system "A" preceded that of system "B"
The NRA estimated cause of the functional loss of emergency power system "A" preceded that of system "B" based on the layout and flooding state of the emergency power system apparatus in the field.
(4) Tsunami arrival time
The NRA estimated the tsunami arrival time to the NPS based on the record of the wave gauge and time/date data of photos showing the tsunami arrival.
3.2.3 Summary Results and NRA’s Conclusion
(1) Summary Results As for timing of the functional loss of emergency power system "A", its cause, and the tsunami
arrival time, the NRA concluded as follows: (For details, see 3.2.4.) 1) Timing of the functional loss of emergency power system "A" - From newly provided data of the transient phenomena recorder, the NRA confirmed that D/G
system "A" (D/G1A), D/G system "B" (D/G1B), and 6.9 kV standby high-voltage power supply panel "B" (M/C1D) retained voltage at least until 15:36:59, and that 6.9 kV standby high-voltage power supply panel "A" (M/C1C) lost voltage between 15:35:59 and 15:36:59.

16
2) Cause of the functional loss of emergency power system "A" - The NRA estimated that the functional loss of emergency power system "A" was caused by
voltage loss of the M/C1C. NRA estimated that the D/G1A power receiving circuit breaker was open because the D/G1A retained voltage when the M/C1C lost its voltage.
- From the results of the site investigation (shown next), the NRA can hardly assume that the earthquake tripped the D/G1A power receiving circuit breaker.
- The NRA could not find any burnt portion, thermal damage, and other physical damage on the M/C1C. Therefore, the NRA estimated that the M/C1C experienced no bus short-circuit or ground fault.
- Moreover, the NRA could find no design condition that caused the D/G1A power receiving circuit breaker to open.
- In the site investigation, the NRA also found that the contacts in lower part of the M/C1C to open D/G1A power receiving circuit breaker was flooded. From the result, the NRA estimated that the contacts were short-circuited by flooding, and then the voltage of the M/C1C was lost by opening of the D/G1A power receiving circuit breaker.
- Accordingly, it is rational to estimate that the functional loss of the emergency power system "A" was caused by tsunami.
3) Cause of the functional loss of emergency power system "A" preceded that of system "B" - The M/C1D was located away from the equipment hatch through which the tsunami waves
came in comparison with the M/C1C, and also the structures (e.g., lavatory) and equipment were positioned in front of the M/CID. Therefore, the M/C1D was more protected than the M/C1C against direct flooding coming through the large equipment service entrance.
- In the site investigation, the NRA also found that the inundation height of the M/C1C to open the power receiving circuit breaker from the D/G is lower than M/C1D’s.
- Accordingly, it is rational to estimate that the M/C1C lost voltage earlier than the M/C1D when flooded by the tsunami. Note that the panel called "M/C1D" in the National Diet Investigation Commission report is actually the normal-use motor control center (MCC).
4) Tsunami arrival time - It is estimate that Tsunami 2-216 passed by the wave gauge from 15:34:50 to 15:34:56,
reached the crook of the south breakwater from 15:35:56 to 15:36:12, and then completely inundated area around the ventilation system stack of the turbine building at the O.P. + 10 m from 15:36:24 to 15:36:41. As the tsunami waves were presumed to strike the coastal areas of NPS almost at the same time, the NRA estimated that the area around the turbine building of Unit 1 (height: O.P. + 10 m) was inundated around 15:36:24 to 15:36:41.
- The time when the M/C1C, M/C1D, D/G1A, and D/G1B lost voltage was after the time when the area around the turbine building of Unit 1 where these equipment were installed was assumed to be inundated. This time roughly corresponds to the tsunami arrival time.
16 Tsunami observed at about 15:35 (recorded by the wave gauge) higher than the height of O.P.+ approx. 7.5 m See (4) 1).
17
(2) NRA's Conclusion
The National Diet Investigation Commission Report states: "The tsunami was not the cause of the loss of the power in system A of Unit 1," and " It is difficult to explain the fact that A system was shut down one or two minutes earlier than the B system at Unit 1 based on the behavior of the tsunami."
From the newly provided data of the transient phenomena recorder, the NRA estimated that emergency power system "A" lost its function from 15:35:59 to 15:36:59 due to the opening of the D/G1A power receiving circuit breaker.
Judging from the site investigation, the NRA could hardly assume that the earthquake caused the D/G1A power receiving circuit breaker to trip and open, but estimated that the contacts of circuit to open the D/G1A power receiving circuit breaker in lower part of the M/C1C were short-circuited by flooding and the circuit was actuated.
The location of M/C1D was more difficult to be flooded than the location of M/C1C and also the inundation height of the M/C1D to open the power receiving circuit breaker from the D/G is higher than the M/C1C’s. Accordingly, it is rational to presume that the M/C1C lost voltage earlier than the M/C1D due to the tsunami waves.
Note that the voltage loss time of the M/C1C roughly corresponds to the time when the premises of the turbine building of Unit 1 were flooded by tsunami waves.
In summary the NRA concluded that the cause of the functional loss of the emergency power system "A" was the flooding by the tsunami.
3.2.4 Analytical Approach and Results
(1) Timing of the functional loss of emergency power system "A" 1) Newly provided transient phenomena recorder data
After the National Diet Investigation Commission Report was disclosed, new observation data was found in the transient phenomena recorder: the data recorded periodically at one-minute intervals from 10:59:59 on March 3 to 15:36:59 on March 11, 2011 (when the tsunami was assumed to arrive at Fukushima Daiichi NPS) (Fig. 2.1).17,18
This data contains the D/G and M/C voltage values of both emergency power systems "A" and
"B" of Unit 1 that were collected periodically at one-minute intervals. Note that M/C1C was connected to D/G1A and M/C1D was connected to D/G1B. D/G and M/C voltage data were
17 TEPCO "Investigation and Examination of Fukushima Daiichi NPS Unit 1 power loss and isolation condenser" (May
10, 2013) 18 Plant Data of Fukushima Daiichi Nuclear Power Station at the time of the Great East Japan Earthquake (TEPCO
website)

18
collected at the M/C of each system and sent to the transient phenomena recorder. (Figs. 2.2 and 2.3)
Old data
Additional and newly
provided data
↑Earthquake ↑Tsunami Figure 2.1 Measurement Time Range of Newly Provided Transient Phenomena Recorder Data
Figure 2.2 Outline of Power Supplies to Transient Phenomena Recorder and Data Collecting Positions
Circuit breaker
Data recorded at 0.01-second intervals
Data recorded at one-minute intervals
3/11 14:42:03 3/11 15:17:02 3/11 15:36:59
6.9 kV bus 1C D/G 1A
Transient phenomena recorder
6.9 kV bus 1D D/G 1B
(Example) 480 V P/C 1D
・・・
・・・
Voltage data
M/C1D
M/C1C
D/G voltage
M/C voltage
Emergency AC power supply system “A”
Emergency AC power supply system "B"
D/G1A Power receiving circuit breaker
D/G voltage
M/C voltage
D/G1B Power receiving circuit breaker
(Example) 480 V Power Center (P/C) 1C
3/3 10:59:59

19
Turbine building of Unit 1, basement level 1 Turbine building of Unit 1, 1st floor
* The transient phenomena recorder was located on the 2nd floor of the service building
Figure 2.3 Layout of D/G1A, M/C1C, D/G1B, M/C1D, and Transient Phenomena Recorder
N
D/G1A
D/G1B
M/C1C
M/C1D

20
2) Newly provided data on emergency power systems
With the aide of the newly provided data of the transient phenomena recorder, the NRA found that D/G1A remained at about 6,950 V until 15:36:59 (data collecting time just before data measurement stopped) (Fig. 2.4). Conversely, M/C1C connected to D/G1A dropped its voltage to almost 0 V between 15:35:59 and 15:36:59, and was subsequently disabled to supply power (Fig. 2.5).
Figure 2.4 Behavior of D/G1A Voltage Value
Figure 2.5 Behavior of M/C1C Voltage Value
-10000
10002000300040005000600070008000
14:3
9:59
14:4
0:59
14:4
1:59
14:4
2:59
14:4
3:59
14:4
4:59
14:4
5:59
14:4
6:59
14:4
7:59
14:4
8:59
14:4
9:59
14:5
0:59
14:5
1:59
14:5
2:59
14:5
3:59
14:5
4:59
14:5
5:59
14:5
6:59
14:5
7:59
14:5
8:59
14:5
9:59
15:0
0:59
15:0
1:59
15:0
2:59
15:0
3:59
15:0
4:59
15:0
5:59
15:0
6:59
15:0
7:59
15:0
8:59
15:0
9:59
15:1
0:59
15:1
1:59
15:1
2:59
15:1
3:59
15:1
4:59
15:1
5:59
15:1
6:59
15:1
7:59
15:1
8:59
15:1
9:59
15:2
0:59
15:2
1:59
15:2
2:59
15:2
3:59
15:2
4:59
15:2
5:59
15:2
6:59
15:2
7:59
15:2
8:59
15:2
9:59
15:3
0:59
15:3
1:59
15:3
2:59
15:3
3:59
15:3
4:59
15:3
5:59
15:3
6:59
The D/G1A voltage remained at about 6,950 V until 15:36:59.
-1000
0
1000
2000
3000
4000
5000
6000
7000
8000
14:3
9:59
14:4
0:59
14:4
1:59
14:4
2:59
14:4
3:59
14:4
4:59
14:4
5:59
14:4
6:59
14:4
7:59
14:4
8:59
14:4
9:59
14:5
0:59
14:5
1:59
14:5
2:59
14:5
3:59
14:5
4:59
14:5
5:59
14:5
6:59
14:5
7:59
14:5
8:59
14:5
9:59
15:0
0:59
15:0
1:59
15:0
2:59
15:0
3:59
15:0
4:59
15:0
5:59
15:0
6:59
15:0
7:59
15:0
8:59
15:0
9:59
15:1
0:59
15:1
1:59
15:1
2:59
15:1
3:59
15:1
4:59
15:1
5:59
15:1
6:59
15:1
7:59
15:1
8:59
15:1
9:59
15:2
0:59
15:2
1:59
15:2
2:59
15:2
3:59
15:2
4:59
15:2
5:59
15:2
6:59
15:2
7:59
15:2
8:59
15:2
9:59
15:3
0:59
15:3
1:59
15:3
2:59
15:3
3:59
15:3
4:59
15:3
5:59
15:3
6:59
[V]
[V]
The M/C1C
voltage dropped
to almost 0 V at
15:36:59.

21
D/G1B voltage remained at about 6,950 V until 15:36:59 (Fig. 2.6). M/C1D voltage connected
to D/G1B also remained at about 6,950 V and was ready to supply power until 15:36:59 (Fig. 2.7).
Figure 2.6 Behavior of D/G1B Voltage Value
Figure 2.7 Behavior of M/C1D Voltage Value
Judging from the above observation, the NRA found that among D/G1A, M/C1C, D/G1B and
M/C1D, only M/C1C lost its voltage between 15:35:59 and 15:36:59, while the others (D/G1A, D/G1B and M/C1D) maintained their voltages until 15:36:59.
In summary, the NRA estimated that emergency power system "A" lost its function between 15:35:59 and 15:36:59 (when M/C1C lost its voltage). (2) Cause of the functional loss of emergency power system "A"
D/G1A maintained its voltage although M/C1C lost its voltage between 15:35:59 and 15:36:59. Therefore, the NRA estimated that the power receiving circuit breaker (Fig. 2.2) of D/G1A opened
-10000
10002000300040005000600070008000
14:3
9:59
14:4
0:59
14:4
1:59
14:4
2:59
14:4
3:59
14:4
4:59
14:4
5:59
14:4
6:59
14:4
7:59
14:4
8:59
14:4
9:59
14:5
0:59
14:5
1:59
14:5
2:59
14:5
3:59
14:5
4:59
14:5
5:59
14:5
6:59
14:5
7:59
14:5
8:59
14:5
9:59
15:0
0:59
15:0
1:59
15:0
2:59
15:0
3:59
15:0
4:59
15:0
5:59
15:0
6:59
15:0
7:59
15:0
8:59
15:0
9:59
15:1
0:59
15:1
1:59
15:1
2:59
15:1
3:59
15:1
4:59
15:1
5:59
15:1
6:59
15:1
7:59
15:1
8:59
15:1
9:59
15:2
0:59
15:2
1:59
15:2
2:59
15:2
3:59
15:2
4:59
15:2
5:59
15:2
6:59
15:2
7:59
15:2
8:59
15:2
9:59
15:3
0:59
15:3
1:59
15:3
2:59
15:3
3:59
15:3
4:59
15:3
5:59
15:3
6:59
[V]
[V]
D/G1B voltage remained
at about 6,950 V until
15:36:59.
M/C1D voltage remained
at about 6,950 V
until 15:36:59.

22
anytime between 15:35:59 and 15:36:59, and then analyzed its cause. 1) Possibility of the D/G1A power receiving circuit breaker being opened due to the earthquake
The National Diet Investigation Commission Report states: "NAIIC can presume that the earthquake not only affected diesel generators but also power supply systems, and that incidental heat generation would cause their outages."
NRA therefore checked for aftershocks around between 15:35:59 and 15:36:59. As a result, the NRA found five aftershocks having seismic intensity of 3 or higher that occurred in the Fukushima area in the time period from 15:30 to 15:40.19 Among these five aftershocks, four aftershocks were observed at a seismographic station near the Fukushima Daiichi NPS as earthquakes having seismic intensity of 1 to 2, with the remaining aftershock being observed as an earthquake having seismic intensity of 3. However, the aftershock having seismic intensity of 3 was observed at about 15:40, which was after the time when the emergency power systems lost their function. (Fig. 2.7)
The emergency power system had been working normally for 50 minutes after the main shock occurred and it is difficult to consider that this system was damaged by shaking of the seismic intensity of 1 to 2. Therefore, it is unlikely that the aftershock caused the D/G1A power receiving circuit breaker to open.
Time of quake
occurrence Maximum seismic intensity near
the Fukushima Daiichi NPS Observation point
Earthquake epicenter
15:31:32.4 Seismic intensity of 2 Futaba-machi Sinzan, etc. Off the coast of
Fukushima
15:33:15.7 Seismic intensity of 2 Futaba-machi Sinzan, etc. Off the coast of
Fukushima
15:35:24.5 Seismic intensity of 1 Okuma-machi Nogami, etc. Off the coast of
Ibaraki
15:36:34.2 Seismic intensity of 2 Futaba-machi Sinzan, etc. Off the coast of
Miyagi
15:40:49.7 Seismic intensity of 3 Okuma-machi Shimo-Nogami
Off the coast of Iwate
Table 2.1 Places in Fukushima where Earthquakes having Seismic Intensity of 3 or Higher were Observed between 15h:30m and
15h:40m
To examine the possibility of damage to M/C1C caused by the earthquake, the NRA
investigated M/C1C for thermal damage, physical damage, etc. in the site. As a result of opening the cabinet of M/C1C and visually checked the bus condition, the NRA
found no thermal or physical damage to the buses and their supporting insulators. (Fig. 2.8)
19 Website of the Japan Meteorological Agency (JMA) --- Seismic intensity database
23
The NRA also checked the M/C1C control circuits, circuit breakers, and circuit breaker insulators that were relatively easy to be damaged by earthquakes, but found no thermal or physical damage (e.g., burns) on those components. (Fig. 2.9)
The NRA therefore estimated that M/C1C did not cause such outages due to the effects of the earthquake, as was pointed out in the National Diet Investigation Commission report.

24
・ Photographing at position "A"
・Photographing at position "B"
Photographed by the Nuclear Regulation Authority (NRA) on May 15, 2014.
Figure 2.8 Buses and Bus-supporting Insulators inside M/C1C
T phase S phase
R phase S phase
R phase S phase
T phase
S phase
S phase R phase
T phase
Up
Cabinet number
Back
Left Right
Bus
Photographing position and direction
Down Front

25
①D/G1A
②CS pump 1A
③CS pump 1C
④M/C1D
⑤480V P/C1C
⑥ASW pump 1B
⑦CCSW pump 1A
⑧CCSW pump 1B
⑨No.1 pillar box
⑩Auxiliary
①D/G1A
②CS pump 1A
③CS pump 1C
④M/C1D
⑤480V P/C1C
⑥ASW pump 1B
⑦CCSW pump 1A
⑧CCSW pump 1B
⑨No.1 pillar box
⑩Auxiliary
*Each number indicates a cabinet number and each apparatus name indicates the destination in which the circuit breaker is
connected.
Photographed by the NRA on April 8, 2014.
(Photographed by the NRA on June 5, 2014 (10) Auxiliary.)
Figure 2.9 Inside View and Insulators in each M/C1C Cabinet
26
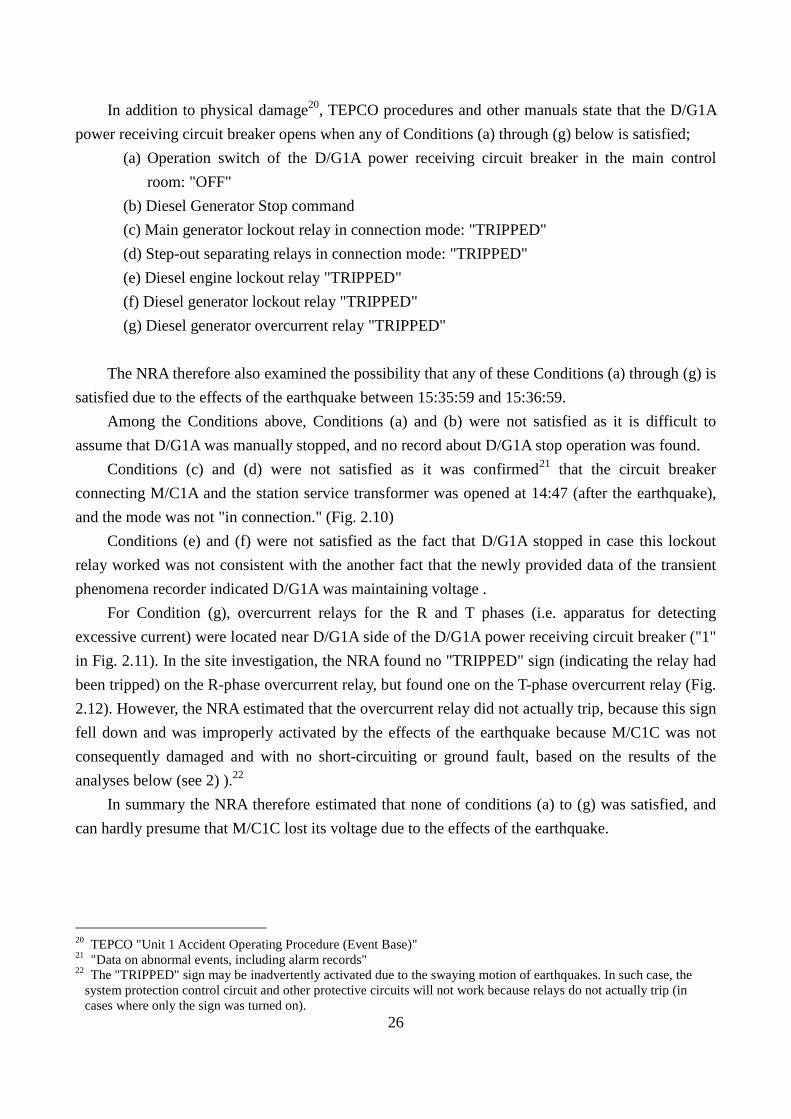
In addition to physical damage20, TEPCO procedures and other manuals state that the D/G1A
power receiving circuit breaker opens when any of Conditions (a) through (g) below is satisfied; (a) Operation switch of the D/G1A power receiving circuit breaker in the main control
room: "OFF" (b) Diesel Generator Stop command (c) Main generator lockout relay in connection mode: "TRIPPED" (d) Step-out separating relays in connection mode: "TRIPPED" (e) Diesel engine lockout relay "TRIPPED" (f) Diesel generator lockout relay "TRIPPED" (g) Diesel generator overcurrent relay "TRIPPED"
The NRA therefore also examined the possibility that any of these Conditions (a) through (g) is
satisfied due to the effects of the earthquake between 15:35:59 and 15:36:59. Among the Conditions above, Conditions (a) and (b) were not satisfied as it is difficult to
assume that D/G1A was manually stopped, and no record about D/G1A stop operation was found. Conditions (c) and (d) were not satisfied as it was confirmed21 that the circuit breaker
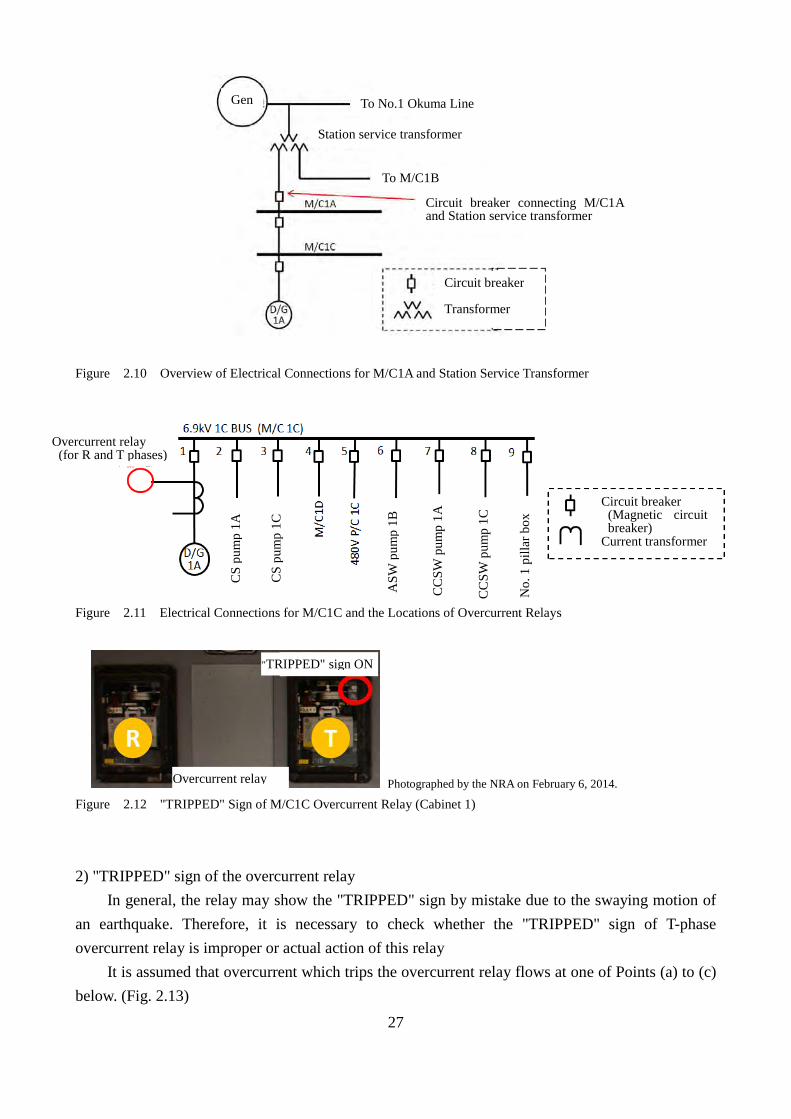
connecting M/C1A and the station service transformer was opened at 14:47 (after the earthquake), and the mode was not "in connection." (Fig. 2.10)
Conditions (e) and (f) were not satisfied as the fact that D/G1A stopped in case this lockout relay worked was not consistent with the another fact that the newly provided data of the transient phenomena recorder indicated D/G1A was maintaining voltage .
For Condition (g), overcurrent relays for the R and T phases (i.e. apparatus for detecting excessive current) were located near D/G1A side of the D/G1A power receiving circuit breaker ("1" in Fig. 2.11). In the site investigation, the NRA found no "TRIPPED" sign (indicating the relay had been tripped) on the R-phase overcurrent relay, but found one on the T-phase overcurrent relay (Fig. 2.12). However, the NRA estimated that the overcurrent relay did not actually trip, because this sign fell down and was improperly activated by the effects of the earthquake because M/C1C was not consequently damaged and with no short-circuiting or ground fault, based on the results of the analyses below (see 2) ).22
In summary the NRA therefore estimated that none of conditions (a) to (g) was satisfied, and can hardly presume that M/C1C lost its voltage due to the effects of the earthquake.
20 TEPCO "Unit 1 Accident Operating Procedure (Event Base)" 21 "Data on abnormal events, including alarm records" 22 The "TRIPPED" sign may be inadvertently activated due to the swaying motion of earthquakes. In such case, the
system protection control circuit and other protective circuits will not work because relays do not actually trip (in cases where only the sign was turned on).
27
Figure 2.10 Overview of Electrical Connections for M/C1A and Station Service Transformer
Figure 2.11 Electrical Connections for M/C1C and the Locations of Overcurrent Relays
Photographed by the NRA on February 6, 2014. Figure 2.12 "TRIPPED" Sign of M/C1C Overcurrent Relay (Cabinet 1)
2) "TRIPPED" sign of the overcurrent relay
In general, the relay may show the "TRIPPED" sign by mistake due to the swaying motion of an earthquake. Therefore, it is necessary to check whether the "TRIPPED" sign of T-phase overcurrent relay is improper or actual action of this relay
It is assumed that overcurrent which trips the overcurrent relay flows at one of Points (a) to (c) below. (Fig. 2.13)
Gen To No.1 Okuma Line
Station service transformer
To M/C1B
Circuit breaker connecting M/C1A and Station service transformer
Circuit breaker Transformer
Overcurrent relay (for R and T phases)
Circuit breaker (Magnetic circuit breaker)
Current transformer
CS
pum
p 1A
CS
pum
p 1C
ASW
pum
p 1B
CC
SW p
ump
1A
CC
SW p
ump
1C
No.
1 p
illar
box
"TRIPPED" sign ON
Overcurrent relay

28
Point “a”: Downstream load (pump, etc.) of M/C1C Point “b”: Upstream of the D/G1A power receiving circuit breaker Point “c”: Bus of M/C1C
Figure 2.13 Location of Points (a) to (c)
Regarding point (a), in case an overcurrent flows at downstream load in trouble, the T-phase
overcurrent relay on the downstream load side is assumed to activate. In the site investigation, the NRA could find no facts confirming that the T-phase overcurrent relay on the load side actually tripped. Accordingly, Point "a" can be excluded.
Regarding point (b), if short-circuiting occurs at upstream of the D/G1A power receiving
circuit breaker, the D/G1A voltage value is assumed to drop. Judging from the newly provided data of the transient phenomena recorder that showed D/G1A was maintaining voltage normally even after 15:35:59, the NRA estimated that no short-circuiting occurred there. Accordingly, Point "b" can be excluded.
Regarding point "c", there is possibility that a bus in M/C1C might be short-circuited or
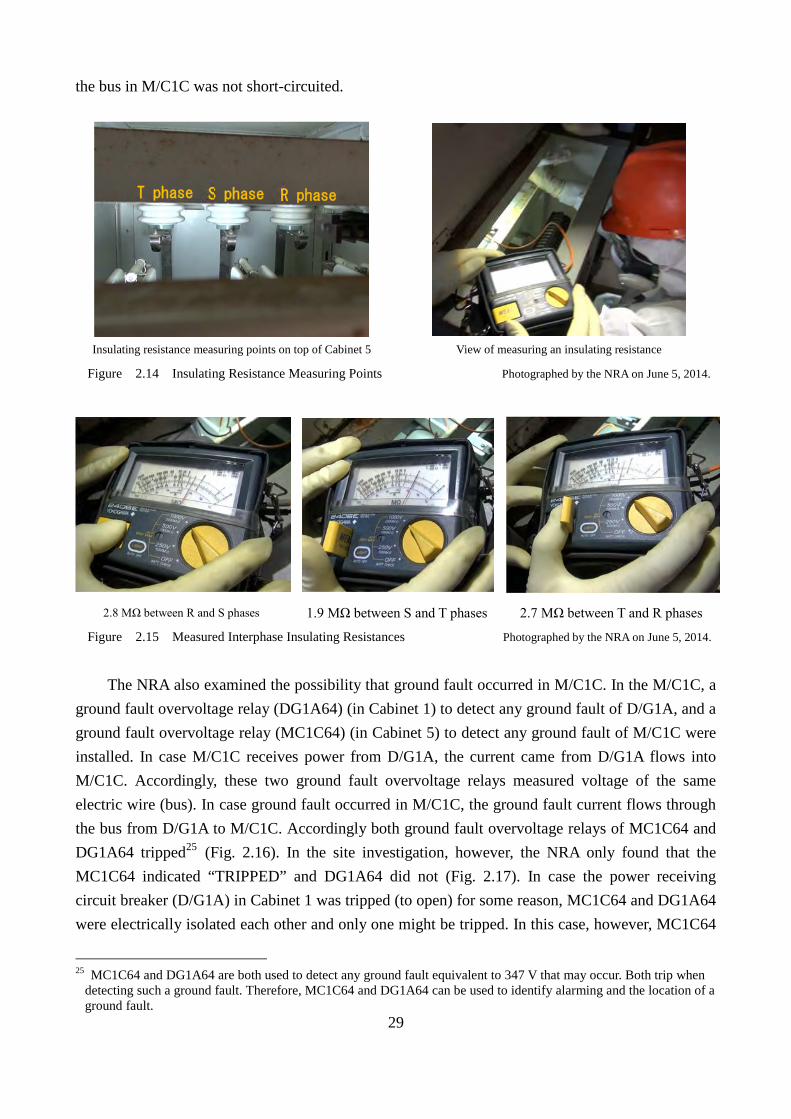
grounded, In the site investigation, the NRA measured the interphase insulating resistances of the R, S,
and T phases of the buses to examine whether the bus in M/C1C was short-circuited or grounded by the effects of the earthquake. 23 The measured interphase insulating resistances were 2.8 MΩ between the R and S phases, 1.9 MΩ between the S and T phases, and 2.7 MΩ between the T and R phases 24 (Figs. 2.14 and 2.15). The NRA staff opened the M/C1C cabinet and visually investigated the condition of the bus. The NRA could not find any thermal or physical damage of buses and bus supporting insulators (Fig. 2.8). Judging from the above, the NRA estimated that the R, S, and T phases of the bus were completely insulated from each other without any electrical contact, and that
23 Prior to the measurement of insulating resistance, we manually pulled down all circuit breakers in Cabinets 1
(D/G1A) to 9 (No. 1 pillar box) in order to open and disconnect the buses electrically from loads and grounding wires. 24 Applied voltage of 1000 V and measured at ambient temperature of 18.9ºC and 78% relative humidity.
Overcurrent relay (for R and T phases)
CS
pum
p 1A
CS
pum
p 1C
ASW
pum
p 1B
CC
SW p
ump
1A
CC
SW p
ump
1C
No.
1 p
illar
box
29
the bus in M/C1C was not short-circuited.
Insulating resistance measuring points on top of Cabinet 5 View of measuring an insulating resistance
Figure 2.14 Insulating Resistance Measuring Points Photographed by the NRA on June 5, 2014.
2.8 MΩ between R and S phases 1.9 MΩ between S and T phases 2.7 MΩ between T and R phases
Figure 2.15 Measured Interphase Insulating Resistances Photographed by the NRA on June 5, 2014.
The NRA also examined the possibility that ground fault occurred in M/C1C. In the M/C1C, a
ground fault overvoltage relay (DG1A64) (in Cabinet 1) to detect any ground fault of D/G1A, and a ground fault overvoltage relay (MC1C64) (in Cabinet 5) to detect any ground fault of M/C1C were installed. In case M/C1C receives power from D/G1A, the current came from D/G1A flows into M/C1C. Accordingly, these two ground fault overvoltage relays measured voltage of the same electric wire (bus). In case ground fault occurred in M/C1C, the ground fault current flows through the bus from D/G1A to M/C1C. Accordingly both ground fault overvoltage relays of MC1C64 and DG1A64 tripped25 (Fig. 2.16). In the site investigation, however, the NRA only found that the MC1C64 indicated “TRIPPED” and DG1A64 did not (Fig. 2.17). In case the power receiving circuit breaker (D/G1A) in Cabinet 1 was tripped (to open) for some reason, MC1C64 and DG1A64 were electrically isolated each other and only one might be tripped. In this case, however, MC1C64
25 MC1C64 and DG1A64 are both used to detect any ground fault equivalent to 347 V that may occur. Both trip when
detecting such a ground fault. Therefore, MC1C64 and DG1A64 can be used to identify alarming and the location of a ground fault.
R phase S phase T phase

30
lost power supply to the bus and did not have ground fault overvoltage. Therefore, the NRA could not presume that only MC1C64 tripped. Judging from these findings, the NRA estimated that MC1C64 did not actually trip, and that the "TRIPPED" sign was turned on after being dropped due to the earthquake. Therefore, the NRA estimated that ground fault did not occur in M/C1C.
In summary, the NRA estimated short-circuit or ground fault did not occur in M/C1C. Accordingly, Point "c" can be excluded.
Figure 2.16 Electrical Connections for MC1C64 and DG1A64
Photographed by the NRA on February 6, 2014
Figure 2.17 "TRIPPED" Sign of M/C1C Overvoltage Relay
As explained above, the NRA estimated that short-circuit or ground fault did not occur at
points "a" through "c" based on both the additional data of the transient phenomena recorder and the results of the site investigation. Therefore, the NRA estimated that no overcurrent had occurred and that the T-phase overcurrent relay had turned on the "TRIPPED" sign by mistake. 3) Possibility of M/C1C losing its voltage due to the tsunami
In case the contact "DG52A1" (1) and the contact "86YG1X" (2) are closed in the control circuit of the D/G1A power receiving circuit breaker, the current is flowed to a circuit breaker
Ground fault overvoltage relay
CS
pum
p 1A
CS
pum
p 1C
ASW
pum
p 1B
CC
SW p
ump
1A
CC
SW p
ump
1B
No.
1 p
illar
box
Ground fault
Circuit breaker (Magnetic circuit breaker)
Transformer Fuse
Grounding
"TRIPPED" sign OFF "TRIPPED" sign ON

31
tripped coil (TC) to open the D/G1A power receiving circuit breaker (Fig. 2.18). The contact "DG52A1" (1) is usually opened and no current flows, but when this contact is
flooded by seawater, this contact is assumed to pass current through the seawater. In the site investigation, the NRA checked its location and the possibility of flooding. The contact of M/C1C was located at a height of about 0.7 meter behind the front door of M/C1C. The height of flooding relative to M/C1C was about 1.0 meter. Accordingly, the NRA estimated that the contact was completely submerged in seawater by tsunami (Fig. 2.19).
The contact "86YG1X" (2) was closed and passed current when a turbine trip signal was output in connection mode and activated the main generator lockout relay "86G1." 26,27 In the site investigation for confirming the these relay’ operational condition, the NRA confirmed this relay was activated and the contact indicated its "ON" sign (Fig. 2.20).
As the contact "86YG1X" (2) was closed at the earthquake occurrence, the NRA estimated that when the contact "DG52A1" (1) was flooded, the current was flowed to auxiliary relay "DG52AX,"(3) and a close signal was sent to the contact "DG52AX"(4). As a result, the current consequently flowed through the TC and opened the D/G1A power receiving circuit breaker.
In order to verify whether the contact "DG52A1" (1) flooded with seawater would pass current, the NRA mocked up the wiring terminal portion of the contact and conducted a continuity test on the portion submerged in seawater. As a result, the NRA confirmed that current flowed via the wiring terminals in seawater.28 Auxiliary "DG52AX" (3) is composed of a voltage coil29 operating at 100 ~ 125V rating. In case the contact "DG52A1" (1) flooded with seawater, even taking into account the seawater resistance, the NRA estimated that the DC control power (DC125V) is supplied to the auxiliary relay, the current flows and the auxiliary relay “DG52AX” (3) is actuated (send the closing signal to the contact “DG52AX” (4)).
26 TEPCO‘s "Unit 1 Accident Operating Procedure (Event Base)" 27 A Turbine Trip signal was output in Connection mode when the earthquake occurred. (From TEPCO’s "data of alarm
records of Unit 1") 28 To simulate the operation of contacts when flooded, we prepared a wiring terminal model of the contact (with
terminals separated from each other by 20 mm), applied DC voltage of 2 to 7 V between the positive and negative electrodes (separated by 20 mm) submerged in seawater (sampled from the sea off Fukushima) at a seawater temperature of 27.3, and confirmed some milliamperes of current flowing through the contacts. The calculated electric resistance between the electrodes was about 17 to 39 .
29 100 ~ 125V rated voltage of “KA1-PD3” operating coil auxiliary relay, coil resistance 5350Ω

32
Figure 2. 18 D/G1A Control Circuit Diagram
Figure 2.19 Location of Control Circuit in the D/G Power Receiving Circuit Breaker, and Inundation Height
Control circuit of D/G1A-type power receiving circuit breaker
(1) Contact
(2) Contact
Contact closes (allowing current to flow).
Opens the circuit breaker
Central operation room Panel 922
Closes (allowing current to flow) by the Turbine Trip signal (due to the earthquake). Forms a circuit when flooded
Auxiliary relay Coil
Legend
Contact
Approx. 0.7 m Approx. 1.0 m
Inundation line
Inundation line
Approx. 0.9 m
Front door of the D/G1A power receiving circuit breaker
Front door of the D/G1B power receiving circuit breaker
Left: June 5, 2014; Right: February 7,2014 (Photographed by the NRA.)
(4) Contact
(3) Auxiliary relay

33
Photographed by the Nuclear Regulation Authority on April 7, 2014.
Figure 2.20 Main Generator Lockout Relay
As explained above, based on the results of analyses described in (2) 1) to3), the NRA
estimated that the voltage loss of M/C1C was not caused by the effects of the earthquake, but was caused in the following order: the contact "DG52A1" (1) was flooded with the tsunami; current passed through auxiliary relay "DG52AX;" the contact "DG52AX" closed, current passed through the TC; and the D/G1A power receiving circuit breaker tripped to open. (3) Cause of loss of emergency power system "A" preceded that of system "B"
The National Diet Investigation Commission Report states: "M/C1D was located closer than M/C1C to the large equipment service entrance through which the tidal waves were assumed to enter," and "M/C1C was located almost as high as M/C1D, so that both were inundated and lost their functions at almost the same time. Accordingly, the report states that it is very difficult to presume that only M/C1C was inundated and stopped first by the tsunami.
In the site investigation regarding the above, the NRA found that the cabinet referred to as M/C1D in the National Diet Investigation Commission Report was actually the normal-use MCC, and M/C1D was located behind this normal-use MCC (on its south side). M/C1D was located away from the large equipment service entrance through which the tsunami wave came in comparison with the M/C1C (Fig. 2.21). In addition, M/C1D was protected on its east side by certain structures (e.g., lavatory) and equipment against direct flooding coming through the large equipment service entrance (photos 1 to 5). And in the site investigation, the NRA also checked the heights of inundation. The inundation height of M/C1C and M/C1D were approx. 1.0 m and 0.9 m, respectively. From the above findings, the NRA estimated that the tsunami entered through the large equipment service entrance and struck M/C1C first, detoured around the normal-use MCC, and then reached M/C1D.
Note that both M/C1C and M/C1D were equipped with the same type of circuit breaker, and their buses (in the breaker ON state) were located at a height of about 0.9 m, but their respective
86YG1X
"TRIPPED" sign
ON (red mark)
86G1
Operating
position
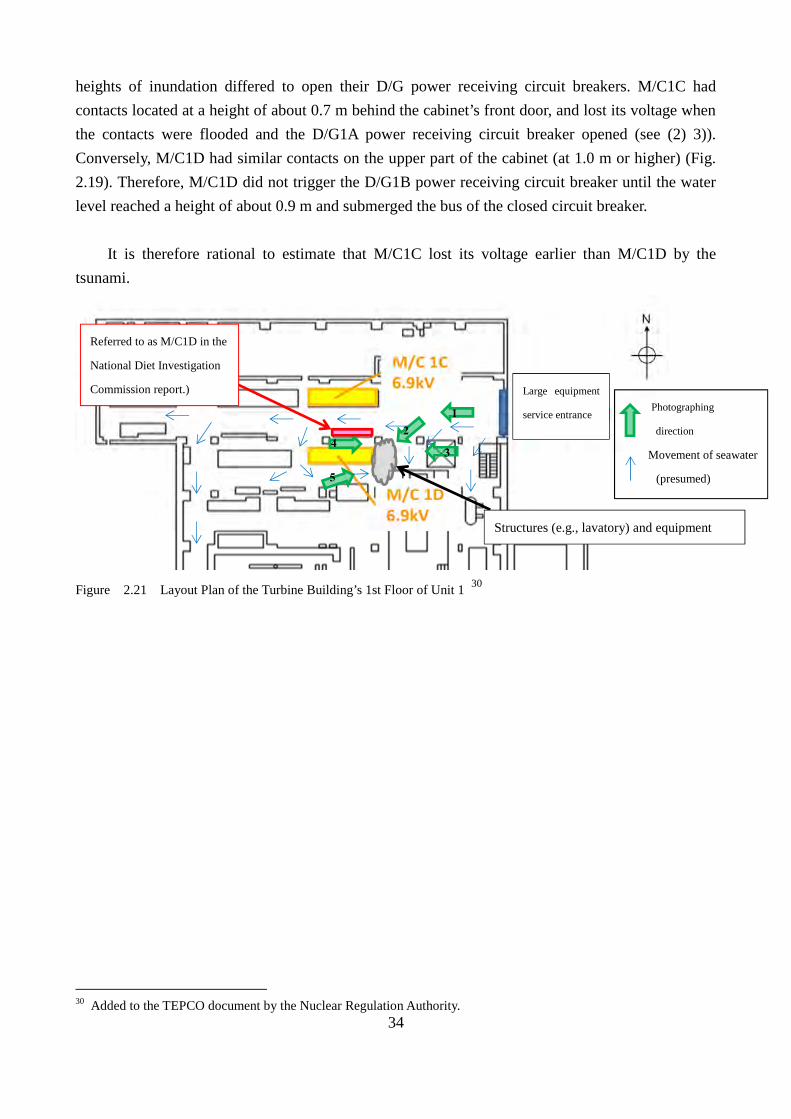
34
heights of inundation differed to open their D/G power receiving circuit breakers. M/C1C had contacts located at a height of about 0.7 m behind the cabinet’s front door, and lost its voltage when the contacts were flooded and the D/G1A power receiving circuit breaker opened (see (2) 3)). Conversely, M/C1D had similar contacts on the upper part of the cabinet (at 1.0 m or higher) (Fig. 2.19). Therefore, M/C1D did not trigger the D/G1B power receiving circuit breaker until the water level reached a height of about 0.9 m and submerged the bus of the closed circuit breaker.
It is therefore rational to estimate that M/C1C lost its voltage earlier than M/C1D by the tsunami.
Figure 2.21 Layout Plan of the Turbine Building’s 1st Floor of Unit 1 30
30 Added to the TEPCO document by the Nuclear Regulation Authority.
Photographing
direction
Movement of seawater
(presumed)
Structures (e.g., lavatory) and equipment
4
5
2 1
3
Referred to as M/C1D in the
National Diet Investigation
Commission report.) Large equipment
service entrance
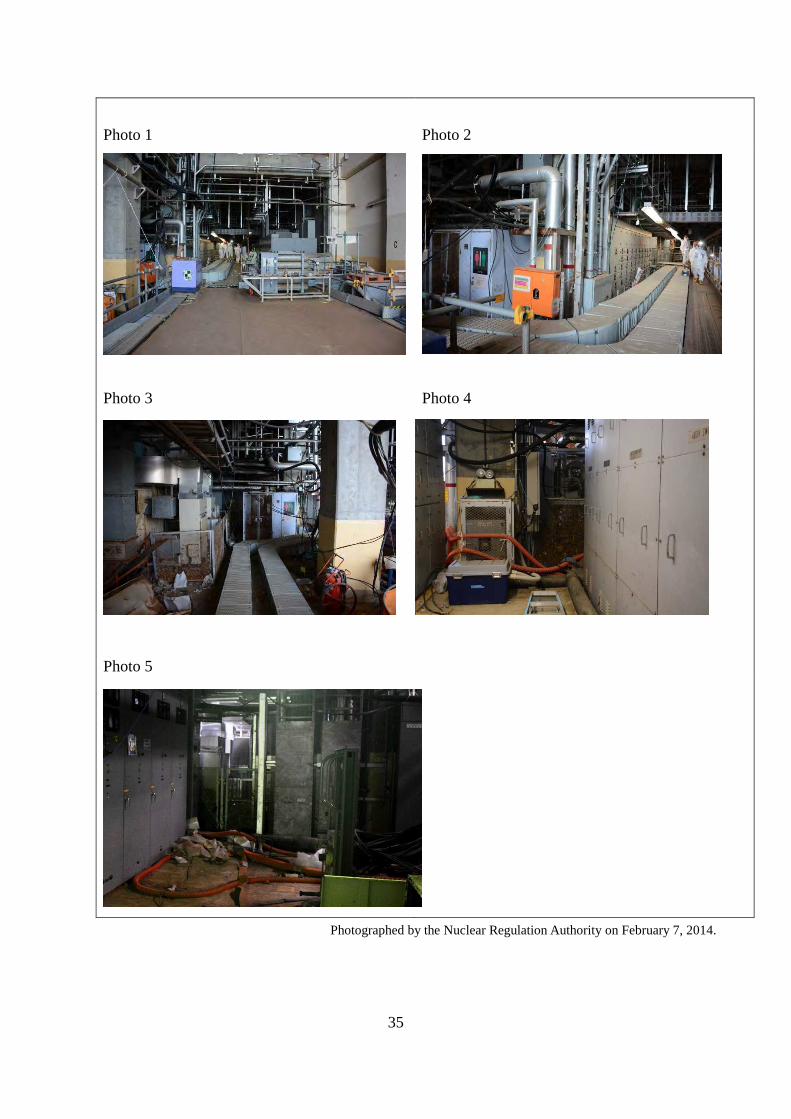
35
Photo 1
Photo 2
Photo 3
Photo 4
Photo 5
Photographed by the Nuclear Regulation Authority on February 7, 2014.
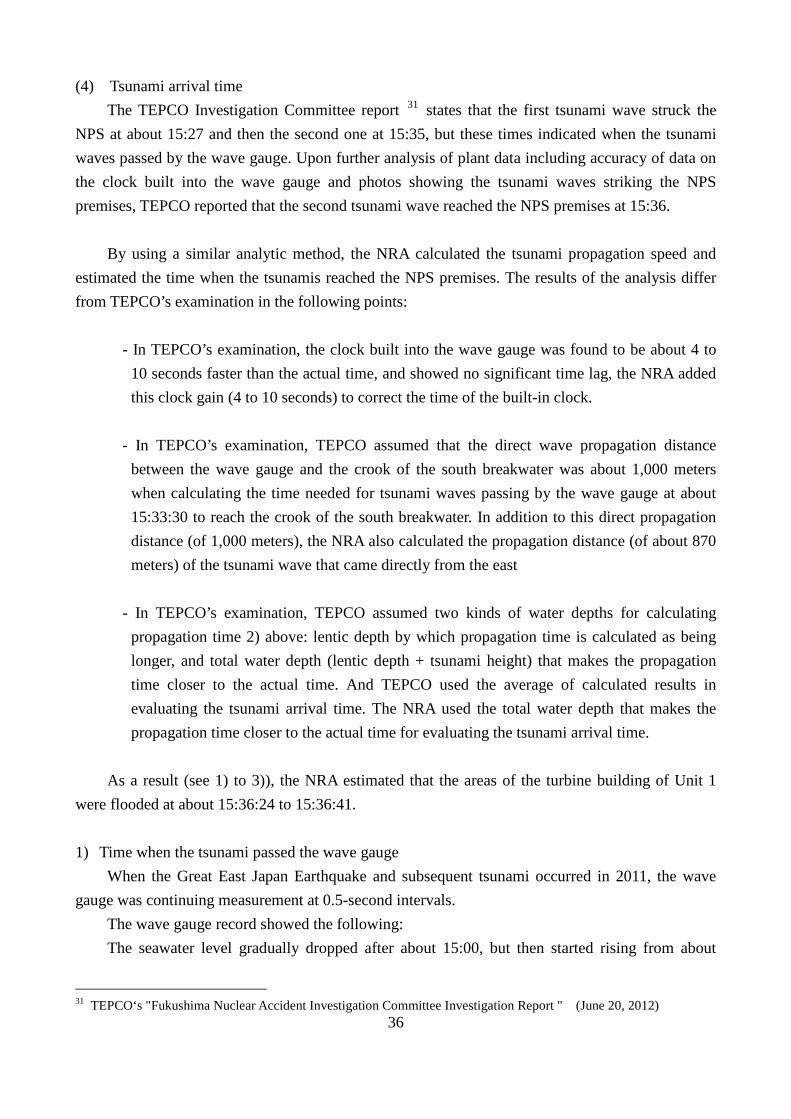
36
(4) Tsunami arrival time The TEPCO Investigation Committee report 31 states that the first tsunami wave struck the
NPS at about 15:27 and then the second one at 15:35, but these times indicated when the tsunami waves passed by the wave gauge. Upon further analysis of plant data including accuracy of data on the clock built into the wave gauge and photos showing the tsunami waves striking the NPS premises, TEPCO reported that the second tsunami wave reached the NPS premises at 15:36.
By using a similar analytic method, the NRA calculated the tsunami propagation speed and
estimated the time when the tsunamis reached the NPS premises. The results of the analysis differ from TEPCO’s examination in the following points:
- In TEPCO’s examination, the clock built into the wave gauge was found to be about 4 to
10 seconds faster than the actual time, and showed no significant time lag, the NRA added this clock gain (4 to 10 seconds) to correct the time of the built-in clock.
- In TEPCO’s examination, TEPCO assumed that the direct wave propagation distance
between the wave gauge and the crook of the south breakwater was about 1,000 meters when calculating the time needed for tsunami waves passing by the wave gauge at about 15:33:30 to reach the crook of the south breakwater. In addition to this direct propagation distance (of 1,000 meters), the NRA also calculated the propagation distance (of about 870 meters) of the tsunami wave that came directly from the east
- In TEPCO’s examination, TEPCO assumed two kinds of water depths for calculating
propagation time 2) above: lentic depth by which propagation time is calculated as being longer, and total water depth (lentic depth + tsunami height) that makes the propagation time closer to the actual time. And TEPCO used the average of calculated results in evaluating the tsunami arrival time. The NRA used the total water depth that makes the propagation time closer to the actual time for evaluating the tsunami arrival time.
As a result (see 1) to 3)), the NRA estimated that the areas of the turbine building of Unit 1
were flooded at about 15:36:24 to 15:36:41. 1) Time when the tsunami passed the wave gauge
When the Great East Japan Earthquake and subsequent tsunami occurred in 2011, the wave gauge was continuing measurement at 0.5-second intervals.
The wave gauge record showed the following: The seawater level gradually dropped after about 15:00, but then started rising from about
31 TEPCO‘s "Fukushima Nuclear Accident Investigation Committee Investigation Report " (June 20, 2012)

37
15:10 and reached the height of O.P.+ about 4 m at about 15:27 (Tsunami 1). The seawater level started dropping again, and then rapidly rose to the height of O.P.+ about 4.5 m at about 15:33:30 (Tsunami 2-1), and continued rising up to the height of O.P.+ approx. 7.5 m at about 15:35:00 (Tsunami 2-2). At this seawater level, the wave gauge became unstable and was disabled from measuring and recording seawater levels.32 (Figs. 2.22 and 23)
At that time, the wave gauge was undergoing replacement work and its built-in clock had yet to be calibrated. In comparison with time data stored in time-calibrated earthquake recorders, the NRA estimated that the time indicated by the built-in clock was 4 to 10 seconds ahead of Japan Standard Time (JST).
Figure 2.22 Water Level Record of the Wave Hlevel Meter
Figure 2.23 Location of the Wave Gauge, Distance between the Meter and the Premises, Breakwater Heights, etc.
32 TEPCO’s "Report on investigation results regarding tsunami generated by the Great East Japan Earthquake at the
Fukushima Daiichi and Daini Nuclear Power Stations (Vol. 2)" (July 8, 2011)
-2-1012345678
14:3
0:00
14:3
5:00
14:4
0:00
14:4
5:00
14:5
0:00
14:5
5:00
15:0
0:00
15:0
5:00
15:1
0:00
15:1
5:00
15:2
0:00
15:2
5:00
15:3
0:00
15:3
5:00
15:4
0:00
Wat
er le
vel (
O.P
.[m])
Tsunami 2-2
※Not considering any ground deformation
Approx.1.5 km
Approx. 1,000 m
Approx.870 m [m]
O.P.+10 m
O.P.+7 m
O.P.+6.5 m
O.P.+5 m
Crook of the south breakwater
N
North breakwater
South breakwater
East wave breaker
Tsunami 2-1
Tsunami 1
Wave Gauge

38
2) Tsunami propagation time between the wave gauge and crook of the south breakwater
The time needed for a tsunami to propagate from the wave gauge to the crook of the south breakwater depends on tsunami propagation speed (based on tsunami height and water depth) and distance (based on wave direction)
The tsunami propagation speed increases as the sum of the tsunami height and water depth increases. In addition, judging from photo 1, the tsunami wave (Tsunami 2-1) came almost directly from the east.33 In such case, the NRA estimated about 870m as the tsunami propagation distance34, about 74 seconds as the Tsunami 2-1 propagation time, and about 66 seconds as the Tsunami 2-2 propagation time.35
As the direction from which the tsunami came is not clear, the NRA also calculated the tsunami propagation time, assuming that the tsunami came from a distance that maximizes the propagation distance. In this case, the tsunami is assumed to have moved along a line connecting the wave gauge and the crook of the south breakwater (in the northwest direction). This distance is about 1,000 m. Therefore, the tsunami propagation times are about 85 seconds 36 for Tsunami 2-1 and about. 76 seconds 37 for Tsunami 2-2.
3) Time when NPS premises (height: O.P. + 10 m) were flooded by Tsunamis 2-1 and 2-2
The NRA calculated that Tsunami 2-1 passed over the crook of the south breakwater and was photographed (photo 1)38 between 15:34:34 and 15:34:51, by adding the tsunami propagation time to the above tsunami arrival time recorded by the wave gauge. Similarly, the NRA calculated that Photo 3 [showing the premises (height: O.P. + 10 m) and vast flooding of the main stack of the turbine building’s ventilation system] was taken between 15:36:24 and 15:36:41, as Photo 3 was taken about one minute, fifty seconds after Photo 1 was taken.
Since the tsunami waves came almost directly from the east, the NRA can presume that the
33 The tsunami apparently overwhelmed the northeast portion of the south breakwater more than the crook of the south
breakwater, as the southwest portion of the south breakwater was not struck by the tsunami. The north breakwater was also not struck by tsunami. Judging from this finding, we presumed that the tsunami came from the east.
34 See Fig. 2.23. 35 The propagation time of tsunami 2-2 was calculated by assuming a wave level of O.P.+ 7.5 m at the location of the
wave gauge. However, we presume that the propagation time was shorter as the actual wave height was assumed to be higher than O.P.+ 7.5 m.
36 In some cases, tsunami speed equation c = [g(h+H)]1/2 can be treated as roughly equivalent to c = (gh)1/2 when the height (H) of the tsunami above the average seawater level is sufficiently less than the water depth (h). However, this report does not use approximate tsunami speed equation c = (gh)1/2 as there is no remarkable difference between "h" and "H" in the area between the wave gauge and the vicinity of the breakwater. [The water depth (h) between the premises and the wave gauge was roughly in the range of 6 to 13 meters.]
The tsunami propagation time calculated by TEPCO (on October 7, 2013) for tsunami 2-1 to propagate from the wave gauge to the crook of the breakwater (1,000 m) is 85 seconds (when not approximated) or 106 seconds (when approximated).
37 The propagation time of tsunami 2-2 is the result of calculation assuming that the height was O.P.+ 7.5 m at the wave gauge location. However, the actual propagation time is assumed to be shorter as the actual tsunami height was higher than O.P.+ 7.5 m.
38 Photo taken 12 seconds after the photo showing the second tsunami reaching the head of the breakwater in the National Diet Investigation Commission report
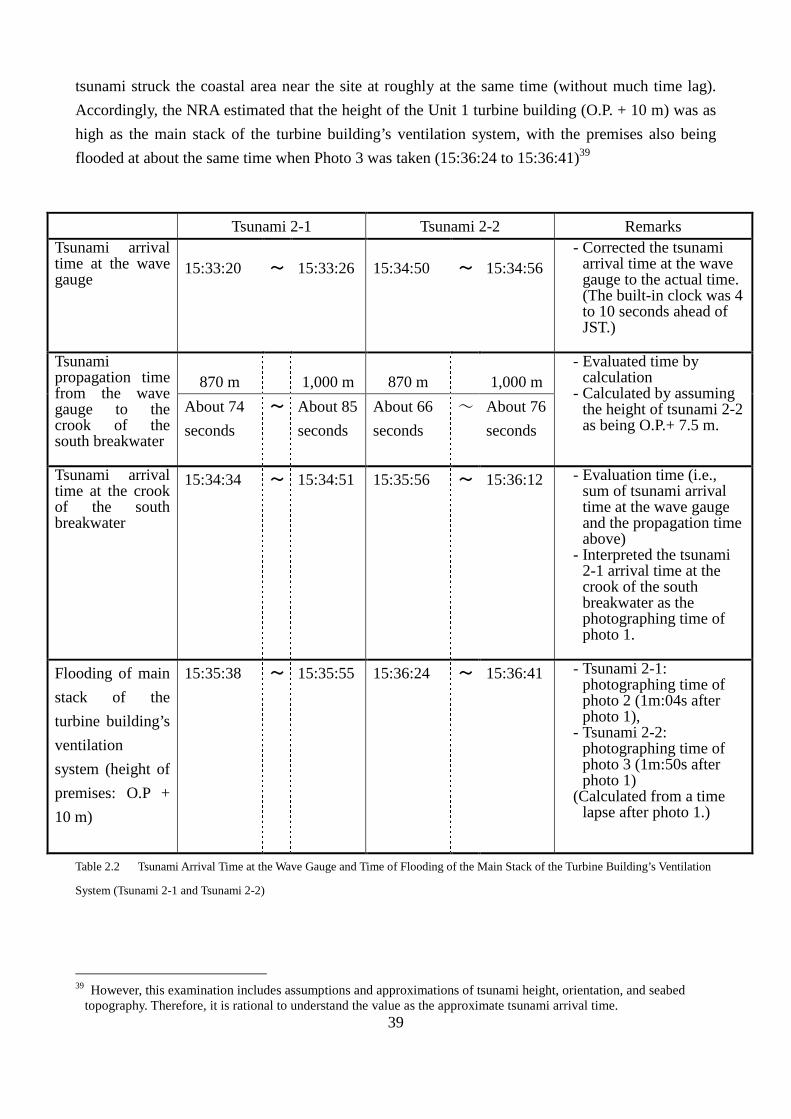
39
tsunami struck the coastal area near the site at roughly at the same time (without much time lag). Accordingly, the NRA estimated that the height of the Unit 1 turbine building (O.P. + 10 m) was as high as the main stack of the turbine building’s ventilation system, with the premises also being flooded at about the same time when Photo 3 was taken (15:36:24 to 15:36:41)39
Table 2.2 Tsunami Arrival Time at the Wave Gauge and Time of Flooding of the Main Stack of the Turbine Building’s Ventilation
System (Tsunami 2-1 and Tsunami 2-2)
39 However, this examination includes assumptions and approximations of tsunami height, orientation, and seabed
topography. Therefore, it is rational to understand the value as the approximate tsunami arrival time.
Tsunami 2-1 Tsunami 2-2 Remarks Tsunami arrival time at the wave gauge
15:33:20 ~ 15:33:26 15:34:50 ~ 15:34:56 - Corrected the tsunami
arrival time at the wave gauge to the actual time. (The built-in clock was 4 to 10 seconds ahead of JST.)
Tsunami propagation time from the wave gauge to the crook of the south breakwater
870 m 1,000 m 870 m 1,000 m - Evaluated time by
calculation - Calculated by assuming
the height of tsunami 2-2 as being O.P.+ 7.5 m.
About 74 seconds
~ About 85 seconds
About 66 seconds
~ About 76 seconds
Tsunami arrival time at the crook of the south breakwater
15:34:34 ~ 15:34:51 15:35:56 ~ 15:36:12 - Evaluation time (i.e., sum of tsunami arrival time at the wave gauge and the propagation time above)
- Interpreted the tsunami 2-1 arrival time at the crook of the south breakwater as the photographing time of photo 1.
Flooding of main stack of the turbine building’s ventilation system (height of premises: O.P + 10 m)
15:35:38 ~ 15:35:55 15:36:24 ~ 15:36:41 - Tsunami 2-1: photographing time of photo 2 (1m:04s after photo 1),
- Tsunami 2-2: photographing time of photo 3 (1m:50s after photo 1)
(Calculated from a time lapse after photo 1.)
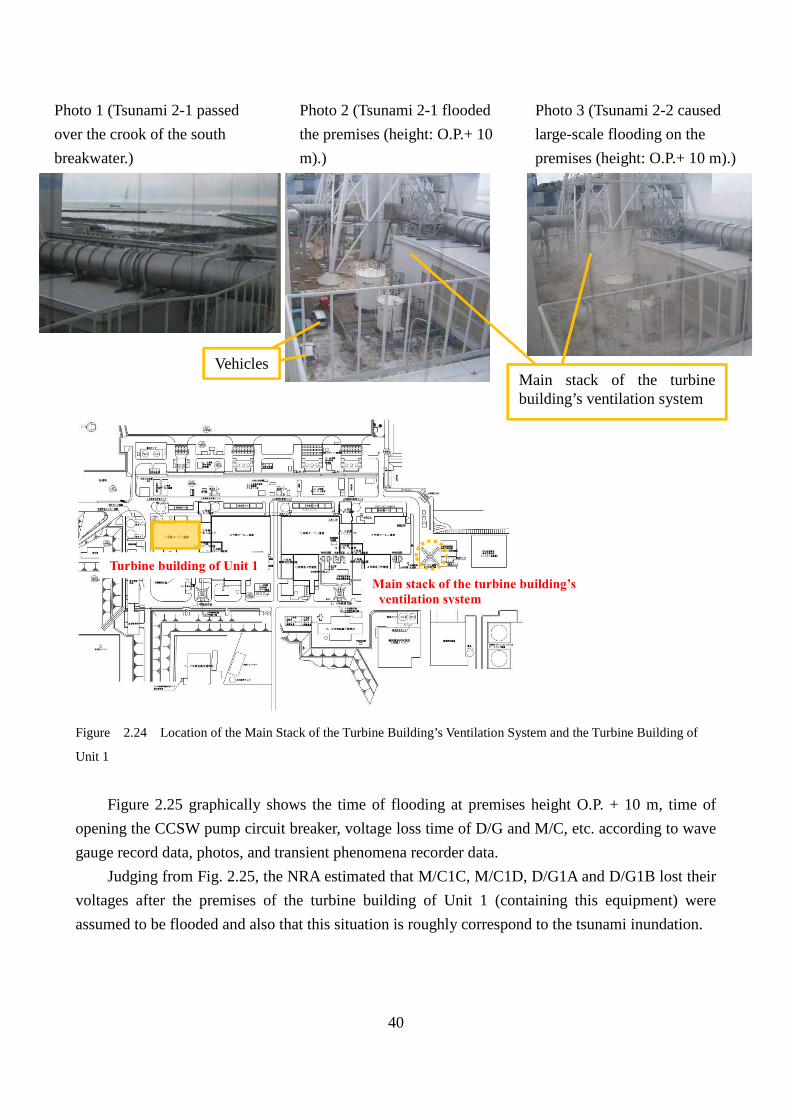
40
Photo 1 (Tsunami 2-1 passed over the crook of the south breakwater.)
Photo 2 (Tsunami 2-1 flooded the premises (height: O.P.+ 10 m).)
Photo 3 (Tsunami 2-2 caused large-scale flooding on the premises (height: O.P.+ 10 m).)
Figure 2.24 Location of the Main Stack of the Turbine Building’s Ventilation System and the Turbine Building of
Unit 1
Figure 2.25 graphically shows the time of flooding at premises height O.P. + 10 m, time of
opening the CCSW pump circuit breaker, voltage loss time of D/G and M/C, etc. according to wave gauge record data, photos, and transient phenomena recorder data.
Judging from Fig. 2.25, the NRA estimated that M/C1C, M/C1D, D/G1A and D/G1B lost their voltages after the premises of the turbine building of Unit 1 (containing this equipment) were assumed to be flooded and also that this situation is roughly correspond to the tsunami inundation.
Main stack of the turbine building’s ventilation system
Vehicles
Turbine building of Unit 1 Main stack of the turbine building’s ventilation system

41
15:3
3:00
15:3
4:00
15:3
5:00
15:3
6:00
15:3
7:00
15:3
8:00
15:3
9:00
40
41
Figure 2.25 Time-series Arrangement of Wave Gauge Record Data, Photos, and Transient Phenomena Recorder Data (Unit 1)
40 In the above chart of the time when tsunami 2-1/2-2 reached the crook of the south breakwater and the time when the
main stack of the turbine building’s ventilation system (height of premises: O.P.+ 10 m) was flooded, "" (a black solid circle) indicates the time when the tsunami came directly from the east (over a distance of about 870 m), and "" (a white solid circle) indicates the time when the tsunami covered the longest propagation distance of about 1,000 m.
41 Arrows in the above chart indicate that M/C1D, D/G1A, and D/G1B lost their voltage at 15:36:59 or later. As explained above, the data of the Unit 1 transient phenomena recorder showed that M/C1D, D/G1A, and D/G1B maintained their voltages just before the recorder data was lost (at 15:36:59). Therefore, we presume that M/C1D, D/G1A, and D/G1B lost their voltage at15:36:59 or later.
CCSW pumps (C & D) experienced electrical problems. (Height of premises: O.P.+ 4 m)
Tsunami 2-1 passed by the wave gauge.
Tsunami 2-1 reached crook of south breakwater
Tsunami 2-2 passed by the wave gauge.
Tsunami 2-1 flooded the main stack of the turbine building’s ventilation system (height: O.P. + 10 m).
Tsunami 2-2 reached the crook of the south breakwater.
Tsunami 2-2 vastly flooded the main stack of the turbine building’s ventilation system
(height: O.P. + 10 m).
The National Diet Investigation Commission presumed DG1A stopped based on the interview
M/C1D voltage loss (15h:36m:59s or later)
M/C1C voltage loss (15h:35m:59s to 15h:36m:59s)
"15h:37m D/G1B tripped" Daily report submitted by person on duty
Reference
Premises of the turbine building of Unit 1 was flooded
M/C1C containing circuit breakers for CCSW pumps (A & B) experienced electrical problems. (Height of premises: O.P.+ 10 m)
D/G1A voltage loss (15h:36m:59s or later) D/G1B voltage loss (15h:36m:59s or later)
42
3.3 Water leak on the 4th Floor of the Reactor Building of Unit 1
3.3.1 The Issue raised by the National Diet Investigation Commission
The National Diet Investigation Commission Report states: "Several TEPCO vendor workers working on the fourth floor of the nuclear reactor building at Unit 1 at the time of the earthquake witnessed a water leak on the same floor immediately after the occurrence of the earthquake."
As for this leak, the report states: "NAIIC believes that this leak was not due to water sloshing out of the spent fuel pool on the fifth floor. However, since we cannot go inside the facility and perform an on-site inspection, the source of the water leakage remains unconfirmed." Regarding this matter, the report also states: "TEPCO and NISA need to thoroughly investigate."
Note that this section focuses on the analysis of water leak on the 4th floor of the reactor
building of Unit 1, but does not examine overall issues of the isolation condenser (IC).
3.3.2 Scope and Objectives of the Analysis
The NRA estimated the water source and route of the water leak on the 4th floor of the reactor building of Unit 1 as follows:
(1) Situation of the water leak
The NRA interviewed the person who had been working on the 4th floor of the reactor building of Unit 1 (referred to as Mr. B in the National Diet Investigation Commission report and called "witness" in this report) about the situation on this floor when the water leak occurred.
The NRA estimated the situation of water leak on the 4th floor of the reactor building of Unit 1 by conducting a site investigation to check the content of the interview, e.g. water leaking point. (2) Identification of water leaking point, route, and source
The NRA narrowed down equipment that may be water leaking point, route, and water source from the situation at the water leak and the current situation based on the site investigation, and then identified possible water leaking points.
(3) Water leak mechanism
As for the possible water leaking points based on the result of the above-mentioned Item (1) and (2), the NRA examined the result of the site investigation in detailed.
The NRA estimated the water leak mechanism based on the results of the site investigations and numerical simulation of water leak.
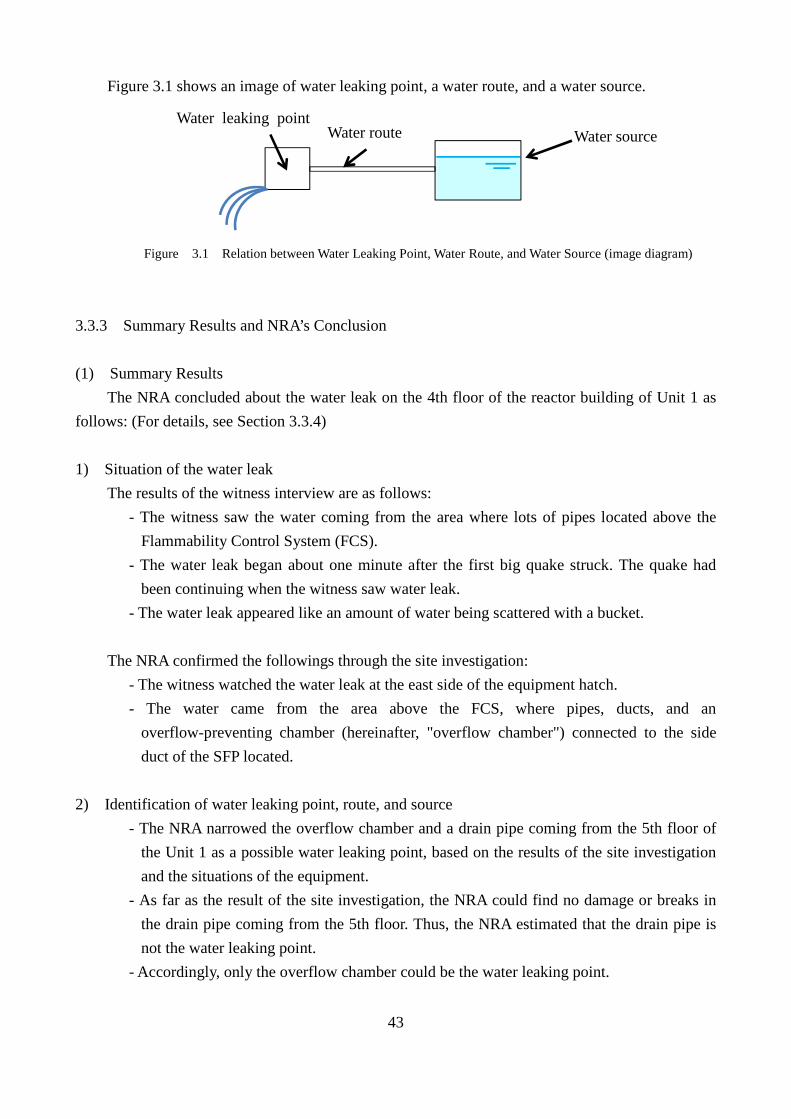
43
Figure 3.1 shows an image of water leaking point, a water route, and a water source.
Figure 3.1 Relation between Water Leaking Point, Water Route, and Water Source (image diagram)
3.3.3 Summary Results and NRA’s Conclusion
(1) Summary Results The NRA concluded about the water leak on the 4th floor of the reactor building of Unit 1 as
follows: (For details, see Section 3.3.4) 1) Situation of the water leak
The results of the witness interview are as follows: - The witness saw the water coming from the area where lots of pipes located above the
Flammability Control System (FCS). - The water leak began about one minute after the first big quake struck. The quake had
been continuing when the witness saw water leak. - The water leak appeared like an amount of water being scattered with a bucket.
The NRA confirmed the followings through the site investigation:
- The witness watched the water leak at the east side of the equipment hatch. - The water came from the area above the FCS, where pipes, ducts, and an
overflow-preventing chamber (hereinafter, "overflow chamber") connected to the side duct of the SFP located.
2) Identification of water leaking point, route, and source
- The NRA narrowed the overflow chamber and a drain pipe coming from the 5th floor of the Unit 1 as a possible water leaking point, based on the results of the site investigation and the situations of the equipment.
- As far as the result of the site investigation, the NRA could find no damage or breaks in the drain pipe coming from the 5th floor. Thus, the NRA estimated that the drain pipe is not the water leaking point.
- Accordingly, only the overflow chamber could be the water leaking point.
水源出水経路出水箇所Water leaking point
Water route Water source
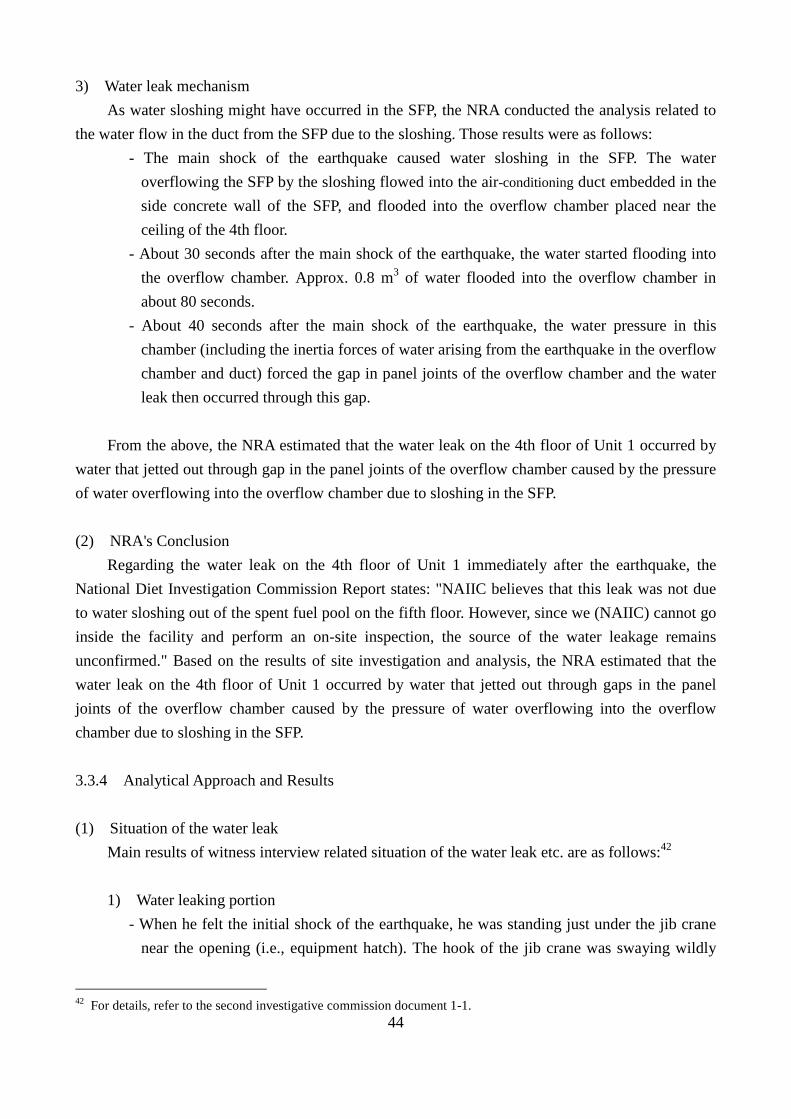
44
3) Water leak mechanism As water sloshing might have occurred in the SFP, the NRA conducted the analysis related to
the water flow in the duct from the SFP due to the sloshing. Those results were as follows: - The main shock of the earthquake caused water sloshing in the SFP. The water
overflowing the SFP by the sloshing flowed into the air-conditioning duct embedded in the side concrete wall of the SFP, and flooded into the overflow chamber placed near the ceiling of the 4th floor.
- About 30 seconds after the main shock of the earthquake, the water started flooding into the overflow chamber. Approx. 0.8 m3 of water flooded into the overflow chamber in about 80 seconds.
- About 40 seconds after the main shock of the earthquake, the water pressure in this chamber (including the inertia forces of water arising from the earthquake in the overflow chamber and duct) forced the gap in panel joints of the overflow chamber and the water leak then occurred through this gap.
From the above, the NRA estimated that the water leak on the 4th floor of Unit 1 occurred by
water that jetted out through gap in the panel joints of the overflow chamber caused by the pressure of water overflowing into the overflow chamber due to sloshing in the SFP.
(2) NRA's Conclusion
Regarding the water leak on the 4th floor of Unit 1 immediately after the earthquake, the National Diet Investigation Commission Report states: "NAIIC believes that this leak was not due to water sloshing out of the spent fuel pool on the fifth floor. However, since we (NAIIC) cannot go inside the facility and perform an on-site inspection, the source of the water leakage remains unconfirmed." Based on the results of site investigation and analysis, the NRA estimated that the water leak on the 4th floor of Unit 1 occurred by water that jetted out through gaps in the panel joints of the overflow chamber caused by the pressure of water overflowing into the overflow chamber due to sloshing in the SFP.
3.3.4 Analytical Approach and Results
(1) Situation of the water leak Main results of witness interview related situation of the water leak etc. are as follows:42
1) Water leaking portion
- When he felt the initial shock of the earthquake, he was standing just under the jib crane near the opening (i.e., equipment hatch). The hook of the jib crane was swaying wildly
42 For details, refer to the second investigative commission document 1-1.
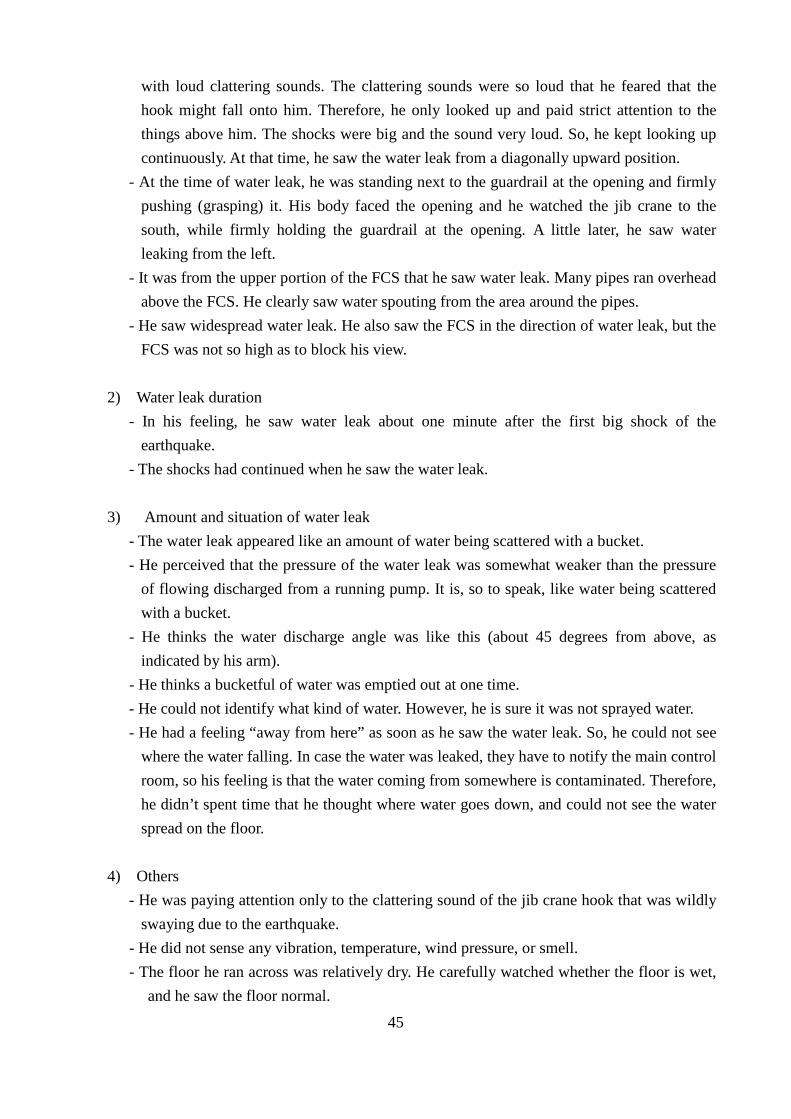
45
with loud clattering sounds. The clattering sounds were so loud that he feared that the hook might fall onto him. Therefore, he only looked up and paid strict attention to the things above him. The shocks were big and the sound very loud. So, he kept looking up continuously. At that time, he saw the water leak from a diagonally upward position.
- At the time of water leak, he was standing next to the guardrail at the opening and firmly pushing (grasping) it. His body faced the opening and he watched the jib crane to the south, while firmly holding the guardrail at the opening. A little later, he saw water leaking from the left.
- It was from the upper portion of the FCS that he saw water leak. Many pipes ran overhead above the FCS. He clearly saw water spouting from the area around the pipes.
- He saw widespread water leak. He also saw the FCS in the direction of water leak, but the FCS was not so high as to block his view.
2) Water leak duration
- In his feeling, he saw water leak about one minute after the first big shock of the earthquake.
- The shocks had continued when he saw the water leak.
3) Amount and situation of water leak - The water leak appeared like an amount of water being scattered with a bucket. - He perceived that the pressure of the water leak was somewhat weaker than the pressure
of flowing discharged from a running pump. It is, so to speak, like water being scattered with a bucket.
- He thinks the water discharge angle was like this (about 45 degrees from above, as indicated by his arm).
- He thinks a bucketful of water was emptied out at one time. - He could not identify what kind of water. However, he is sure it was not sprayed water. - He had a feeling “away from here” as soon as he saw the water leak. So, he could not see
where the water falling. In case the water was leaked, they have to notify the main control room, so his feeling is that the water coming from somewhere is contaminated. Therefore, he didn’t spent time that he thought where water goes down, and could not see the water spread on the floor.
4) Others
- He was paying attention only to the clattering sound of the jib crane hook that was wildly swaying due to the earthquake.
- He did not sense any vibration, temperature, wind pressure, or smell. - The floor he ran across was relatively dry. He carefully watched whether the floor is wet,
and he saw the floor normal.

46
As for Issue 1) above, based on the interview, the NRA confirmed the position of the witnesses
and the equipment position that could see from the witness’s position in the site investigation. As a result, the NRA could identify that witness was standing on the east side (marked "star" in Fig. 3.2) of the equipment hatch (opening) from the positional relationship between the opening, guardrail at the opening and jib crane. Moreover, the NRA estimated that the water leaking point was the vicinity of the overflow chamber above the FCS.
As for the positional relationship between the witness’s standing position and the equipment, the NRA confirmed that the actual layout of equipment was almost same the equipment seen by the witness just before and at the time of water leak (i.e. Equipment seen by witnesses just before the water leak: Opening and jib crane; Equipment seen by witnesses at the time of water leak: FCS and pipes above the FCS).
Note that what the NRA interviewed from the witnesses differs from the National Diet
Investigation Commission report in terms of certain points (e.g., situation of water leak). The reason for such differences has yet to be clarified as the NRA could not obtain details of the hearing from the witnesses interviewed by the National Diet Investigation Commission. After being interviewed, the witnesses told us: "I told the National Diet Investigation Commission the same things."
Figure 3.2 Standing Position of Witness when Water Leak came out
出水目撃者の立ち位置(出水目撃時)
溢水防止チャンバ
ジブクレーン
大物搬入口
MCC
FCS
IC
壁
撮影方向
N
EW
S
AB
C
D
仮設トイレ
足場(通路)
※IC: Isolation Condenser ※MCC: Motor Control Center ※FCS: Flammability Control System The witness was here
(when he saw flooding). Temporary lavatory
Wal
l
Equipment hatch (opening)
Jib crane Photographed in this direction
Overflow chamber Scaffolding (pathway)
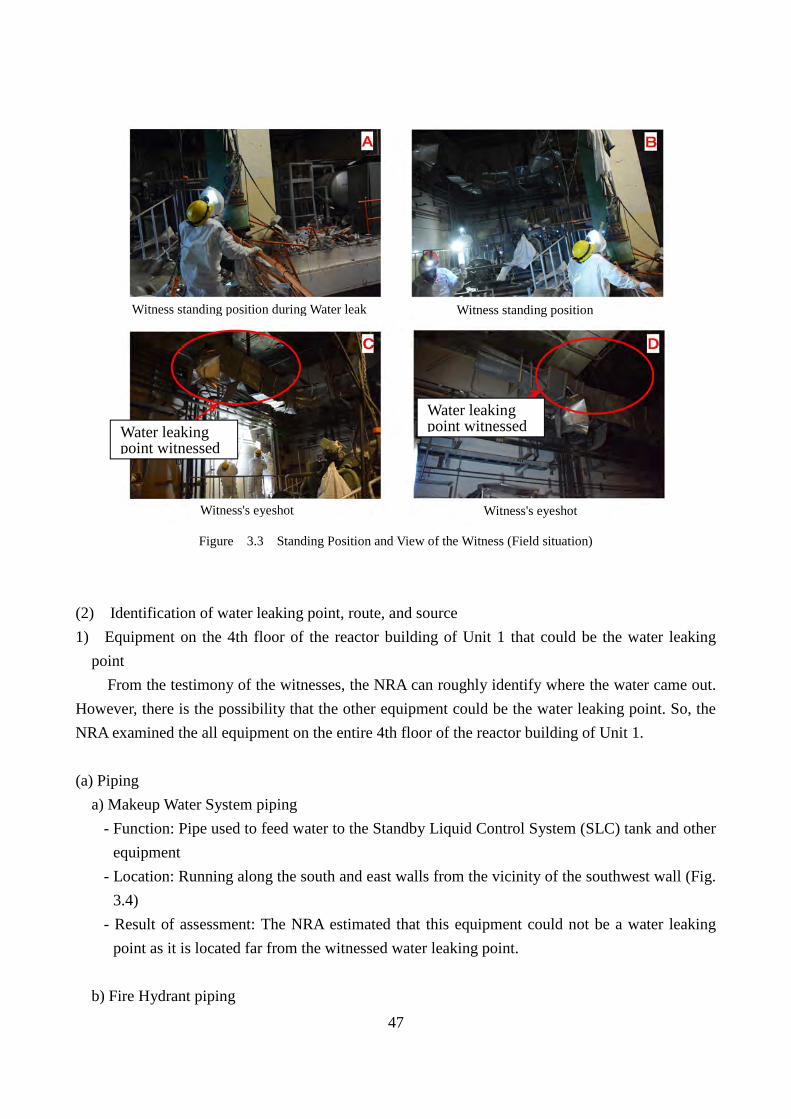
47
Figure 3.3 Standing Position and View of the Witness (Field situation)
(2) Identification of water leaking point, route, and source 1) Equipment on the 4th floor of the reactor building of Unit 1 that could be the water leaking
point From the testimony of the witnesses, the NRA can roughly identify where the water came out.
However, there is the possibility that the other equipment could be the water leaking point. So, the NRA examined the all equipment on the entire 4th floor of the reactor building of Unit 1. (a) Piping
a) Makeup Water System piping - Function: Pipe used to feed water to the Standby Liquid Control System (SLC) tank and other
equipment - Location: Running along the south and east walls from the vicinity of the southwest wall (Fig.
3.4) - Result of assessment: The NRA estimated that this equipment could not be a water leaking
point as it is located far from the witnessed water leaking point.
b) Fire Hydrant piping
Water leaking point witnessed
Witness standing position during Water leak Witness standing position
Witness's eyeshot
Water leaking point witnessed
Witness's eyeshot
48
- Function: Pipe used for supplying water to the fire hydrant system - Location: Located near the northwest wall and east wall (2 places) (Fig. 3.4) - Result of assessment: The NRA estimated that this equipment could not be a water leaking
point as it is located far from the witnessed water leaking point.
c) IC Vent piping - Function: Small-diameter pipe (19.05 mm in bore diameter) used for discharging steam from
the top of the primary IC system to the main steam pipe, in order to prevent the stagnation of non-condensable gas during normal operation that discharges steam generated in the RPV
- Location: Running from the IC in the west, located near the PCV, and on the west wall of the SFP (Fig. 3.4)
- Result of assessment: The NRA estimated that this equipment could not be a water leaking point although located near the witnessed water leaking point, as this steam discharge pipe never spouts water.
- Reference: If steam leaked from this pipe, the surrounding area would be misty and coupled with loud sounds of steam leaking. However, the witness said: "I was paying attention only to the clattering sound of the jib crane hook that was wildly swaying due to the earthquake (omitted). I did not sense any vibration, temperature, wind pressure, or smell." Judging from this testimony, The NRA estimated that there was no steam leak from the IC vent pipe when the witness saw water leak.
d) Water supply line for the secondary IC system (low pressure, normal temperature)
- Function: Pipe used for feeding water to the IC body - Location: The Makeup Water System line and Fire Hydrant line merge into this line on the 3rd
floor, and run to the IC from the 3rd floor along the 4th floor. - Result of assessment: The NRA estimated that this equipment could not be a water leaking
point as it is located far from the witnessed water leaking point.
e) High-pressure steam supply line for the primary IC system - Function: Pipe used for guiding steam to the IC from the RPV - Location: Running from the PCV to the 3rd floor, going up to the 4th floor and then down to
the connection port of the IC around the IC body from the top of the IC - Result of assessment: The NRA estimated that this equipment could not be a water leaking
point as it is located far from the witnessed water leak portion. Note that this steam delivery pipe is assumed to leak steam if broken. As the witness saw no steam (as per the interview result), the NRA estimated that this equipment could not be a water leaking point.
f) IC return piping (on the upstream side of the isolation valve outside the PCV)
- Function: Pipe used for returning water condensed from steam guided from the RPV to the IC,
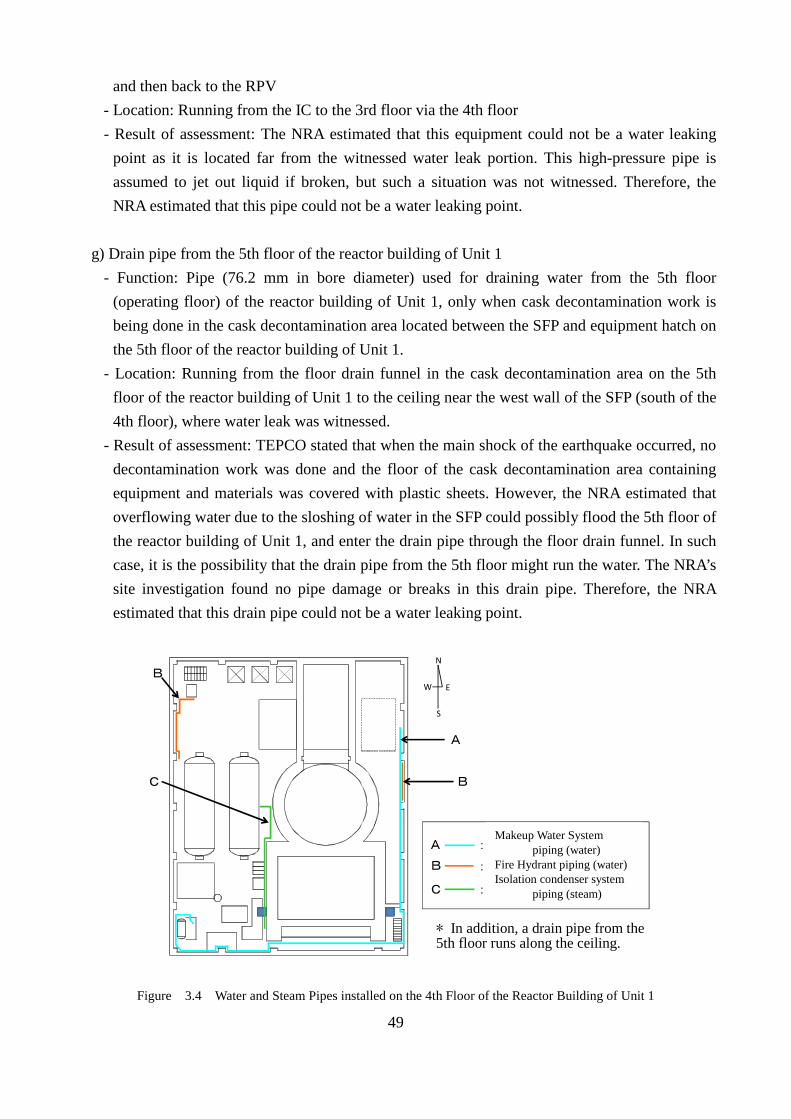
49
and then back to the RPV - Location: Running from the IC to the 3rd floor via the 4th floor - Result of assessment: The NRA estimated that this equipment could not be a water leaking
point as it is located far from the witnessed water leak portion. This high-pressure pipe is assumed to jet out liquid if broken, but such a situation was not witnessed. Therefore, the NRA estimated that this pipe could not be a water leaking point.
g) Drain pipe from the 5th floor of the reactor building of Unit 1
- Function: Pipe (76.2 mm in bore diameter) used for draining water from the 5th floor (operating floor) of the reactor building of Unit 1, only when cask decontamination work is being done in the cask decontamination area located between the SFP and equipment hatch on the 5th floor of the reactor building of Unit 1.
- Location: Running from the floor drain funnel in the cask decontamination area on the 5th floor of the reactor building of Unit 1 to the ceiling near the west wall of the SFP (south of the 4th floor), where water leak was witnessed.
- Result of assessment: TEPCO stated that when the main shock of the earthquake occurred, no decontamination work was done and the floor of the cask decontamination area containing equipment and materials was covered with plastic sheets. However, the NRA estimated that overflowing water due to the sloshing of water in the SFP could possibly flood the 5th floor of the reactor building of Unit 1, and enter the drain pipe through the floor drain funnel. In such case, it is the possibility that the drain pipe from the 5th floor might run the water. The NRA’s site investigation found no pipe damage or breaks in this drain pipe. Therefore, the NRA estimated that this drain pipe could not be a water leaking point.
Figure 3.4 Water and Steam Pipes installed on the 4th Floor of the Reactor Building of Unit 1
:復水補給水系配管(水)
:消火系配管(水)
:非常用復水器系配管(蒸気)
※他に天井部に5階からのドレン配管がある。
BN
EW
S
C
A
A
B
C
B
Makeup Water System piping (water)
Fire Hydrant piping (water) Isolation condenser system
piping (steam)
* In addition, a drain pipe from the 5th floor runs along the ceiling.
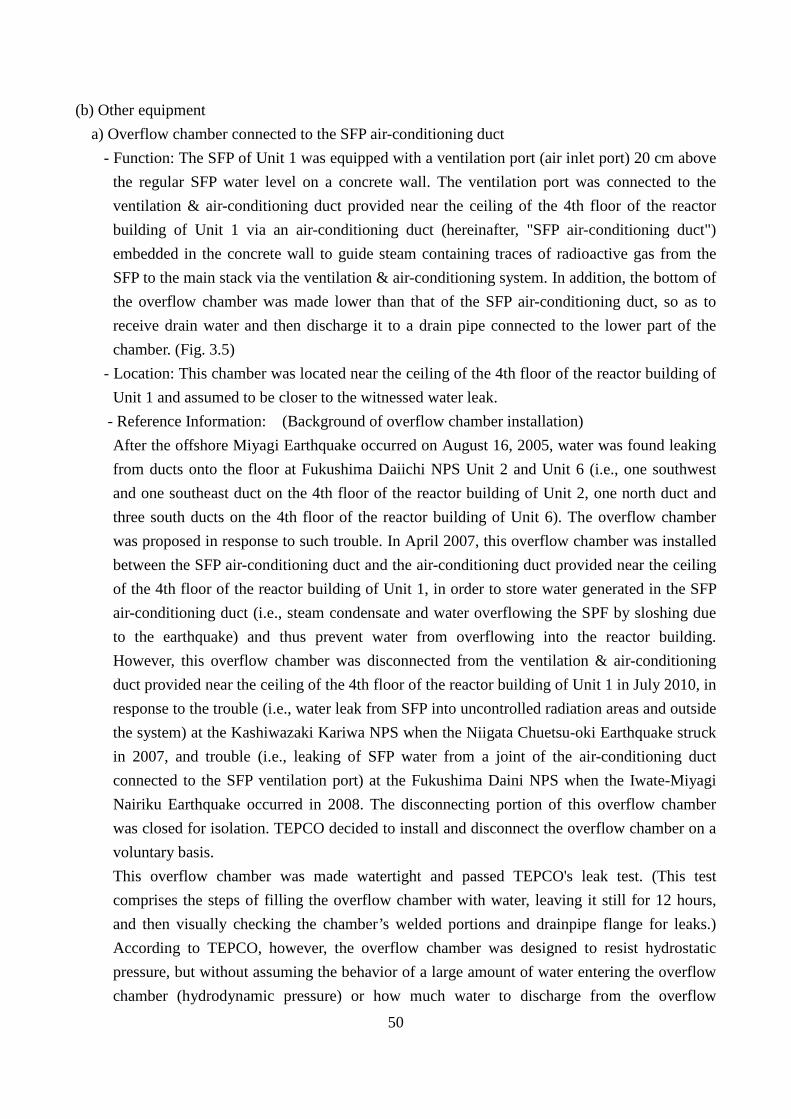
50
(b) Other equipment
a) Overflow chamber connected to the SFP air-conditioning duct - Function: The SFP of Unit 1 was equipped with a ventilation port (air inlet port) 20 cm above
the regular SFP water level on a concrete wall. The ventilation port was connected to the ventilation & air-conditioning duct provided near the ceiling of the 4th floor of the reactor building of Unit 1 via an air-conditioning duct (hereinafter, "SFP air-conditioning duct") embedded in the concrete wall to guide steam containing traces of radioactive gas from the SFP to the main stack via the ventilation & air-conditioning system. In addition, the bottom of the overflow chamber was made lower than that of the SFP air-conditioning duct, so as to receive drain water and then discharge it to a drain pipe connected to the lower part of the chamber. (Fig. 3.5)
- Location: This chamber was located near the ceiling of the 4th floor of the reactor building of Unit 1 and assumed to be closer to the witnessed water leak.
- Reference Information: (Background of overflow chamber installation) After the offshore Miyagi Earthquake occurred on August 16, 2005, water was found leaking from ducts onto the floor at Fukushima Daiichi NPS Unit 2 and Unit 6 (i.e., one southwest and one southeast duct on the 4th floor of the reactor building of Unit 2, one north duct and three south ducts on the 4th floor of the reactor building of Unit 6). The overflow chamber was proposed in response to such trouble. In April 2007, this overflow chamber was installed between the SFP air-conditioning duct and the air-conditioning duct provided near the ceiling of the 4th floor of the reactor building of Unit 1, in order to store water generated in the SFP air-conditioning duct (i.e., steam condensate and water overflowing the SPF by sloshing due to the earthquake) and thus prevent water from overflowing into the reactor building. However, this overflow chamber was disconnected from the ventilation & air-conditioning duct provided near the ceiling of the 4th floor of the reactor building of Unit 1 in July 2010, in response to the trouble (i.e., water leak from SFP into uncontrolled radiation areas and outside the system) at the Kashiwazaki Kariwa NPS when the Niigata Chuetsu-oki Earthquake struck in 2007, and trouble (i.e., leaking of SFP water from a joint of the air-conditioning duct connected to the SFP ventilation port) at the Fukushima Daini NPS when the Iwate-Miyagi Nairiku Earthquake occurred in 2008. The disconnecting portion of this overflow chamber was closed for isolation. TEPCO decided to install and disconnect the overflow chamber on a voluntary basis. This overflow chamber was made watertight and passed TEPCO's leak test. (This test comprises the steps of filling the overflow chamber with water, leaving it still for 12 hours, and then visually checking the chamber’s welded portions and drainpipe flange for leaks.) According to TEPCO, however, the overflow chamber was designed to resist hydrostatic pressure, but without assuming the behavior of a large amount of water entering the overflow chamber (hydrodynamic pressure) or how much water to discharge from the overflow
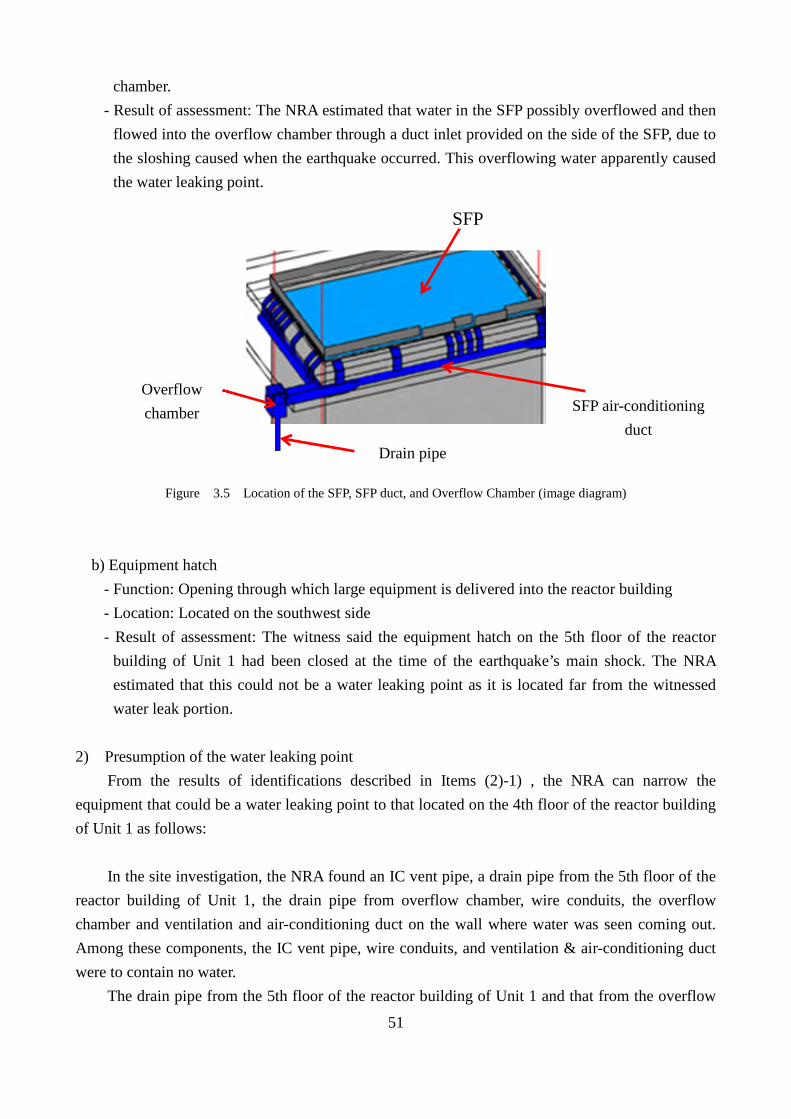
51
chamber. - Result of assessment: The NRA estimated that water in the SFP possibly overflowed and then
flowed into the overflow chamber through a duct inlet provided on the side of the SFP, due to the sloshing caused when the earthquake occurred. This overflowing water apparently caused the water leaking point.
Figure 3.5 Location of the SFP, SFP duct, and Overflow Chamber (image diagram)
b) Equipment hatch - Function: Opening through which large equipment is delivered into the reactor building - Location: Located on the southwest side - Result of assessment: The witness said the equipment hatch on the 5th floor of the reactor
building of Unit 1 had been closed at the time of the earthquake’s main shock. The NRA estimated that this could not be a water leaking point as it is located far from the witnessed water leak portion.
2) Presumption of the water leaking point
From the results of identifications described in Items (2)-1) , the NRA can narrow the equipment that could be a water leaking point to that located on the 4th floor of the reactor building of Unit 1 as follows:
In the site investigation, the NRA found an IC vent pipe, a drain pipe from the 5th floor of the
reactor building of Unit 1, the drain pipe from overflow chamber, wire conduits, the overflow chamber and ventilation and air-conditioning duct on the wall where water was seen coming out. Among these components, the IC vent pipe, wire conduits, and ventilation & air-conditioning duct were to contain no water.
The drain pipe from the 5th floor of the reactor building of Unit 1 and that from the overflow
SFP
SFP air-conditioning duct
Overflow chamber
Drain pipe

52
chamber were also designed to allow the possible flow of water. However, the NRA estimated that these drain pipes cannot be a water leaking point, as the NRA found no damage or breaks on those pipes in the site investigation.
The NRA therefore estimated that only the "overflow chamber" could have water leaked.
Figure 3.6 Pipe Layout near a Location where Water was seen coming out
(3) Water leak mechanism
From the assessment above-mentioned, the NRA estimated that the overflow chamber could have water leaked. And based on the site investigation and numerical analyses, the NRA estimated how the overflow chamber could have caused water leak. 1) Result of the NRA’s site investigation
The overflow chamber is a rectangular container having a welded bottom and top flange made by Steel Special Use Stainless (SUS), anchored with bolts and nuts.
The NRA found the following in the site investigation
- The upper portion of the overflow chamber was blown off, as if subject to an internal explosion.
- As far as the site investigation, all bolts of the upper portion were gone. (Nuts and bolts are typically used to couple the overflow chamber to the duct embedded in the concrete wall of the SFP. (Fig. 3.8))
① IC vent pipe ⑨ Drain pipe from the 5th floor ⑱ Drain pipe from the overflow chamber ① to ⑧ and ⑩ to ⑰ Wire conduits
Overflow chamber
Air-conditioning duct

53
- The NRA could find no fractured bolts, but found traces of an internal explosion on parts at the side and bottom portions left clinging to the overflow chamber. (Fig. 3.9)
The NRA estimated the gas explosion, not by water pressure, caused the overflow chamber to
break (as confirmed in the site investigation), based on the above findings. In other words, the hydrogen explosion that occurred in the reactor building on March 12, 2011 is assumed to be this gas explosion.
Note that in case the witnessed water leak on the 4th floor of Unit 1 came from the overflow
chamber, the chamber would need a gap when the witness saw the water leak. However, the NRA cannot clearly judge in this matter from the situation in the site investigation.
Figure 3.7 Structure of the Overflow Chamber (image diagram)
Coupled with the SFP air-conditioning duct
Closing plate
Surface A: Surface equipped with an inspection port
Surface B: Surface in contact with the left end of surface "A"
Surface C: Surface jointed with the SFP air-conditioning duct
Surface D: Surface equipped with a closing plate
Surface E: Top surface Surface F: Bottom surface
Surface E
Surface B
Surface A
Surface C
Surface D
Inspection port
(Unit : mm)
SurfaceF

54
Figure 3.8 Views of Overflow Chamber Surfaces (1)
Figure 3.9 Views of Overflow Chamber Surfaces (2)
<Surface "D" in image diagram> <Surface "D" in image diagram>
<Surface "D" in image diagram> <Surface "D" in image diagram>
<Surface "D" in image diagram> <Surface "F" in image diagram>
<Surface "F" in image diagram> <Surface "F" in image diagram>
55
2) Possibility of water sloshing in the SFP (a) Analysis results of water sloshing in the SFP
As the water sloshing might have been occurred in the SFP, the NRA conducted the analysis related to the water flood in the duct from the SFP due to the water sloshing. That result was as follows:
- It was evaluated that water in the SFP reached at the level 1.0 m above the top of the SFP weir (maximum), and thus reached the top of the fence (0.8 m above the top of the SFP weir. (Fig. 3.12))
- About 30 seconds after the main shock of the earthquake, the water in the SFP started flooding into the air-conditioning duct embedded in the side concrete wall of the SFP, and flooded into the overflow chamber placed near the ceiling of the 4th floor. The NRA evaluated that approx. 0.6 m3 of water flowed there about 40 seconds later, and about 0.8 m3 of water flowed about 80 seconds later. (Fig. 3.13)
- The overflow chamber’s capacity (volume) was about 1.0 m3 and the maximum quantity of water that could be fed to the overflow chamber was 0.8 m3. This quantity was equivalent to the overflow chamber’s water level, which was a little above the ceiling of the SFP air-conditioning duct connected to the overflow chamber. (Note that both overflow chambers could not be filled up with water from the SFP. The NRA estimated that the water rising of the overflow chamber is stopped so that the air in the upper part of the overflow chamber could not have the way to escape and that the analysis carried out assuming that the air treated as the incompressibility, after the horizontal portion of the SFP air-conditioning duct filled with the water.)
(Reference Information)
From the analysis result above, the NRA estimated that about 40 m3 of SFP water leak the floor around the SFP due to the water sloshing in the SFP. This 40 m3 of overflowed water was equivalent to a height of about 35 mm above the 5th floor of Unit 1 (as the floor area was about 1150 m2). However, it is estimated that SFP water could not flow directly from the 5th floor to the 4th floor because the following overflow prevention measures had been taken for the 5th floor
- A weir about 120-mm high was installed near the staircase going up to the 5th floor of Unit 1. (June 2009)
- A watertight door was installed in front of the elevator on the 5th floor of Unit 1. (June 2009)
- Clearances of pipe penetrations running from 5th floor down to the 4th floor were filled with caulking compounds or similar material. (Around October 2007)
- Cable penetrations were filled with a silicon foam sealant (Pene-Seal-Crete). (March 2008) - A steel weir (about 270-mm high) was installed under the opening handrails (at the
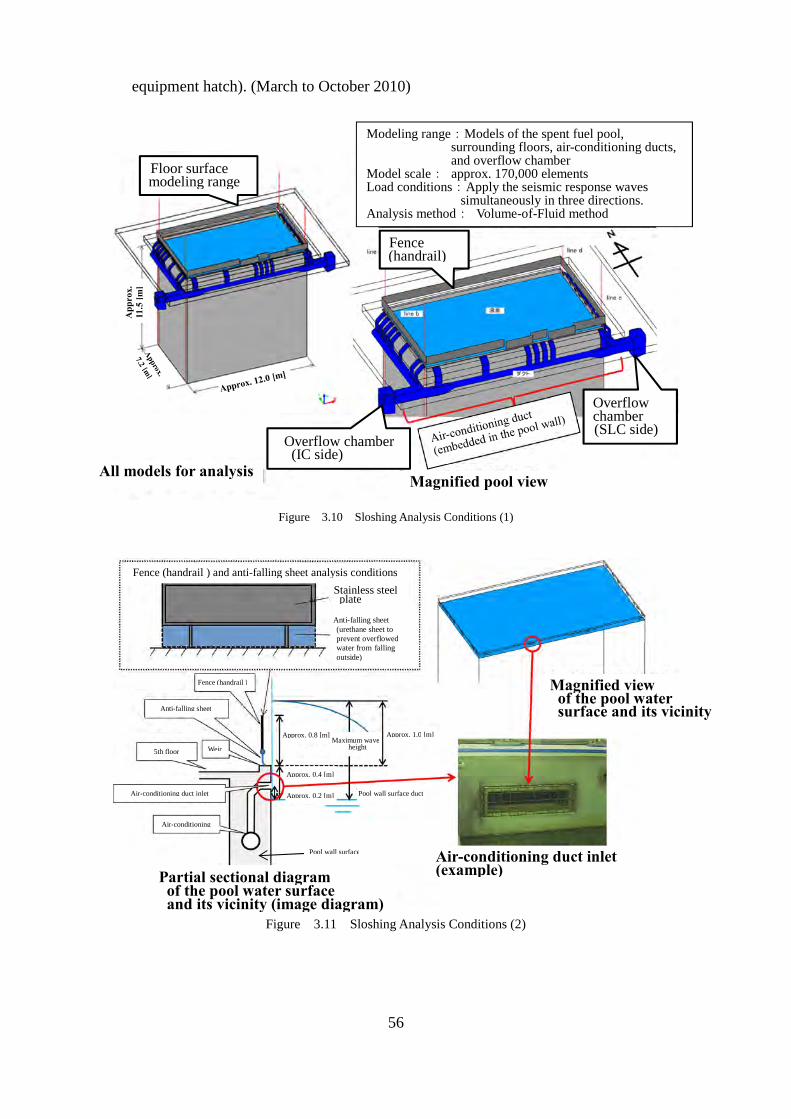
56
equipment hatch). (March to October 2010)
Figure 3.10 Sloshing Analysis Conditions (1)
Figure 3.11 Sloshing Analysis Conditions (2)
プール壁面
Floor surface modeling range
Fence (handrail)
Overflow chamber (IC side)
Overflow chamber (SLC side)
Modeling range:Models of the spent fuel pool, surrounding floors, air-conditioning ducts, and overflow chamber
Model scale: approx. 170,000 elements Load conditions:Apply the seismic response waves
simultaneously in three directions. Analysis method: Volume-of-Fluid method
All models for analysis Magnified pool view
App
rox.
11
.5 [m
]
Fence (handrail ) and anti-falling sheet analysis conditions Stainless steel plate
Anti-falling sheet (urethane sheet to prevent overflowed water from falling outside)
Fence (handrail )
Anti-falling sheet
5th floor Weir
Air-conditioning duct inlet
Air-conditioning duct
Pool wall surface duct
Pool wall surface duct
Approx. 0.8 [m]
Approx. 0.4 [m]
Approx. 0.2 [m]
Maximum wave height
Approx. 1.0 [m]
Partial sectional diagram of the pool water surface and its vicinity (image diagram)
Air-conditioning duct inlet (example)
Magnified view of the pool water surface and its vicinity
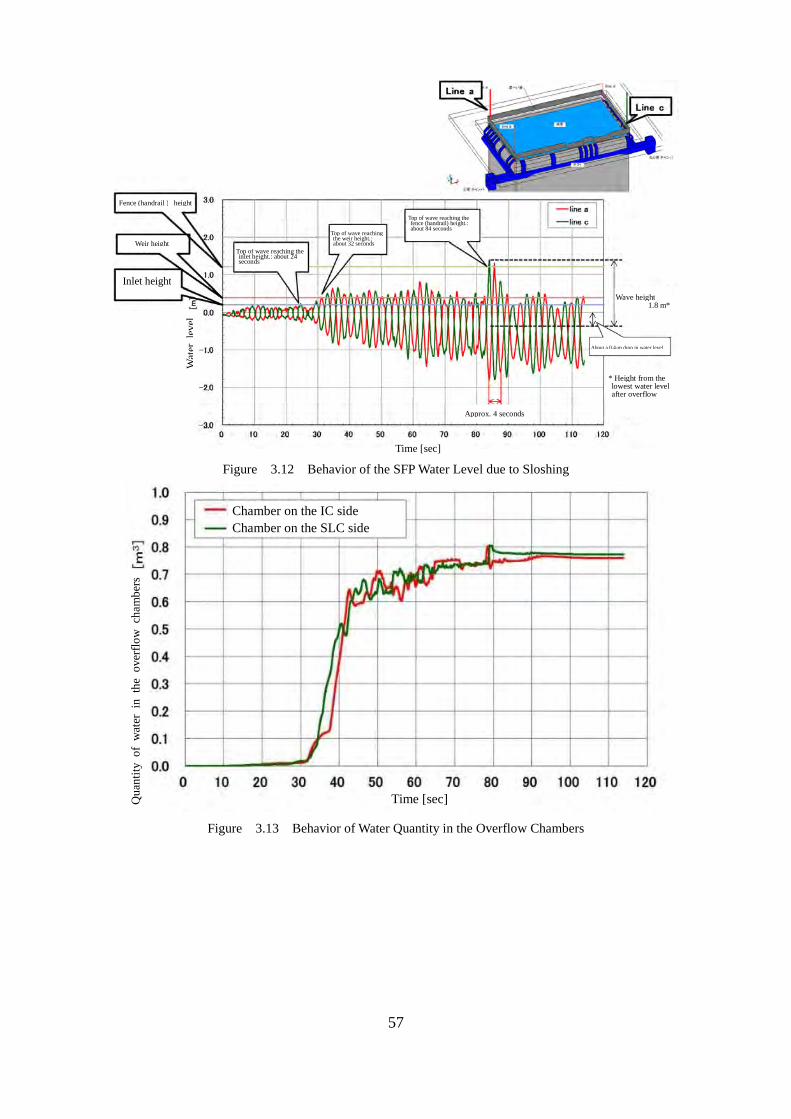
57
Figure 3.12 Behavior of the SFP Water Level due to Sloshing
Figure 3.13 Behavior of Water Quantity in the Overflow Chambers
Fence (handrail ) height
Weir height
Inlet height
Wat
er l
evel
Top of wave reaching the inlet height.: about 24 seconds
Top of wave reaching the weir height.: about 32 seconds
Top of wave reaching the fence (handrail) height.: about 84 seconds
Approx. 4 seconds
About a 0.4-m drop in water level
Wave height 1.8 m*
* Height from the lowest water level after overflow
Time [sec]
Chamber on the IC side Chamber on the SLC side
Qua
ntity
of
wat
er i
n th
e ov
erflo
w c
ham
bers
Time [sec]
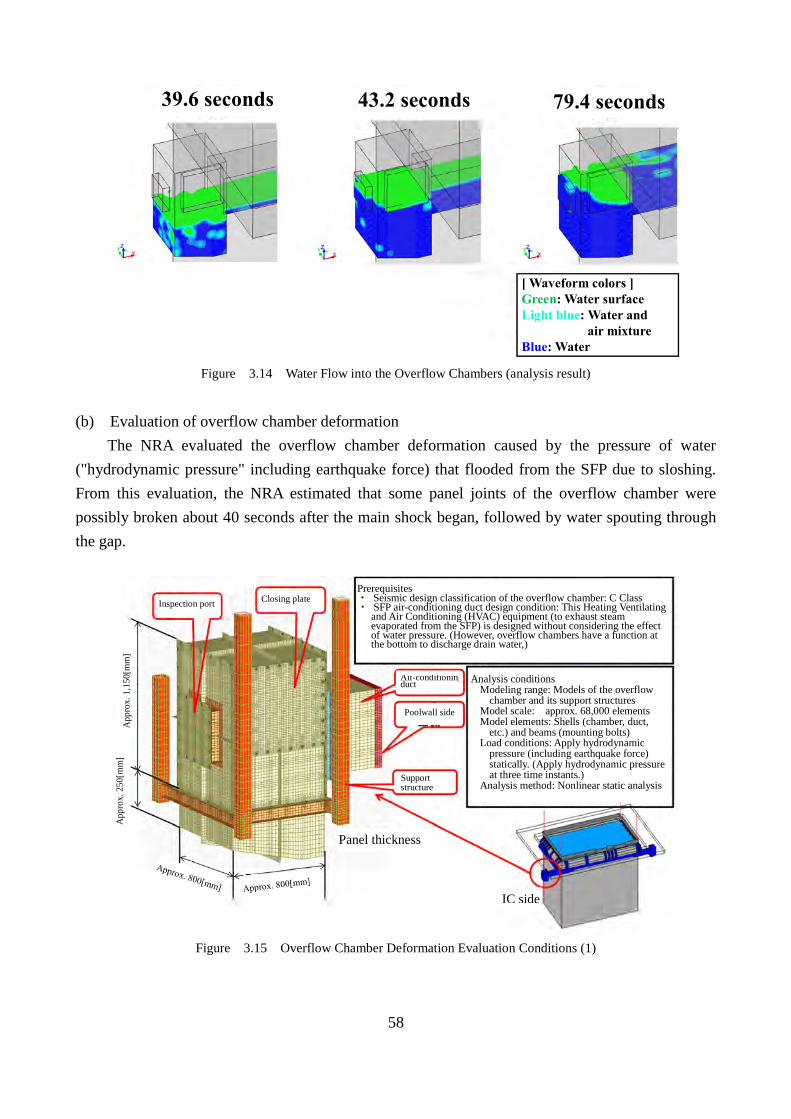
58
Figure 3.14 Water Flow into the Overflow Chambers (analysis result)
(b) Evaluation of overflow chamber deformation
The NRA evaluated the overflow chamber deformation caused by the pressure of water ("hydrodynamic pressure" including earthquake force) that flooded from the SFP due to sloshing. From this evaluation, the NRA estimated that some panel joints of the overflow chamber were possibly broken about 40 seconds after the main shock began, followed by water spouting through the gap.
Figure 3.15 Overflow Chamber Deformation Evaluation Conditions (1)
39.6 seconds 43.2 seconds 79.4 seconds
[ Waveform colors ] Green: Water surface Light blue: Water and
air mixture Blue: Water
Inspection port Closing plate
App
rox.
1,1
50[m
m]
App
rox.
250
[mm
]
Panel thickness
Support structure
Poolwall side
Air-conditioning duct
Prerequisites ・ Seismic design classification of the overflow chamber: C Class ・ SFP air-conditioning duct design condition: This Heating Ventilating
and Air Conditioning (HVAC) equipment (to exhaust steam evaporated from the SFP) is designed without considering the effect of water pressure. (However, overflow chambers have a function at the bottom to discharge drain water,)
Analysis conditions Modeling range: Models of the overflow
chamber and its support structures Model scale: approx. 68,000 elements Model elements: Shells (chamber, duct,
etc.) and beams (mounting bolts) Load conditions: Apply hydrodynamic
pressure (including earthquake force) statically. (Apply hydrodynamic pressure at three time instants.)
Analysis method: Nonlinear static analysis
IC side

59
Figure 3.16 Overflow Chamber Deformation Evaluation Conditions (2)
※変形スケール:対構造スケールの10倍
Figure 3.17 Analysis of Overflow Chamber Deformation (example: at 43.2 s (at peak pressure))
(Reference Information) Situations of overflow chambers of other units
To determine the degrees to which the overflow chambers of the other units were affected, the NRA investigated the overflow chambers in Unit 5 and Unit 6 at the Fukushima Daiichi NPS. In the
Overflow chamber materials ・Overflow chamber Mounting bolts: Stainless steel (SUS304) ・Support structure: Carbon steel (SS400) Stress-strain relationship ・Panel, etc.: Elasto-plasticity (See the figure
below.) ・Mounting bolts: Elasticity
Material classification
(Stainless steel) (Carbon steel)
(12 mm in dia.) ( 8 mm in dia.)
Mounting bolt: Stainless steel
Classification of mounting bolts
Stress-strain diagram considering panels, etc. ※For details of vertical elastic coefficients and design
yield points, refer to "Codes for nuclear power generation facilities: Rules on design and construction for nuclear power plants" (The Japan Society of Mechanical Engineers JSMES NC1-2005).
vertical elastic coefficient※ Strain
Design yield point※
Stre
ss
Opening area :2mm
Opening area :5mm
Deformation scale: Structure scale x 10

60
site investigation, the NRA found no damage that could cause these overflow chambers to spout water.
The NRA estimated that the difference between Unit 1 and the other units would be as follows. (Unit 5)
- The panels constituting the overflow chambers in Unit 5 were about 1.5 times thicker than those of Unit 1, and nearly all the panel joints had been welded. In addition, some bolt joints was reinforced with thick cover plates. The NRA estimated that overflow chambers in Unit 5 were considerably stronger than Unit 1’s based on these findings.
(Unit 6)
- The panels constituting each of overflow chambers in Unit 6 were also about 1.5 times thicker than those in Unit 1. The NRA estimated that this made overflow chambers in Unit 6 stronger than Unit 1’s.
- Unit 6 was equipped with four overflow chambers (while Unit 1 has two). All three SFP ducts on the three sides of the SFP were independent (while the three SFP ducts of Unit 1 were connected together), and one or two overflow chambers were connected to each independent duct. Therefore, in case of a lot of water overflowing from the SFP, those independent overflow chambers would share the flow of water. Accordingly, the NRA estimated that each of the SFP ducts and overflow chambers in Unit 6 could hold less water than each of those in Unit 1 (that is, the water load was dispersed).
- As three of the four Unit 6 overflow chambers were located perpendicularly to the longitudinal side of the SFP duct, an earthquake’s swaying direction might differ from the direction of water flooding into the chambers. Therefore, if SFP water overflowed due to sloshing, the water pressure applied to overflow chambers in Unit 6 is assumed to be less than that applied to Unit 1’s.

61
Figure 3.18 Situation of the Overflow Chambers of Unit 5
Figure 3.19 Situation of the Overflow Chambers of Unit 6
Unit 5 southeast overflow chamber
Unit 5 southwest overflow chamber
Overflow chamber Overflow chamber
Unit 6 northeast overflow chamber
Unit 6 southeast overflow chamber Unit 6 south overflow chamber
Overflow chamber
Overflow chamber Overflow chamber
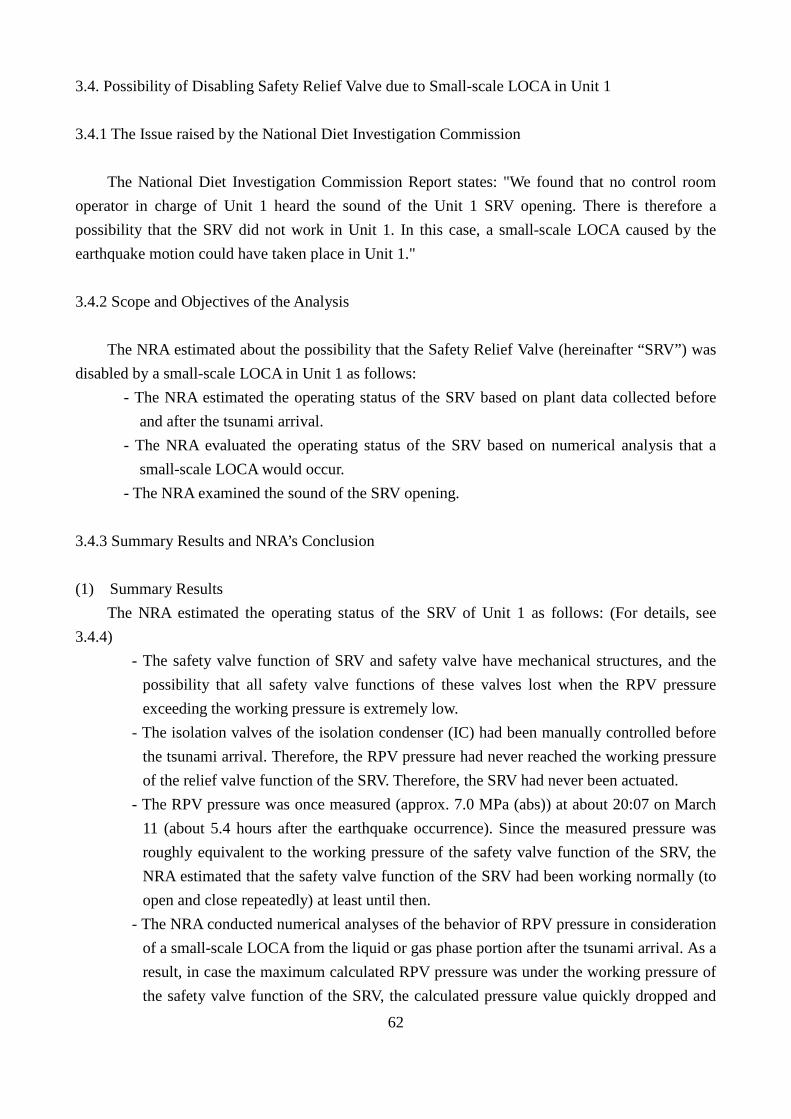
62
3.4. Possibility of Disabling Safety Relief Valve due to Small-scale LOCA in Unit 1 3.4.1 The Issue raised by the National Diet Investigation Commission
The National Diet Investigation Commission Report states: "We found that no control room operator in charge of Unit 1 heard the sound of the Unit 1 SRV opening. There is therefore a possibility that the SRV did not work in Unit 1. In this case, a small-scale LOCA caused by the earthquake motion could have taken place in Unit 1."
3.4.2 Scope and Objectives of the Analysis
The NRA estimated about the possibility that the Safety Relief Valve (hereinafter “SRV”) was disabled by a small-scale LOCA in Unit 1 as follows:
- The NRA estimated the operating status of the SRV based on plant data collected before and after the tsunami arrival.
- The NRA evaluated the operating status of the SRV based on numerical analysis that a small-scale LOCA would occur.
- The NRA examined the sound of the SRV opening.
3.4.3 Summary Results and NRA’s Conclusion (1) Summary Results
The NRA estimated the operating status of the SRV of Unit 1 as follows: (For details, see 3.4.4)
- The safety valve function of SRV and safety valve have mechanical structures, and the possibility that all safety valve functions of these valves lost when the RPV pressure exceeding the working pressure is extremely low.
- The isolation valves of the isolation condenser (IC) had been manually controlled before the tsunami arrival. Therefore, the RPV pressure had never reached the working pressure of the relief valve function of the SRV. Therefore, the SRV had never been actuated.
- The RPV pressure was once measured (approx. 7.0 MPa (abs)) at about 20:07 on March 11 (about 5.4 hours after the earthquake occurrence). Since the measured pressure was roughly equivalent to the working pressure of the safety valve function of the SRV, the NRA estimated that the safety valve function of the SRV had been working normally (to open and close repeatedly) at least until then.
- The NRA conducted numerical analyses of the behavior of RPV pressure in consideration of a small-scale LOCA from the liquid or gas phase portion after the tsunami arrival. As a result, in case the maximum calculated RPV pressure was under the working pressure of the safety valve function of the SRV, the calculated pressure value quickly dropped and

63
vastly diverged from the RPV pressure value measured 5.4 hours after the earthquake. Therefore, this presumption is not rational.
- The SRV was not actuated before the tsunami arrival as the IC of Unit 1 was in operation. Therefore, it is natural that the operators could not hear the sound of the SRV opening. On the other hand, the operators had a chance to hear the sounds of the SRV opening because the SRV of Unit 2 opened several times. As the power supply was lost after the tsunami arrival, it is highly likely that the safety valve function of the SRV was in operation. As for the sound of the SRV opening, time of the sound was not clear. So, the NRA will investigate the sounds of the SRV opening again when the evidence data of the National Diet Investigation Commission report is disclosed.
(2) NRA's Conclusion
The National Diet Investigation Commission Report states: "We found that no control room operator in charge of Unit 1 heard the sound of the Unit 1 SRV opening. There is therefore a possibility that the SRV did not work in Unit 1. In this case, a small-scale LOCA caused by the earthquake motion could have taken place in Unit 1."
From the results of analysis, the NRA estimated that the possibility that all safety valve
functions of SRV lost is extremely low judging from the valve structures. Moreover, the SRVs were not actuated since the RPV pressure had been controlled by the IC before the tsunami arrival. On the other hand, as the result of numerical analyses in consideration of a small-scale LOCA after the tsunami arrival, in case the maximum calculated RPV pressure was under the working pressure of the safety valve function of the SRV, the calculated pressure quickly dropped and vastly diverged from the RPV pressure measured 5.4 hours after the earthquake. Furthermore, the RPV pressure measured 5.4 hours after the earthquake occurrence was roughly equivalent to the working pressure of the safety valve function of the SRV, the NRA estimated that the safety valve function of the SRV had been working normally (to open and close repeatedly) at least until then. From these results, the NRA considers it rational that the SRV had actually worked.
As for the sound of the SRV opening, the NRA considers it natural that the IC of Unit 1 was
working normally and the relief valve function of the SRV was not actuated before the tsunami arrival. On the other hand, the relief valve function of the SRV of Unit 2 was working normally (to open and close repeatedly). The NRA estimated that the operators could hear the sounds of the SRV opening of Unit 2.
After the tsunami arrival, the NRA considers it highly likely that the safety valve function of
the SRV was actuated as the RPV pressure increased. The NRA also estimated that the sounds of the relief valve opening and safety valve opening of SRV are different due to the different valve structures and the different situation of discharged steam. As for the sounds of SRV opening in Unit

64
2 and Unit 3 that the National Diet Investigation Commission report pointed out, the time of the sound was not clear. Therefore, the NRA will investigate the sounds of the SRV opening again when the evidence data of the National Diet Investigation Commission report is disclosed. 3.4.4 Analytical Approach and Results (1) Possible functional defects in SRVs due to a small-scale coolant leak
1) Functions and structures of SRVs and safety valves The Unit 1 main steam pipe was equipped with four SRVs and three safety valves actuated at
different pressures, respectively. (Table 4.1)
As for the relief valve function of the SRV, when RPV pressure exceeds the working pressure, open signal is send and the relief valve of the SRV is opened forcibly by actuator. The power of open signal is DC power supply. Therefore, in case DC power supply is shut down, the solenoid valve of the pipe supplied compressed air cannot be opened and also the relief valve of the SRV cannot be opened manually from the main control room. After the tsunami arrival, the relief valve function of the SRV disabled because DC power supply lost. Note that DC power supply was partially recovered at about 18:00 on March 11. However, there was no record of any SRVs being manually operated to open at that time.
The safety valve function of the SRV, however, features a mechanical structure to push up the
valve element when reactor pressure exceeds spring pressure. Even if the power supply is lost, the safety valve function of SRV could work when reactor pressure exceeds the spring pressure. Therefore the NRA considered that it is the least possible to lose the safety valve function of all seven valves. The NRA also estimated that it was only when RPV pressure was lower than the working pressure that all safety valve function of the SRV and the safety valves were disabled.

65
Figure 4.1 Structure of Safety Relief Valve
Table 4.1 Working Pressures of Safety Valves and Relief Valves
Steam discharged to Function Working pressure
(MPa) 43
Safety
valve
Drywell blow-down Safety valve
function
8.51~8.62
Safety
relief
valve
Suppression pool Safety valve
function
7.64~7.71
Relief valve
function
7.27~7.41
2) Valve operations before the tsunami arrival
After the earthquake occurred and the isolation condensers started automatically,44 operators at Unit 1 controlled manually the isolation valves of IC to keep RPV pressure under about 7.0 MPa45 until DC power supply was lost due to the tsunami arrival. This RPV pressure was lower than the working pressure (7.27 MPa (gage)) of the relief valve function of the SRV.46 From these findings, it is apparent that the SRV did not work before the tsunami arrival. And even when a coolant leak occurred, the NRA estimated that the leak did not exceed the leak rate that requires any safety measures and is defined as LCO (0.23 m3/h, equivalent to 2.0 mm2 for a leak from the liquid phase; 8.0 mm2 for a leak from the gas phase). (See Section 3.1)
3) SRV operations after the tsunami arrival
After about 15:36 when DC power supply was lost after the tsunami arrival, the measured RPV pressure values were not recorded, but later were temporarily recorded at 20:07. There is risk to use this value when measured at a single time point, but this value is only actually measured pressure. So, the NRA estimated the actuated state of the SRV in reference to this measured pressure value.
(a) Accuracy and reliability of measured pressure values
This measured pressure value (approx. 7.0 MPa (abs)) was what an operator read on a Bourdon pressure gage that required no DC power supply. This pressure gage was located in the instrument rack on the 2nd floor of the reactor building of Unit 1. The NRA estimated that the environmental conditions were not very severe on this floor, as the operator could access this pressure gage. In addition, the reading was an analog value that the operator actually read. It is therefore difficult to 43 The Government Investigation Committee Final Report, Annex (p.16) 44 Preset automatic IC starting pressure was reduced from 7.27 to 7.13 MPa (set value) in the 26th scheduled inspection
(March to October 2010). 45 TEPCO Investigation Committee Report, Attachment 6-1(6), June 2012 46 The Government Investigation Committee Final Report, Annex (p.16)
Actuator portion
overflow chamber
Balancing piston
Disk
Bonnet Bellows
Steam outlet
Body
Seat
Steam inlet

66
presume that the operator had misinterpreted the digit. Even with a certain amount of error being included in the measured value, the error could not be very large (i.e., some tens of percent). (Note that reading error of about 1/10 of the minimum scale value is generally assumed.)
(b) Presumption of RPV pressure behavior from the measurement value On the assumption that a small-scale coolant leak occurred and all SRV were disabled, the
behavior of RPV pressure depends on the balance between the quantity of steam generated in the RPV and the quantity of coolant leaked through a broken part. As time goes by, in general, decay heat generally goes down and consequently the quantity of generated steam also goes down. In particular, the quantity of generated steam becomes much smaller when the water level drops below the top heat-generating portion of the core. Accordingly, RPV pressure behaves in one of the following two manners: 1) "initially rising, followed by a gradual reduction in rising speed, and finally going down" or 2) "initially dropping, followed by an increase in falling speed as time goes by."
The RPV pressure value measured at 20:07 was near the working pressure of the safety valve function of the SRV. This means that RPV pressure had reached the working pressure of the safety valve function of the SRV at least before this time, and that the safety valve function of the SRV remained in normal operation to maintain RPV pressure at this time. Therefore, the NRA estimated that it is difficult to presume that the safety valve function of the SRV did not actuate until this time.
(c) Presumption of RPV pressure behavior by calculation code
To determine any tendency in RPV pressure behavior after the tsunami arrival (on the basis of (b) above), the NRA conducted numerical analysis that the reactor pressure boundary (gas phase or liquid phase) had the various leak sizes.
As the coolant leak conditions, the three leak sizes were set in light of the pressure behavior of the RPV against the safety valve function of the SRV . Table 4-2 shows the concrete analysis conditions.
- Analysis Case 1
700 mm2 (for a leak from the gas phase) and 1900 mm2 (for a leak from the liquid phase) when maximum RPV pressure exceeds the working pressure of the safety valve function of the SRV (assuming that all relief safety valves are disabled by all valves fixed even if RPV pressure exceeds the working pressure of the safety valve function of the SRV)
- Analysis Case 2 800 mm2 (for a leak from the gas phase) and 2000 mm2 (for a leak from the liquid phase) when maximum RPV pressure is roughly equivalent to the working pressure of the safety valve function of the SRV

67
- Analysis Case 3 900 mm2 (for a leak from the gas phase) and 2100 mm2 (for a leak from the liquid phase) when maximum RPV pressure is lower than the working pressure of the safety valve function of the SRV
Table 4.2 Analysis conditions of the three cases above 47
Case Small-scale leak area
(mm2) after the tsunami arrival
Operation of relief safety valve after the tsunami
arrival Other
1 700(1900)
In-operative (functionally defective)
- Assuming that steam overheated by the damaged core destroyed the flange gasket of the relief safety valve, and a leak was generated when gas phase temperature in the RPV reached 450
- Using severe accident (SA) analysis code MELCOR
- Using decay heat values evaluated by TEPCO
2 800(2000)
3 900(2100)
※Values enclosed in parentheses are for leaks from the liquid phase.
Figure 4.2 RPV Pressure Behaviors of Analysis Cases (image diagram)
47 Analysis start time (after reactor scram) of 175 seconds;initial RPV pressure of 6.2 MPa (abs); initial reactor water
level of 13 meters;initial PCV pressure of 0.11 MPa (abs); initial PCV temperature (drywell temperature of 38 and pressure suppression chamber water temperature of 21)
ケース1
ケース2
ケース3
Popen
Pclose
Case 1
Case 2
Case 3
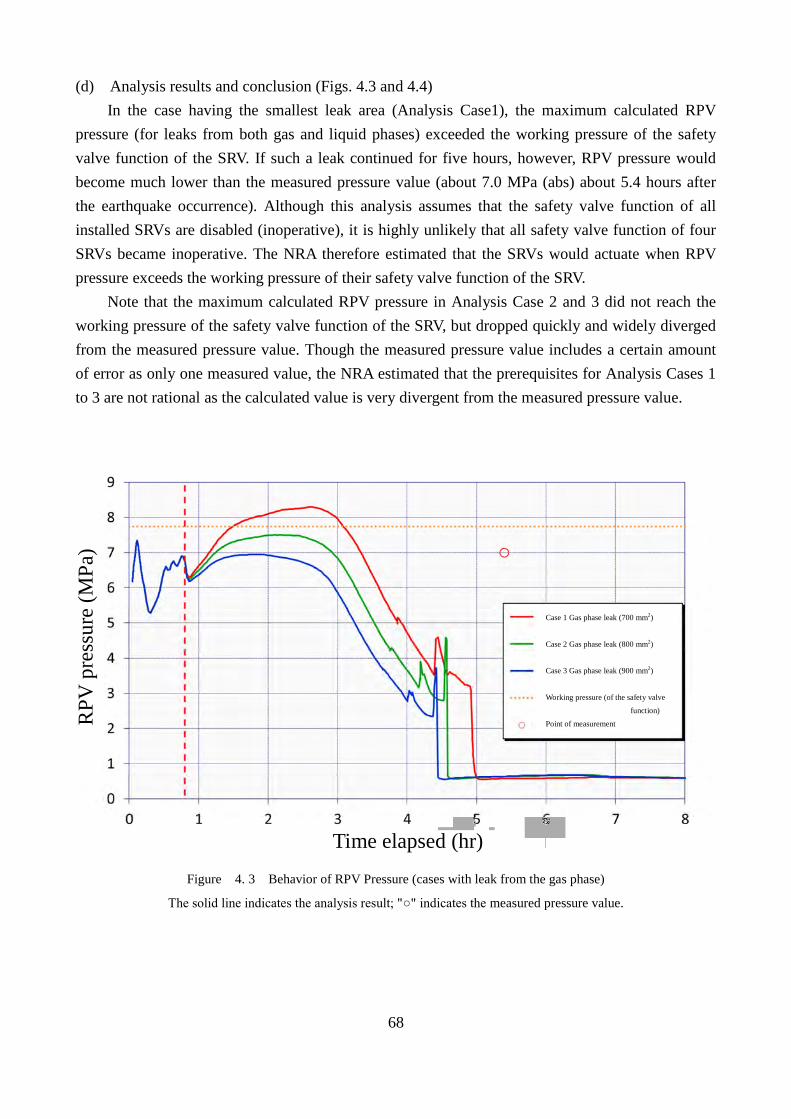
68
(d) Analysis results and conclusion (Figs. 4.3 and 4.4) In the case having the smallest leak area (Analysis Case1), the maximum calculated RPV
pressure (for leaks from both gas and liquid phases) exceeded the working pressure of the safety valve function of the SRV. If such a leak continued for five hours, however, RPV pressure would become much lower than the measured pressure value (about 7.0 MPa (abs) about 5.4 hours after the earthquake occurrence). Although this analysis assumes that the safety valve function of all installed SRVs are disabled (inoperative), it is highly unlikely that all safety valve function of four SRVs became inoperative. The NRA therefore estimated that the SRVs would actuate when RPV pressure exceeds the working pressure of their safety valve function of the SRV.
Note that the maximum calculated RPV pressure in Analysis Case 2 and 3 did not reach the working pressure of the safety valve function of the SRV, but dropped quickly and widely diverged from the measured pressure value. Though the measured pressure value includes a certain amount of error as only one measured value, the NRA estimated that the prerequisites for Analysis Cases 1 to 3 are not rational as the calculated value is very divergent from the measured pressure value.
Figure 4. 3 Behavior of RPV Pressure (cases with leak from the gas phase)
The solid line indicates the analysis result; "" indicates the measured pressure value.
RPV
pre
ssur
e (M
Pa)
Time elapsed (hr)
Case 1 Gas phase leak (700 mm2)
Case 2 Gas phase leak (800 mm2)
Case 3 Gas phase leak (900 mm2)
Working pressure (of the safety valve
function)
Point of measurement
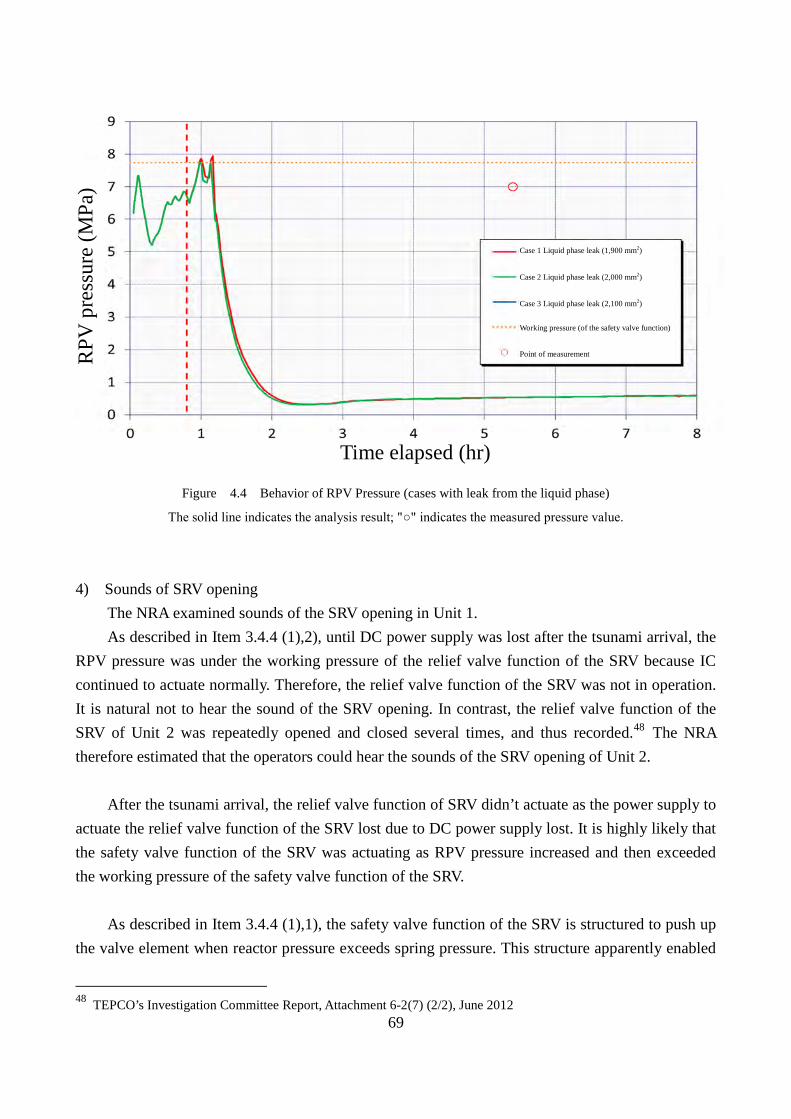
69
Figure 4.4 Behavior of RPV Pressure (cases with leak from the liquid phase)
The solid line indicates the analysis result; "" indicates the measured pressure value.
4) Sounds of SRV opening
The NRA examined sounds of the SRV opening in Unit 1. As described in Item 3.4.4 (1),2), until DC power supply was lost after the tsunami arrival, the
RPV pressure was under the working pressure of the relief valve function of the SRV because IC continued to actuate normally. Therefore, the relief valve function of the SRV was not in operation. It is natural not to hear the sound of the SRV opening. In contrast, the relief valve function of the SRV of Unit 2 was repeatedly opened and closed several times, and thus recorded.48 The NRA therefore estimated that the operators could hear the sounds of the SRV opening of Unit 2.
After the tsunami arrival, the relief valve function of SRV didn’t actuate as the power supply to
actuate the relief valve function of the SRV lost due to DC power supply lost. It is highly likely that the safety valve function of the SRV was actuating as RPV pressure increased and then exceeded the working pressure of the safety valve function of the SRV.
As described in Item 3.4.4 (1),1), the safety valve function of the SRV is structured to push up
the valve element when reactor pressure exceeds spring pressure. This structure apparently enabled
48 TEPCO’s Investigation Committee Report, Attachment 6-2(7) (2/2), June 2012
RPV
pre
ssur
e (M
Pa)
Case 1 Liquid phase leak (1,900 mm2)
Case 2 Liquid phase leak (2,000 mm2)
Case 3 Liquid phase leak (2,100 mm2)
Working pressure (of the safety valve function)
Point of measurement
Time elapsed (hr)

70
the gradual discharge of steam from the RPV. Conversely, the relief valve function of the SRV is structured to forcibly open in case RPV pressure exceeds the valve’s working pressure. This structure apparently enabled steam to burst out from the RPV. The NRA therefore estimated that the sounds of the safety valve opening and relief valve opening of the SRV were different, as their steam discharge processes were different.
As for the sounds of the SRV opening in Unit 2 and Unit 3 that the National Diet Investigation Commission report pointed out, the time of the sound was not clear. Therefore, the NRA will investigate the sounds of the SRV opening again when the evidence data of the National Diet Investigation Commission report is disclosed.

71
3.5 Operating Status of the Isolation Condenser of Unit 1
3.5.1 The Issue raised by the National Diet Investigation Commission
Regarding the operating status of the isolation condenser (IC) of Unit 1, the Government Investigation Committee Report states: "With the exception of the isolation valves (MO-3A and 3B) that had already been fully closed remotely from operating the control panel because the DC supply to the rupture detection circuit was lost, it is assumed that the failsafe function worked in the IC systems (A and B) of Unit 1 automatically to close the isolation valves (MO-1A, 2A, 4A, 1B, 2B and 4B) inside and outside the containment right after the arrival of the tsunami. Even if the failsafe function works correctly, the isolation valve not be fully closed but remain partially open when the power source is lost in the course of closing operation. This could be the reason why the isolation valves (MO-1A, 4A, MO-1B and 4B) inside the containment were left half open. The power sources of the breakage detection circuit, the valve drive (closing) control circuit and the isolation valve drive motor were located dispersedly on the first floor and the first basement floor of the R/B and the T/B of Unit 1. Thus they were not submerged and lost their power sources simultaneously. It is not contradictory that some isolation valves were completely closed by the failsafe function just like the supplying piping isolation valve (MO-2B) of the IC (system B)."
The National Diet Investigation Commission Report conversely states: "NAIIC does not agree to the view that the feature was actually triggered as designed." The report also states: "The DC power can be supplied from batteries, or by the battery charger driven by the AC power supply, so as long as there is sufficient AC power, DC power will be available." Additionally, the report states: "This makes the “failsafe” function defined by the Government’s Investigation Committee impossible to achieve in principle, and there is no possible scenario proving the Government’s Investigation Committee’s presumption that “for an unknown reason, the AC power kept working even after the loss of DC power.”
Regarding the situation after all power supplies were lost, the Government Investigation Committee report states: "The actual degrees to which the isolation valves (MO-1A and 4A) were open inside the containment were small and thus the rate of steam flow of the IC (system A) was not enough to fully perform its cooling function."
The National Diet Investigation Commission Report conversely states: "The reason that the IC system (A) did not respond properly to the operator actions subsequent to 18:18 on March 11, was not because MO-1A and MO-4A were disabled at the closed position by the failsafe feature, but because the natural circulation had been stopped by the IC narrow tubes being clogged with non-condensable hydrogen, which was created from the zirconium-water reaction in conjunction with the damaged reactor core at a high temperature without coolant water."
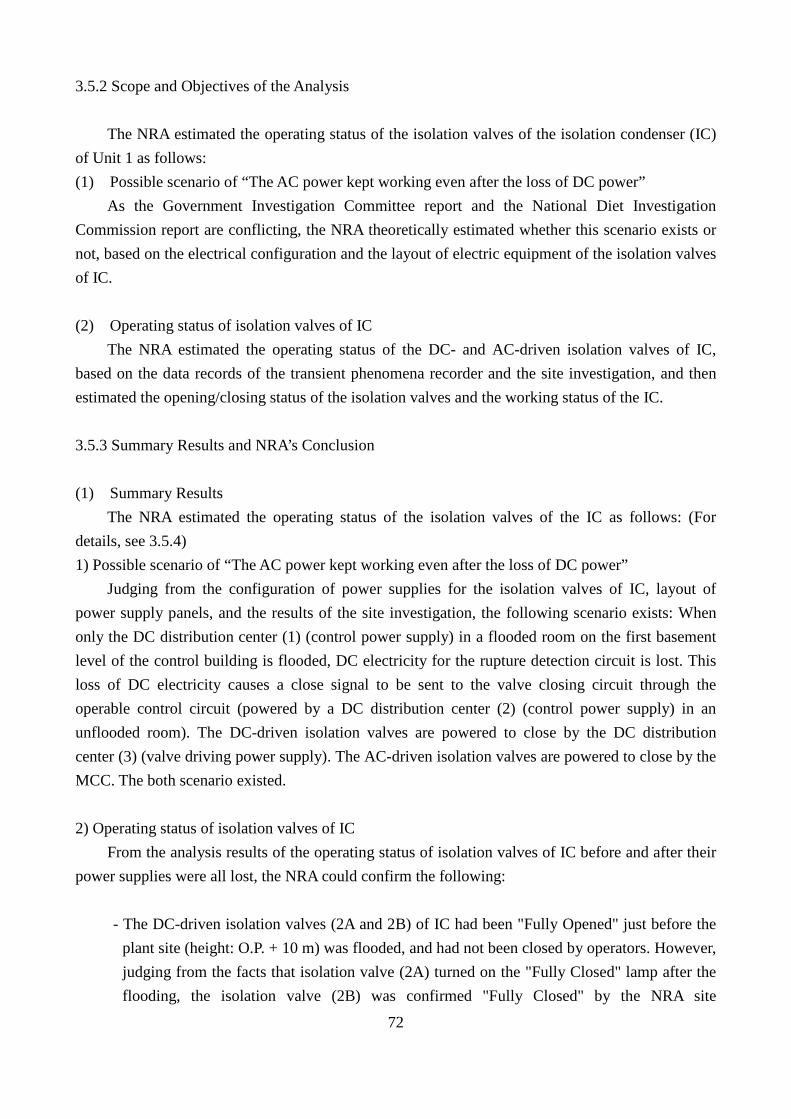
72
3.5.2 Scope and Objectives of the Analysis
The NRA estimated the operating status of the isolation valves of the isolation condenser (IC) of Unit 1 as follows: (1) Possible scenario of “The AC power kept working even after the loss of DC power”
As the Government Investigation Committee report and the National Diet Investigation Commission report are conflicting, the NRA theoretically estimated whether this scenario exists or not, based on the electrical configuration and the layout of electric equipment of the isolation valves of IC. (2) Operating status of isolation valves of IC
The NRA estimated the operating status of the DC- and AC-driven isolation valves of IC, based on the data records of the transient phenomena recorder and the site investigation, and then estimated the opening/closing status of the isolation valves and the working status of the IC.
3.5.3 Summary Results and NRA’s Conclusion (1) Summary Results
The NRA estimated the operating status of the isolation valves of the IC as follows: (For details, see 3.5.4) 1) Possible scenario of “The AC power kept working even after the loss of DC power”
Judging from the configuration of power supplies for the isolation valves of IC, layout of power supply panels, and the results of the site investigation, the following scenario exists: When only the DC distribution center (1) (control power supply) in a flooded room on the first basement level of the control building is flooded, DC electricity for the rupture detection circuit is lost. This loss of DC electricity causes a close signal to be sent to the valve closing circuit through the operable control circuit (powered by a DC distribution center (2) (control power supply) in an unflooded room). The DC-driven isolation valves are powered to close by the DC distribution center (3) (valve driving power supply). The AC-driven isolation valves are powered to close by the MCC. The both scenario existed. 2) Operating status of isolation valves of IC
From the analysis results of the operating status of isolation valves of IC before and after their power supplies were all lost, the NRA could confirm the following:
- The DC-driven isolation valves (2A and 2B) of IC had been "Fully Opened" just before the plant site (height: O.P. + 10 m) was flooded, and had not been closed by operators. However, judging from the facts that isolation valve (2A) turned on the "Fully Closed" lamp after the flooding, the isolation valve (2B) was confirmed "Fully Closed" by the NRA site

73
investigation, and the distribution center to supply power to the control circuits had not been flooded, the NRA estimated that both isolation valves were closed due to the loss of controlling DC power for the rupture detection circuit.
- As the AC-driven isolation valves (1B and 4B) of IC had been disabled to close by 15:36:59 due to the power loss of the AC bus, it is highly possible that these valves maintained the open status even if the close signal was sent after 15:37:00.
- The AC-driven isolation valves (1A and 4A) of IC had been opened until 15:36:59, and maintain the AC bus (D) (driving power supply). Therefore, after 15:37:00, these valves would open in case the AC power supply lost its function first, or would close in case the DC power supply lost its function first. However, the NRA cannot determine the operating status (open/close) of the isolation valves (1A and 4A) after that as the power loss time is not clear.
Based on the above mentioned, the DC-driven isolation valves (2A and 2B) were closed after
15:37, while isolation valves (3A and 3B) had been the close status since before the loss of all power. It is highly possible that the AC-driven isolation valves (1B and 4B) maintained the open status. The operating status of isolation valves (1A and 4A) was not clear.
(2) NRA's Conclusion
The National Diet Investigation Commission report states: "There is no possible scenario proving the Government’s Investigation Committee’s presumption that "for an unknown reason, the AC power kept working even after the loss of DC power." Based on the analyses, the NRA estimated that the scenario exists that "the AC-driven valve was closed since the AC power supply kept working even after DC power supply for the IC rupture detection circuit was lost," as reported by the Government Investigation Committee. The NRA estimated that it is hard to confirm whether this scenario actually occurred because it is not clear when each power panel lost in detailed. However, the status of the isolation valves and the flooded condition of station’s power equipment in the site investigation could suggest the possibility that the theoretical scenario described above had actually occurred.
As for the working status of the IC after all power supplies were lost, the Government
Investigation Committee Report states: "The actual degrees to which the isolation valves (MO-1A and 4A) were open inside the containment were small and thus the rate of steam flow of the IC (system A) was not enough to fully perform its cooling function." The National Diet Investigation Commission Report conversely states: "The reason that the IC system (A) did not respond properly to the operator actions was not because MO-1A and MO-4A were disabled at the closed position by the failsafe feature." Judging from the analyses, the NRA estimated that the isolation valves (2A and 2B) outside the PCV were closed, but isolation valves (1B and 4B) of the IC (system "B") in the

74
PCV remained open. However, the operating status (open/close) of isolation valves (1A and 4A) of the IC (system "A") in the PCV is not clear. It is therefore necessary to continue analyses of this issue.
3.5.4 Analytical Approach and Results (1) Possible scenario of "The AC power supply kept working even after the loss of DC power" 1) Power supply configuration related to isolation valves of IC
Unit 1 has two IC systems ("A" and "B"). Each system consists of a condenser tank filled with cooling water, a pipe for guiding RPV steam from the upper part of the RPV into the condenser tank (supply pipe), a pipe for returning steam condensate (water) cooled in the condenser tank back to the lower part of the RPV (return pipe), and isolation valves (two valves for each of the supply and return pipe).
A total of eight isolation valves are installed: four valves inside and outside the PCV of supply
and return pipes per system. Isolation valves inside the PCV are powered and driven by the AC power supply; isolation valves outside the PCV are powered and driven by the DC power supply (see Fig. 5.1).
Each of the supply and return pipe is equipped with a rupture detection circuit for detecting
any breaks in the pipe, and a control circuit that receives a rupture detection signal and then sends a close signal to a valve closing circuit for closing the isolation valve in the pipe where a break was detected.49 Both the rupture detection circuit and control circuit receive power from the DC power supply. The valve closing circuit shares the power supply (AC or DC) with the driving motor of isolation valve.
The rupture detection circuits, the control circuits, and the DC driving motors of the isolation
valves outside the PCV are designed to receive from different DC distribution center50 through the same DC power panel.
The AC driving motor of the isolation valves inside the PCV are designed to receive from the
49 With its pressure sensors placed on both the inside-diameter side (low pressure side) and outside-diameter side (high
pressure side) of the L-shaped portion (elbow) of the pipe of IC installed inside the PCV, the rupture detection circuit measures the pressure of steam flowing through the pipe at the sensor positions, calculates the difference in pressure, and then judges a rupture from that difference in pressure. Upon detecting a pipe break, this circuit sends a Valve Close signal to the valve closing circuit via a signal
transmission control circuit for closing the isolation valve in the broken pipe. If DC current for the control circuit is lost, all isolation valves of IC systems “A” and "B" are closed.
50 The rupture detection circuit receives its controlling DC power supply from DC distribution center (1) (control power supply). The control circuit receives its controlling DC power from DC distribution center (2) (control power supply). Isolation valves placed outside the PCV receive driving DC power from DC distribution center (3) (driving power supply).

75
emergency diesel generator system (D/G) via the high voltage distribution panel (M/C) for the emergency AC bus, power center (P/C), and motor control center (MCC).
Note that AC power is supplied to the DC power through a charger. In case the DC power panel was flooded and lost its function, the DC power supply system would be disabled even if the AC power supply systems remain operable (Figs. 5.2 and 5.3). Therefore, “as long as there is sufficient AC power, DC power will be available" stated by the National Diet Investigation Commission is not true.
Figure 5.1 Configuration of Isolation Condenser Systems [Valve open/close states before the earthquake occurrence (standby
state)]
Cooling water:
System “A”
System “B”
DC power supply
Vent pipe
Discharged to air
Exhaust port
Supply pipe
Condenser tank
Return pipe
AC power supply
Rea
ctor
bui
ldin
g
MO: Electrically-driven valve
MCC: Motor Control Center
Isolation condenser "B"
"Open" at "RPV Pressure High"
RPV
Isolation condenser "A"
From fire hydrant
From makeup water system
Source: Partial addition to "About influences on the Fukushima Daiichi NPS reactor facility by the 2011 Tohoku Earthquake and Tsunami" (modified by TEPCO on September 9 and 28, 2011)
P
C
V

76
Figures 5.2 Configuration of IC-related Station Electrical Equipment
Figure 5.3 IC Isolation Image
D/G (Emergency diesel generator) Battery
DC
pow
er
pane
l
DC
dist
ribut
ion
cent
er (2
) (c
ontro
lling
po
wer
supp
ly)
DC
dist
ribut
ion
cent
er (1
) (c
ontro
lling
po
wer
supp
ly)
Cha
rger
pa
nel
DC
dist
ribut
ion
cent
er (3
) (d
rivin
g po
wer
su
pply
)
MC
C (M
otor
co
ntro
l cen
ter)
MC
C (M
otor
co
ntro
l cen
ter)
P/C
(Pow
er c
ente
r)
M/C
(Met
al-e
nclo
sed
switc
hgea
r
Emergency AC bus
Disposition of power panels R/B: Reactor Building C/B: Control Building T/B: Turbine Building
Isolation valves (MO-1A and 1B)
Isolation valves (MO-4A and 4B)
D/G: (Emergency diesel generator) M/C: (High pressure power panel): Power for the station’s
high voltage circuit P/C: (Power center): Power for the station’s low voltage
circuit MCC: (Motor control center): Power for the station’s
small-capacity, low voltage circuits DC: DC power supply
AC power supply
DC power supply
Valve closing circuit Valve closing circuit
"Valve Close" signal circuit
Control circuit
"Break detection“ signal
Rupture detection circuit
Isolation valves (MO-2B and 2A) Isolation valves (MO-3B and 3A)
Valve driving power supply Isolation valves (1A and 4A) - MCC (D) Isolation valves (2A and 3A) - DC distribution center (3)
(A) Isolation valves (1B and 4B) - MCC (C) Isolation valves (2B and 3B) - DC distribution center (3)
(B)
Valve driving power supply
Valve closing power supply switch
④Electromagnetic force attracts contacts and causes the valve closing electromagnetic switch to close. Power is supplied to the valve driving motor and the valve works to close.
Operating coil of valve closing switch
Valve driving motor
Close driving circuit Receives power from the valve driving power supply.
Close signal
③ In response to ②, the valve driving (Close) control circuit works to close with the operating coil of the valve closing switch in the excited state.
Rupture detection circuit
Rupture detection circuit (system “A”) - DC distribution center (1) (A) Rupture detection circuit (system “B”) - DC distribution center (1) (B)
Switch OFF due to high pressure difference (high flow rate) (same as "high pressure difference (high flow rate)" when power to the Rupture detection circuit is shut off)
Detection signal
diameter side of elbow (low pressure side)
diameter side of elbow (high pressure side)
Outside
Inside Difference pressure detection
Magnified elbow portion
Control circuit
Control circuit (system “A”) - DC distribution center (2) (A) Control circuit (system “B”) - DC distribution center (2) (B)
Coil terminal ② No excitation in case of high pressure difference (high flow rate) or control circuit power-off
Sprin
g
Source: Partial addition to TEPCO’s Fukushima Nuclear Accident Analysis Report (interim report dated December 26, 2011)

77
2) Layout of station electrical equipment related to the IC and theoretical possibility of isolation valve operation
The station electrical equipment related to the isolation valves of IC consists of distribution centers and other apparatus and these equipment are located on the 1st floor and basement level of the reactor building, the control building and the turbine building (see Fig. 5.4).
From the configuration of power supplies and the layout of power centers and panels related to
isolation valves of IC, the NRA found, for example, a theoretical scenario that isolation valves worked as follows.
If only DC distribution center (1) (controlling power supply) for supplying power to the rupture detection circuits was flooded, DC power for this circuit would be lost. A close signal would then be sent to the valve closing circuit for isolation valves via the control circuit (receiving power from DC distribution center (2) (controlling power supply)). The DC-driven isolation valve would receive power to close from DC distribution center (3) (driving power supply), and the AC-driven isolation valves would receive power to close from the MCC. Then the both valves were closed (see Fig. 5.5).
As described above, in theory, it is possible that the AC power kept working to close the
AC-driven isolation valves even after the loss of DC power for the rupture detection circuit, as stated in the Government Investigation Committee report. The NRA estimated that it is hard to confirm whether this scenario actually occurred because it is not clear when each power panel lost in detailed. However, the status of the isolation valves and the flooded condition of station power equipment in the site investigation could suggest the possibility that the theoretical scenario described above had actually occurred. (Operating status of the isolation valves described in Item (2))
For confirming the consistency between the above-mentioned scenario and the information
available related to power, the NRA had investigated the outside and inside of the power supply panels related the DC and AC power in the site.51
As for DC-related power supply panel, the NRA found that the DC distribution center (2)
(controlling power supply)52 was installed in the cable vault room on the 1st floor of the control building, and that there is no traces of flooding in this room. Judging from these findings, the NRA estimated that DC distribution center (2) (controlling power supply) on the 1st floor of the control building had maintained its function without being flooded.
51 The NRA investigated the 1st floor of the Unit 1 turbine building on May 30, 2013. It investigated the 1st floor of the
Unit 1 reactor building, 1st floor of the turbine building, 1st and 2nd floors of the control building, and 1st and 2nd floors of the service building in the on-the-spot investigation conducted on February 6 and 7, 2014.
52 DC distribution center (2) (A) (controlling power supply) 125 V (1A) in Fig. 5.4

78
TEPCO also checked the situation in the control building’s basement at about 18:00 on March 11, 2011, and found that the electrical room (containing DC distribution centers (1) and (3)) was flooded up to the upper portion of the weir (0.3 to 0.4 meter high). Therefore, it is highly possible that DC distribution centers (1) (controlling power supply) and (3) (driving power supply) on the first basement level of the control building lost their functions due to flooding. At present, the basement of the control building is full of contaminated water and no one could go there to investigate. Accordingly, the NRA could not determine the exact time when DC distribution centers (1) and (3) lost power in detailed.
As for AC-related power panel, the transient phenomena recorder data showed that M/C1C lost
its function earlier than M/C1D. In the site investigation, the NRA confirmed that M/C1D near the equipment hatch was further on the south side by about 4 meters than M/C1C on the 1st floor of the turbine building, or further inside from the equipment hatch (through which the tsunami entered), and that flooding heights of 1 meter and 0.9 meter were found for M/C1C and M/C1D, respectively. These findings are consistent with the function loss time obtained from the data. The NRA estimated that it is highly possible that AC power supply systems "C" and "D" lost their functions at different time.
Similarly, the NRA estimated that other station electrical equipment had lost their functions at different time.
From the layout of the station electrical equipment and the flooding situation, the NRA could
presume a scenario of operation as follows: In case DC distribution center (1) (controlling power supply) in the room that was found to be flooded shipped water and lost its function, DC power for the rupture detection circuit would also be lost. At the same time, a signal to close the isolation valves would be sent via a control circuit (receiving its control power from DC distribution center (2) located in a room that was not flooding). Although it is possible that DC distribution center (3) (driving power supply) shipped water and lost its function, the time of its function loss was later than that of DC distribution center (1) (controlling power supply), and thus the DC-driven isolation valves were possibly closed. The AC-driven isolation valves were operated in a similar manner. (Operating status of the isolation valves described in Item (2))

79
Figure 5.4 Layout of IC-related Station Electrical Equipment (on the 1st floor and 1st basement level)
1st floor
1st basement level
1st floor of the turbine building
1st basement level of the turbine building
1st floor of the reactor building
DC distribution center (2) (B) (controlling power supply)
Radioactive Waste Building
1st basement level of the control building
Control building Service building
Service building entrance
Hatch
Large equipment service entrance
DC distribution center (2) (A) (controlling power supply)
※ MCCID (480 V) is on the 3rd floor of the reactor building.
DC distribution center (1) (A) (controlling power supply) 125 V-1A
DC distribution center (1) (B) (controlling power supply) 125 V-1B
Battery room
DC power panel (A) 1A 125 V
DC distribution center (3) (A and B) (driving power supply) 125 V (1A, 1B)
DC power panel (B) 1B 125V
Ceiling hatch

80
Figure 5.5 Flooding and Isolation Valve Closing Operation (image)
(2) Operating status of isolation valves of IC 1) Operating status of DC-driven isolation valves of IC (a) Site investigation and actual operator actions
The NRA confirmed that the isolation valve (2B) outside the PCV in the IC system “B”, driven by the DC power supply, was "Fully Closed" in the site investigation (see Fig. 5.6).
The NRA assembled the sequence of the opening/closing status of the isolation valve (2B) operated by operators immediately after the earthquake from TEPCO’s Investigation Committee report and the Government Investigation Committee’s interim report, the NRA consequently estimated that the isolation valve (2B) had been "Fully Open" until the tsunami arrived the plant site (height: O.P. + 10 m), and was not closed by operators after that time (see Table 5.1).
Similarly, the isolation valve (2A) in IC system “A” had been "Fully Open" until the tsunami arrived plant site (height: O.P. + 10 m) and was not closed by operators. However, when some of the valve lamps on the control panel were turned on for the DC-driven isolation valve of IC system “A” (at about 18:18) after the loss of all power, it was reported that the “Fully Closed” lamp turned on.53 After that, the operator opened the isolation valve (2A). This could consistent with the 53 At about 18h:18m on March 11, 2011, an operator observed that lamps for supply pipe isolation valve (2A) and
return pipe isolation valve (3A) went on in green (indicating “Fully Closed”) on the control panel in the main control room. (Lamps for the isolation valves of IC system “B” and isolation valves (1A and 4A) of IC system “A” remained off.) The operator opened isolation valves (2A and 3A) at about 18h:18m, temporarily closed isolation valve (3A) at 18h:25m, and then open isolation valve (3A) again. [“TEPCO”s Investigation Committee Report on the Fukushima
D/G (Emergency diesel generator) Battery
DC
pow
er
pane
l
Cha
rger
pa
nel
MC
C (M
otor
co
ntro
l cen
ter)
P/C
(Pow
er c
ente
r)
M/C
(Met
al-e
nclo
sed
switc
hgea
r
Emergency AC bus
Disposition of power panels R/B: Reactor Building C/B: Control Building T/B: Turbine Building C/B B1F: Underground level
possibly flooded
Isolation valves (MO-1A and 1B)
Isolation valves (MO-4A and 4B)
D/G: (Emergency diesel generator) M/C: (High pressure power panel): Power for the station’s
high voltage circuit P/C: (Power center): Power for the station’s low voltage
circuit MCC: (Motor control center): Power for the station’s
small-capacity, low voltage circuits DC: DC power supply
AC power supply
DC power supply
Valve closing circuit Valve closing circuit
"Valve Close" signal circuit
Control circuit
"Break detection“ signal
Rupture detection circuit
Isolation valves (MO-2B and 2A)
Isolation valves (MO-3B and 3A)
DC
dist
ribut
ion
cent
er (1
) (c
ontro
lling
pow
er
supp
ly)
DC
dist
ribut
ion
cent
er (2
) (c
ontro
lling
pow
er
supp
ly)
MC
C (M
otor
co
ntro
l cen
ter)
DC
dist
ribut
ion
cent
er (3
) (d
rivin
g po
wer
su
pply
)
DC power loss
"Detection" signal
"Valve Close" signal
Power feeding
Power feeding Valve Close operation
Flooded
Not flooded and function held
Power feeding Valve Close operation

81
isolation valve (2A) being "Fully Open" confirmed in the site investigation.
The NRA therefore estimated that the isolation valves (2A and 2B) were closed after flooding of the plant site (height: O.P. + 10 m).
An operator, however, operated to close isolation valve (3A) at 15:34 and isolation valve (3B) at 15:03, and the NRA estimated the valves (3A and 3B) hold the “Closed" status when the plant site (height: O.P. + 10 m) were flooded.
(b) Working mechanism of the DC-driven isolation valves of IC
To detect a break in the IC pipe and isolate the broken line, IC is equipped with a rupture detection circuit, a control circuit and a valve closing circuit to close isolation valves of IC. The system is designed so that each rupture detection circuit receives DC power from DC distribution center (1) in IC system “A” and “B”, each control circuit receives DC power from DC distribution center (2) in IC system “A” and “B”, and that DC power is always supplied to these circuits (Figs. 5.2 and 5.3).
Therefore, in design, there are two type of isolation valve closing logic. Logic A: a rupture detection circuit in an IC system generates a detection signal, or loses its
DC power, then, all DC- and AC-driven isolation valves (four valves in total) of the IC system actuated to close. The sending a detection signal is a transition from "DC current flow on a steady basis" to "no DC current flow." Therefore, in case DC current flowing the rupture detection circuit is lost, the control circuit actuates same as the detection signal is sent (see Fig. 5.7).
The theoretical scenario above-mentioned is equivalent to logic A as DC power is lost when DC distribution center (1) supplying power to the rupture detection circuit loses its function.
Logic B: the DC current flowing the control circuit of one IC system is lost, then, all DC- and
AC-driven isolation valves (eight valves in total) in both IC systems “A” and "B" actuated to close (see Fig. 5.8).
TEPCO reports or other reports showed the possibility of the isolation valves closing as DC
power for a rupture detection circuit is lost.54 In the site investigation, the NRA confirmed that DC distribution center (2) (controlling power
supply) on the 1st floor of the control building was not flooded, and thus the NRA estimated DC power for the control circuit was not lost. Consequently, logic B was not worked.
The NRA therefore estimated that logic A was worked to close DC-driven isolation valves (2A and 2B) of IC.
Nuclear Accident“ (dated June 2012)]
54 "About influences on the Fukushima Daiichi NPS reactor facility by the 2011 Tohoku Earthquake and Tsunami" (September 2011, TEPCO) (p.23), and TEPCO’s Investigation Committee report (June 20, 2012) (p.144)

82
Figure 5.6 Opening Meter for Isolation Valves (2A and 2B) of IC (Photographed in the NRA’s site investigation conducted on
May 31, 2013, and February 26, 2014.)
Figure 5.7 IC Isolation Valve Working Mechanism in case of Rupture Detection Signal Generation (operation logic “A”)
Opening: Fully Open Opening: Fully Closed
<IC system “A” (2A) opening meter> <IC system “B” (2B) opening meter> Photographed by the NRA on February 26, 2014. Photographed by the NRA on May 31, 2013.
Rupture detection
circuit (system “A”) DC distribution center①(A) DC distribution center①(B)
Control circuit (system “A”)
DC distribution Center②(A)
Detection signal Detection signal
Rupture detection
circuit (system “B”)
Switch OFF due to detection signal
Switch OFF due to detection signal
Switch OFF due to detection signal
Switch OFF due to detection signal
Control circuit (system “B”)
DC distribution Center②(B)
Control power supply
Control power supply
Legend
Valve driving motor MO-1B: Fully open MO-4B: Fully open
Valve driving motor MO-2B: Fully open
MO-3B: Fully closed
Valve driving motor MO-1A: Fully open MO-4A: Fully open
Valve driving motor MO-2A: Fully open
MO-3A: Fully closed
Driving power supply Driving power supply
※ For each valve closing circuit, only the close driving circuit is drawn.
Close signal
The valve closing relay coil is excited and the valve closing circuit switch turns ON. As a result, current is applied to the motor
Valve closing circuit
Switch ON due to non-excitation of the relay coil
Source: Partial addition to TEPCO’s Investigation Committee report (June 20, 2012)
【Pattern “A” (at rupture detection signal output)】operation logic ① In IC system “A” pipe, a rupture detection signal is generated and the switch in the control circuit turns OFF. (Detection signal output) ② When the switch turns OFF, DC current to relay coils “A” and "B" is lost, and both coils are placed in a non-excited state. ③ When relay coils “A” and "B" are in a non-excited state, switches “A” and "B" are turned OFF, and relay coils "E" and "F" are placed in a non-excited state. ④ When relay coils "E" and "F" are in a non-excited state, switches "E" and "F" turn ON and current flows through the valve closing circuit. (Close signal output)
Relay coils of the valve closing circuits are in an excited state, the switches of the valve closing circuits close, and current flows though the motors. Thus, all four valves are closed.
※ Similar operation logic is adopted for the control power loss of system “B.”
Relay coil
X: Relay number (A to H) (No excitation: OFF state)
Contacts ON due to excitation of the relay coil Contacts OFF due to non-excitation of the relay coil
Contacts OFF due to excitation of the relay coil Contacts ON due to non-excitation of the relay coil
(No excitation: ON state)
Driving power supply Driving power supply

83
Figure 5.8 IC Isolation Valve Working Mechanism in case of Controlling Power Loss (operation logic “B”)
2) Operating status of AC-driven isolation valves of IC (a) Site investigation, etc.
The isolation valves using AC driving power are installed inside the PCV, but it is difficult to investigate them directly. Thus, at present the NRA cannot directly confirm the opening/closing status of AC-driven isolation valves after the loss of all power.
(b) Transient phenomena recorder data
It has been confirmed that the additional data55 of the transient phenomena recorder includes one-minute intervals data including the behavior of the emergency power system before the loss of all power. From this data until 15:36:59 (data collecting time just before data measurement stopped) , the NRA can confirm the following: (See Fig. 5.9.)
- The voltage of the AC bus (C) (6.9-kV 1C) was almost 0 V between 15:35:59 and 15:36:59.
55 About the addition and correction of "Plant Data on the Fukushima Daiichi Nuclear Power Station at the time of the
Tohoku-Chihou-Taiheiyou-Oki Earthquake" (July 2013, TEPCO website)
Rupture detection
circuit (system “A”) DC distribution center①(A) DC distribution center①(B)
Control circuit (system “A”)
DC distribution Center②(A)
Detection signal Detection signal
Rupture detection
circuit (system “B”)
Switch OFF due to detection signal
Switch OFF due to detection signal
Switch OFF due to detection signal
Control circuit (system “B”)
DC distribution Center②(B)
Control power supply
Control power supply
Legend
Valve driving motor MO-1B: Fully open MO-4B: Fully open
Valve driving motor MO-2B: Fully open
MO-3B: Fully closed
Valve driving motor MO-1A: Fully open MO-4A: Fully open
Valve driving motor MO-2A: Fully open
MO-3A: Fully closed
Control power supply Control power supply
Control power supply Control power supply
※ For each valve closing circuit, only the close driving circuit is drawn.
Close signal
The valve closing relay coil is excited and the valve closing circuit switch turns ON. As a result, current is applied to the motor
Valve closing circuit
Switch ON due to non-excitation of the relay coil
Source: Partial addition to TEPCO’s Investigation Committee report (June 20, 2012)
【Pattern “B” (in case controlling power is lost)】operation logic ① A controlling power supply is lost in the control circuit (system “A”). ② DC current flowing through the control circuit is lost and relay coils "A," "E," "C" and "G" are in non-excited states. ③ When relay coils “A” and "C" are in non-excited states, switch "B" turns OFF and relay coils "F" and "H" are placed in non-excited states. ④ When relay coils "E," "G," "F" and "H" are in non-excited states, switches "E," "G," "F" and "H" are turned ON and current flows to the valve closing circuit. The relay coils of the valve closing circuits are excited and the switches of those circuits close. Current flows through the motors and thus a total of eight valves are closed. ※ Similar operation logic is adopted in case of control power loss in system “B.”
Relay coil
X: Relay number (A to H) (No excitation: OFF state)
Contacts ON due to excitation of the relay coil Contacts OFF due to non-excitation of the relay coil
Contacts OFF due to excitation of the relay coil Contacts ON due to non-excitation of the relay coil
(No excitation: ON state)
Switch OFF due to detection signal

84
- The isolation valves (1B and 4B) of IC were receiving driving power from this AC bus (C). However, these isolation valves indicated a "Closed" or "Current Interrupted" status in this time period. Since AC bus (C) lost power in this period, the NRA estimated that these isolation valves were in the "Current Interrupted” status.
- In the same period, AC bus (D) (6.9-kV, 1D) showed no considerable change in voltage (6.9 kV) and maintained its function.
- In this period, isolation valves (1A and 4A) of IC received its driving power from AC bus (D) and sent (flow current56) an open signal. These valves were in the "Open" status.
- Similarly, in this period, the DC-driven isolation valves (2A and 2B) of IC sent (flow current) an open signal. These valves were in the "Open" status.
- The DC-driven isolation valves (3A and 3B) of IC indicated "Closed" or "Current Interrupted" after these valves were closed at 15;34 for isolation valve (3A) and at 15:03 for isolation valve (3B). This was why the operator closed manually, and the NRA estimated that the isolation valves were "Closed."
The NRA estimated the opening/closing status of AC-driven isolation valves before 15:36:59
based on the items confirmed from additional data collected by the transient phenomena recorder. Since the DC-driven isolation valves (2A and 2B) of IC were "Open" until 15:36:59, the NRA
estimated that it is highly possible 57 that a close signal was not sent due to the loss of DC-controlling power supplied to the rupture detection circuit or control circuit by at least this time.
Judging from the fact that the AC-driven isolation valves (1B and 4B) of IC were disabled to close by 15:36:59 due to the loss of AC bus (C) power that worked as driving power, and that a close signal could not have been possibly generated by that time, the NRA estimated that it highly possible that the AC-driven isolation valves of IC were open until 15:36:59. Note that the AC-driven isolation valves (1Av and 4A) of IC remained open until 15:36:59.
Next, the NRA estimated the opening/closing status of each AC-driven isolation valve after
15:37. As the AC-driven isolation valves (1B and 4B) of IC were disabled to close before 15:36:59
due to the loss of AC bus (C) power that worked as driving power, the NRA estimated that it highly possible 58 that the isolation valves (1B and 4B) remained open after 15:37.
56 When an isolation valve is in the "Closed" status or disabled to close due to the loss of AC bus (C) power that works
as driving power, the "Open" signal is lost (changing its digital value from 1 to 0). 57 It takes up to 15 seconds (for DC-driven valves) or up to 20 seconds (for AC-driven valves) for a fully open isolation
valve to be fully closed. Therefore, the time period required for a fully open isolation value to close after a "Close" signal is received may include a time lag. For example, if a "Close" signal is output a few seconds before 15:36:59, the isolation valves (2A and 2B) hold the "Open" indication. In addition, an AC-driven isolation valve takes more time to close than a DC-driven isolation valve. Accordingly, the isolation valves (2A and 2B) indicating "Open" will not be fully closed.
58 Because the isolation valves (2B and 3B) of IC were "Fully Closed" after the loss of all power, the NRA estimated

85
The AC-driven isolation valves (1A and 4A) of IC were open until 15:36:59 and AC bus (D) working as a driving power supply for those valves maintained its function.
The isolation valves (1A and 4A) were therefore open in case the AC power supply lost its function first after 15:37 or closed in case the DC power supply lost its function first. Since the power loss time is unclear, the NRA cannot determine the opening/closing status of these isolation valves after that time.
Figure 5.1 Transient Phenomena Recorder Data (1C/1D bus voltage of 6 kV, IC_A/B valve)
that IC system "B" was not in operation.
Time data Bus voltage 6.9-kV 1D [AC bus (D)] (V)
IC (system “A”)
Valve 1A Valve 4A Valve 2A Valve 3A
AC bus DC power supply
Open Open Open
Open Open Open Closed / Current
Interrupted
Open Open Open Closed / Current
Interrupted
Closed / Current
Interrupted
Bus voltage 6.9-kV 1C [AC bus (C)] (V)
IC (system “B”)
Valve 1B Valve 4B Valve 2B Valve 3B
AC bus DC power supply
Open Open Open Closed / Current
Interrupted
Closed / Current
Interrupted
Closed / Current
Interrupted
Closed / Current
Interrupted
Closed / Current
Interrupted
Open Open Open
Open
Note 1: "Open" indicates a valve state ("digital value = 1") where an isolation valve is open and current is flowing. "Closed" or "Current Interrupted" indicates a valve state ("digital value = 0") where an isolation valve is closed or current is interrupted.
Note 2: Data was not recorded after 15h:36m:59s when the transient phenomena recorder stopped. Source: Partially modified table contents in "About the addition and correction of Plant Data on the Fukushima Daiichi Nuclear Power Station at the time of the
Tohoku-Chihou-Taiheiyou-Oki Earthquake" (TEPCO, July 17, 2013).
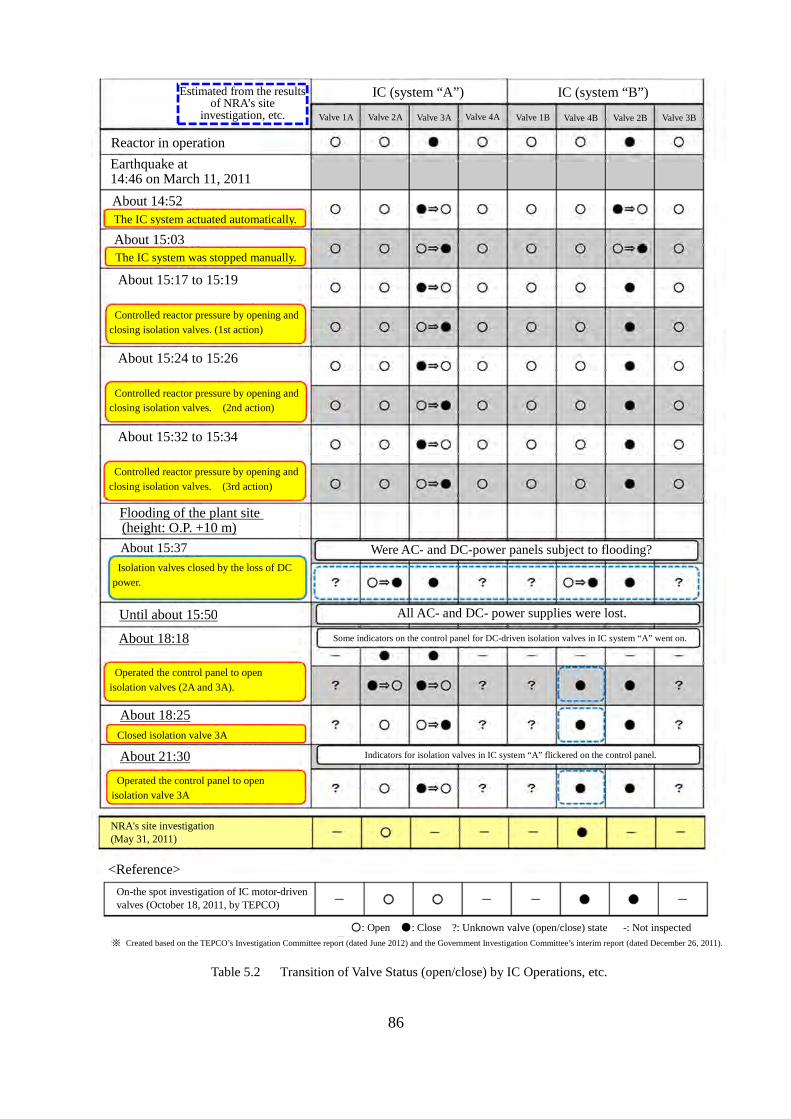
86
Table 5.2 Transition of Valve Status (open/close) by IC Operations, etc.
IC (system “A”)
Valve 1A Valve 2A Valve 3A Valve 4A
IC (system “B”)
Valve 1B Valve 4B Valve 2B Valve 3B
Estimated from the results of NRA’s site
investigation, etc.
Reactor in operation Earthquake at 14:46 on March 11, 2011 About 14:52 The IC system actuated automatically.
About 15:03 The IC system was stopped manually.
About 15:17 to 15:19
Controlled reactor pressure by opening and closing isolation valves. (1st action)
About 15:24 to 15:26
Controlled reactor pressure by opening and closing isolation valves. (2nd action)
About 15:32 to 15:34
Controlled reactor pressure by opening and closing isolation valves. (3rd action)
Flooding of the plant site (height: O.P. +10 m) About 15:37
Isolation valves closed by the loss of DC power.
Until about 15:50
About 18:18
Operated the control panel to open isolation valves (2A and 3A).
About 18:25 Closed isolation valve 3A
About 21:30
Operated the control panel to open isolation valve 3A
NRA's site investigation (May 31, 2011)
On-the spot investigation of IC motor-driven valves (October 18, 2011, by TEPCO) (May 31, 2011)
※ Created based on the TEPCO’s Investigation Committee report (dated June 2012) and the Government Investigation Committee’s interim report (dated December 26, 2011).
<Reference>
Were AC- and DC-power panels subject to flooding?
All AC- and DC- power supplies were lost.
Some indicators on the control panel for DC-driven isolation valves in IC system “A” went on.
Indicators for isolation valves in IC system “A” flickered on the control panel.
: Open : Close ?: Unknown valve (open/close) state -: Not inspected

87
(Reference Information) About data and information that indicate the operating status of the other isolation condenser (IC) system
(1) Condenser tank water level Regarding the levels of water in the condenser tanks holding cooling water of IC, TEPCO
reported that readings of the condenser tanks in IC systems “A” and "B" were 65% and 85%, respectively, based on its site investigation59 (on October 18, 2011)60.
The water levels of the condenser tanks were normally at about 80%61 and no cooling water has been added to the tanks after the earthquake occurred.
In IC system “A,” it was assumed that cooling water was evaporating due to heat exchange
before each IC system was stopped manually by operators after being actuated automatically by "Reactor Pressure High" signal output when the earthquake occurrence, and during three reactor pressure control operations using isolation valve (3A) of IC (see Table 5.1).
Judging from the transient phenomena recorder data, however, the NRA estimated that the
water level dropped about 0.8%62 during IC system “A” operation, resulting in very little cooling water being lost due to evaporation.
"Analysis of reactor behavior while ICs were in operation"63 conducted by JNES also reported that the water levels of the condenser tanks dropped very little during the periods above (when the IC systems were in operation). This apparently implies that heat energy was used to increase the temperature of cooling water in the condenser tanks for a certain period after the IC systems actuated. And from the condenser tank cooling water temperature data (chart), the NRA can confirm that it took some time for the temperature of cooling water in IC system “A” to reach 100°C after the IC systems actuated" (see Fig. 5.10).
The water level data of the system “B” condenser tank recorded by the transient phenomena
recorder also indicated that the water level remained almost at 80% until about 15h:36m on March 11 when all power supplies were lost. However, this water level differs from the water levels
59 Motor-driven isolation valves of IC were confirmed in the field (by TEPCO’s site investigation of IC condenser tank
water levels on October 18, 2011). 60 Attachment 8-9 of TEPCO’s Investigation Committee report (dated June 2012) states: "The water level reading of
the water level meter mounted on the body of the condenser tank might go up about 5% if cooling water in the system “B” condenser tank was not consumed. (The water level reading did not reflect the actual water level due to a meter error.) If said meter error was applied to the water level meter mounted on the body of the system “A” condenser tank, the actual water level of the system “A” condenser tank would be about 60%.
61 Attachment 8-9 of TEPCO’s Investigation Committee report (dated June 2012) 62 At about 14h:45m on March 11, 2011, a system “A” condenser tank water level of 79.7% and a system "B"
condenser tank water level of 79.8% (before the earthquake) were indicated. At about 15h:36m on March 11, 2011, a system “A” condenser tank water level of 78.9% and a system "B" condenser tank water level of 80.2% (before the blackout) were indicated. This water level meter is diaphragm type differential pressure transmitters.
63 Analysis of reactor behavior while the IC systems of Unit 1 at the Fukushima Daiichi NPS were in operation" on December 9, 2011 (partially revised on March 27, 2012 by JNES)

88
confirmed by TEPCO's site investigation. The NRA therefore estimated that this difference might be caused by abnormalities in the water levels due to the hydrogen explosion or other abnormal events (see Fig. 5.11).
(2) Effects of generated hydrogen gas
According to analysis conducted by JNES,64 the Unit 1 reactor core damage began at about 18:00 on March 11. The NRA cannot deny the possibility that hydrogen gas generated in the reactor accumulated in the heat transfer pipe of IC and subsequently blocked heat transfer, even when isolation valves (1A and 4A) installed inside the PCV were not fully close.
Figure 5.9 IC System-related Temperatures in Unit 1
64 Evaluation of the core states of Units 1, 2, and 3 due to the nuclear accident at TEPCO’s Fukushima Daiichi NPS (in
September 2011 by JNES)
The IC system started
automatically.
The IC system was
stopped manually. The recorder stopped.
March 11. March 24.
IC cooling water temperature (system “B”)
IC cooling water temperature (system “B”) reached about 70°C
Condensate temperature in the return pipe (system “B”)
Condensate temperature in the return pipe (system “A”)
IC cooling water temperature (system “A”)
IC cooling water temperature (system “A”) reached 100°C.
Started IC system “A” manually. Reactor pressure control started.
Temperature (
)
Partial addition to the chart of "Plant Data on the Fukushima Daiichi Nuclear Power Station at the time of the Tohoku-Chihou-Taiheiyou-Oki Earthquake" (TEPCO website)

89
Figure 5.10 Transient Phenomena Recorder Data on Condenser Tank Water Levels in IC Systems “A” and "B"
The earthquake occurred. IC systems “A” and "B"
started automatically. IC systems “A” and "B"
were stopped manually.
Opened IC system “A.”
Closed IC system “A.”
Opened IC system “A.”
Closed IC system “A.”
Opened IC system “A.”
Closed IC system “A.” W
ater
leve
l (%
)
Source: Created from "About the addition and correction of Plant Data on the Fukushima Daiichi Nuclear Power Station at the time of the Tohoku-Chihou-Taiheiyou-Oki Earthquake" (dated July 17, 2013, TEPCO website).
Tank water level in IC system “A”
Tank water level in IC system “B”
Time (March 11, 2011)
The tank water level in IC system “A” dropped about 0.8%.
Before the earthquake Before the blackout

90
3.6 Possibility of Criticality in SFP of Unit 3 and White Smoke from Unit 3
3.6.1 The Issue raised by the National Diet Investigation Commission
The National Diet Investigation Commission Report states: "The white smoke generated not only immediately after the hydrogen explosion but on both of the next two days. (Snip) Observation of the spent fuel pool after the explosion shows the possibility of substantial damage to the fuel."
The report also states: "What was the source of the massive amount of heat that caused intermittent water evaporation in the form of white smoke to come out of the pool? The white smoke was generated not only immediately after the hydrogen explosion but on both of the next two days. There was, therefore, the possibility of damaged fuel inside the pool causing temporary massive heat generation."
This report also states: "If the pool was impacted from the hydrogen explosion, it is probable that the used and unspent fuel assemblies were moved closer together and became compressed against one another, creating a condition of criticality inside the pool."
3.6.2 Scope and Objectives of the Analysis The NRA estimated the location of the white smoke and examined the possibility of criticality in the SFP as follows: (1) Possibility of large-scale fuel damage in the SFP
The NRA estimated the possibility of fuel damage based on the photos of the situation of the fuel assemblies, fuel storage racks and other parts in the SFP taken by an underwater camera.
(2) Location of white smoke
The NRA estimated the location of the white smoke based on the aerial photos and thermal distribution image of the Unit 3 building taken from the above immediately after the accident.
(3) Possibility of criticality in the SFP
The NRA estimated the possibility of criticality in SFP based on numerical analyses of the situation of the fuel pit and fuel assemblies in SFP occurred at the accident. 3.6.3 Summary Results and NRA’s Conclusion (1) Summary Results
The NRA estimated the possibility of large-scale fuel damage in the SFP, the location of white smoke and criticality in the SFP as follows: (For details, see Section 3.6.4)
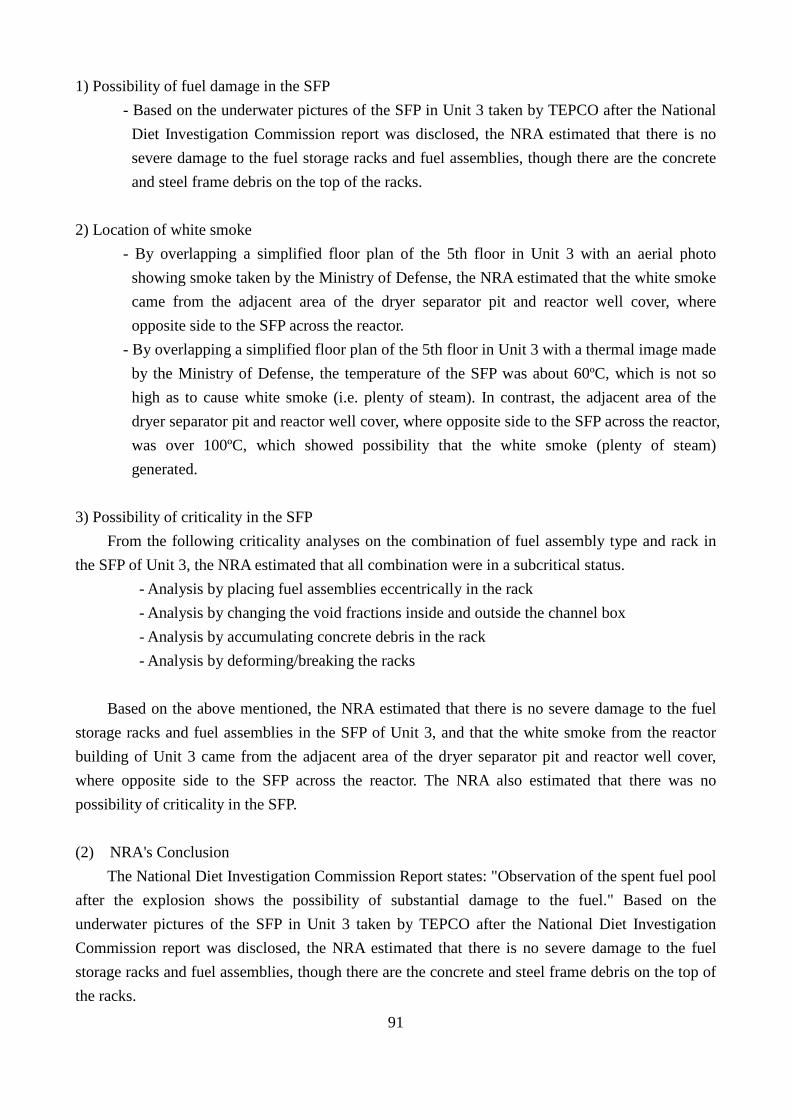
91
1) Possibility of fuel damage in the SFP - Based on the underwater pictures of the SFP in Unit 3 taken by TEPCO after the National
Diet Investigation Commission report was disclosed, the NRA estimated that there is no severe damage to the fuel storage racks and fuel assemblies, though there are the concrete and steel frame debris on the top of the racks.
2) Location of white smoke
- By overlapping a simplified floor plan of the 5th floor in Unit 3 with an aerial photo showing smoke taken by the Ministry of Defense, the NRA estimated that the white smoke came from the adjacent area of the dryer separator pit and reactor well cover, where opposite side to the SFP across the reactor.
- By overlapping a simplified floor plan of the 5th floor in Unit 3 with a thermal image made by the Ministry of Defense, the temperature of the SFP was about 60ºC, which is not so high as to cause white smoke (i.e. plenty of steam). In contrast, the adjacent area of the dryer separator pit and reactor well cover, where opposite side to the SFP across the reactor, was over 100ºC, which showed possibility that the white smoke (plenty of steam) generated.
3) Possibility of criticality in the SFP
From the following criticality analyses on the combination of fuel assembly type and rack in the SFP of Unit 3, the NRA estimated that all combination were in a subcritical status.
- Analysis by placing fuel assemblies eccentrically in the rack - Analysis by changing the void fractions inside and outside the channel box - Analysis by accumulating concrete debris in the rack - Analysis by deforming/breaking the racks
Based on the above mentioned, the NRA estimated that there is no severe damage to the fuel storage racks and fuel assemblies in the SFP of Unit 3, and that the white smoke from the reactor building of Unit 3 came from the adjacent area of the dryer separator pit and reactor well cover, where opposite side to the SFP across the reactor. The NRA also estimated that there was no possibility of criticality in the SFP. (2) NRA's Conclusion
The National Diet Investigation Commission Report states: "Observation of the spent fuel pool after the explosion shows the possibility of substantial damage to the fuel." Based on the underwater pictures of the SFP in Unit 3 taken by TEPCO after the National Diet Investigation Commission report was disclosed, the NRA estimated that there is no severe damage to the fuel storage racks and fuel assemblies, though there are the concrete and steel frame debris on the top of the racks.
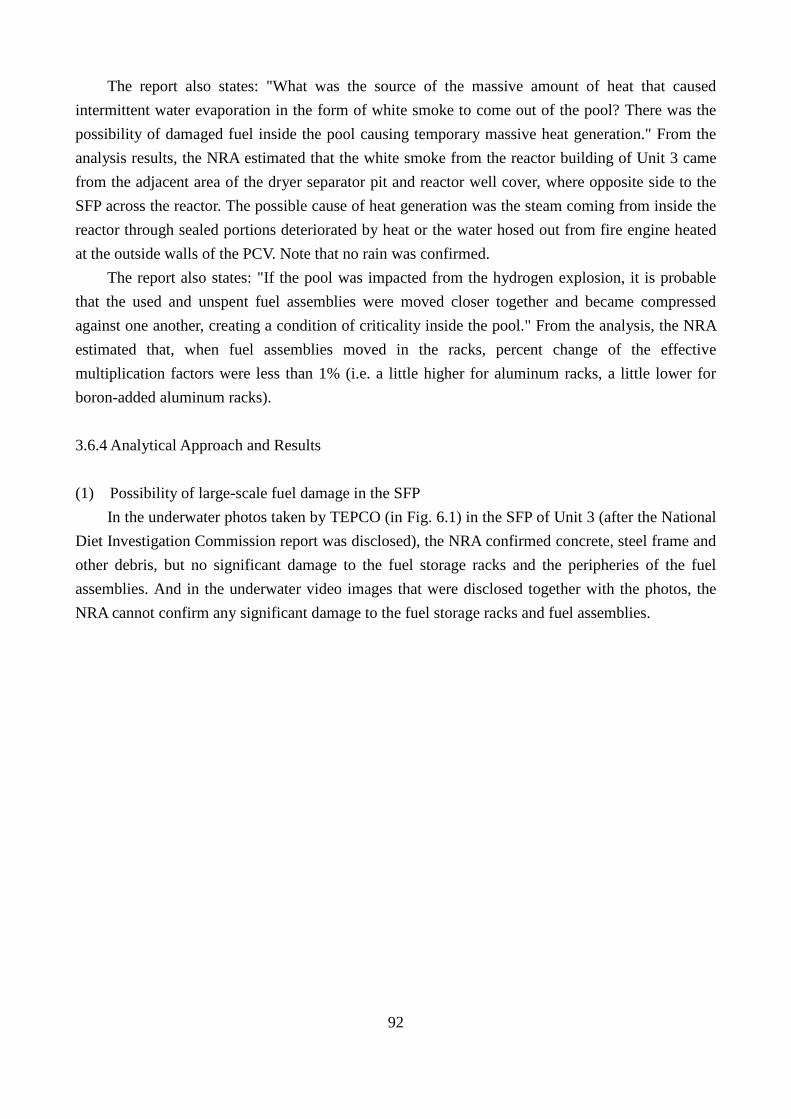
92
The report also states: "What was the source of the massive amount of heat that caused intermittent water evaporation in the form of white smoke to come out of the pool? There was the possibility of damaged fuel inside the pool causing temporary massive heat generation." From the analysis results, the NRA estimated that the white smoke from the reactor building of Unit 3 came from the adjacent area of the dryer separator pit and reactor well cover, where opposite side to the SFP across the reactor. The possible cause of heat generation was the steam coming from inside the reactor through sealed portions deteriorated by heat or the water hosed out from fire engine heated at the outside walls of the PCV. Note that no rain was confirmed.
The report also states: "If the pool was impacted from the hydrogen explosion, it is probable that the used and unspent fuel assemblies were moved closer together and became compressed against one another, creating a condition of criticality inside the pool." From the analysis, the NRA estimated that, when fuel assemblies moved in the racks, percent change of the effective multiplication factors were less than 1% (i.e. a little higher for aluminum racks, a little lower for boron-added aluminum racks). 3.6.4 Analytical Approach and Results (1) Possibility of large-scale fuel damage in the SFP
In the underwater photos taken by TEPCO (in Fig. 6.1) in the SFP of Unit 3 (after the National Diet Investigation Commission report was disclosed), the NRA confirmed concrete, steel frame and other debris, but no significant damage to the fuel storage racks and the peripheries of the fuel assemblies. And in the underwater video images that were disclosed together with the photos, the NRA cannot confirm any significant damage to the fuel storage racks and fuel assemblies.

93
画像②拡大 画像③拡大
Figure 6.1 Inside Views in the SFP of Unit 3
Source: TEPCO document (with photographs taken on February 14, 15, 16 and 18, 2013) edited by the Nuclear Regulation Authority
Fuel rack Photo① View of the lower part of the refueling equipment and the fuel storage racks
Photo② View of the fuel storage racks (photographed from above)
Photo③ Deposits on the fuel storage racks
Photo④ View of the refueling equipment corridor Photo⑤ Refueling equipment bridge
Photo ② Magnified Photo ③ Magnified
:Fuel storage rack :Photographing direction
【Legend】
Portions possibly interfered by the refueling equipment
Fuel preparation equipment
Photo ④
Photo ⑤ Photo ②
Photo ③
Photo ①
North
Cask area
Fuel rack
Fuel rack

94
(2) Location of white smoke 1) Analysis of location of white smoke based on the aerial photos taken from above the roof of the
reactor building of Unit 3 The NRA estimated the location of the white smoke from above the reactor building, by
precisely overlapping a simplified 5th floor plan of the reactor building of Unit 3 on the smoke-showing aerial photos taken by the Ministry of Defense (see Fig. 6.2). Through such image overlapping, the NRA estimated roughly location of the white smoke shown in the photo quoted by the National Diet Investigation Commission (in Fig. 6.3) came from the adjacent area of the dryer separator pit and reactor well cover, where opposite side to the SFP across the reactor.
The NRA also confirmed from another image (in Fig. 6.4) taken by the Ministry of Defense that showed white smoke coming from the adjacent area of the dryer separator pit and reactor well cover, where opposite side to the SFP across the reactor.
Figure 6.2 Location of White Steam rising from the Reactor Building of Unit 3
Source: Photos taken by the Ministry of Defense (on March 18, 2011) and edited by the Nuclear Regulation Authority
Dryer separator pit
Reactor well cover
SFP
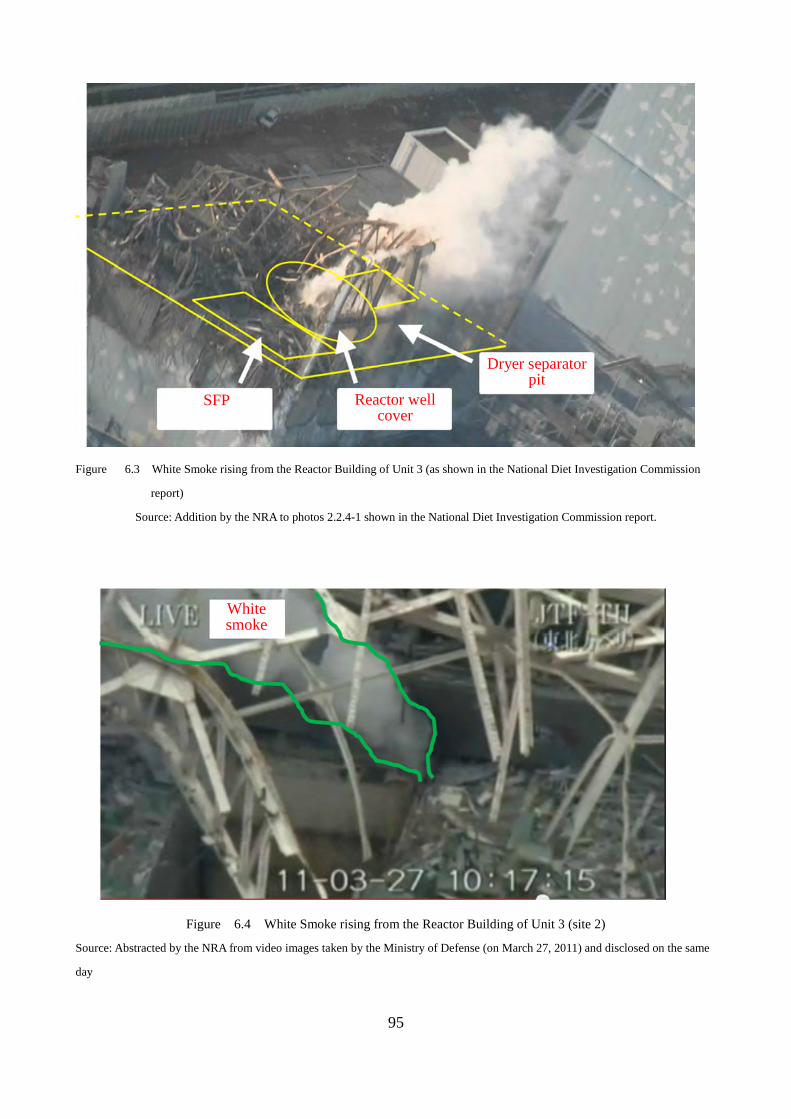
95
Figure 6.3 White Smoke rising from the Reactor Building of Unit 3 (as shown in the National Diet Investigation Commission
report)
Source: Addition by the NRA to photos 2.2.4-1 shown in the National Diet Investigation Commission report.
Figure 6.4 White Smoke rising from the Reactor Building of Unit 3 (site 2)
Source: Abstracted by the NRA from video images taken by the Ministry of Defense (on March 27, 2011) and disclosed on the same
day
Dryer separator pit
Reactor well cover
SFP
White smoke

96
2) Location of the white smoke from thermal images
By overlapping a simplified floor plan of the 5th floor in Unit 3 with a thermal image made by the Ministry of Defense on March 20, 2011, the NRA confirmed that the temperature of the SFP was about 60°C, which is not so high as to cause white smoke (i.e., plenty of steam). In contrast, the adjacent area of the dryer separator pit and reactor well cover, where opposite side to the SFP across the reactor, was over 100°C, which showed possibility that the white smoke (plenty of steam) generated (see Fig. 6.5).
From Items 1) and 2), the NRA estimated that the white smoke came from the adjacent area of the dryer separator pit and reactor well cover, where opposite side to the SFP across the reactor (see Fig. 6.6).
The NRA can hardly presume that the white smoke (steam) came from such a location even if the SFP generated white smoke. In case the SFP was not a smoke generation source, the NRA estimated that the possible cause of heat generation was the steam coming from inside the reactor through sealed portions deteriorated by heat or the water hosed out from fire engine heated at the outside walls of the PCV. Note that no rain was confirmed.
Figure 6.5 Measurement Results of Temprature Distribution in the Reactor Building of Unit 3
Source: Addition of the reactor layout plan and others to the document of the Ministry of Defense (photographed on March 20, 2011)
by the Nuclear Regulation Authority
North
Temperature at the upper part of the SFP: 62°C
Unit 3 reactor
Temperature at upper part of the PCV
Source: "About the measurement results of thermal distribution at the Fukushima Daiichi NPS" obtained by the Technical Research and Development Institute, Ministry of Defense (March 20, 2011)

97
Figure 6.6 Equipment Layout on the Top of the Reactor Building of Unit 3
Source: TEPCO documents edited by the NRA (and photos taken by TEPCO on January 31, 2014)
(Reference Information) Confirmation of steam rising from the Unit 3 reactor building
On July 18, 2013, rising steam was confirmed from the same location near the adjacent area of the dryer separator pit and reactor well cover, where opposite side to the SFP across the reactor. At that time, the SFP temperature was 26.5°C; therefore, the NRA cannot presume that the SFP had generated the smoke (steam). Accordingly, the NRA estimated that steam had been continuously generated and discharged outside from the adjacent area of the dryer separator pit and reactor well cover, where opposite side to the SFP across the reactor, through sealed portions of the PCV.
Although the cause of the rising steam is still being investigated, TEPCO conversely presumes the following: "The steam may be caused by rainwater that flowed through gaps in the shielding plug onto the PCV head and was then evaporated by the heat of the PCV head, and by a gas containing a steam equivalent to a difference in volume (of about 3 m3/h) between the measured quantity of nitrogen gas (16 m3/h) supplied to the RPV and PCV, and that of extracted gas (13 m3/h). And these quantities of steam were cooled into visible white smoke by ambient cold air on the 5th floor of the reactor building when discharged there through the gaps in the shielding plug."65 (3) Possibility of criticality in the SFP 1) Fuel assemblies stored in the SFP
At the time of the accident, the SFP of Unit 3 contained 566 fuel assemblies including 52 new ones. These fuel assemblies are classified into four types. Among those types, the STEP-3A type fuel assemblies are further classified into three types. Therefore, a total of six types are stored (see Table 6.1).
Note that the SFP only holds one STEP-3A leaker fuel assembly.* This fuel assembly had been removed from the reactor to the SFP during the operation cycle due to micro leaks in its cladding and a lower burn-up rate than that of other spent fuel assemblies. And although the reactor of Unit 3 65 Source: TEPCO—"About the confirmation of steam found near the central part of the 5th floor (on the equipment
storage pool side) of the Unit 3 reactor building at the Fukushima Dai-ichi NPS" (Follow-up 14, dated July 26, 2013)
Photographing direction in Fig. 6.4
Dryer Separator pit
SFP Reactor well
cover
Reactor well cover
RPV
PCV
【Sectional image of the Unit 3 well and its vicinity】
Steam recognized here

98
contains 32 MOX fuel assemblies, the SFP contains no MOX fuel assemblies (including new ones). * Leaker fuel: Fuel assembly taken out without any schedule due to micro leaks in its cladding
Table 6.1 Fuel Assemblies stored in the SFP of Unit 3
Fuel assembly type
Quantity Average burn-up [GWd/t]
Average cooling period* [days]
Storage rack
8×8 type 6 24.9 9781 Aluminum rack
Boron-added aluminum rack
8×8BJ type 36 30.0 5535 Aluminum rack
STEP-2 type 148 39.8 1802 Aluminum rack
Boron-added aluminum rack STEP-3A type (spent fuel)
323 43.7 633 Aluminum rack
Boron-added aluminum rack STEP-3A type (leaker fuel)
1 11.8 1287 Boron-added aluminum rack
STEP-3A type (new fuel)
52 - - Aluminum rack
Total 566
* Average cooling period on March 11, 2011
2) Evaluation of criticality in the SFP
To examine whether nuclear criticality occurred in the SFP of Unit 3 at the time of the accident, the NRA took the following four cases that could occur depending on circumstances, and analyzed the effects of reactivity on the accident could occur. Every case assumed an estimation of severe reactivity including impractical conditions (conservative estimation), although actual data on the fuel assembly shape, fuel burn-up levels, and fuel rack materials were used.
- Analysis by placing fuel assemblies eccentrically in the rack - Analysis by changing the void fractions inside and outside the channel box - Analysis by accumulating concrete debris in the rack - Analysis by deforming/breaking the racks
(a) Criticality analyses model
For criticality analyses, the NRA used combinations of two types of fuel storage racks (i.e., aluminum racks, boron-added aluminum racks) and the types of fuel assemblies stored in these racks. Each aluminum rack is a box-like container made of a set of U-shaped components, and has an aperture of a length roughly equivalent to one-third of each side of the box on two opposite sides. In contrast, a boron-added aluminum rack is a box-like container made of plates.
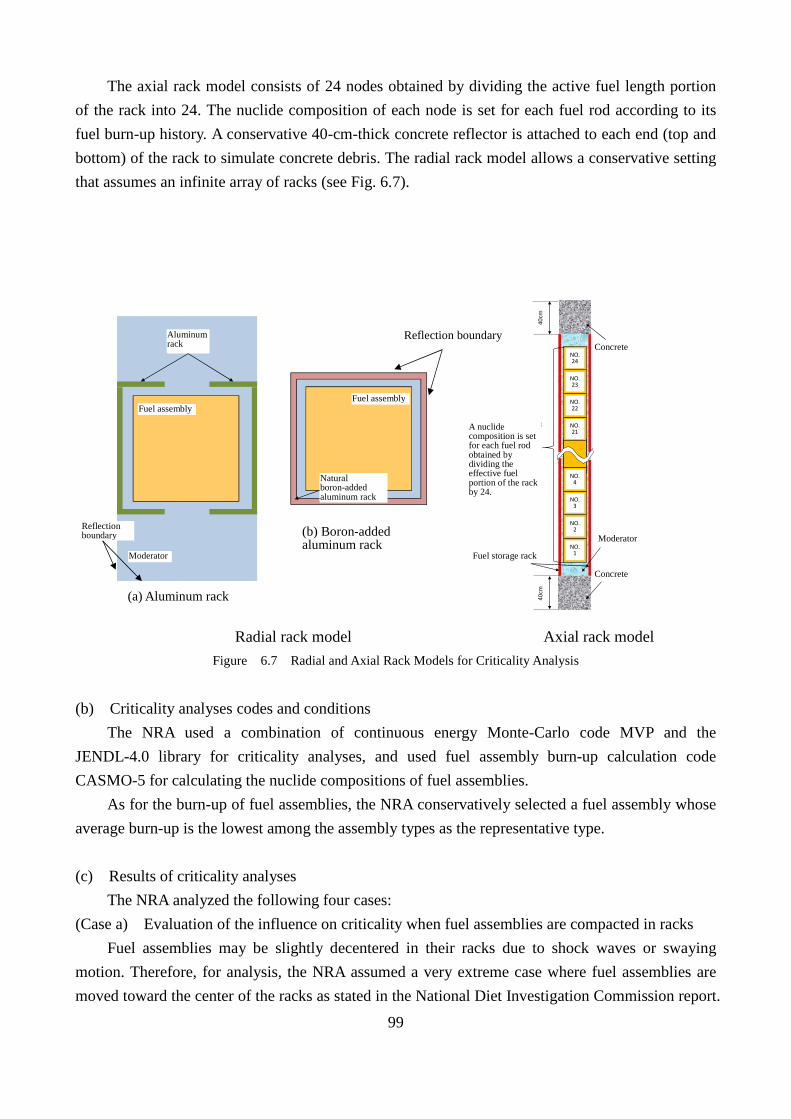
99
The axial rack model consists of 24 nodes obtained by dividing the active fuel length portion of the rack into 24. The nuclide composition of each node is set for each fuel rod according to its fuel burn-up history. A conservative 40-cm-thick concrete reflector is attached to each end (top and bottom) of the rack to simulate concrete debris. The radial rack model allows a conservative setting that assumes an infinite array of racks (see Fig. 6.7).
Radial rack model Axial rack model
Figure 6.7 Radial and Axial Rack Models for Criticality Analysis
(b) Criticality analyses codes and conditions
The NRA used a combination of continuous energy Monte-Carlo code MVP and the JENDL-4.0 library for criticality analyses, and used fuel assembly burn-up calculation code CASMO-5 for calculating the nuclide compositions of fuel assemblies.
As for the burn-up of fuel assemblies, the NRA conservatively selected a fuel assembly whose average burn-up is the lowest among the assembly types as the representative type. (c) Results of criticality analyses
The NRA analyzed the following four cases: (Case a) Evaluation of the influence on criticality when fuel assemblies are compacted in racks
Fuel assemblies may be slightly decentered in their racks due to shock waves or swaying motion. Therefore, for analysis, the NRA assumed a very extreme case where fuel assemblies are moved toward the center of the racks as stated in the National Diet Investigation Commission report.
減速材
燃料集合体
アルミニウム
ラック
(a)アルミラック
反射境界
燃料集合体
天然ボロン入り
アルミニウムラック
(b)ほう素入りアルミラック
反射境界NO.24
NO.23
NO.22
NO.21
NO.1
NO.2
NO.3
NO.4
40cm
40cm
燃料貯蔵ラック
燃料有効部
を24分割。
各ノード毎、
燃料棒毎に
核種組成を
設定。
コンクリート
コンクリート
減速材
A nuclide composition is set for each fuel rod obtained by dividing the effective fuel portion of the rack by 24.
Reflection boundary
Fuel assembly Fuel assembly
Aluminum rack
Moderator
Reflection boundary
(a) Aluminum rack
(b) Boron-added aluminum rack
Natural boron-added aluminum rack
Concrete
Fuel storage rack
Moderator
Concrete

100
Based on this assumption, the NRA analyzed and evaluated the influence on criticality (see Fig. 6.8).
The aluminum rack is an over moderated system. Accordingly, the effective multiplication factor is increased by moving the fuel assemblies toward the center of their racks, though the effect is minimal. Conversely, the boron-added aluminum rack is a under moderated system that decreases the effective multiplication factor when fuel assemblies are moved toward the center of their respective racks.
In either of these cases, the effective multiplication factor is ca. 0.7 when the fuel assemblies are moved toward the center of their racks. Therefore, the NRA evaluated that sub criticality is retained (see Table 6.2).
(a) Criticality analyses model (moving fuel assemblies toward the center of an aluminum rack)
(Case b) Criticality analyses model (moving fuel assemblies toward the center of a boron-added aluminum rack)
Figure 6.8 Criticality Analyses Models of Fuel Assemblies Compaction towards the Rack Center

101
Table 6.2 Effective Multiplication Factors when Fuel Assemblies forced to Center Compaction
(a) Aluminum rack
Fuel assembly type Effective multiplication factor
Difference Centered in rack node
Compacted toward rack center
STEP-3A new fuel 0.744 0.747 0.38%
STEP-3A spent fuel 0.719 0.722 0.40%
STEP-2 spent fuel 0.684 0.687 0.50%
8X8BJ spent fuel 0.681 0.684 0.46%
8X8 spent fuel 0.725 0.728 0.37%
(b) Boron-added aluminum rack
Fuel assembly type Effective multiplication factor
Difference Centered in rack node
Compacted toward rack center
STEP-3A spent fuel 0.714 0.713 -0.07%
STEP-2 spent fuel 0.680 0.680 -0.09%
8X8 spent fuel 0.719 0.718 -0.17% (Case b) Evaluation of the influence on criticality when changing void fractions inside and outside
the channel box When the Fukushima Daiichi accident occurred, the SFP lost its cooling and coolant injection
functions. If such a state continued for a lengthy time, boiling voids would occur due to decay heat. However, the decay heat level in Unit 3 is low, so the NRA cannot presume that the void fraction in the SFP would increase even if SFP water was so saturated as to generate voids. Here, however, the NRA assumed an extreme case where the void fraction was vastly increased for evaluating the influence on criticality. In addition, the NRA also assumed a very conservative case where void fraction inside and outside the channel box was changed simultaneously (see Fig. 6.9).
In the case of an aluminum rack, when voids are only generated in the channel box, the effective multiplication factor monotonously decreases with increase of void fraction (see Fig. 6.10 (a)). Conversely, when voids are generated inside and outside the channel box simultaneously, the effective multiplication factor increase in a high void fraction ranges (see Fig. 6.10 (b)). However, the NRA evaluated that sub criticality can be maintained even in the optimum moderation state. Note that it is considered that almost no voids can exist outside the channel box as no fuel exists outside the channel box. Nevertheless, for the case with the void fraction outside the channel box is
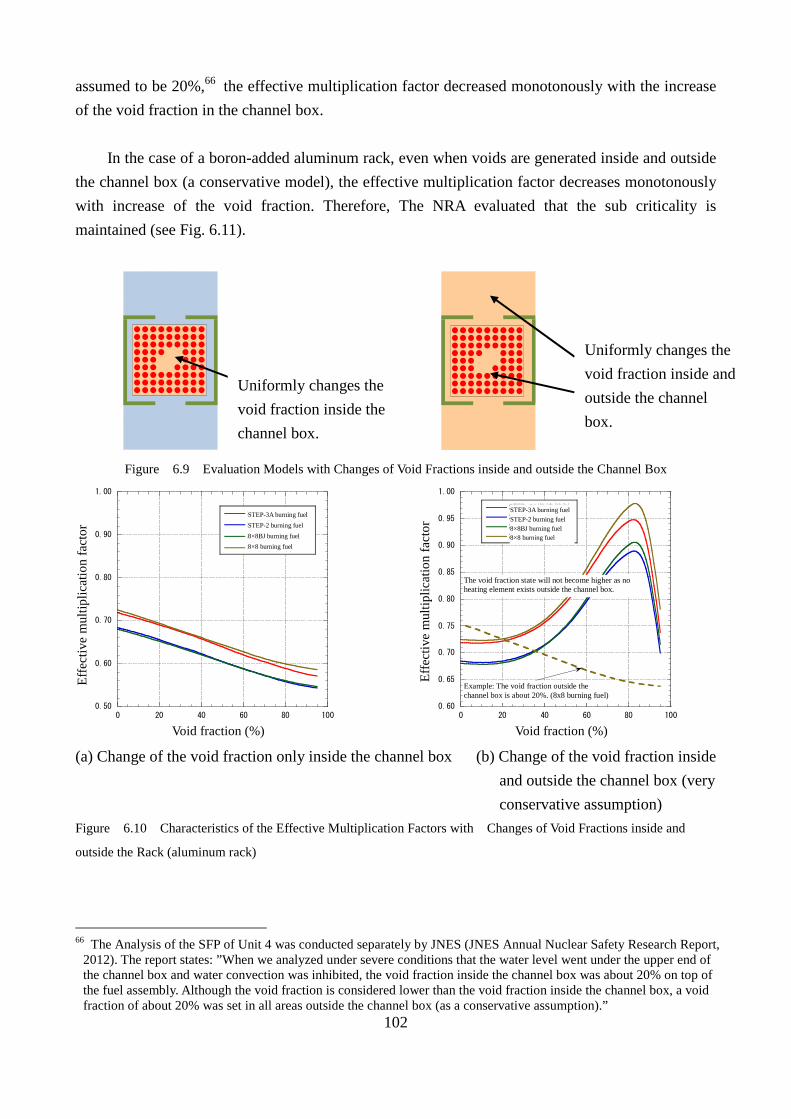
102
assumed to be 20%,66 the effective multiplication factor decreased monotonously with the increase of the void fraction in the channel box.
In the case of a boron-added aluminum rack, even when voids are generated inside and outside
the channel box (a conservative model), the effective multiplication factor decreases monotonously with increase of the void fraction. Therefore, The NRA evaluated that the sub criticality is maintained (see Fig. 6.11).
Figure 6.9 Evaluation Models with Changes of Void Fractions inside and outside the Channel Box
(a) Change of the void fraction only inside the channel box (b) Change of the void fraction inside
and outside the channel box (very conservative assumption)
Figure 6.10 Characteristics of the Effective Multiplication Factors with Changes of Void Fractions inside and
outside the Rack (aluminum rack)
66 The Analysis of the SFP of Unit 4 was conducted separately by JNES (JNES Annual Nuclear Safety Research Report,
2012). The report states: ”When we analyzed under severe conditions that the water level went under the upper end of the channel box and water convection was inhibited, the void fraction inside the channel box was about 20% on top of the fuel assembly. Although the void fraction is considered lower than the void fraction inside the channel box, a void fraction of about 20% was set in all areas outside the channel box (as a conservative assumption).”
0.50
0.60
0.70
0.80
0.90
1.00
0 20 40 60 80 100
STEP-3A燃焼燃料
STEP-2燃焼燃料
8X8BJ燃焼燃料
8X8燃焼燃料
実効
増倍率
ボイド率(%)
0.60
0.65
0.70
0.75
0.80
0.85
0.90
0.95
1.00
0 20 40 60 80 100
STEP-3A燃焼燃料STEP-2燃焼燃料8X8BJ燃焼燃料8X8燃焼燃料
実効
増倍率
ボイド率(%)
チャンネルボックス外には発熱体がないので高ボイド率状態になることはない。
チャンネルホックス外ボイド率20%の例(8×8燃焼燃料)
Uniformly changes the void fraction inside the channel box.
Uniformly changes the void fraction inside and outside the channel box.
STEP-3A burning fuel STEP-2 burning fuel 8×8BJ burning fuel 8×8 burning fuel
STEP-3A burning fuel STEP-2 burning fuel 8×8BJ burning fuel 8×8 burning fuel
The void fraction state will not become higher as no heating element exists outside the channel box.
Example: The void fraction outside the channel box is about 20%. (8x8 burning fuel)
Effe
ctiv
e m
ultip
licat
ion
fact
or
Effe
ctiv
e m
ultip
licat
ion
fact
or
Void fraction (%) Void fraction (%)
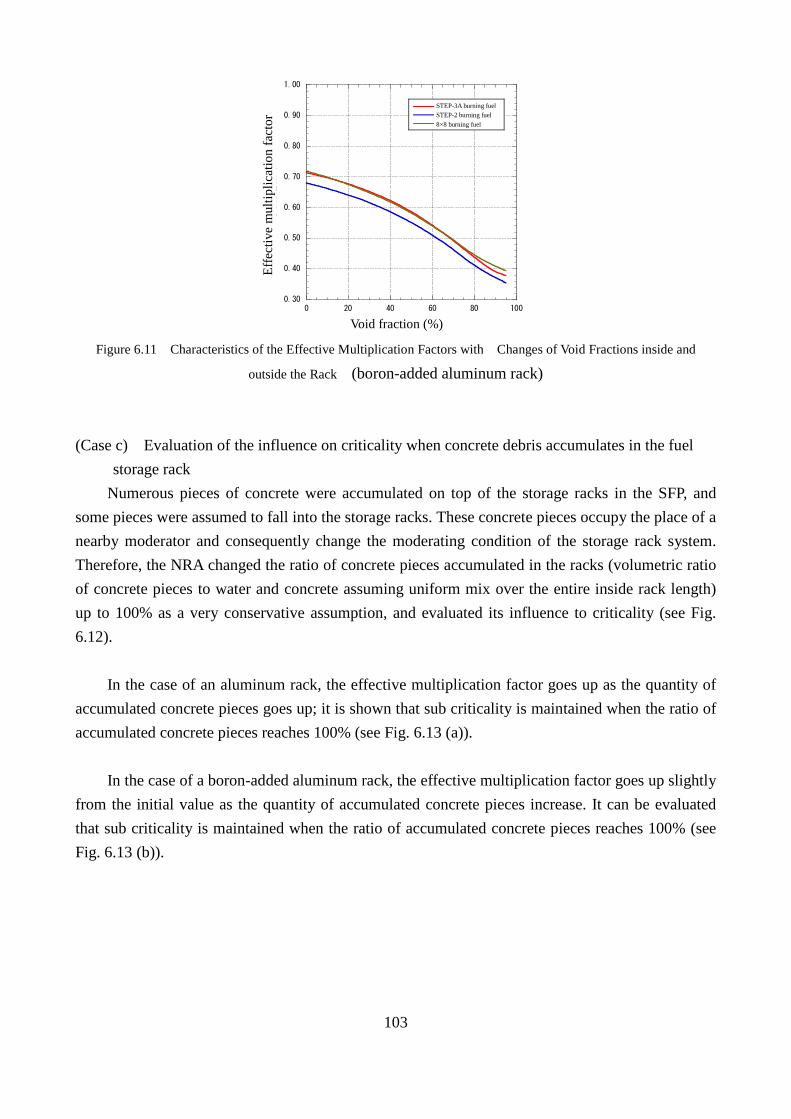
103
Figure 6.11 Characteristics of the Effective Multiplication Factors with Changes of Void Fractions inside and
outside the Rack (boron-added aluminum rack)
(Case c) Evaluation of the influence on criticality when concrete debris accumulates in the fuel
storage rack Numerous pieces of concrete were accumulated on top of the storage racks in the SFP, and
some pieces were assumed to fall into the storage racks. These concrete pieces occupy the place of a nearby moderator and consequently change the moderating condition of the storage rack system. Therefore, the NRA changed the ratio of concrete pieces accumulated in the racks (volumetric ratio of concrete pieces to water and concrete assuming uniform mix over the entire inside rack length) up to 100% as a very conservative assumption, and evaluated its influence to criticality (see Fig. 6.12).
In the case of an aluminum rack, the effective multiplication factor goes up as the quantity of
accumulated concrete pieces goes up; it is shown that sub criticality is maintained when the ratio of accumulated concrete pieces reaches 100% (see Fig. 6.13 (a)).
In the case of a boron-added aluminum rack, the effective multiplication factor goes up slightly
from the initial value as the quantity of accumulated concrete pieces increase. It can be evaluated that sub criticality is maintained when the ratio of accumulated concrete pieces reaches 100% (see Fig. 6.13 (b)).
0.30
0.40
0.50
0.60
0.70
0.80
0.90
1.00
0 20 40 60 80 100
STEP-3A燃焼燃料STEP-2燃焼燃料8X8燃焼燃料
実効
増倍率
ボイド率(%)
Effe
ctiv
e m
ultip
licat
ion
fact
or STEP-3A burning fuel
STEP-2 burning fuel 8×8 burning fuel
Void fraction (%)

104
Figure 6.12 Evaluation Model with Change of Concrete Pieces Accumulated in the Rack
(a) When fuel assemblies are installed in an aluminum rack (b) When fuel assemblies are installed in a boron-added aluminum rack
Figure 6.13 Characteristics of the Effective Multiplication Factors with Change of Concrete Pieces Accumulation in
the Rack
(Case d) Evaluation of the influence on criticality when the fuel storage rack is deformed or
broken According to a hydrogen explosion in Unit 3, a great deal of debris including steel frames fell
into the SFP. The falling steel frames and other debris could damage some racks in the SFP (small-scale damage) (see Fig. 6.14 (a)). Therefore, the NRA evaluated the degree to which the ratio of this small-scale damage affects criticality. For evaluation, the NRA made an extreme conservative model in which all external surfaces of only the rack are broken, with an assumption that the fuel assemblies are intact when all external rack surfaces are broken (see Fig. 6.14 (b)).
In the case of a boron-added aluminum rack, the NRA estimated that the increment of change for the effective multiplication factor is large prior to the ratio of break being about 40% (about 1.7 meters), but sub criticality can be maintained (see Fig. 6.15). Note that the increment of change for the effective multiplication factor is very small when only one rack surface is broken.
燃料集合体
0.65
0.70
0.75
0.80
0.85
0.90
0.95
1.00
0.0 20.0 40.0 60.0 80.0 100.0
STEP-3A新燃料STEP-3A燃焼燃料STEP-2 燃焼燃料8X8BJ 燃焼燃料8X8 燃焼燃料
実効
増倍率
コンクリートの堆積割合(%)
コンクリート堆積割合が100%となったとしても未臨界は維持できる。
0.65
0.70
0.75
0.80
0.85
0.90
0.95
1.00
0.0 20.0 40.0 60.0 80.0 100.0
STEP-3A燃焼燃料
STEP-2 燃焼燃料8X8 燃焼燃料
実効
増倍率
コンクリートの堆積割合(%)
Changing the quantity of concrete pieces accumulated in the rack
燃料集合体Fuel assembly Fuel assembly
STEP-3Anew fuel STEP-3A burning fuel STEP-2 burning fuel 8×8BJ burning fuel 8×8 burning fuel
STEP-3Anew fuel STEP-2 burning fuel 8×8 burning fuel
Effe
ctiv
e m
ultip
licat
ion
fact
or
Ratio of accumulated concrete pieces (%) Ratio of accumulated concrete pieces (%)
Effe
ctiv
e m
ultip
licat
ion
fact
or
Subcriticality can be maintained even when the ratio of accumulated concrete pieces reaches 100%.
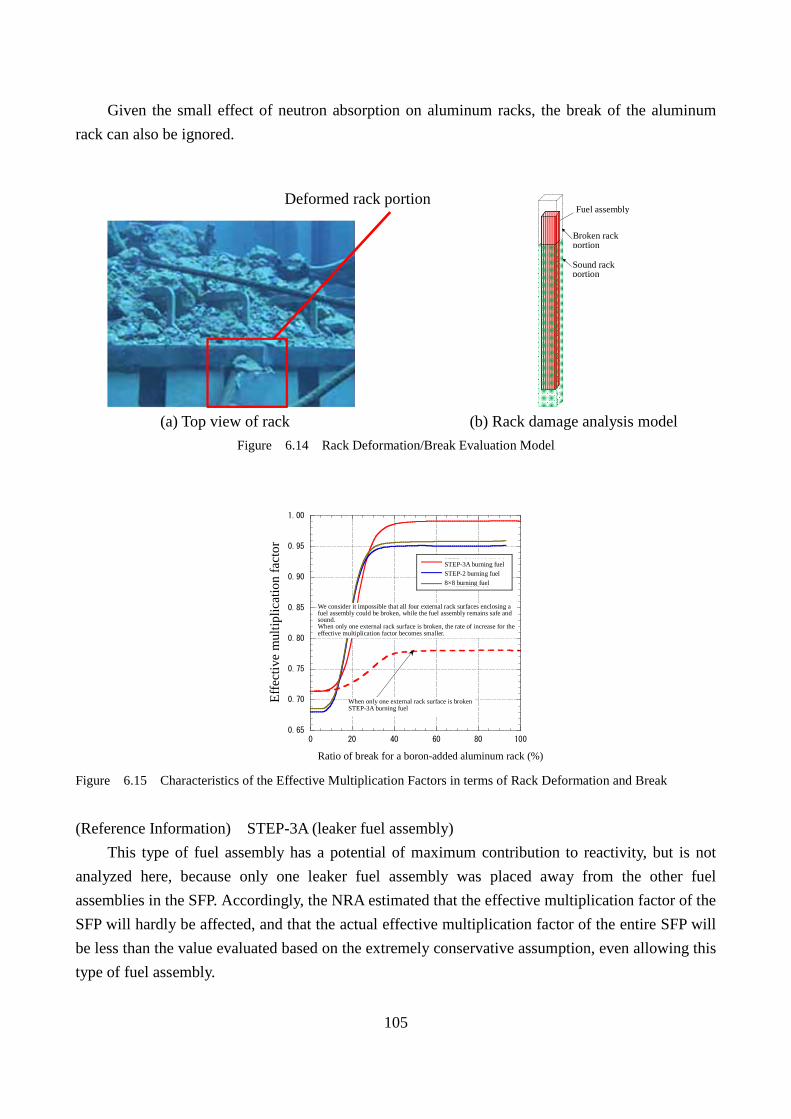
105
Given the small effect of neutron absorption on aluminum racks, the break of the aluminum
rack can also be ignored.
(a) Top view of rack (b) Rack damage analysis model
Figure 6.14 Rack Deformation/Break Evaluation Model
Figure 6.15 Characteristics of the Effective Multiplication Factors in terms of Rack Deformation and Break
(Reference Information) STEP-3A (leaker fuel assembly) This type of fuel assembly has a potential of maximum contribution to reactivity, but is not
analyzed here, because only one leaker fuel assembly was placed away from the other fuel assemblies in the SFP. Accordingly, the NRA estimated that the effective multiplication factor of the SFP will hardly be affected, and that the actual effective multiplication factor of the entire SFP will be less than the value evaluated based on the extremely conservative assumption, even allowing this type of fuel assembly.
ラック
破損部分
燃料
集合体
ラック
健全部分
0.65
0.70
0.75
0.80
0.85
0.90
0.95
1.00
0 20 40 60 80 100
STEP-3A燃焼燃料
STEP-2燃焼燃料
8X8燃焼燃料
実効
増倍率
ほう素入りアルミラックの破損割合(%)
ラックの1面のみが破損した場合STEP-3A燃焼燃料
集合体を囲むラックの4面すべてが破損し、燃料のみが健全とは考えにくい。1面のみ破損した場合の実効増倍率の増加率は小さくなる。
Deformed rack portion Fuel assembly
Broken rack portion
Sound rack portion
Effe
ctiv
e m
ultip
licat
ion
fact
or
STEP-3A burning fuel STEP-2 burning fuel 8×8 burning fuel
Ratio of break for a boron-added aluminum rack (%)
We consider it impossible that all four external rack surfaces enclosing a fuel assembly could be broken, while the fuel assembly remains safe and sound. When only one external rack surface is broken, the rate of increase for the effective multiplication factor becomes smaller.
When only one external rack surface is broken STEP-3A burning fuel
106
3.7 Hydrogen Explosion in the Reactor Building of Unit 4
3.7.1 The Issue raised by the National Diet Investigation Commission
As issues to be investigated regarding the hydrogen explosion in the reactor building of Unit 4, the National Diet Investigation Commission report lists the quantity of hydrogen related the hydrogen explosion in the reactor building of Unit 4, the quantity of hydrogen generated by the radiolysis of water in the SFP of Unit 4.
The TEPCO Investigation Committee report and other reports state that the hydrogen
explosion in the reactor building of Unit 4 was presumably caused by hydrogen that came from the vent flow of the PCV of Unit 3 and accumulated there. The TEPCO report states that the piping of the Standby Gas Treatment System (SGTS) of Unit 4 merged with the piping of the SGTS of Unit 3 near the main stack, and that the vent flow containing the hydrogen of Unit 3 could flow into Unit 4 through the merging portion of the main stack.
Regarding the generation of hydrogen by the radiolysis of water in the SFP of Unit 4, the
National Diet Investigation Commission Report states: "Studies by JAEA and the University of Tokyo point out that at higher water temperatures where air bubbles can be observed, the amount of hydrogen gas generated is multiplied by digits. They state that 13.7m3 of hydrogen would be capable of producing detonating gas, considering the volume of Unit 4. This is an amount that could be generated within one day if water boiling temperature in the pool continued, where hydrogen generation per day at that temperature could reach 18.1m3."
The report also states: "The exploded hydrogen could have come from Unit 3 as well as the Unit 4 spent fuel pool, but no quantitative evaluation can be given at this stage."
The Government Investigation Committee Final Report conversely states: "This opinion which
points out that the hydrogen gas generated by the radiolysis of water in the Unit 4 SFP might cause a hydrogen explosion, which was quoted in the National Diet Investigation Commission report warrants consideration; however it is unlikely that this was the main cause for the explosion, taking into account the damage to Unit 4, particularly that this does not coincide with that fact the explosion likely occurred near the southwest side of the fourth floor of the Unit 4 R/B and the damage conditions."
3.7.2 Scope and Objectives of the Analysis The NRA estimated a main hydrogen source that caused the hydrogen explosion in the reactor building of Unit 4 as follows: (1) Hydrogen generation sources and hydrogen gas inflows from outside

107
The NRA estimated the possible generation sources of hydrogen gas that caused the hydrogen explosion in the reactor building of Unit 4, e.g. the reactor of Unit 4, the SFP of Unit 4, etc. The NRA also estimated the possible hydrogen sources from outside Unit 4 based on site investigations: Standby Gas Treatment System(SGTS) piping connected between the Unit 3 and Unit 4 reactor buildings, and SGTS filter trains. (2) Location of the hydrogen explosion
The NRA estimated that the location of the hydrogen explosion in Unit 4 based on the result of the site investigation related the damage condition of the air supply and exhaust ducts, floor, ceiling and walls in the reactor building of Unit 4. (3) Quantity of hydrogen gas reacted in the explosion
The NRA estimated the quantity of the hydrogen gas based on the result of above-mentioned item (2). 3.7.3 Summary Results and NRA’s Conclusion (1) Summary Results
The NRA estimated the hydrogen generation sources and hydrogen gas inflows from outside, location of the hydrogen explosion and quantity of hydrogen gas reacted in the explosion as follows: (For details, see Section 3.7.4.)
1) Hydrogen generation sources and hydrogen gas inflows from outside
- As for hydrogen gas that caused the hydrogen explosion in Unit 4, the NRA estimated that the hydrogen generated in Unit 3 entered(back flow) into the reactor building of Unit 4 through the SGTS piping of Unit 3 via the SGTS piping of Unit 4 together with vent gas while venting in Unit 3.
- The fuel assemblies in the SFP of Unit 4 have been fully submerged. There was no zirconium-water reaction or no generation of a large amount of hydrogen gas with this reaction.
2) Location of the hydrogen explosion
- The NRA estimated that the hydrogen gas flowed upstairs and spread there through the exhaust duct connected to the SGTS on the 2nd floor of the reactor building of Unit 4.
- The NRA estimated that a huge explosion occurred at least in the southwest part of the 4th floor, based on the damage of the floor and ceiling. The NRA also estimated that it is possible that the explosions occurred in the northwest part of the 3rd floor and on the 5th floor based on the damage of the floor, ceiling and wall.
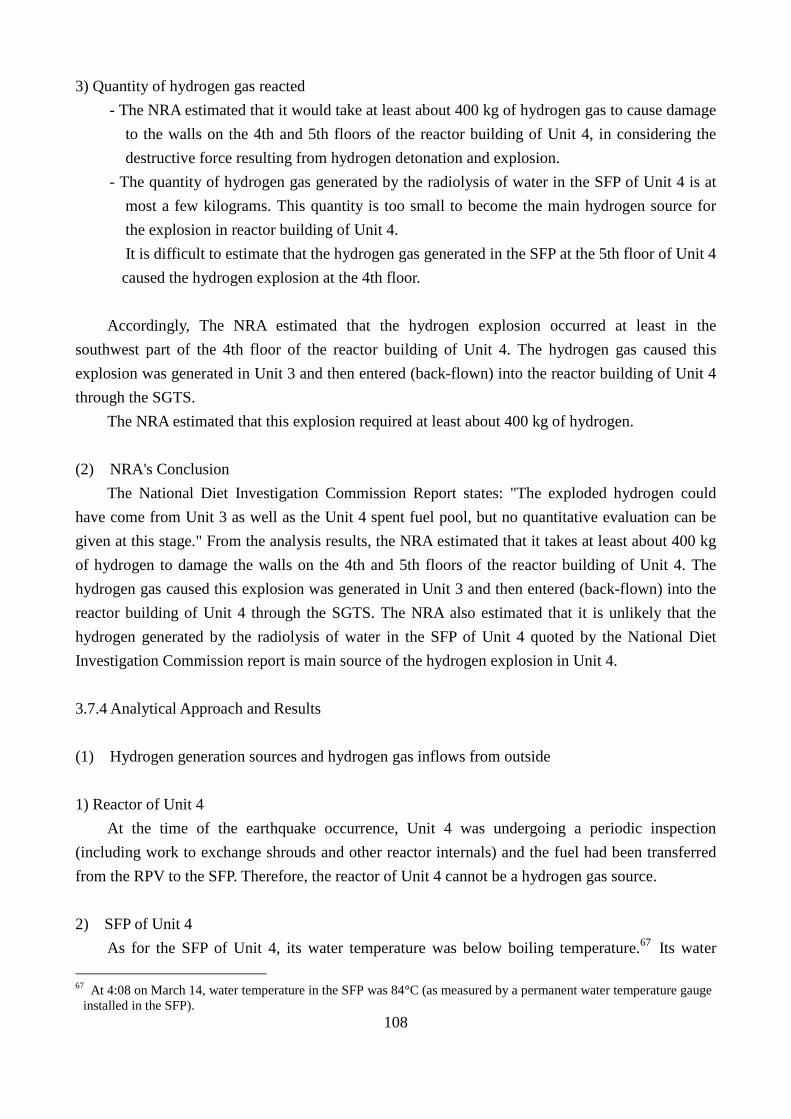
108
3) Quantity of hydrogen gas reacted - The NRA estimated that it would take at least about 400 kg of hydrogen gas to cause damage
to the walls on the 4th and 5th floors of the reactor building of Unit 4, in considering the destructive force resulting from hydrogen detonation and explosion.
- The quantity of hydrogen gas generated by the radiolysis of water in the SFP of Unit 4 is at most a few kilograms. This quantity is too small to become the main hydrogen source for the explosion in reactor building of Unit 4.
It is difficult to estimate that the hydrogen gas generated in the SFP at the 5th floor of Unit 4 caused the hydrogen explosion at the 4th floor.
Accordingly, The NRA estimated that the hydrogen explosion occurred at least in the
southwest part of the 4th floor of the reactor building of Unit 4. The hydrogen gas caused this explosion was generated in Unit 3 and then entered (back-flown) into the reactor building of Unit 4 through the SGTS.
The NRA estimated that this explosion required at least about 400 kg of hydrogen.
(2) NRA's Conclusion The National Diet Investigation Commission Report states: "The exploded hydrogen could
have come from Unit 3 as well as the Unit 4 spent fuel pool, but no quantitative evaluation can be given at this stage." From the analysis results, the NRA estimated that it takes at least about 400 kg of hydrogen to damage the walls on the 4th and 5th floors of the reactor building of Unit 4. The hydrogen gas caused this explosion was generated in Unit 3 and then entered (back-flown) into the reactor building of Unit 4 through the SGTS. The NRA also estimated that it is unlikely that the hydrogen generated by the radiolysis of water in the SFP of Unit 4 quoted by the National Diet Investigation Commission report is main source of the hydrogen explosion in Unit 4.
3.7.4 Analytical Approach and Results (1) Hydrogen generation sources and hydrogen gas inflows from outside 1) Reactor of Unit 4
At the time of the earthquake occurrence, Unit 4 was undergoing a periodic inspection (including work to exchange shrouds and other reactor internals) and the fuel had been transferred from the RPV to the SFP. Therefore, the reactor of Unit 4 cannot be a hydrogen gas source. 2) SFP of Unit 4
As for the SFP of Unit 4, its water temperature was below boiling temperature.67 Its water 67 At 4:08 on March 14, water temperature in the SFP was 84°C (as measured by a permanent water temperature gauge
installed in the SFP).

109
level was sufficiently high as to completely submerge all the fuel assemblies,68 as was visually observed from above by helicopter after the hydrogen explosion in the reactor building of Unit 4.
The results 69 of observing the appearances of fuel assemblies in the SFP, and the analysis of nuclides in the SFP reveal that many fuel assemblies had not been damaged.
Judging from these findings, the NRA estimated that even at the time of occurrence of hydrogen explosion in Unit 4, all fuel assemblies in the SFP were completely submerged, and that there was no zirconium-water reaction or incidental generation of a large amount of hydrogen.
The quantity of hydrogen generated by radiolysis will be explained next. (See (3) 3).)
3) Hydrogen gas inflows from outside The reactor building of Unit 4 is equipped with a normal heating, ventilating and air
conditioning (HVAC) system that includes air supply and exhaust equipment to always ventilate the inside of the reactor building, and an SGTS with a filter unit to remove radioactive materials that may leak into the reactor building, while maintaining air pressure lower than atmospheric pressure in the reactor building in case of a nuclear accident (see Fig. 7.1).
The HVAC system was designed to close in case of failure,70 so that the normally open
isolation valves would close automatically in case their power is lost. The NRA therefore estimated that the isolation valves were close when the emergency power system was lost caused by Fukushima Daiichi accident.
The SGTS was designed to open in case of failure, so that the normally closed isolation valves open automatically in case their power is lost. Accordingly, the NRA estimated that the isolation valves were open when the emergency power system was lost.
68 In the afternoon of March 16, a Japan Self-Defense Force helicopter observed and took video images of the operating
floor of Unit 4 and its vicinity from the air, and visually confirmed that all fuel assemblies were completely submerged in the SFP.
69 The NRA visually confirmed that all fuel assemblies were in the racks. As a result of the nuclide analysis of SFP water, the NRA found that the concentration of 137cesium in the SFP of Unit 4 (93 Bq/cm3 in specimens sampled on April 12) was at least two digits lower than that in the SFPs of Units 1 to 3 (1.4 x 10⁴ to 1.5 x 10⁵ Bq/cm3 in specimens sampled on April 16 to June 22).
70 The isolation valves of HVAC and the SGTS are air-driven butterfly valves, and work to close or open in case power to a solenoid valve for supplying instrumentation air is lost. By the way, this air-supplying solenoid valve receives power from the emergency AC power supply.

110
Figure 7.1 Block Diagram of the SGTS of Unit 4 (overview)
The PCV vent on Unit 3 is designed to exhaust gas from the main stack via the rupture disk
and the SGTS pipe of Unit 3 71 (see Fig. 7.2).
71 The SGTS of Unit 3 is equipped with a backflow preventing damper on the main stack side (output side). This
damper prevents the exhaust fan from rotating backward in case of gas backflow. It is not used to isolate the SGTS when the PCV is vented. However, this damper is closed in case power supply is lost, and is assumed to possibly work to suppress gas backflow into the reactor building. Conversely, the SGTS of Unit 4 is not equipped with such a damper.
From reactor building
Exhaust duct
SGTS pipe
Normal-use HVAC (exhaust equipment)
Open / Open / Close Close
Close / Open Close / Open
Close / Open Close / Open Close / Open
SGTS pipe
Close / Open Close / Open Close / Open
Close / Close
pressure suppression chamber
From drywell
PCV vent line Rupture disk
High efficiency filter
High efficiency filter
SGTS filter train “A”
SGTS filter train “B”
Main stacks for Units 3 and 4
SGTS pipe for Unit 3
Example of valve states Normal standby / Power loss
Close / Close Exhaust fan

111
Figure 7.2 Block Diagram of the Vent Line of Unit 3 (overview)
The SGTS pipe of Unit 3 however was connected to the SGTS pipe of Unit 4 before the main
stack. Note that the operating procedures for the severe nuclear accident of Unit 3 do not include a procedure to close the SGTS output valve of Unit 4 (on the main stack side; "*" marked in Fig. 7.1) and other valves for isolation when the RCV is vented. Consequently, exhaust gas cannot be prevented from entering Unit 4. The NRA therefore estimated that gases containing hydrogen discharged by the PCV ventilation in Unit 3 flowed into the reactor building of Unit 4 via the SGTS
Reactor building
Exhaust duct
SGTS pipe
Normal-use HVAC (exhaust equipment)
Open / Open / Close Close
Close / Open Close / Open
Close / Open Close / Open Close / Open
SGTS pipe
Close / Open Close / Open
Close / Open
Close / Close
pressure suppression chamber
From drywell
To main stacks of Units 3 and 4
Rupture disk
High efficiency filter
HEPA filter
SGTS filter train “A”
SGTS filter train “B”
Main stacks for Units 3 and 4
SGTS pipe for Unit 4
Gravity damper
Close / Close
HVAC machine room
Exhaust fan
HVAC machine room
Lock and open
Close / Close
Close / Close
Close / Close
PCV vent line
Reactor building
Close / Close
Close / Close
Example of valve states Normal standby / Power loss
Filter train Air operation valve Motor-driven valve
Exhaust fan
Dumper
R
P
V

112
pipe of Unit 4.72 TEPCO disclosed this possible backflow of hydrogen from Unit 3 on September of 2011,73 and also investigated the radiation levels of the filter trains of this SGTS in its site investigation.74 Note that NRA confirmed that this TEPCO investigation (which did not consider background influences) had certain points needing improvement in terms of measuring points.
To examine this possibility of hydrogen gas backflow from Unit 3, NRA measured the radiation levels of the SGTS filter trains in Unit 4 that consisted of multiple filters to remove radioactive materials, in consideration of TEPCO's site investigation problems noted above75(see Fig. 7.3).
As a result of the site investigation, NRA confirmed that, among multiple high-efficiency filters in the filter trains, the radiation levels on the downstream side (facing the main stack) were at least two digits higher than those on the upstream side (facing the reactor building) (see Table 7.1).
The NRA estimated that the higher radiation levels suggest a flow of gas containing radioactive materials through the SGTS pipe of Unit 4, from the end of the main stack back to the end of the reactor building.
From about 15h:36m on March 12 to about 4h:08m on March 14, TEPCO was performing
power restoration work in Units 3 and 4, and other work in the turbine building of Unit 4. As for work in the reactor building of Unit 4, the disaster restoration group of Nuclear
Emergency Response Headquarters reportedly tried to confirm the situation regarding the SFP of Unit 4 at about 10:30 on March 14, but could not reach the operating floor (i.e., 5th floor of the reactor building) as radiation levels in the reactor building were very high just prior to the explosion in the reactor building of Unit 4.76
Judging from the above, the NRA estimated that the reactor building of Unit 4 was possibly filled internally with a gas containing radioactive materials at about 10h:30m on March 14.
At the time of the earthquake occurrence, Unit 4 was undergoing a periodic inspection and fuel assemblies were being transferred from the RPV to the SFP. The NRA therefore can hardly presume that gases containing radioactive materials generated in the reactor of Unit 4 would leak into the reactor building. Similarly, the fuel assemblies were completely submerged in the SFP and thus the NRA can hardly presume that radioactive materials were discharged from there.
72 As for this gas inflow route, TEPCO’s Investigation Committee report (dated June 20, 2012, p.263) states: "A gas
line was formed to enable vented gas to flow from the PCV of Unit 3 to Unit 4 through the SGTS pipe. Hydrogen gas generated in the reactor of Unit 3 flowed into and accumulated in Unit 4, and then exploded there."
73 "About influences on the Fukushima Daiichi NPS reactor facility by the 2011 Tohoku Earthquake and Tsunami" (partially corrected by TEPCO on September 9 and 28, 2011)
74 On August 25, 2011, TEPCO measured the radiation levels of the SGTS filter trains of Unit 4 and obtained about 6.7 mSv/h and 5.5 mSv/h from the downstream filters, and about 0.1 mSv/h and 0.1 mSv/h from the upstream filters.
(Results of TEPCO’s dose level measurements at the SGTS for Unit 4 at the Fukushima Daiichi NPS (dated August 27, 2011))
75 On August 7, 2013, The NRA conducted the site investigation in the reactor building of Unit 4. For the measurement of radiation levels, the NRA adopted a method of reducing the effects of radiation coming from areas excluding the filter trains (by using a compact radiation measuring instrument enclosed in a cylindrical lead protector), in order to improve measurement accuracy.
76 TEPCO’s Investigation Committee report (dated June 20, 2012, p. 264)

113
It is therefore rational to assume that the gas containing radioactive materials came from Unit 3.
Upstream side (facing the Unit
4 reactor building)
Downstream side (facing the
main stack)
System “A” 16.7 μSv/h(Fig. 7.3①) 1500 μSv/h(Fig. 7.3②)
System “B” 38.0 μSv/h(Fig. 7.3③) 1220 μSv/h(Fig. 7.3④)
Table 7.1 Measurement Results of the Radiation Levels of High Efficiency Filters (obtained by the Nuclear
Regulation Authority on August 7, 2013)
Figure 7.3 Structure of the SGTS Filter Train
(2) Location of a hydrogen explosion 1) Traces of Damages of air supply and exhaust ducts in the reactor building
HVAC system in the reactor building of Unit 4 consists of two independent air supply and exhaust ducts. The SGTS pipe in the HVAC machine room on the 2nd floor of the turbine building is connected to the exhaust duct in the reactor building via the SGTS filter train and exhaust fan (see Figs. 7.4 and 7.5).
Demister Warming heater
Prefilter
HEPA filter HEPA filter
Charcoal filter heater Charcoal filter
Facing the Unit 4 reactor Facing the main stack
Points of measurement (on filter train surfaces)
for SGTS “A” for SGTS “B” ※ The filter train shows internal structures (hatched) in its appearance.

114
Figure 7.4 Diagram of the Reactor Building Pipe of Unit 4 (overview)
Figure 7.5 Layout of the Normal-use HVAC System and the SGTS
The NRA confirmed the situations of the SGTS in the HVAC machine room, as well as the
supply and exhaust ducts on each floor of the reactor building in the field.77 Through this site investigation the NRA confirmed the following results. 77 The NRA conducted a site investigation in the reactor building and the turbine building of Unit 4 on July 10 to 12
and August 6 to 7, 2013, and on February 6 to 7, 2014, respectively.
From HVAC in the Radioactive waste disposal building
Main stacks of Units 3 and 4
HVAC of Unit 3 SGTS of Unit 3
Normal-use HVAC Air supply equipment
Exhaust equipment
Outside air
Reactor building Supply duct
Exhaust duct
Purge exhaust pipe
PCV purge system
PCV vent line
Rupture disk
HVAC machine room (on the 2nd floor of the turbine building)
Filter train Valve Exhaust fan Dumper
SGTS P C V
Purge air supply pipe
Exhaust fan “B”
Exhaust fan “A”
Filter train "B" Filter train "A"
SGTS pipe
Turbine building (2nd floor)
HVAC machine room
Main control room HVH
Exhaust filter in the Radioactive waste disposal building
Air supply filter in the Radioactive waste
disposal building Exhaust fan in the Radioactive waste
disposal building
Main exhaust fan
Main exhaust filter
Exhaust duct
Main air supply fan
Main air supply filter
Supply duct
Normal-use HVAC (air supply equipment)
Normal-use HVAC (exhaust equipment)
SGTS Reactor building (2nd floor)
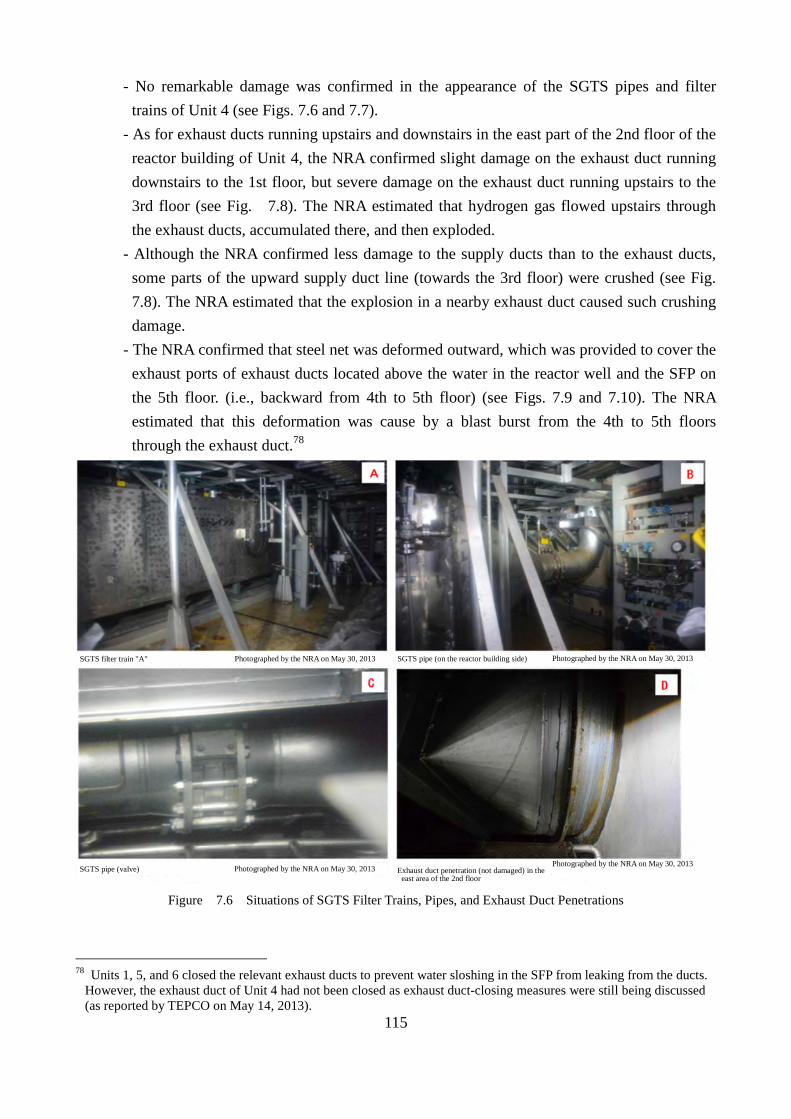
115
- No remarkable damage was confirmed in the appearance of the SGTS pipes and filter trains of Unit 4 (see Figs. 7.6 and 7.7).
- As for exhaust ducts running upstairs and downstairs in the east part of the 2nd floor of the reactor building of Unit 4, the NRA confirmed slight damage on the exhaust duct running downstairs to the 1st floor, but severe damage on the exhaust duct running upstairs to the 3rd floor (see Fig. 7.8). The NRA estimated that hydrogen gas flowed upstairs through the exhaust ducts, accumulated there, and then exploded.
- Although the NRA confirmed less damage to the supply ducts than to the exhaust ducts, some parts of the upward supply duct line (towards the 3rd floor) were crushed (see Fig. 7.8). The NRA estimated that the explosion in a nearby exhaust duct caused such crushing damage.
- The NRA confirmed that steel net was deformed outward, which was provided to cover the exhaust ports of exhaust ducts located above the water in the reactor well and the SFP on the 5th floor. (i.e., backward from 4th to 5th floor) (see Figs. 7.9 and 7.10). The NRA estimated that this deformation was cause by a blast burst from the 4th to 5th floors through the exhaust duct.78
Figure 7.6 Situations of SGTS Filter Trains, Pipes, and Exhaust Duct Penetrations
78 Units 1, 5, and 6 closed the relevant exhaust ducts to prevent water sloshing in the SFP from leaking from the ducts.
However, the exhaust duct of Unit 4 had not been closed as exhaust duct-closing measures were still being discussed (as reported by TEPCO on May 14, 2013).
SGTS filter train "A" Photographed by the NRA on May 30, 2013 SGTS pipe (on the reactor building side) Photographed by the NRA on May 30, 2013
SGTS pipe (valve) Photographed by the NRA on May 30, 2013 Photographed by the NRA on May 30, 2013 Exhaust duct penetration (not damaged) in the east area of the 2nd floor
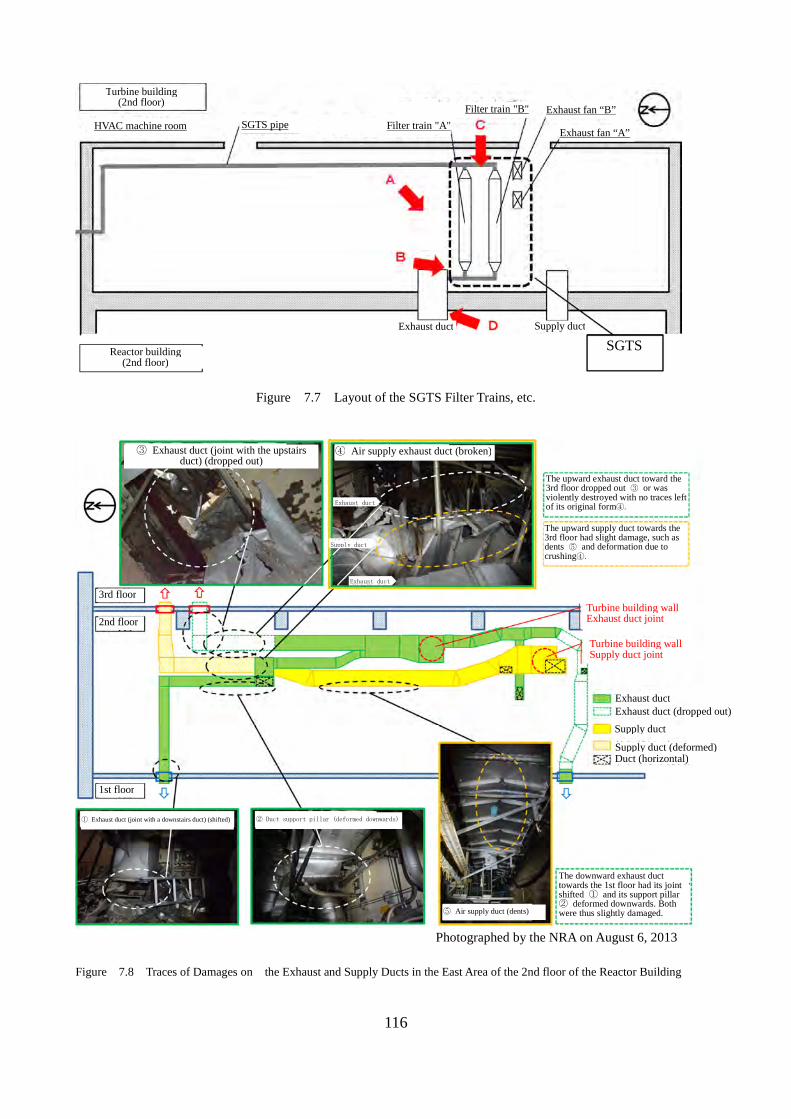
116
Figure 7.7 Layout of the SGTS Filter Trains, etc.
Figure 7.8 Traces of Damages on the Exhaust and Supply Ducts in the East Area of the 2nd floor of the Reactor Building
Photographed by the NRA on August 6, 2013
Exhaust fan “B”
Exhaust fan “A”
Filter train "B" Filter train "A"
SGTS pipe
Turbine building (2nd floor)
HVAC machine room
Exhaust duct Supply duct
SGTS Reactor building (2nd floor)
③ Exhaust duct (joint with the upstairs duct) (dropped out)
④ Air supply exhaust duct (broken)
The upward exhaust duct toward the 3rd floor dropped out ③ or was violently destroyed with no traces left of its original form④.
The upward supply duct towards the 3rd floor had slight damage, such as dents ⑤ and deformation due to crushing④.
Turbine building wall Exhaust duct joint
Turbine building wall Supply duct joint
Exhaust duct Exhaust duct (dropped out) Supply duct
Supply duct (deformed) Duct (horizontal)
The downward exhaust duct towards the 1st floor had its joint shifted ① and its support pillar ② deformed downwards. Both were thus slightly damaged.
3rd floor
2nd floor
1st floor
Exhaust duct
Supply duct
Exhaust duct
① Exhaust duct (joint with a downstairs duct) (shifted) ② Duct support pillar (deformed downwards)
⑤ Air supply duct (dents)
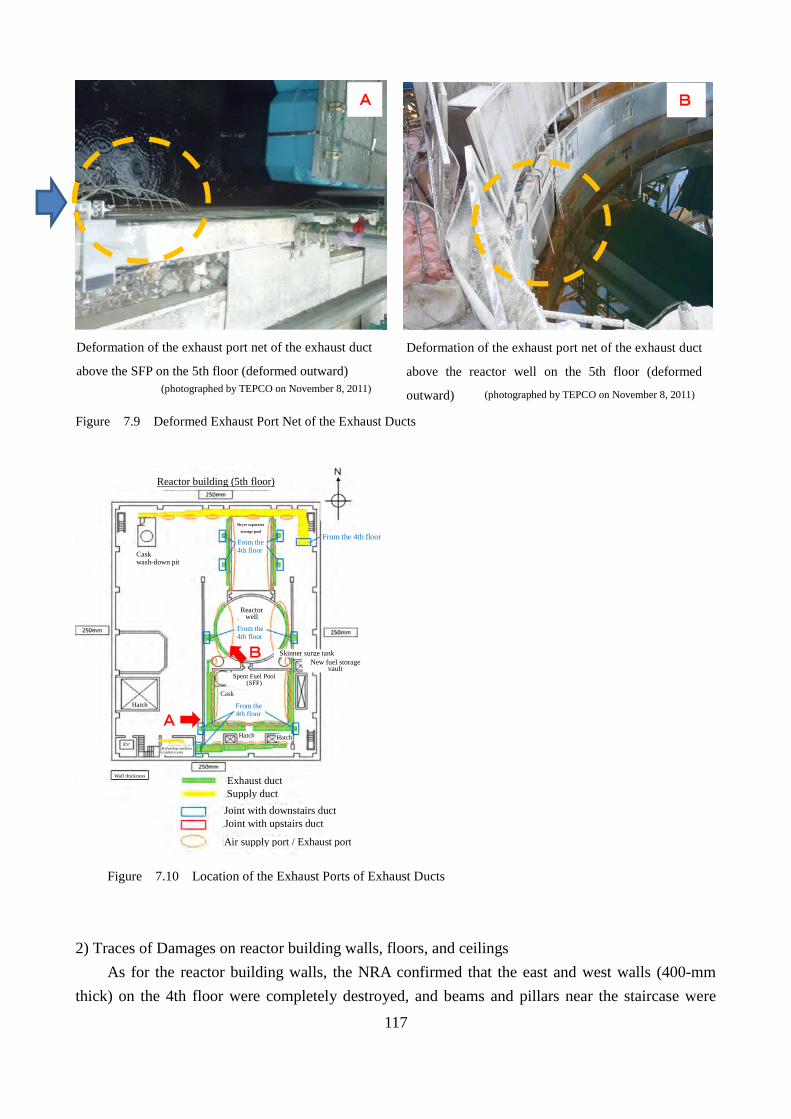
117
Figure 7.9 Deformed Exhaust Port Net of the Exhaust Ducts
Figure 7.10 Location of the Exhaust Ports of Exhaust Ducts
2) Traces of Damages on reactor building walls, floors, and ceilings
As for the reactor building walls, the NRA confirmed that the east and west walls (400-mm thick) on the 4th floor were completely destroyed, and beams and pillars near the staircase were
Deformation of the exhaust port net of the exhaust duct
above the SFP on the 5th floor (deformed outward)
Deformation of the exhaust port net of the exhaust duct
above the reactor well on the 5th floor (deformed
outward) (photographed by TEPCO on November 8, 2011) (photographed by TEPCO on November 8, 2011)
A
B
A B
Exhaust duct
Joint with downstairs duct
Reactor building (5th floor)
From the 4th floor From the 4th floor Cask
wash-down pit
Dryer separator
storage pool
Supply duct
Joint with upstairs duct
Air supply port / Exhaust port
Wall thickness
From the 4th floor
Reactor well
Skinner surge tank New fuel storage
vault Spent Fuel Pool
(SFP) Cask
From the 4th floor
Hatch Hatch
Hatch
Refueling machine control room

118
partially destroyed, but confirmed no damage to the north and south walls (1000-mm thick). The east, west and south walls (250-mm thick) on the 5th floor (excluding the north wall) were also totally or partially destroyed. The NRA also confirmed some damage to beams and pillars near the north and south walls, and the staircase. On the 3rd floor, the NRA confirmed that the walls (550-mm thick) around the north staircase were completely destroyed (see Figs. 7.14 and 7.15).
As for the reactor building floors and ceilings, the NRA confirmed that thinner floors were severely damaged near the exhaust duct, which was severely destroyed. The NRA estimated that this destruction was caused by shock waves and blasts from the explosion of hydrogen that accumulated here via the exhaust ducts, and that particularly intense shock waves and blasts severely destroyed the thinner and structurally weaker portions of the floors.
The NRA confirmed such severe damage as the complete destruction of the west wall, the
ceiling being turned up, and downward deformation of the floor, particularly in the southwest area of the 4th floor (see Fig. 7.11). The NRA therefore estimated that a very strong explosion occurred there. In these places, the NRA confirmed that exhaust and supply ducts had dropped out and been severely destroyed, leaving no traces of their original forms.
In the northwest area of the 3rd floor, the NRA confirmed that the wall west of the staircase was also completely destroyed, with partial through-holes in the floor and exposed steel frames (see Fig. 7.12). As for the exhaust and supply ducts, the NRA confirmed dropped-out or deformed ducts. On the 5th floor, the NRA similarly confirmed that the east, west, and south walls were completely destroyed, the roof partially or totally destroyed in certain areas, and the north portion of the floor deformed downward (see Fig. 7.13). The NRA also confirmed that exhaust and supply ducts were dropped out and severely destroyed, leaving no traces of their original forms. The NRA therefore estimated that a very strong explosion might occur there.

119
Figure 7.11 Traces of Damages on the Reactor Building (floor and ceiling in the southwest area of the 4th floor)
Photographed by TEPCO on November 8, 2011 Photographed by TEPCO on November 8, 2011 Floor damage in the southwest area of the 4th floor Ceiling damage in the southwest area of the 4th floor
Photographed by TEPCO on October 5, 2011 Photographed by TEPCO on October 5, 2011 Floor damage in the southwest area of the 5th floor Floor damage in the southwest area of the 5th floor
(upward-vent reinforcing bars)

120
Figure 7.12 Traces of Damages on the Reactor Building (floor and ceiling in the northwest area of the 3rd floor)
Floor damage in the northwest area of the 3rd floor Photographed by the NRA on July 12, 2013 Photographed by the NRA on February 6, 2014
Close-up view (floor surface)
Close-up view (floor surface)
Ceiling damage in the northwest area of the 2nd floor (directly under the damaged floor in the northwest area of the 3rd floor)
Magnified penetration view (of materials on the 3rd floor that the NRA visually recognized)
Photographed by the NRA on February 6, 2014 Photographed by the NRA on February 6, 2014 Ceiling penetration
Photographed by the NRA on July 12, 2013 Ceiling damage in the northwest area of the 3rd floor (duct damage)
Photographed by TEPCO on March 18, 2011 Complete destruction of the wall west of the staircase in the northwest area of the 3rd floor
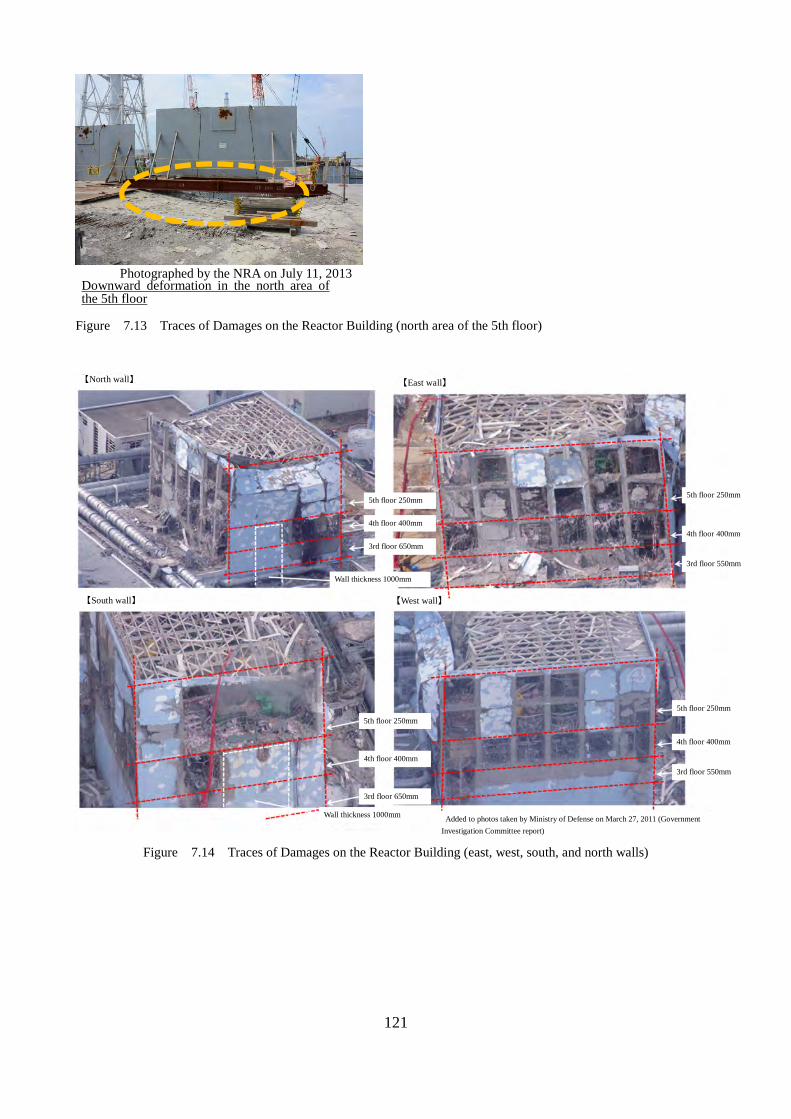
121
Figure 7.13 Traces of Damages on the Reactor Building (north area of the 5th floor)
Figure 7.14 Traces of Damages on the Reactor Building (east, west, south, and north walls)
Downward deformation in the north area of the 5th floor
Photographed by the NRA on July 11, 2013
【North wall】 【East wall】
【South wall】 【West wall】
Wall thickness 1000mm
3rd floor 650mm
4th floor 400mm
5th floor 250mm
3rd floor 550mm
4th floor 400mm
5th floor 250mm
3rd floor 550mm
4th floor 400mm
5th floor 250mm
3rd floor 650mm
4th floor 400mm
5th floor 250mm
Wall thickness 1000mm Added to photos taken by Ministry of Defense on March 27, 2011 (Government Investigation Committee report)

122
Figure 7.15 Traces of Damages on the Reactor Building (floor, ceiling, and walls)
(3) Quantity of hydrogen gas reacted in the explosion 1) Estimating the quantity of hydrogen gas from damage situations of the reactor building of Unit 4
From the damage situations of the outer walls of the reactor building of Unit 4, NRA examined the possibility that hydrogen gas accumulated inside the reactor building caused hydrogen
Reactor building (3rd floor) Reactor building (4th floor)
Reactor building (5th floor)
Exhaust duct (before the accident)
Supply duct (before the accident)
Wall thickness (mm)
Dimensions (mm)
Floor thickness (mm)
* Less damage was found than that to the east, west, and south walls, but surfaces, pillars, and beams were badly damaged.
* The south and north
surfaces of the east and west walls, beams and pillars were partially or completely destroyed.
Damaged floor Completely destroyed wall Damaged wall surface /
partial wall damage
* The north portions of the east and west walls were completely destroyed.
Damaged floor Completely destroyed wall Damaged wall surface /
partial wall damage
Exhaust duct (before the accident)
Supply duct (before the accident)
Wall thickness (mm)
Dimensions (mm)
Floor thickness (mm)
Exhaust duct (before the accident)
Supply duct (before the accident)
Wall thickness (mm)
Dimensions (mm)
Floor thickness (mm)
※ The south wall surface and pillars were almost completely destroyed.
* Less damage was found than that to the east, west, and south walls, but surfaces, pillars, and beams were badly damaged.
* The south and north
surfaces of the east and west walls, beams and pillars were partially or completely destroyed.
Damaged floor Completely destroyed wall Damaged wall surface /
partial wall damage Portion affected by the
explosion
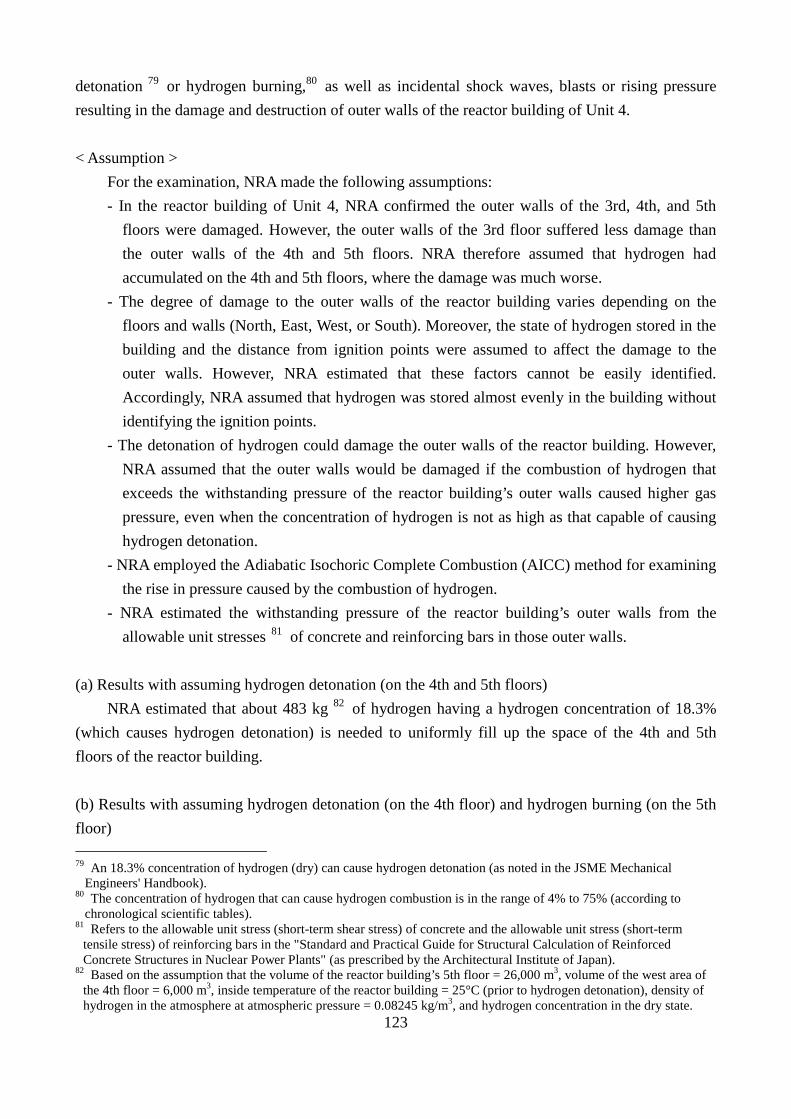
123
detonation 79 or hydrogen burning,80 as well as incidental shock waves, blasts or rising pressure resulting in the damage and destruction of outer walls of the reactor building of Unit 4.
< Assumption >
For the examination, NRA made the following assumptions: - In the reactor building of Unit 4, NRA confirmed the outer walls of the 3rd, 4th, and 5th
floors were damaged. However, the outer walls of the 3rd floor suffered less damage than the outer walls of the 4th and 5th floors. NRA therefore assumed that hydrogen had accumulated on the 4th and 5th floors, where the damage was much worse.
- The degree of damage to the outer walls of the reactor building varies depending on the floors and walls (North, East, West, or South). Moreover, the state of hydrogen stored in the building and the distance from ignition points were assumed to affect the damage to the outer walls. However, NRA estimated that these factors cannot be easily identified. Accordingly, NRA assumed that hydrogen was stored almost evenly in the building without identifying the ignition points.
- The detonation of hydrogen could damage the outer walls of the reactor building. However, NRA assumed that the outer walls would be damaged if the combustion of hydrogen that exceeds the withstanding pressure of the reactor building’s outer walls caused higher gas pressure, even when the concentration of hydrogen is not as high as that capable of causing hydrogen detonation.
- NRA employed the Adiabatic Isochoric Complete Combustion (AICC) method for examining the rise in pressure caused by the combustion of hydrogen.
- NRA estimated the withstanding pressure of the reactor building’s outer walls from the allowable unit stresses 81 of concrete and reinforcing bars in those outer walls.
(a) Results with assuming hydrogen detonation (on the 4th and 5th floors)
NRA estimated that about 483 kg 82 of hydrogen having a hydrogen concentration of 18.3% (which causes hydrogen detonation) is needed to uniformly fill up the space of the 4th and 5th floors of the reactor building.
(b) Results with assuming hydrogen detonation (on the 4th floor) and hydrogen burning (on the 5th floor) 79 An 18.3% concentration of hydrogen (dry) can cause hydrogen detonation (as noted in the JSME Mechanical
Engineers' Handbook). 80 The concentration of hydrogen that can cause hydrogen combustion is in the range of 4% to 75% (according to
chronological scientific tables). 81 Refers to the allowable unit stress (short-term shear stress) of concrete and the allowable unit stress (short-term
tensile stress) of reinforcing bars in the "Standard and Practical Guide for Structural Calculation of Reinforced Concrete Structures in Nuclear Power Plants" (as prescribed by the Architectural Institute of Japan).
82 Based on the assumption that the volume of the reactor building’s 5th floor = 26,000 m3, volume of the west area of the 4th floor = 6,000 m3, inside temperature of the reactor building = 25°C (prior to hydrogen detonation), density of hydrogen in the atmosphere at atmospheric pressure = 0.08245 kg/m3, and hydrogen concentration in the dry state.
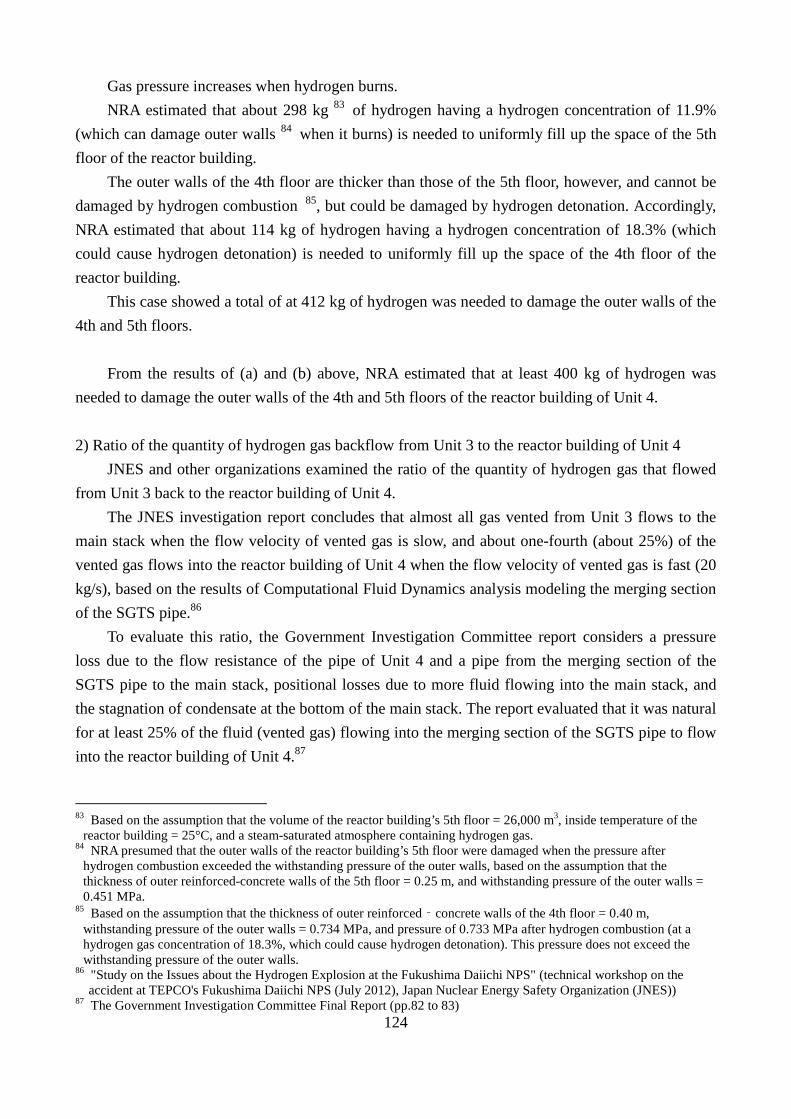
124
Gas pressure increases when hydrogen burns. NRA estimated that about 298 kg 83 of hydrogen having a hydrogen concentration of 11.9%
(which can damage outer walls 84 when it burns) is needed to uniformly fill up the space of the 5th floor of the reactor building.
The outer walls of the 4th floor are thicker than those of the 5th floor, however, and cannot be damaged by hydrogen combustion 85, but could be damaged by hydrogen detonation. Accordingly, NRA estimated that about 114 kg of hydrogen having a hydrogen concentration of 18.3% (which could cause hydrogen detonation) is needed to uniformly fill up the space of the 4th floor of the reactor building.
This case showed a total of at 412 kg of hydrogen was needed to damage the outer walls of the 4th and 5th floors.
From the results of (a) and (b) above, NRA estimated that at least 400 kg of hydrogen was
needed to damage the outer walls of the 4th and 5th floors of the reactor building of Unit 4.
2) Ratio of the quantity of hydrogen gas backflow from Unit 3 to the reactor building of Unit 4 JNES and other organizations examined the ratio of the quantity of hydrogen gas that flowed
from Unit 3 back to the reactor building of Unit 4. The JNES investigation report concludes that almost all gas vented from Unit 3 flows to the
main stack when the flow velocity of vented gas is slow, and about one-fourth (about 25%) of the vented gas flows into the reactor building of Unit 4 when the flow velocity of vented gas is fast (20 kg/s), based on the results of Computational Fluid Dynamics analysis modeling the merging section of the SGTS pipe.86
To evaluate this ratio, the Government Investigation Committee report considers a pressure loss due to the flow resistance of the pipe of Unit 4 and a pipe from the merging section of the SGTS pipe to the main stack, positional losses due to more fluid flowing into the main stack, and the stagnation of condensate at the bottom of the main stack. The report evaluated that it was natural for at least 25% of the fluid (vented gas) flowing into the merging section of the SGTS pipe to flow into the reactor building of Unit 4.87
83 Based on the assumption that the volume of the reactor building’s 5th floor = 26,000 m3, inside temperature of the
reactor building = 25°C, and a steam-saturated atmosphere containing hydrogen gas. 84 NRA presumed that the outer walls of the reactor building’s 5th floor were damaged when the pressure after
hydrogen combustion exceeded the withstanding pressure of the outer walls, based on the assumption that the thickness of outer reinforced-concrete walls of the 5th floor = 0.25 m, and withstanding pressure of the outer walls = 0.451 MPa.
85 Based on the assumption that the thickness of outer reinforced‐concrete walls of the 4th floor = 0.40 m, withstanding pressure of the outer walls = 0.734 MPa, and pressure of 0.733 MPa after hydrogen combustion (at a hydrogen gas concentration of 18.3%, which could cause hydrogen detonation). This pressure does not exceed the withstanding pressure of the outer walls.
86 "Study on the Issues about the Hydrogen Explosion at the Fukushima Daiichi NPS" (technical workshop on the accident at TEPCO's Fukushima Daiichi NPS (July 2012), Japan Nuclear Energy Safety Organization (JNES))
87 The Government Investigation Committee Final Report (pp.82 to 83)

125
TEPCO’s Investigation Committee report evaluates that about 40% of the fluid (about 29% of the vented gas) flowing into the main stack would flow into the reactor building of Unit 4, based on a rough estimation of pipe pressure loss between the pipe of Unit 4 and the merging section of the SGTS pipe. 88
Vented gas is however discharged from the PCV vent and the total quantity, components, quantity of steam contained, and quantity of hydrogen contained in such gas are unknown. In addition, many aspects regarding the behavior of hydrogen gas and the effect of steam condensation in the main stack and SGTS pipe that function as vent discharge routes are yet to be clarified. Therefore, in-depth analyses should be conducted to obtain concrete conclusion. 3) Radiolysis of water in the SFP of Unit 4
Information about the radiolysis of pool water as quoted in the National Diet Investigation Commission report is based on estimation made from the limited quantity of information obtained immediately after the Fukushima Daiichi accident (e.g. hydrogen explosion site limited to the 5th floor). Therefore, new information (e.g., possible hydrogen explosion on the 4th floor) obtained from the results of the subsequent site investigations must also be taken into considered.
The National Diet Investigation Commission Report states: "Hydrogen gas could be generated
by the radiolysis of water in the SFP of Unit 4." The total amount of hydrogen gas is at most a few kilograms, even when hydrogen gas89 was generated at a rate of 18.1 m3 (approx. 1.5 kg 90) per day just after the earthquake. In this regard, NRA estimated that hydrogen gas generated by the radiolysis of water in the SFP of Unit 4 cannot be a main hydrogen source for the explosion in the reactor building.
88 TEPCO Investigation Committee Report (June 2012), attachment II-2 89 The National Diet Investigation Commission Report (p. 245) 90 Converted to mass based on the assumption that the inside temperature of the reactor building = 25°C, and density of
hydrogen gas in the atmosphere at atmospheric pressure = 0.08245 kg/m3.
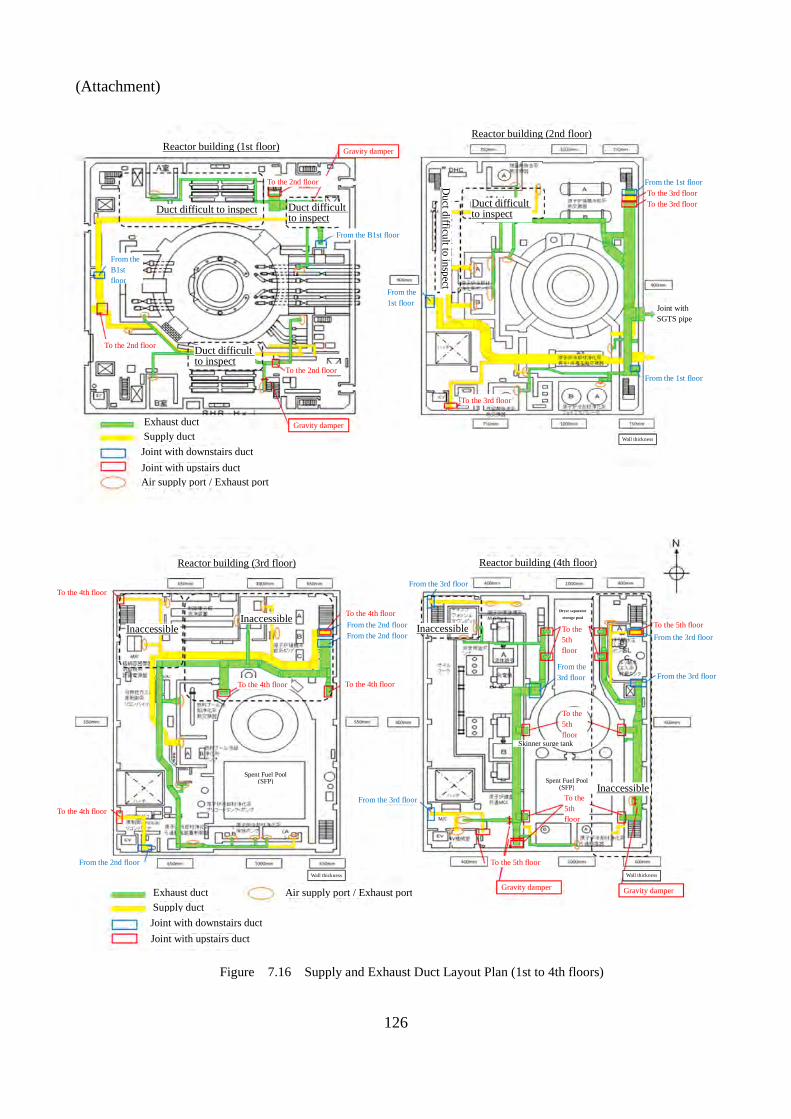
126
(Attachment)
Figure 7.16 Supply and Exhaust Duct Layout Plan (1st to 4th floors)
Reactor building (3rd floor)
From the 2nd floor From the 2nd floor
From the 3rd floor
From the 3rd floor
From the 3rd floor From the 3rd floor
From the 3rd floor
Reactor building (4th floor)
Reactor building (1st floor) Reactor building (2nd floor)
From the 1st floor
From the 1st floor
From the 1st floor
From the B1st floor
From the B1st floor
Exhaust duct
Joint with downstairs duct Supply duct
Joint with upstairs duct
Air supply port / Exhaust port
Wall thickness Wall thickness
From the 2nd floor
To the 4th floor
To the 4th floor
To the 4th floor To the 4th floor
To the 4th floor
To the 5th floor
To the 5th floor
To the 5th floor
To the 5th floor
To the 5th floor
Dryer separator
storage pool
Spent Fuel Pool (SFP)
Spent Fuel Pool (SFP)
Skinner surge tank
Wall thickness
To the 3rd floor To the 3rd floor
Joint with SGTS pipe
To the 2nd floor
To the 2nd floor
To the 2nd floor
Gravity damper
Gravity damper
Gravity damper Gravity damper
Exhaust duct
Joint with downstairs duct Supply duct
Joint with upstairs duct Air supply port / Exhaust port
Duct difficult to inspect
Duct difficult to inspect
Duct difficult to inspect
Duct difficult to inspect
Duct difficult to inspect
To the 3rd floor
Inaccessible Inaccessible
Inaccessible
Inaccessible

127
Figure 7.17 Supply and Exhaust Duct Layout Plan (5th floor)
Figure 7.18 Logic of Starting Normal-use HVAC System and the SGTS in the Reactor Building of Unit 4
Reactor building
Exhaust duct
SGTS pipe
HVAC (exhaust equipment)
Open / Open / Close Close
Close / Open
Close / Open
Close / Open Close / Open
HEPA filter
SGTS filter train “A”
SGTS filter train “B”
Close / Close
Rupture disk
Close / Close
Close / Open Close / Open
Close / Open
HEPA filter PCV vent line
pressure suppression chamber
From drywell
①HVAC isolation valve Air-operated butterfly valve [Normally Open] and [Closed at air/power loss time]
Main stacks for Units 3 and 4
SGTS pipe for Unit 3
Exhaust fan
Example of valve states Normal standby / Power loss
HEPA filter
Exhaust duct
Joint with downstairs duct Supply duct
Joint with upstairs duct Air supply port / Exhaust port
Wall thickness
Spent Fuel Pool (SFP)
Cask
From the 4th floor
From the 4th floor
Reactor well
Skinner surge tank New fuel storage
vault
Reactor building (5th floor)
From the 4th floor From the 4th floor Cask
wash-down pit
Dryer separator
storage pool
Hatch
Refueling machine control room
②SGTS isolation valve Air-operated butterfly valve
"Normally Open" and "Closed at air/power loss time"
Safety protective circuit logic
Manual signal (control room)
Reactor water level "Low"
PCV pressure "High"
R/B exhaust High radioactivity
Close HVAC. Start the SGTS
HVAC closed - Fully close the isolation valve. - Stop the exhaust fan. - Stop the exhaust fan to purge of the PCV.
Start the SGTS. - Fully open the isolation valve. - Start the warming heater. - Start the exhaust fan.
SGTS pipe
AO valve AO valve AO valve
AO valve AO valve AO valve AO valve
AO valve AO valve
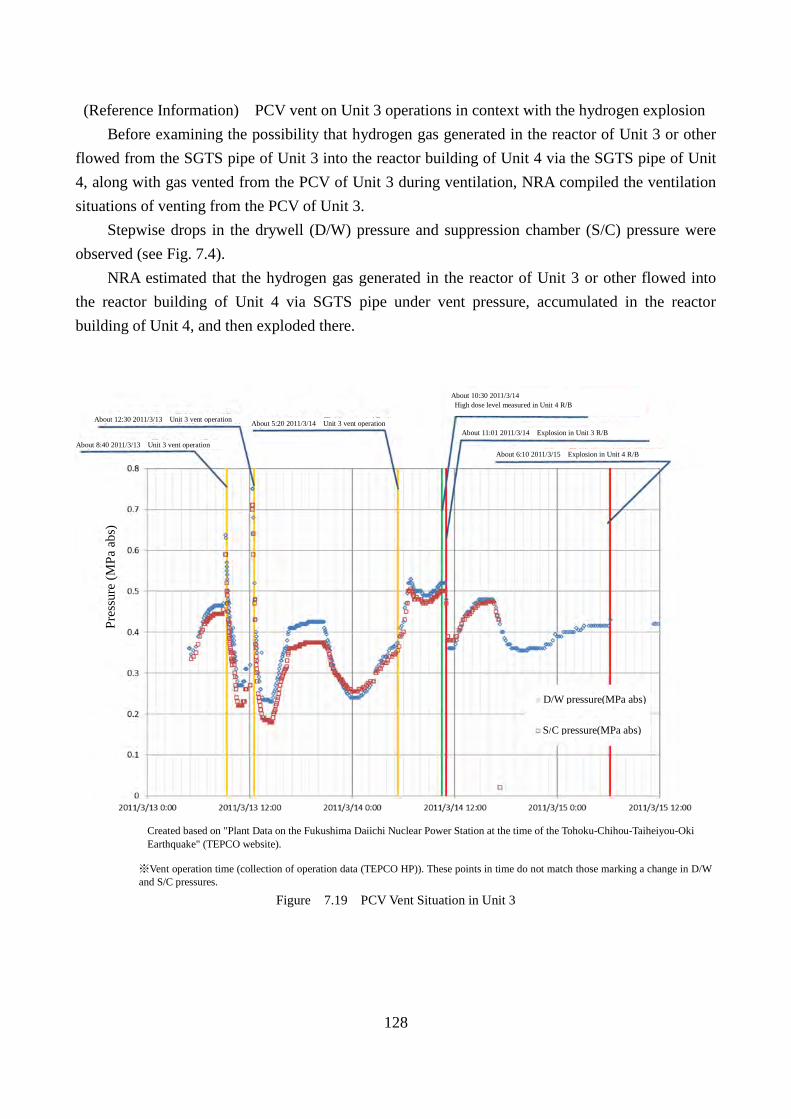
128
(Reference Information) PCV vent on Unit 3 operations in context with the hydrogen explosion
Before examining the possibility that hydrogen gas generated in the reactor of Unit 3 or other flowed from the SGTS pipe of Unit 3 into the reactor building of Unit 4 via the SGTS pipe of Unit 4, along with gas vented from the PCV of Unit 3 during ventilation, NRA compiled the ventilation situations of venting from the PCV of Unit 3.
Stepwise drops in the drywell (D/W) pressure and suppression chamber (S/C) pressure were observed (see Fig. 7.4).
NRA estimated that the hydrogen gas generated in the reactor of Unit 3 or other flowed into the reactor building of Unit 4 via SGTS pipe under vent pressure, accumulated in the reactor building of Unit 4, and then exploded there.
Figure 7.19 PCV Vent Situation in Unit 3
※Vent operation time (collection of operation data (TEPCO HP)). These points in time do not match those marking a change in D/W and S/C pressures.
Created based on "Plant Data on the Fukushima Daiichi Nuclear Power Station at the time of the Tohoku-Chihou-Taiheiyou-Oki Earthquake" (TEPCO website).
About 12:30 2011/3/13 Unit 3 vent operation
About 8:40 2011/3/13 Unit 3 vent operation
About 5:20 2011/3/14 Unit 3 vent operation
About 10:30 2011/3/14 High dose level measured in Unit 4 R/B
About 11:01 2011/3/14 Explosion in Unit 3 R/B
About 6:10 2011/3/15 Explosion in Unit 4 R/B
Pres
sure
(MPa
abs
)
D/W pressure(MPa abs)
S/C pressure(MPa abs)
129
4 Future Regulatory Activities
The NRA has analyzed most of unexplained issues raised by the National Diet Investigation Commission report and the NRA's conclusions are showed in this report.
However, there still remain some issues for that the NRA could not conduct site investigation due to the high dose rate. The NRA should continue conducting site investigation, analyses, and evaluation.
Moreover, with the progress of the decommissioning work in Fukushima Daiichi NPS, it is needed that the NRA should also continue conducting analyses of new findings in long-term based on result of site investigation and TEPCO's analyses.

130
(Reference Information) The review team on Accident Analysis of Fukushima Daiichi Nuclear Power Station (1) Review member (as of July 18, 2014) Commissioner
Toyoshi FUKETA NRA commissioner Outside professionals
Yoshinori KITSUTAKA Professor, Tokyo Metropolitan University Graduate School Yutaka KUKITA Professor Emeritus, Nagoya University Graduate School Ikuji TAKAGI Professor, Kyoto University Graduate School Tsuyoshi TAKADA Professor, The University of Tokyo Graduate School Tadashi NARABAYASHI Professor, Hokkaido University Graduate School
Secretariat of NRA
Masaya YASUI Executive Inspector of Nuclear Regulation Tetsuya YAMAMOTO Director-General for Nuclear Regulation Hiroshi YAMAGATA Director, Division of Regulation for BWRs
Masashi HIRANO Director-General for Regulatory Standard and Research * Masahide KOBAYASHI Director, Division of Research for Reactor System Safety * Harutaka HOSHI Researcher, Division of Research for Severe Accident * Kiyoharu ABE Technical advisor, Division of Research for Severe Accident *
And others Japan Atomic Energy Agency (JAEA) Nuclear Safety Research Center
Kunio ONIZAWA Deputy Director, Research Planning and Co-ordination Office Yu MARUYAMA Group Leader, Severe Accident Analysis Research Group Taisuke YONOMOTO Unit Manager, Reactor Safety Research Unit Norio WATANABE Director, Office of Analysis of Event and Regulatory
Information And others
* Former Japan Nuclear Energy Safety Organization (JNES) staff, JNES had merged into the NRA in March 2014.

131
(2) The review team meeting 1st May 1, 2013 2nd June 17, 2013 3rd August 30, 2013 4th October 7, 2013 5th November 25, 2013 6th July 18, 2014
(3) The site investigations
1st May 30 - 31, 2013 2nd July 10 - 12, 2013 3rd August 6 - 7, 2013 4th February 6 - 7, 2014 5th April 7 - 8, 2014 6th May 15, 2014 7th June 5 - 6, 2014 8th July 30, 2014 9th September 11 - 12, 2014


