Journal of Engineering Sciences, Assiut University, Vol. 38, No. 2, pp. 323 -342, March, 2010. 323 ANALYSIS OF TRANSIENT FLOW PHENOMENON IN PRESSURIZED PIPES SYSTEM AND METHODS OF PROTECTION Nashaat A. Ali, Hassan I. Mohamed, Mohamed E. El-Darder and Alaa A. Mohamed Civil Eng. Dept, Assiut University, Assiut, Egypt E-mail: [email protected](Received November 8, 2009 Accepted January 13, 2010). Water hammer phenomenon is an important consideration in designing of many hydraulic systems due to extreme variations in pressure it causes. For example, the dramatic pressure rise can cause pipes to rupture. Accompanying the high pressure wave, there is a negative wave that can cause very low pressures leading to the possibility of contaminant intrusion or column separation. This paper investigates the effect of different parameters such as fluid density, steady flow velocity, air entrainment, pipeline material type and pipeline friction factor on transient flow in pipeline system due to pump shut down, effect of protection devices on the transient pressure head along the pipeline and effect of existence of a crack in pipeline flow. WHAMO software was used in the analysis which uses the implicit finite difference scheme for solving the momentum and continuity equations at unsteady state case. The study was applied on a pipeline composed of six segments of different diameters and elevations with a total length of 2523 m. The flow is pumped in the pipeline by pumping station to a constant head reservoir at the end of the pipeline. The results showed that many parameters such as fluid density, steady flow velocity, air entrainment, pipeline material type and pipeline friction factor have significant effect on the water hammer phenomenon. Also, it was found that in spite of the non-return valve protects the pump from water hammer effect, increases the pressure head in the pipeline. Surge tank or air chamber fitted at the beginning of the pipeline can protect it effectively from the water hammer effect. At the end, it was found that a crack in pipeline can cause intrusion from outside the pipe to inside and inversely can cause leakage to outside or both. KEYWORDS: water hammer, pipelines, hydraulic parameters, protection, intrusion, leakage. 1- INTODUCTION The sudden loss of energy to a pump can be caused by an unexpected power failure, or simply because the power has been switched off. Whatever the cause, it is very important to simulate this common occurrence to determine whether dangerous pressures develop or not. The abrupt change to the flow that causes large pressure fluctuations is called water hammer. The name comes from the hammering sound that
Transcript
Journal of Engineering Sciences, Assiut University, Vol. 38, No. 2, pp. 323 -342, March, 2010.
323
ANALYSIS OF TRANSIENT FLOW PHENOMENON IN PRESSURIZED PIPES SYSTEM AND
METHODS OF PROTECTION
Nashaat A. Ali, Hassan I. Mohamed, Mohamed E. El-Darder
and Alaa A. Mohamed Civil Eng. Dept, Assiut University, Assiut, Egypt
(Received November 8, 2009 Accepted January 13, 2010).
Water hammer phenomenon is an important consideration in designing of
many hydraulic systems due to extreme variations in pressure it causes.
For example, the dramatic pressure rise can cause pipes to rupture.
Accompanying the high pressure wave, there is a negative wave that can
cause very low pressures leading to the possibility of contaminant
intrusion or column separation. This paper investigates the effect of
different parameters such as fluid density, steady flow velocity, air
entrainment, pipeline material type and pipeline friction factor on
transient flow in pipeline system due to pump shut down, effect of
protection devices on the transient pressure head along the pipeline and
effect of existence of a crack in pipeline flow. WHAMO software was used
in the analysis which uses the implicit finite difference scheme for solving
the momentum and continuity equations at unsteady state case. The study
was applied on a pipeline composed of six segments of different diameters
and elevations with a total length of 2523 m. The flow is pumped in the
pipeline by pumping station to a constant head reservoir at the end of the
pipeline. The results showed that many parameters such as fluid density,
steady flow velocity, air entrainment, pipeline material type and pipeline
friction factor have significant effect on the water hammer phenomenon.
Also, it was found that in spite of the non-return valve protects the pump
from water hammer effect, increases the pressure head in the pipeline.
Surge tank or air chamber fitted at the beginning of the pipeline can
protect it effectively from the water hammer effect. At the end, it was
found that a crack in pipeline can cause intrusion from outside the pipe to
inside and inversely can cause leakage to outside or both.
KEYWORDS: water hammer, pipelines, hydraulic parameters,
protection, intrusion, leakage.
1- INTODUCTION
The sudden loss of energy to a pump can be caused by an unexpected power failure, or
simply because the power has been switched off. Whatever the cause, it is very
important to simulate this common occurrence to determine whether dangerous
pressures develop or not. The abrupt change to the flow that causes large pressure
fluctuations is called water hammer. The name comes from the hammering sound that
Nashaat A. Ali, Hassan I. Mohamed and Mohamed E. El-Darder 324
sometimes occurs during the phenomenon (Parmakian [9]). Many researchers studied
the water hammer phenomenon along the last decades with different viewpoints,
among of them Abd el-Gawad [1], Jönnsson [7], Stephenson [15], Yang [16] and many
others.
Al-Khomairi [2] discussed the use of the steady-state orifice equation for the
computation of unsteady leak rates from pipe through crack or rapture. It has been
found that the orifice equation gives a very good estimation of the unsteady leak rate
history for normal leak openings.
Mohamed [8] introduced the effect of the different parameters such as time of
valve closure, pipe material rigidity and pipe roughness on the pressure damping. He
indicated that, the pipe friction factor and the time of valve closing have a significant
effect in pressure transient reduction and also, he found that the elastic pipes such as
PVC are better than the rigid pipes in pressure damping. However, his study is
restricted to valve closing at the end of pipeline and this case may be differ than the
case of water hammer due to pump shut down.
Ramos et al. [10] carried out several simulations and experimental tests in
order to analyze the dynamic response of single pipelines with different characteristics,
such as pipe materials, diameters, thicknesses, lengths and transient conditions. They
concluded that being the plastic pipe with a future increasing application, the
viscoelastic effect must be considered, either for model calibration, leakage detection
or in the prediction of operational conditions (e.g. start up or trip-off electromechanical
equipment, valve closure or opening).
Samani and Khayatzadeh [12] employed the method of characteristics to
analyze transient flow in pipe networks. They applied various numerical tests to
examine the accuracy of these methods and found that the method in which the implicit
finite difference was coupled with the method of characteristics to obtain the
discretized equations which is the best compared to the others.
This study aims to investigate the effect of different parameters such as fluid
density, steady flow velocity, air entrainment, pipeline material type and pipeline
friction factor on transient pressure head due to pump shut down, effect of protection
devices on the transient pressure head along the pipeline and effect of existence of a
crack in pipeline on intrusion or leakage due to transient pressure head fluctuation.
2- THEORETICAL CONSIDERATIONS
Because of difficulty in solution of governing equations, engineers in pipelines design
usually neglect this phenomenon. Recently a number of numerical methods suitable for
digital computer analyses have been reported in the literature (Chaudhry and Yevjevich
[4]), which may be used to solve these equations. In the following, the governing
equations were solved by one of these methods.
2.1 Governing Equations
The governing equations for unsteady flow in pipeline are derived under the following
assumptions (1) one dimensional flow i.e. velocity and pressure are assumed constant
at a cross section; (2) the pipe is full and remains full during the transient; (3) no
ANALYSIS OF TRANSIENT FLOW PHENOMENON IN … 325
column separation occurs during the transient; (4) the pipe wall and fluid behave
linearly elastically and (5) unsteady friction loss is approximated by steady state losses.
The unsteady flow inside the pipeline is described in terms of the unsteady mass
balance (continuity) equation and unsteady momentum equation, which define the state
of variables of V (velocity) and P (pressure) given as (Simpson and Wu [14]);
(1)
(2)
where x = distance along the pipeline; t = time, V = velocity, P = hydraulic pressure in
the pipe, g = acceleration due to gravity, f = Darcy-Weisbach friction factor, = fluid
density, D = pipe diameter, α = pipe slope angle and A = cross sectional area of the
pipe.
Equation (1) is the continuity equation and takes into account the
compressibility of the water and the flexibility of the material. Equation (2) is the
equation of motion.
In Eq. (1), the terms are replaced by equivalent
where and
K = bulk modulus of the fluid
Therefore, one can have
(3)
Putting (4)
Where c = wave speed, = Poisson ratio, E = Young’s modulus of elasticity, e = pipe
wall thickness and . Dividing the result by γ yields
(5)
where H is the piezometric head, pressure head plus the elevation head .The term is
small compared to and it is often neglected. In terms of discharge, Eq. (5) becomes
(6)
2.2 Implicit Finite Difference Method
The continuity and momentum equations form a pair of hyperbolic, partial differential
equations for which an exact solution can not be obtained analytically. However other
methods have been developed to solve the water hammer equations. If the equations
are hyperbolic it means the solutions follow certain characteristic pathways. For the
water hammer equation, the wave speed is the characteristic. The implicit finite
difference method is a numerical method used for solving the water hammer equations.
Nashaat A. Ali, Hassan I. Mohamed and Mohamed E. El-Darder 326
The implicit method replaces the partial derivatives with finite differences and
provides a set of equations that can then be solved simultaneously. The computer
program WHAMO uses the implicit finite-difference technique but converts its
equations to a linear form before it solves the set of equations (Fitzgerald and Van
Blaricum [5]). The solution space is discretized into the x-t plane so that at any point
on the grid (x,t) there is a certain H and Q for the that point, H(x,t) and Q(x,t) as shown
in Fig. (1).
Fig. (1): Finite difference grid.
The momentum equation and the continuity equation can be represented in a
short form by introducing the following coefficients for the known values in a system.
Using the same notation as the WHAMO program the coefficients are as follows:
(7)
(8)
(9)
(10)
where is the weighting factor. All the parameters for the coefficient should be known
from the properties of the pipe or the values of head and flow at the previous time step.
With the known coefficients, the momentum and continuity equations of the jth segment of the pipe become:
Momentum: (11)
Continuity: (12)
Now, with equations for the all the links and nodes in the system, the initial
and boundary conditions, a matrix of the linear system of equations can be set up to
solve for head and flow everywhere, simultaneously, for the first time step. The
ANALYSIS OF TRANSIENT FLOW PHENOMENON IN … 327
process is repeated for the next time step, and again for the next step until the specified
end of the simulation.
3- CASE STUDY
A pipeline of six parts transmits fluid from low level to high level as shown in Fig. (2)
is used in this study. This pipeline profile was adopted from Burrows and Qiu [3]. The
study was divided to three parts. In part one, the different parameters which affect the
water hammer phenomenon were studied. In part two, effect of methods of protection
were studied. In the third part, effect of leakage and intrusion from and to pipeline
were studied. The length, diameters and levels of the different parts of the pipeline are
shown in Fig. (2). Table (1) shows the studied variables. WHAMO software was used
to calculate the change in pressure heads along the pipeline with time due to pump shut
down.
Pump
Z:6.0
BC D
A E
F
G
X:0.0
23.4
Z:8.4X:230.0 Z:13.1
X:1140.0 Z:15.3X:1530.0
Z:7.2X:1740.0
Z:16.2X:2480.0
Z:23.4X:2523
AB= BC=0. 325 m, CD= DE= EF=0.315 m, FG=0.305 m
Fig. (2): Pipeline profile.
Table 1: The different parameters used in this study
Study case Parameter Value Units
Part 1
fluid density 900, 1000, 1100 and 1200 kg/m3
steady flow velocity 1, 1.6 and 1.8 m/sec.
air concentration 0, 0.1, 0.5, 1.0 and 2.0% -
pipe elasticity 3.3, 20, 24, 165 and 210 GN/m2
pipe friction factor 0.0, 0.005 and 0.01 -
Part 2
Non-return valve = 1000 kg/m3, = 1 m/sec., air
concentration =0%, = 3.3 GN/m2, pipe
wall thickness= 1.69 cm and = 0.01
Open surge tank
Air chamber
Part 3
Intrusion = 1000 kg/m3, = 1 m/sec., air
concentration =0%, = 3.3 GN/m2, pipe
wall thickness= 1.69 cm and = 0.01
Leakage
Intrusion and leakage
4- RESULTS AND DISCUSSIONS
4.1 Effect of Change of Some Variables on Transient Pressure Head
In this section, the result of the effect of some variables on transient pressure head due
to pump shut down, such as fluid density, steady flow velocity, air entrainment,
pipeline material type and pipeline friction factor are presented. It has to be mentioned
Nashaat A. Ali, Hassan I. Mohamed and Mohamed E. El-Darder 328
that, the pipeline was not protected against water hammer phenomenon through this
part of study except the case of friction factor; non-return valve is installed at the
beginning of the pipeline.
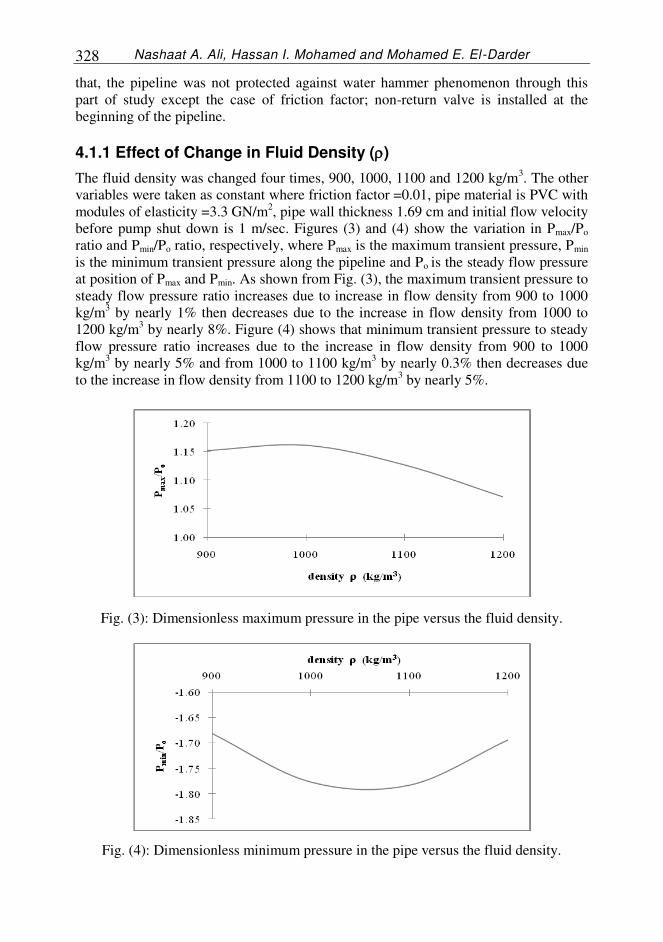
4.1.1 Effect of Change in Fluid Density ()
The fluid density was changed four times, 900, 1000, 1100 and 1200 kg/m3. The other
variables were taken as constant where friction factor =0.01, pipe material is PVC with
modules of elasticity =3.3 GN/m2, pipe wall thickness 1.69 cm and initial flow velocity
before pump shut down is 1 m/sec. Figures (3) and (4) show the variation in Pmax/Po
ratio and Pmin/Po ratio, respectively, where Pmax is the maximum transient pressure, Pmin
is the minimum transient pressure along the pipeline and Po is the steady flow pressure
at position of Pmax and Pmin. As shown from Fig. (3), the maximum transient pressure to
steady flow pressure ratio increases due to increase in flow density from 900 to 1000
kg/m3 by nearly 1% then decreases due to the increase in flow density from 1000 to
1200 kg/m3 by nearly 8%. Figure (4) shows that minimum transient pressure to steady
flow pressure ratio increases due to the increase in flow density from 900 to 1000
kg/m3 by nearly 5% and from 1000 to 1100 kg/m
3 by nearly 0.3% then decreases due
to the increase in flow density from 1100 to 1200 kg/m3 by nearly 5%.
Fig. (3): Dimensionless maximum pressure in the pipe versus the fluid density.
Fig. (4): Dimensionless minimum pressure in the pipe versus the fluid density.
ANALYSIS OF TRANSIENT FLOW PHENOMENON IN … 329
4.1.2 Effect of Steady Flow Velocity (V)
The initial velocity in the pipeline was changed three times, 1.0, 1.6 and 1.8 m/sec., by
using one pump, two similar pumps and three similar pumps on parallel, respectively.
The other variables were taken as constant where friction factor (f) =0.01, fluid density
() =1000 kg/m3
(fluid is water) and pipe material is PVC with modules of elasticity
=3.3 GN/m2 and pipe wall thickness 1.69 cm. Figures (5) and (6) depict the variation in
Pmax/Po ratio and Pmin/Po ratio, respectively. where Pmax is the maximum transient
pressure, Pmin is the minimum transient pressure and Po is the steady flow pressure at
position of Pmax and Pmin. As shown in Fig. (5), the maximum transient pressure to
steady flow pressure ratio increases due to the increase in steady flow velocity from 1
to 1.6 m/sec. by nearly 1.5% and decreases due to the increase in steady flow velocity
from 1.6 to 1.8 m/sec. by nearly 0.2%. Figure (6) shows that the minimum transient
pressure to steady flow pressure ratio decreases due to the increase in steady flow
velocity from 1 to 1.6 m/sec. by nearly 6% and from 1.6 to 1.8 m/sec. by nearly 5%.
Fig. (5): Dimensionless maximum pressure in the pipe versus the fluid initial velocity.
Fig. (6): Dimensionless minimum pressure in the pipe versus the fluid initial velocity.
Nashaat A. Ali, Hassan I. Mohamed and Mohamed E. El-Darder 330
4.1.3 Effect of Change in Air Concentration in the Fluid
Air concentration was changed five times, 0, 0.1, 0.5, 1.0 and 2.0%. The other
variables were taken as constant where friction factor (f) =0.01, pipe material is PVC
with modules of elasticity =3.3 GN/m2, pipe wall thickness 1.69 cm, initial flow
velocity before pump shut down is 1 m/sec, fluid density (liq) =1000 kg/m3
(fluid is
water). Figures (7) and (8) present the variation in Pmax/Po ratio and Pmin/Po ratio,
respectively, where Pmax is the maximum transient pressure, Pmin is the minimum
transient pressure and Po is the steady flow pressure at position of Pmax and Pmin. As
shown in Fig. (7) the maximum transient pressure to steady flow pressure ratio
decreases due to the increase in air concentration from 0 to 0.1% by nearly 12% then
increases due to the increase in air concentration from 0.1 to 0.5% by nearly 20% then
decreases due to the increase in air concentration from 0.5 to 1.0% by nearly 0.5% and
finally increases due to the increase in air concentration from 1.0 to 2.0% by nearly
7%. Figure (8) shows that the minimum transient pressure to steady flow pressure ratio
increases due to the increase in air concentration from 0 to 0.1% by nearly 2% and
decreases due to the increase in air concentration from 0.1 to 2.0% by nearly 17%.
Fig. (7): Dimensionless maximum pressure in the pipe versus air concentration in the
fluid.
Fig. (8): Dimensionless minimum pressure in the pipe versus air concentration in the
fluid.
ANALYSIS OF TRANSIENT FLOW PHENOMENON IN … 331
4.1.4 Effect of Change in Pipe Elasticity (E)
Five materials were studied PVC, concrete, asbestos cement (AC), ductile iron and
steel. The other variables were taken as constant where friction factor (f) =0.01, fluid
density () =1000 kg/m3 (fluid is water), initial flow velocity before pump shut down is
1 m/sec, there is no air in the water and the pipe wall thickness for the all pipe
materials were taken 1.69 cm. The used materials data is shown in table (2) and were
adopted from Jones and Bosserman [6], Richard and Svindland [11] and Sharp and
Sharp [13].
Table 2: Properties of used pipe materials
Pipe material Modules of elasticity
PVC 3.3 GN/m2
Concrete 20 GN/m2
AC 24 GN/m2
Ductile iron 165 GN/m2
Steel 210 GN/m2
The variation in Pmax/Po ratio and Pmin/Po ratio is shown in Figs. (9) and (10),
respectively, where Pmax is the maximum transient pressure, Pmin is the minimum
transient pressure and Po is the steady flow pressure at position of Pmax and Pmin. As the
shown from Fig. (9), maximum transient pressure to steady flow pressure ratio
decreases due to the increase in pipe material elasticity from 3.3 to 20 GN/m2 by nearly
14% and from 20 to 210 GN/m2 by nearly 3%. Figure (10) shows that minimum
transient pressure to steady flow pressure ratio decreases due to the increase in pipe
material elasticity from 3.3 to 20 GN/m2 by nearly 10%, from 20 to 24 GN/m
2 by
nearly 14% and from 24 to 165 GN/m2 by nearly 23% then increases due to the
increase in pipe material elasticity from 165 to 210 GN/m2 by nearly 2%.
Fig. (9): Dimensionless maximum pressure in the pipe versus the pipe modules of
elasticity.
Nashaat A. Ali, Hassan I. Mohamed and Mohamed E. El-Darder 332
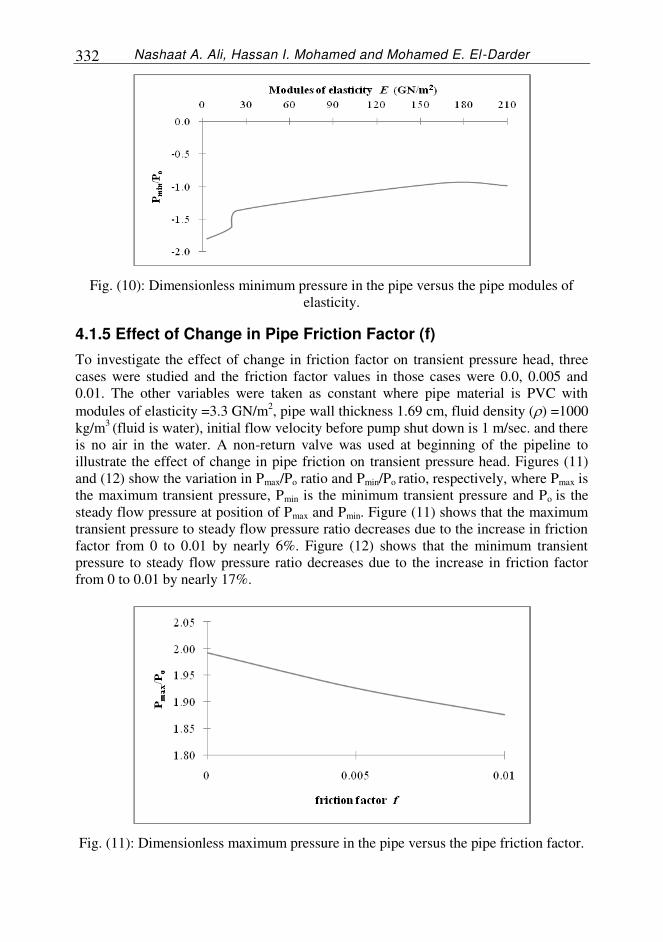
Fig. (10): Dimensionless minimum pressure in the pipe versus the pipe modules of
elasticity.
4.1.5 Effect of Change in Pipe Friction Factor (f)
To investigate the effect of change in friction factor on transient pressure head, three
cases were studied and the friction factor values in those cases were 0.0, 0.005 and
0.01. The other variables were taken as constant where pipe material is PVC with
modules of elasticity =3.3 GN/m2, pipe wall thickness 1.69 cm, fluid density () =1000
kg/m3 (fluid is water), initial flow velocity before pump shut down is 1 m/sec. and there
is no air in the water. A non-return valve was used at beginning of the pipeline to
illustrate the effect of change in pipe friction on transient pressure head. Figures (11)
and (12) show the variation in Pmax/Po ratio and Pmin/Po ratio, respectively, where Pmax is
the maximum transient pressure, Pmin is the minimum transient pressure and Po is the
steady flow pressure at position of Pmax and Pmin. Figure (11) shows that the maximum
transient pressure to steady flow pressure ratio decreases due to the increase in friction
factor from 0 to 0.01 by nearly 6%. Figure (12) shows that the minimum transient
pressure to steady flow pressure ratio decreases due to the increase in friction factor
from 0 to 0.01 by nearly 17%.
Fig. (11): Dimensionless maximum pressure in the pipe versus the pipe friction factor.
ANALYSIS OF TRANSIENT FLOW PHENOMENON IN … 333
Fig. (12): Dimensionless minimum pressure in the pipe versus the pipe friction factor.
4.2 Effect of Methods of Protection on Transient Pressure Head
This section aims to investigate the effect of non-return valve, open surge tank and air
chamber on transient pressure head. All variables were taken as constant where friction
factor (f) =0.01, pipe material is PVC with modules of elasticity =3.3 GN/m2, pipe wall
thickness 1.69 cm, fluid density () =1000 kg/m3
(fluid is water), steady flow velocity
=1 m/sec. and there is no air in the water.
4.2.1 Non-Return Valve
To show the effect of non-return valve on transient pressure head, a non-return valve
0.325 m diameter and 0.8 head loss coefficient was used at the beginning of the
pipeline and was installed exactly after the pump. Figures (13) and (14) indicate the
variation in maximum and minimum piezometric heads along the pipeline for no
protection and for using non-return valve. Figure (13) shows that the non-return valve,
in spite of its protection of the pump, it increases the positive pressure heads along the
pipeline. For examples at node A by nearly 124%; at node D by nearly 61% and at
node E by nearly 54% so, the beginning of the pipeline is the most affected due to
using non-return valve. Figure (14) shows that the non-return valve doesn’t affect the minimum pressure heads along the pipeline because the minimum pressure heads occur
before the non-return valve effect appears.
Fig. (13): Maximum piezometric heads along the pipeline due to using non-return
valve.
Nashaat A. Ali, Hassan I. Mohamed and Mohamed E. El-Darder 334
Fig. (14): Minimum piezometric heads along the pipeline due to using non-return
valve.
4.2.2 Open Surge Tank
To show the effect of open surge tank on transient pressure head, open surge tank 2.5
m diameter was used at node A; i.e. at beginning of the pipeline and its initial water
surface level is 27.61 m which equal to the sum of node elevation (6 m) and node A
steady state flow pressure head (21.61 m). Non-return valve 0.325 m diameter and 0.8
head loss coefficient was used at beginning of the pipeline, as a worst case, because it
increases the pressure heads as shown in the previous section. Figures (15) and (16)
show the variation in maximum and minimum piezometric heads along the pipeline for
no protection, using open surge tank only and using open surge tank and non-return
valve simultaneously. Maximum pressure head curves along the pipeline for the second
and third cases are correspondent as shown in Fig. (15) so, adding non-return valve to
the pipeline when using open surge tank doesn’t affect its maximum pressure heads. Maximum pressure head at beginning of the pipeline is greater for the second and third
cases than for unprotected pipeline because using open surge tank alone or with non-
return valve reduces the pressure head regularly. So, the maximum pressure heads in
the two cases are approximately equal to the steady state pressure heads on contrary to
no protection case where a sudden drop in pressure heads happens exactly after the
pump shut down. Figure (15) and Fig. (13) in the previous section show that the open
surge tank help in reducing the maximum pressure head which is produced by the non-
return valve. Figure (16) shows that the open surge tank has a significant effect on the
minimum pressure heads along the pipeline and protects it from negative pressures.
Using non-return valve and open surge tank together has higher pressure heads than
using open surge tank only.
ANALYSIS OF TRANSIENT FLOW PHENOMENON IN … 335
Fig. (15): Maximum piezometric heads along the pipeline due to using open surge
tank.
Fig. (16): Minimum piezometric heads along the pipeline due to using open surge tank.
4.2.3 Air Chamber
To show the effect of air chamber on transient pressure head, two air chambers 2.5 m
diameters were used simultaneously. The first was used at node A; i.e. at beginning of
the pipeline and its initial water surface level and its top level were 8.3 and 10.7 m
respectively. The second was used at node C i.e. at distance 1140 m from beginning of
the pipeline and its initial water surface level and its top level were 15.4 and 17.7 m
respectively. Non-return valve 0.325 m diameter and 0.8 head loss coefficient was used
at beginning of the pipeline, as a worst case, because it increases the pressure heads as
shown previously. Figures (17) and (18) show the variation in maximum and minimum
piezometric heads along the pipeline for no protection, using air chamber only and
using air chamber and non-return valve simultaneously. Maximum pressure head
curves along the pipeline for the second and third cases are correspondent as shown in
Fig. (17) so, adding non-return valve to the pipeline when using air chamber doesn’t affect its maximum pressure heads. Maximum pressure head at beginning of the
pipeline is greater for the second and third cases than for unprotected pipeline because
using air chamber alone or with non-return valve reduces the pressure head regularly.
So, the maximum pressure heads on the two cases are approximately equal to the
Nashaat A. Ali, Hassan I. Mohamed and Mohamed E. El-Darder 336
steady state pressure head on contrary to no protection case, where a sudden drop in
pressure heads happens exactly after the pump shut down. Figure (17) and Fig. (13)
show that air chamber help in reducing the maximum pressure head which is produced
by the non-return valve. Figure (18) shows that the air chamber has a significant effect
on the minimum pressure heads along the pipeline and protects it from negative
pressures. Using non-return valve and air chamber together has higher pressure heads
than using air chamber alone.
Fig. (17): Maximum piezometric heads along the pipeline due to using air chamber.
Fig. (18): Minimum piezometric heads along the pipeline due to using air chamber.
4.3 Effect of Crack Existence in Pipeline on Transient Pressure Head
This section aims to investigate the effect of leakage or intrusion between inside and
outside the pipeline on transient pressure head. A crack is assumed to be at node D
which is at distance 1530 m from beginning of the pipeline and is represented by a
totally opened gate valve 2.5 cm diameter and the underground water surrounding the
pipeline is represented by a head boundary. All variables were taken as constant where
friction factor (f) =0.01, pipe material is PVC with modules of elasticity =3.3 GN/m2
and wall thickness 1.69 cm, fluid density () =1000 kg/m3
(fluid is water), steady flow
ANALYSIS OF TRANSIENT FLOW PHENOMENON IN … 337
velocity =1m/sec and there is no air in the water. Node D is at distance 1530 m from
beginning of the pipeline, its level is 15.3 m and has an internal maximum and
minimum pressure head 11.52 and -17.71 m respectively at no crack simulation. If
there is an opening in the pipeline at it and the underground water level is 26.82 m or
higher, the only water direction will be from underground water to the pipe. If the
underground water level is -2.41 m or lower, the only water direction will be from the
pipe to the underground water. If the underground water level is between 26.82 and
2.41 m, the water direction will be from the underground water to pipe and reverse.
The pipeline was studied first without connection between outside and inside the pipe
then intrusion and leakage were allowed and finally a non-return valve was added at
beginning of the pipeline to investigate its effect on intrusion and leakage existence.
4.3.1 Intrusion
To show the effect of intrusion on transient pressure head, underground water level
was assumed 26.82 m. Figures (19) and (20) show the maximum and minimum
piezometric heads along the pipeline. Figure (19) shows that intrusion decreases the
maximum pressure heads at nodes D and E by nearly 5%. Intrusion reduces the
maximum pressure heads produced by the non-return valve. Intrusion without and with
non-return valve minimum pressure heads are correspondent along the pipeline as
shown in Fig. (20). Both cases decrease the minimum pressure heads along the
pipeline.
Fig. (19): Maximum piezometric heads along the pipeline due to intrusion.
Nashaat A. Ali, Hassan I. Mohamed and Mohamed E. El-Darder 338
Fig. (20): Minimum piezometric heads along the pipeline due to intrusion.
4.3.2 Leakage
To show the effect of leakage on transient pressure head, underground water level was
assumed -2.41 m; i.e. below the minimum pressure head in the pipe. Figures (21) and
(22) show the maximum and minimum piezometric heads along the pipeline. Figure
(21) shows that leakage decreases the maximum pressure heads along the pipeline, for
example at nodes D and E by nearly 12%. Leakage reduces the maximum pressure
heads produced by the non-return valve. Leakage without and with non-return valve
minimum pressure heads are correspondent along the pipeline as shown in Fig. (22).
Both cases decrease the minimum pressure heads along the pipeline.
Fig. (21): Maximum piezometric heads along the pipeline due to leakage.
ANALYSIS OF TRANSIENT FLOW PHENOMENON IN … 339
Fig. (22): Minimum piezometric heads along the pipeline due to leakage.
4.3.3 Intrusion and Leakage
To show the effect of discharge between inside and outside the pipeline on transient
pressure head, underground water level was assumed 25.15 m which is the sum of node
level (15.3 m) and the pressure head at the node in the steady state flow (9.85 m). So,
in the steady state before pump shut down the flow between outside and inside the pipe
is zero. Figures (23) and (24) show the maximum and minimum piezometric heads
along the pipeline. Figure (23) shows that leakage or intrusion between inside and
outside the pipeline decreases the maximum pressure heads at nodes D and E by nearly
8% and 5% respectively. Intrusion and leakage reduce the maximum pressure heads
produced by the non-return valve. Second and third cases minimum pressure heads are
correspondent along the pipeline as shown in Fig. (24). Both cases decrease the
minimum pressure heads along the pipeline.
Fig. (23): Maximum piezometric heads along the pipeline due to leakage and intrusion.
Nashaat A. Ali, Hassan I. Mohamed and Mohamed E. El-Darder 340
Fig. (24): Minimum piezometric heads along the pipeline due to leakage and intrusion.
5- CONCLUSIONS
The main conclusions drawn from this study are as follows:
Fluid density, steady flow velocity, air entrainment, pipeline material type and
pipeline friction factor have a noticeable effect on transient pressure head as
follows:
Pmax/Po ratio increases due to increase at flow density from 900 to 1000
kg/m3 then decreases due to increase from 1000 to 1200 kg/m
3. Pmin/Po ratio
increases due to the increase at flow density from 900 to 1100 kg/m3 then
decreases due to the increase from 1100 to 1200 kg/m3.
Pmax/Po ratio increases due to the increase in steady flow velocity and Pmin/Po
ratio decreases due to the increase in steady flow velocity.
Pmax/Po ratio increases due to the increase in air concentration and Pmin/Po
ratio decreases due to the increase in air concentration.
Pmax/Po ratio decreases due to the increase in pipe material elasticity from 3.3
to 20 GN/m2 and approximately takes constant value due to the increase
from 20 to 210 GN/m2. Pmin/Po ratio decreases due to the increase in pipe
material elasticity.
Pmax/Po and Pmin/Po ratios decrease due to the increase in friction factor.
The increase in steady flow velocity or air concentration in the fluid
increases the time taken by the water hammer wave to dissipate.
Although the non-return valve protects the pump from water hammer
phenomenon, it increases the transient pressure heads and the water hammer
wave period in the pipeline.
The open surge tank and the air chamber protect the pipeline from negative
pressures as well as the positive pressures.
Occurrence of water hammer phenomenon in pipe system may cause intrusion of
containment water from outside the pipeline, if crack exist in it.
Intrusion and leakage existence reduce values of the minimum pressure heads
more than the maximum pressure heads.
ANALYSIS OF TRANSIENT FLOW PHENOMENON IN … 341
REFERENCES
1. Abd el-Gawad, S. M., (1994), “Water Hammer Analysis for the Pipeline Ahmed Hamdi Tunnel, Abu-Radis”, Engng. Res. Jour., Vol. 6, PP. 40-54.
2. Al-Khomairi, A. M., (5002), “Use of the Steady-State Orifice Equation in the
Computation of Transient Flow Through Pipe Leaks”, The Arabian Jour. for science and Eng., Vol. 30, N. IB, PP. 33-45.
3. Burrows, R. and Qiu, Q., (1992), “Effect of Air Pockets on PipeLine Surge Pressure”, Proc. Instn Civ. Engrs Wat., Marit. & Energy, 115, PP. 249-361.
4. Chaudhry, H. M. and Yevjevich, V., (1981), “Closed-Conduit Flow”, water resources publications, P.O. Box 2841, Littleton, Colorado 80161, U.S.A..
5. Fitzgerald, R. and Van Blaricum, V. L., (1998), “Water Hammer and Mass Oscillation (WHAMO) 2.0 user's manual”, US Army Corps of Engineers.
6. Jones, G. M. and Bosserman, B. E., (5006), “Pumping Station Design”, Elsevier, ISBN: 978-0-7506-7544-4, Third Edition.
7. Jönnsson, L., (1999), “Hydraulic Transient as a Monitoring Device”, XXVII IAHR congress, Graz, Austria.
8. Mohamed, H. I., (5002), “Parametric Study for the Water Hammer Phenomenon in Pipelines”, 1st
Int. Conf. of civil Eng. Science, ICCESI, Assiut, Egypt.
9. Parmakian, J., (1962), “Water Hammer Analysis”, Dover Publications, New York. 10. Ramos, H., Covas, D., Borga, A. and Loureiro, A., (5004), “Surge Damping
Analysis in Pipe Systems: Modeling and Experiments”, Vol. 45, No. 4, PP. 412-
425.
11. Richard C. and Svindland, P. E., (5002), “Predicting the Location and Duration of Transient Induced Low or Negative Pressures within a Large Water Distribution
System”, Master’s thesis, Lexington, Kentucky.
12. Samani, H. M. V. and Khayatzadeh, A., (5005), “Transient Flow in Pipe
Networks”, Jour. of Hydr. Research, Vol. 40, No. 2, PP. 627-644.
13. Sharp, B. B. and Sharp D. B., (1996), “Water Hammer: Practical Solutions”, Butterworth- Heinermann, ISBN: 0340645970.
14. Simpson, A. R. and Wu, Z. Y., (1997), “Computer Modelling of Hydraulic
Transient in Pipe Networks and Associated Design Criteria”, MODSIM97, International Congress on Modelling and Simulation, Modelling and Simulation
Society of Australia, Hobart, Tasmania, Australia.
15. Stephenson, D., (5005), “Simple Guide for Design of Air Vessels for Water
Hammer Protection of Pumping Lines”, Jour. of Hyd. Eng., Vol. 158, No. 8, PP. 792-797.
16. Yang, K., (5001), “Practical Method To Prevent Liquid Column Separation”, Jour. of Hyd. Eng., Vol. 127, No. 7, PP. 620-623.
Nashaat A. Ali, Hassan I. Mohamed and Mohamed E. El-Darder 342
نظمة المواسير المضغوطة و طرق الحماية لهاأيان الغير مستقر في دراسة السر
ية وهذا يعود ي هيدرو ظمة ا ثير من اأ د تصميم ا مائية في ااعتبار ع مطرقة ا مهم أخذ ظاهرة ا من اضغط وايضا حدوث ضغط ى زيادة فى ا ضغط حيث تؤدى ا تى تسببها فى ا بيرة ا تغيرات ا ى ا ا
ب مما قد مواسير من سا ى ا ملوثات ا ية دخول ا ا ب ام ى جا مواسير ا سر فى ا ى حدوث يؤدى اخارجية. جوفية ا ميا ا ا
مختلفة علي متغيرات ا اقش تأثير بعض ا دراسة ي جزء ااول من ا ى ثاثة اجزاء. ا قسم ا دراسة ت هذ المضخة وهذ ا فجائى توقف ا حادثة بسبب ا مائية ا لمطرقة ا تيجة ماسورة متغير داخل ا ضغط ا
هواء في يز ا مائية, تر مطرقة ا سائل قبل حدوث ا ماسورة, سرعة ا سائل داخل ا ثافة ا متغيرات هي اد ى من ا ثا جزء ا لماسورة. ا اك ماسورة ومعامل ااحت ة مادة ا سائل, مرو اقش تأثير وسائل ا راسة ي
اقش تأثير وجود ث ي ثا جزء ا هواء. ا توازن و خزان ا رجوع, خزان ا مختلفة مثل محبس عدم ا حماية ا اثاثة باستخدام برامج ماسورة وقد تم دراسة ااجزاء ا خط مواسير WHAMOسر فى ا سبة با
لى اسيب مختلفة بطول ها اقطار وم ون من ستة اجزاء م واستخدمت مضخة فى بداية 5252 مخط. هاية ا سائل ثابت داخله فى سوب ا ي خزان م سائل ا ضخ ا خط ا
تيجة ماسورة متغير داخل ا ضغط ا ها تأثير ملحوظ علي ا ر ذ متغيرات سابقة ا دراسة ان ا اوضحت اهواء فى بداية توازن او خزان ا ما وجد ان وضع خزان ا مائية مواسير قادر على حماية لمطرقة ا خط ا
سر فى خط ة وجود مائية فى حا مطرقة ا دراسة ان ا مائية. ايضا اوضحت ا مطرقة ا خط من تأثير ا اى خارجها ماسورة ا ى داخلها او تسربها من داخل ا ماسورة ا ميا من خارج ا مواسير قد تسبب دخول ا ا