Analysis of Turbofan Design Options for an Advanced Single-Aisle Transport Aircraft Mark D. Guynn * NASA Langley Research Center, Hampton, VA, 23681 Jeffrey J. Berton, † Kenneth L. Fisher, ‡ William J. Haller, § and Michael T. Tong ** NASA Glenn Research Center, Cleveland, Ohio, 44135 and Douglas R. Thurman †† Army Research Lab, Cleveland, Ohio, 44135 The desire for higher engine efficiency has resulted in the evolution of aircraft gas turbine engines from turbojets, to low bypass ratio, first generation turbofans, to today's high bypass ratio turbofans. It is possible that future designs will continue this trend, leading to very-high or ultra-high bypass ratio (UHB) engines. Although increased bypass ratio has clear benefits in terms of propulsion system metrics such as specific fuel consumption, these benefits may not translate into aircraft system level benefits due to integration penalties. In this study, the design trade space for advanced turbofan engines applied to a single-aisle transport (737/A320 class aircraft) is explored. The benefits of increased bypass ratio and associated enabling technologies such as geared fan drive are found to depend on the primary metrics of interest. For example, bypass ratios at which fuel consumption is minimized may not require geared fan technology. However, geared fan drive does enable higher bypass ratio designs which result in lower noise. Regardless of the engine architecture chosen, the results of this study indicate the potential for the advanced aircraft to realize substantial improvements in fuel efficiency, emissions, and noise compared to the current vehicles in this size class. Nomenclature ADP = Aerodynamic Design Point ANOPP = Aircraft Noise Prediction Program ASAT = Advanced Single-Aisle Transport BPR = Bypass Ratio EIS = Entry-Into-Service EPNL = Effective Perceived Noise Level FAR = Federal Aviation Regulations FLOPS = Flight Optimization System FPR = Fan Pressure Ratio HPC = High Pressure Compressor HPT = High Pressure Turbine LPC = Low Pressure Compressor * Aerospace Engineer, Aeronautics Systems Analysis Branch, MS 442, Senior Member AIAA. † Aerospace Engineer, Multidisciplinary Design & Optimization Branch, MS 5-11. ‡ Aerospace Engineer, Multidisciplinary Design & Optimization Branch, MS 5-11, Member AIAA. § Aerospace Engineer, Multidisciplinary Design & Optimization Branch, MS 5-11, Member AIAA. ** Aerospace Engineer, Multidisciplinary Design & Optimization Branch, MS 5-11, Member AIAA. †† Aerospace Engineer, Multidisciplinary Design & Optimization Branch, MS 5-11. American Institute of Aeronautics and Astronautics
Transcript
Analysis of Turbofan Design Options for an AdvancedSingle-Aisle Transport Aircraft
Mark D. Guynn *
NASA Langley Research Center, Hampton, VA, 23681
Jeffrey J. Berton, † Kenneth L. Fisher, ‡ William J. Haller, § and Michael T. Tong**
NASA Glenn Research Center, Cleveland, Ohio, 44135
and
Douglas R. Thurman††
Army Research Lab, Cleveland, Ohio, 44135
The desire for higher engine efficiency has resulted in the evolution of aircraft gasturbine engines from turbojets, to low bypass ratio, first generation turbofans, to today'shigh bypass ratio turbofans. It is possible that future designs will continue this trend, leadingto very-high or ultra-high bypass ratio (UHB) engines. Although increased bypass ratio hasclear benefits in terms of propulsion system metrics such as specific fuel consumption, thesebenefits may not translate into aircraft system level benefits due to integration penalties. Inthis study, the design trade space for advanced turbofan engines applied to a single-aisletransport (737/A320 class aircraft) is explored. The benefits of increased bypass ratio andassociated enabling technologies such as geared fan drive are found to depend on theprimary metrics of interest. For example, bypass ratios at which fuel consumption isminimized may not require geared fan technology. However, geared fan drive does enablehigher bypass ratio designs which result in lower noise. Regardless of the engine architecturechosen, the results of this study indicate the potential for the advanced aircraft to realizesubstantial improvements in fuel efficiency, emissions, and noise compared to the currentvehicles in this size class.
* Aerospace Engineer, Aeronautics Systems Analysis Branch, MS 442, Senior Member AIAA.† Aerospace Engineer, Multidisciplinary Design & Optimization Branch, MS 5-11.‡ Aerospace Engineer, Multidisciplinary Design & Optimization Branch, MS 5-11, Member AIAA.§ Aerospace Engineer, Multidisciplinary Design & Optimization Branch, MS 5-11, Member AIAA.** Aerospace Engineer, Multidisciplinary Design & Optimization Branch, MS 5-11, Member AIAA.†† Aerospace Engineer, Multidisciplinary Design & Optimization Branch, MS 5-11.
American Institute of Aeronautics and Astronautics
LPT = Low Pressure TurbineLTO = Landing-Takeoff CycleNPSS = Numerical Propulsion System SimulationOEW = Operating Empty WeightOPR = Overall Pressure RatioPDCYL = Point Design of Cylindrical-bodied aircraftTOC = Top-Of-ClimbTSFC = Thrust Specific Fuel ConsumptionUHB = Ultra-High Bypass ratioWATE = Weight Analysis of Turbine Engines
I. Introduction
AS aircraft manufacturers Boeing and Airbus continue to develop and mature new twin-aisle, wide body aircraftdesigns in the 210-350 seat class, for scheduled first deliveries in 2010 and 2013 respectively, it is anticipated
that the next major development undertaking for both companies will be a new narrow body aircraft in the Boeing737/Airbus A320 class. Boeing and Airbus have been engaged in studies to investigate replacement designs for the737 and A320, and published reports indicate that both manufacturers are depending on a next generation engine topower these new designs. 1 What has yet to be decided is the most attractive advanced engine design for this class ofaircraft in light of the current metrics of interest in the aviation industry.
The large fuel consumption and operating cost reductions necessary to make a new single-aisle transport designeconomically viable will require substantial improvements in propulsion system efficiency. In the past, the desire forhigher engine efficiency has resulted in the evolution of aircraft gas turbine engines from turbojets (bypass ratio(BPR) of 0), to low bypass ratio, first generation turbofans (BPR=1-2), to today’s high bypass ratio turbofans(BPR=5-10). It is possible that engines for the 737/A320 replacement will continue this trend, leading to very-highor ultra-high bypass ratio (UHB) engines. Because of the potential for improved propulsive efficiency, and thecomplementary benefit of lower engine noise, the use of UHB engines has been studied many times over the pastseveral decades and there are numerous publications addressing the topic. References 2 through 4 provide a fewexamples. Results published over the years include both positive and negative assessments of UHB engines,depending on the assumptions made and the metrics of interest.
Over time the baseline technologies, market environment (e.g., fuel cost), metrics of interest, and targetapplications change, dictating that concepts such as the UHB engine be periodically revisited. In recent years, fuelefficiency, emissions, and noise have become key metrics for aircraft/engine performance. Rising fuel costs havegreatly elevated the importance of fuel efficiency to the overall profitability of airlines and the success of an aircraftdesign. Noise and emissions are also projected to be of increasing importance in aircraft design as the demand for airtravel grows. Substantial reductions in aircraft noise and emissions are required to enable unconstrained aviationgrowth without a sharply increasing negative impact on the environment. The 737/A320 class aircraft considered inthis study represent a significant portion of the global airline fleet. Sixty-five percent of the new aircraft producedover the next 20 years are projected to be in this class. 5 Advances made to reduce the noise and emissions of theseaircraft could provide a considerable positive contribution to the goal of minimizing the future environmental impactof aviation.
II. Study Objectives and ApproachThe primary objective of this advanced single-aisle transport (ASAT) engine concept study was to determine if
the thrust specific fuel consumption (TSFC) and noise benefits of higher bypass ratio engines translate into overallaircraft system level benefits for a 737 class vehicle entering service in the 2015-2020 time frame. (The scope of thisstudy was limited to ducted turbofan engines, open rotor designs may also be viable candidates for a future ASATaircraft and are the focus of a separate study.) The approach taken was to develop a series of analytical enginemodels, apply them to a common airframe model, and assess the overall performance and noise characteristics. Themain parameter of interest for the study was design fan pressure ratio (FPR). Bypass ratio is inversely proportionalto fan pressure ratio. As fan pressure ratio is reduced, to maintain thrust fan mass flow must increase, which resultsin higher bypass ratio. It was quickly determined during the initial stages of the study that other key engine designchoices have a significant impact on the effects of fan pressure ratio and the number of trade parameters wasexpanded. The study was conducted in three analysis “spirals” having different design ground rules andassumptions. Each spiral resulted in 16 different configurations for a total of 48 engine/airframe combinations which
American Institute of Aeronautics and Astronautics
were analyzed for performance and noise characteristics. This paper presents a brief overview of the study and asummary of the results, additional details are provided in reference 6.
III. Modeling and Analysis Methodology
A. Propulsion System ModelingSince the propulsion system was the primary area of focus for this study, a substantial amount of effort was
applied to building analytical models of the study engines. Developing models which were adequately representativeof engines that could be available for a 737/A320 replacement aircraft was an important objective. However, just asimportant was the requirement of consistency among the engine models. After reviewing available material onprojected advanced propulsion technologies for the 2015 timeframe, the propulsion systems analysis team developeda common design approach and set of technology assumptions which were utilized throughout to enable thisconsistency. The unique characteristics of individual engine architectures may make some assumptions lessappropriate for certain engines types. This makes applying consistent ground rules and technology assumptionsacross such a wide range of engine designs problematic. The degree to which the resulting study engines are trulyequivalent in technology and design optimality is uncertain.
The basic engine architecture for all the engines in this study was a two spool, separate flow turbofan. Thevariations evaluated included the fan drive approach (geared vs. direct drive), the fan pressure ratio, the low spool-high spool compression work split, the type of fan nozzle (fixed or variable geometry), the overall pressure ratio,and the design Mach number. For a given analysis spiral, all engines were developed with the same AerodynamicDesign Point (ADP) (Mach number, altitude, and thrust) and same overall pressure ratio at that point. The ADP wasselected to represent a nominal top-of-climb (TOC) condition for the advanced airframe. Although for a given spiralthe overall pressure ratio is the same for all the engines, two different compressor work splits were considered. For agiven fan pressure ratio and overall pressure ratio, the “low work” engines have a lower pressure rise across the lowpressure compressor (and a higher pressure rise across the high pressure compressor) compared to the “high work”engines. Inlet mass flow for each engine was selected to achieve the net thrust requirement at ADP. In addition tomeeting a thrust target at TOC conditions, a SLS thrust target of 23,000 lb (hot day, ISA+27°F) was also met byadjusting design point burner fuel-to-air ratio. Low fan pressure ratio engines inherently have a greater loss of thrustwith airspeed (thrust lapse) than high fan pressure ratio engines. To achieve equal ADP thrust capability, the low fanpressure ratio engines are operated at higher temperatures. The ADP operating temperatures for the low fan pressureratio engines were below the maximums allowed for the materials assumed, but the higher temperatures could stilllead to shorter engine hot section life and greater maintenance requirements than the high fan pressure ratio engines.Engine life and maintenance issues were not assessed as part of this study. For low fan pressure ratio engines, avariable area fan exhaust nozzle was needed to maintain adequate fan surge margin. Throat area of the variable areanozzle was varied at off-design to maintain the fan operating conditions equal to, or very close to, the fan peakefficiency operating line. Cycle analysis for the engines was performed with the NPSS (Numerical PropulsionSystem Simulation) code . 7-9 Analysis of the aeromechanical characteristics and estimates of the engine weight(including fan gearbox if applicable) were performed with the WATE (Weight Analysis of Turbine Engines) code. 10-
12 Estimates for engine NO X emission indices (grams of NOX emitted from the engine per kilogram of fuelconsumed by the engine) were obtained from a correlation developed by NASA combustor technologists during thelatter stages of NASA’s Ultra-Efficient Engine Technology program.
B. Aircraft Sizing AnalysisTo evaluate and compare aircraft system level performance, the study engines were combined with an advanced
technology, single-aisle commercial transport airframe model. The aircraft sizing and synthesis computer codeFLOPS (Flight Optimization System) 13 was used as the primary aircraft level sizing and analysis tool. Since theobjective of the study was a comparison of engine concepts, the primary modeling focus was the propulsion system.However, inaccuracies in the airframe model can skew the system level impacts of the engine designs and influencethe overall conclusions. Special sizing considerations introduced by large diameter, UHB engines were addressedthrough simplifying assumptions and enhancements to the FLOPS analysis. Spreadsheet analyses were used todetermine landing gear length, engine-out drag, and required vertical tail size so that impacts of large diameterengines could be properly captured. Enhancements to basic FLOPS capabilities were also made in the structuralweight and aerodynamics areas. The wing and fuselage structural weight estimates of FLOPS were replaced withestimates from PDCYL. PDCYL offers a less empirical, more analytical weight estimation methodology that ismore sensitive to parameters such as engine weight and location. 14 FLOPS aerodynamic predictions were enhanced
American Institute of Aeronautics and Astronautics
through a model calibration process incorporating details of the 737-800 high speed and low speed aerodynamicperformance.1. Baseline Airframe Model
The Boeing 737-800 (with winglets) was used as a starting point for development of the ASAT airframe model.A baseline FLOPS model of a 737-800 like aircraft (162 passenger, mixed-class configuration) was developed usinga combination of publicly available data on the 737-800 geometry, weight, and performance characteristics; 15 aCFM56-7B based engine model developed at NASA Glenn; and proprietary aerodynamic data. Model weightpredictions were calibrated by setting maximum ramp weight and landing weight to the Boeing reported values(174,700 lb and 146,300 lb respectively) and comparing the predicted operating empty weight (OEW) to the Boeingdata. Although the model OEW matched the Boeing data to within 0.5%, calibration adjustments were made to themodel to match OEW exactly. FLOPS aerodynamic predictions were calibrated to 737-800 high speed aerodynamicdata. It was not possible to exactly match the 737-800 data at all conditions; however, it was possible to obtain anexcellent match around the cruise flight conditions. FLOPS predicted mission performance was calibrated to aspecific point on the 737-800 payload-range diagram provided in reference 15. Prior to adjustments, the FLOPSpredicted range for the calibration point was ~4% high. Assuming that the mission profile is adequately modeledand the aerodynamic model is accurate, the higher FLOPS range is indicative of an under prediction of engineTSFC. The NASA-developed engine deck was therefore adjusted so that the FLOPS results matched publishedrange capability. Note that it is not possible to separate the impacts of inaccuracies in mission profile, engine TSFC,and aircraft L/D when matching range performance. Even though adjustment was only made to the engine model,the discrepancy is most likely due to a combination of differences in engine characteristics, aerodynamiccharacteristics, and mission definition. Evaluation and calibration of the FLOPS model was also performed fortakeoff and landing performance. After some adjustment to the inputs based on 737-800 aerodynamic data, takeoffand landing distances for nominal conditions were matched to within ~1.0% of the reported values.2. ASAT Airframe Model
The ASAT airframe model is a derivative of the 737-800 like baseline discussed above, intended to berepresentative of a potential advanced technology replacement aircraft. A conventional airframe-engine layout likethe 737-800 was assumed based on the hypothesis that unconventional approaches are not sufficiently mature tosupport the expected entry-into-service (EIS) date for this vehicle. The primary airframe technology advancementassumed was extensive use of composite materials for the airframe structure. For the Boeing 787 currently indevelopment, as much as 50 percent of the primary structure is made of composite materials. ‡‡ Other minortechnology improvements based on the 787 design included an increase in hydraulic pressure and a slight dragreduction. Changes were also made to the design mission to reflect performance enhancements projected for anadvanced aircraft in this vehicle class. Design range (with 32,400 lb payload) was increased from 3060 nm to 3250nm. Two cruise Mach numbers were analyzed, 0.72 and 0.80 (typical cruise Mach for the 737-800 is 0.785 15). Thebasic 737-800 geometry was not changed for the ASAT model, except for changes in wing sweep corresponding tothe changes in cruise Mach number.3. Propulsion Airframe Integration
Propulsion-airframe integration is one of the key considerations for large diameter, UHB engines. Reference 4provides an excellent summary of the integration issues associated with large diameter engines and was used as abasis for the current study. Concerns highlighted in reference 4 include nacelle drag, ground clearance, windmillingdrag, thrust reverser operation, and engine placement. These concerns were addressed to varying degrees in thestudy. A simple geometric method was developed to estimate the required landing gear length. Windmilling andengine-out drag estimates were made using handbook methods 16 and the vertical tail was sized based onconsideration of both tail volume coefficient and one-engine-out control. Some propulsion-airframe integrationissues were outside the scope of this study. Examples of issues outside the scope of this study include impacts ofnacelle diameter on pylon and flap design and potential changes in thrust reverser operation associated with largediameter engines. (An estimate of thrust reverser weight was included for all engines, however.)
C. Noise AnalysisThe primary tools used for the noise analysis included: NPSS for the engine cycle analysis; WATE for the
engine aeromechanical and flowpath analysis; FLOPS for the aircraft trajectory simulation; and ANOPP (AircraftNoise Prediction Program) Level 2617,18 for the source noise prediction and propagation. The NPSS and WATEcodes were used to generate input data necessary for the ANOPP source noise modeling. Adjustments representingnoise reduction technologies were made to the source noise spectra prior to propagation. ANOPP noise propagation
‡‡ 787 Dreamliner Program Fact Sheet. http://www.boeing.com/commercial/787family/programfacts.html . Accessed 4/9/2007.
4American Institute of Aeronautics and Astronautics
modeling included spherical spreading, atmospheric attenuation, ground effects, reflections, and lateral attenuation.The Effective Perceived Noise Level (EPNL) was calculated at the noise certification points defined in FAR Part36. 19 EPNL is an integration of the ground observer perceived noise time history which depends on aircrafttrajectory, noise spectra propagation, frequency integration, and tonal content and amplitude penalties.
The noise analysis tools were first used to model a 737-800/CFM56-7B and the analytical results were comparedto noise certification data for that airplane . 20 The CFM56-7B was analytically modeled in NPSS using data availablefrom several public-domain sources, no proprietary data were used. The thermodynamic, aeromechanical, andgeometric predictions for the CFM56-7B were used as inputs to ANOPP’s current propulsion source noiseprediction methods. Good agreement between the certification data and analytical prediction was obtained for thelateral (sideline) and approach conditions. Noise at the flyover condition was over predicted by approximately 4EPNdB. Through more detailed analysis and comparison of predicted source noise levels to proprietary data it wasdetermined that the fan noise predictions might be about 5 dB too high at the flyover, cutback power setting. Thereare many sources of uncertainty in the noise analysis process, however, including the engine cycle andaeromechanical modeling (NPSS and WATE), the trajectory and throttle setting assumptions, and numerous otherpotential discrepancies. Because the exact cause of the error cannot be readily determined and the level of error inthe results was deemed acceptable for this comparative study, no attempt was made to calibrate the noise analysistools and eliminate the discrepancy between predicted and actual 737-800 noise levels.
A series of advanced noise reduction technologies were applied to the study configurations consistent with the2015-2020 EIS target for the vehicle. Chevrons were applied to all core nozzles and to all fixed-area bypass nozzles.Chevrons were not applied to bypass nozzles of the low fan pressure ratio engines with variable area nozzles due topotential conflict with the variable area nozzle design. Jet noise benefits of the nozzle chevrons were determinedanalytically using the 2004 Stone jet noise prediction method in ANOPP. 21 This method is based on 1997 acousticmeasurements of chevron-equipped nozzles from NASA Glenn’s Aeroacoustic Propulsion Laboratory’s NozzleAcoustic Test Rig freejet facility.22 Conventional inlet, interstage, and aft fan duct liners were applied to reduce faninlet and discharge noise. The benefits of these liners were modeled by applying an acoustic suppression “map” of1/3rd octave band sound pressure level decrements to the hardwall fan source spectra predicted by ANOPP. Thisapproach differs from the 737-800/CFM56-7B validation study described above, where ANOPP’s built-in treatmentsuppression prediction module 23 was used, since a more aggressive treatment configuration would likely be used inan advanced engine. The liner suppression map was based on measured acoustic data of 22-inch diameter fan testarticles in NASA Glenn’s 9×15 Low Speed Wind Tunnel. 24 In addition to conventional liners, two advancedtechnologies were applied for fan noise reduction; soft vane stators and over-the-rotor foam metal treatment . 25 Bothof these technologies are applications of acoustic treatment in areas of the engine which currently do not havetreatment: the fan vanes and above the fan rotor tips. Acoustic tests of both of these technologies were conducted atNASA Glenn in 2008. Airframe noise reduction technologies included innovative slat cove designs, flap porous tips,and landing gear fairings. These technologies are considered mature enough to be commensurate with the assumedEIS timeframe.
Higher bypass ratio, lower fan pressure ratio engines have inherently higher thrust lapse (i.e., available thrustdecreases more rapidly with increase in aircraft speed). The impact of higher thrust lapse is manifested in changes inclimb rates, airspeeds, and throttle settings for takeoff and landing trajectories. Certification noise is impacted bythese trajectory changes since propulsion noise is a strong function of throttle setting, airframe noise is a strongfunction of airspeed, and altitude and distance from the observer strongly affect noise from all sources. Detaileddeparture and approach trajectories were modeled in FLOPS to enable these engine dependent characteristics to becaptured in the analysis, which in turn enabled the influence of trajectory on the noise results to be properlycaptured.
IV. Study Trade Space
As mentioned previously, the study was conducted in three separate analysis spirals. The primary differencesbetween the three spirals were engine overall pressure ratio at ADP and ADP/cruise Mach number. All of theengines in Spiral 1 were designed with an overall pressure ratio (at the top-of-climb ADP) of 32. This overallpressure ratio is similar to that of the CFM56 engines that are used on the current Boeing 737 and Airbus A320.Current technology large engines can have overall pressure ratios above 40. Although technology advances can leadto higher overall pressure ratios, higher pressure ratios lead to smaller compressor blades. There are limits to howsmall a compressor blade can be manufactured and the smaller the blade becomes the less efficient it is due toexaggerated blade tip clearance losses and Reynolds number effects. For these reasons it is not possible to simplyscale down a high overall pressure ratio 80,000 lb thrust engine to a 25,000 lb thrust engine. In Spiral 1, a
American Institute of Aeronautics and Astronautics
conventional, fairly conservative design approach was taken which enabled a design overall pressure ratio of 32while maintaining blade heights greater than 0.5 inches. Design parameters for the Spiral 1 engines are summarizedin Table 1.
Table 1. Spiral 1 Engine Design ParametersEngine Designation Fan Drive Fan Nozzle ADP FPR OPR LPC PR HPC PR
Based on projections of a higher overall pressure ratio for an advanced engine of this class, a second set of analyses,Spiral 2, was conducted with a more aggressive design approach to enable an increase in overall pressure ratio to 42.In particular, the minimum blade height constraint was relaxed. The engine design parameters for Spiral 2 are shownin Table 2. Changes in the low pressure compressor (LPC) and high pressure compressor (HPC) pressure ratiosassociated with the higher overall pressure ratio can be seen by comparison to Table 1.
Table 2. Spiral 2 Engine Design ParametersEngine Designation Fan Drive Fan Nozzle ADP FPR OPR LPC PR HPC PR
The design cruise Mach number selected for the Spiral 1 and Spiral 2 advanced vehicle designs was 0.80, comparedto a long range cruise Mach number of 0.785 for the 737/800. Some have suggested that to increase fuel efficiency
6American Institute of Aeronautics and Astronautics
the replacement aircraft for the Boeing 737 and Airbus A320 families will actually be designed to fly significantlyslower. Because of environmental and economic pressures, airlines may be willing to give up something inproductivity (speed) for reduced fuel consumption. For Spiral 3, the cruise Mach number was reduced to 0.72 toassess the impact of cruise Mach number on the relative system level performance for the different engine types. (Atable of the Spiral 3 engine design parameters is not shown since the only difference compared to Table 2 is an ADPMach number of 0.72 instead of 0.80.)
V. Summary of Results
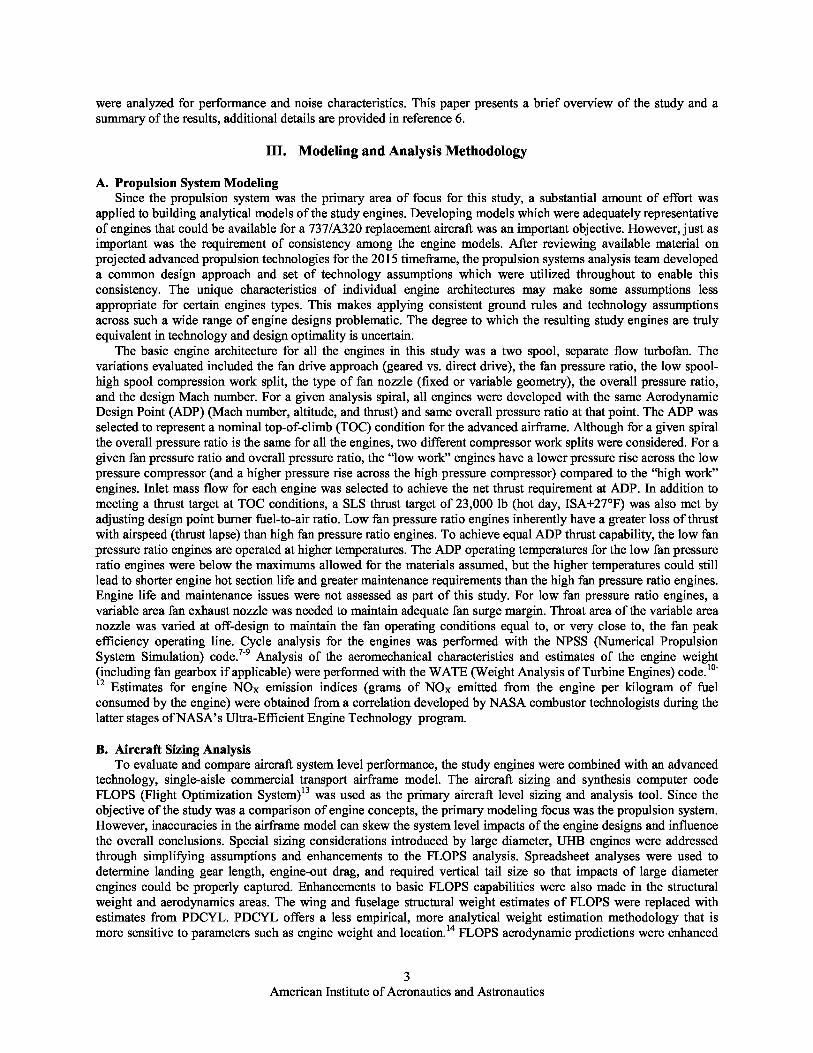
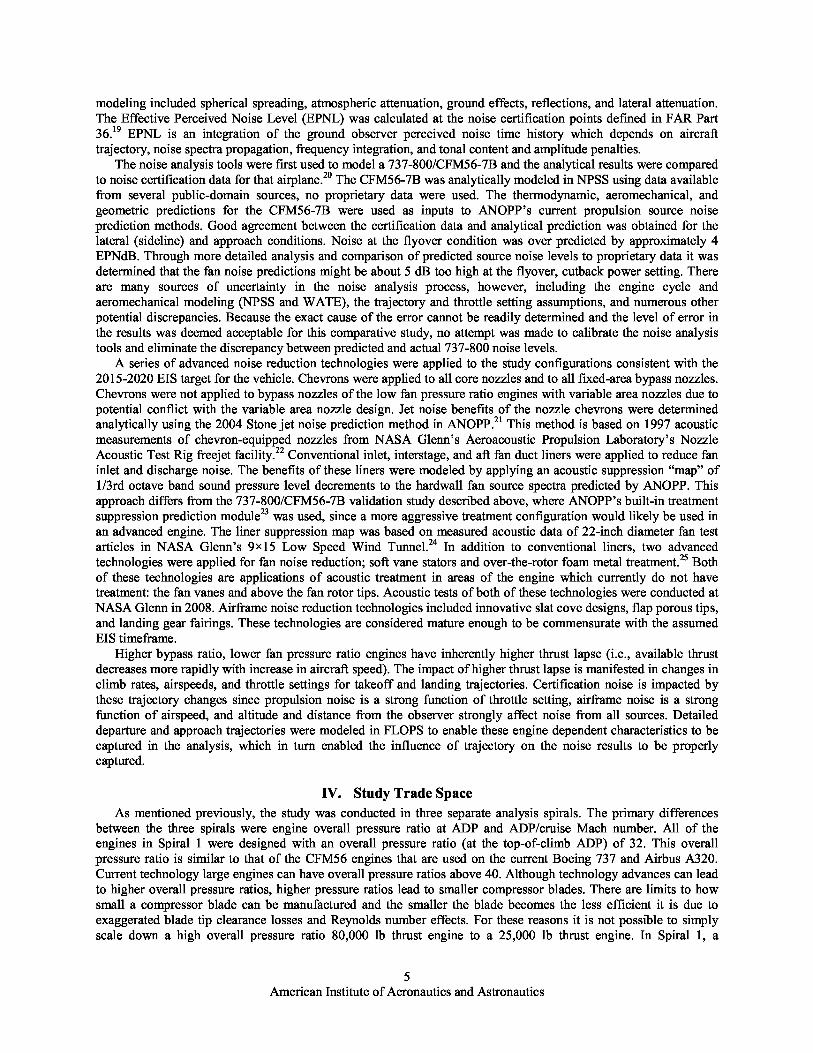
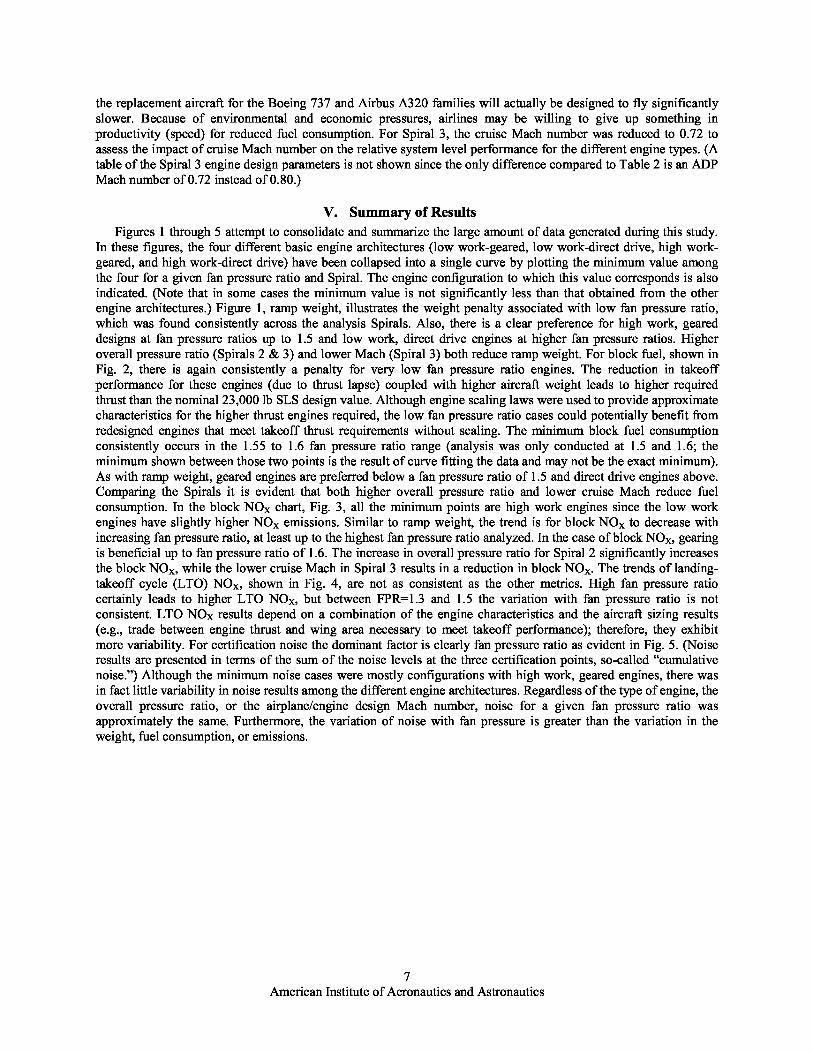
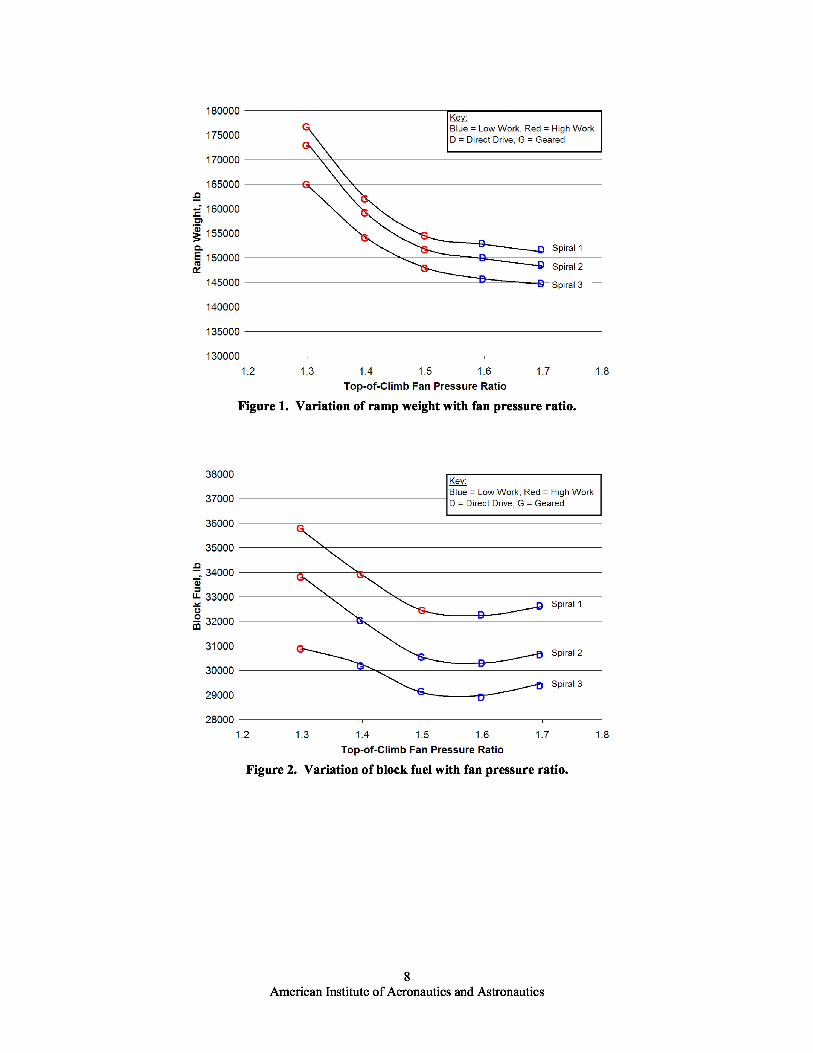
Figures 1 through 5 attempt to consolidate and summarize the large amount of data generated during this study.In these figures, the four different basic engine architectures (low work-geared, low work-direct drive, high work-geared, and high work-direct drive) have been collapsed into a single curve by plotting the minimum value amongthe four for a given fan pressure ratio and Spiral. The engine configuration to which this value corresponds is alsoindicated. (Note that in some cases the minimum value is not significantly less than that obtained from the otherengine architectures.) Figure 1, ramp weight, illustrates the weight penalty associated with low fan pressure ratio,which was found consistently across the analysis Spirals. Also, there is a clear preference for high work, geareddesigns at fan pressure ratios up to 1.5 and low work, direct drive engines at higher fan pressure ratios. Higheroverall pressure ratio (Spirals 2 & 3) and lower Mach (Spiral 3) both reduce ramp weight. For block fuel, shown inFig. 2, there is again consistently a penalty for very low fan pressure ratio engines. The reduction in takeoffperformance for these engines (due to thrust lapse) coupled with higher aircraft weight leads to higher requiredthrust than the nominal 23,000 lb SLS design value. Although engine scaling laws were used to provide approximatecharacteristics for the higher thrust engines required, the low fan pressure ratio cases could potentially benefit fromredesigned engines that meet takeoff thrust requirements without scaling. The minimum block fuel consumptionconsistently occurs in the 1.55 to 1.6 fan pressure ratio range (analysis was only conducted at 1.5 and 1.6; theminimum shown between those two points is the result of curve fitting the data and may not be the exact minimum).As with ramp weight, geared engines are preferred below a fan pressure ratio of 1.5 and direct drive engines above.Comparing the Spirals it is evident that both higher overall pressure ratio and lower cruise Mach reduce fuelconsumption. In the block NOX chart, Fig. 3, all the minimum points are high work engines since the low workengines have slightly higher NOX emissions. Similar to ramp weight, the trend is for block NO X to decrease withincreasing fan pressure ratio, at least up to the highest fan pressure ratio analyzed. In the case of block NO X, gearingis beneficial up to fan pressure ratio of 1.6. The increase in overall pressure ratio for Spiral 2 significantly increasesthe block NOX, while the lower cruise Mach in Spiral 3 results in a reduction in block NO X. The trends of landing-takeoff cycle (LTO) NOX, shown in Fig. 4, are not as consistent as the other metrics. High fan pressure ratiocertainly leads to higher LTO NOX, but between FPR=1.3 and 1.5 the variation with fan pressure ratio is notconsistent. LTO NOX results depend on a combination of the engine characteristics and the aircraft sizing results(e.g., trade between engine thrust and wing area necessary to meet takeoff performance); therefore, they exhibitmore variability. For certification noise the dominant factor is clearly fan pressure ratio as evident in Fig. 5. (Noiseresults are presented in terms of the sum of the noise levels at the three certification points, so-called “cumulativenoise.”) Although the minimum noise cases were mostly configurations with high work, geared engines, there wasin fact little variability in noise results among the different engine architectures. Regardless of the type of engine, theoverall pressure ratio, or the airplane/engine design Mach number, noise for a given fan pressure ratio wasapproximately the same. Furthermore, the variation of noise with fan pressure is greater than the variation in theweight, fuel consumption, or emissions.
American Institute of Aeronautics and Astronautics
Figure 1. Variation of ramp weight with fan pressure ratio.
2 1,'3 14 1:6 1,7
'T6pp46f-'Climb,Fan,Pressure.Ratio
Figure 2. Variation of block fuel with fan pressure ratio.
8American Institute of Aeronautics and Astronautics
1,i5 1,6 1.7 1,18''Top=of-Climb ,Fan ,P,ressu re ,Ratio
Figure 3. Variation of block NOX with fan pressure ratio.
'71.2 1,3 14 1;15' 1;:6' 1;'7 1,18
Top-of=Climb,Fan Pressure ,Ratio
Figure 4. Variation of LTO NOX with fan pressure ratio (NO X per LTO cycle).
9American Institute of Aeronautics and Astronautics
Figure 5. Variation of cumulative noise with fan pressure ratio.
As evidenced by the varying colors, letters, and trend lines in Figs. 1 though 5, the study results did not lead to aclear “winner” in terms of the best engine design for this application. The low fan pressure ratio, UHB enginesstudied do lead to lower aircraft noise, but at the expense of slightly higher fuel consumption and total NOX
emissions. For an isolated engine, lower fan pressure ratio (higher bypass ratio) is beneficial for both reducing fuelconsumption and reducing noise. However, once incorporated into an aircraft system, a desire for low noise and adesire for low fuel consumption may not lead to the same optimum fan pressure ratio. Aircraft noise and LTO NO X
are reduced by driving fan pressure ratio as low as practically possible, whereas optimum vehicle weight, block fuel,and block NOX occur towards the other end of the fan pressure ratio range analyzed. The relative importance ofefficiency, noise, and emissions will dictate the overall best engine design.
Since no single engine provides the best performance across all of the metrics, there are a series of design trade-offs that must be accepted. For example, choosing a low fan pressure ratio because of the noise benefits incurs anincrease in fuel consumption compared to what could be achieved with a higher fan pressure ratio design. Themagnitudes of these various trade-offs are presented in Table 3 for Spiral 2. For each metric column, the minimumvalue is used as the baseline for the remaining cases. The values in the remaining rows indicate the magnitude of thepenalty incurred from selecting that particular engine, relative to the best possible result. For example, in Table 3 thedirect drive, low work, FPR=1.5 case has 4.3% higher ramp weight than the minimum (direct drive, low work LPC,FPR=1.7); 1.1% greater block fuel consumption than the minimum (direct drive, low work LPC, FPR=1.6); 12.8%greater block NOX than the minimum (direct drive, high work LPC, FPR=1.7); 0.8% greater LTO NO X than theminimum (geared, high work LPC, FPR=1.5); and 5.4 EPNdB higher cumulative noise than the minimum (geared,high work LPC, FPR=1.4). (The geared, FPR=1.3 and direct drive, FPR=1.4 cases were not included in the trade-offanalysis because of practicality issues with those designs. The geared, FPR=1.3 engines have very large diameters,leading to an unrealistically long landing gear given the conventional under-wing propulsion-airframe integrationapproach assumed for the study. The direct drive, FPR=1.4, designs are an extreme case for the direct drive enginearchitecture. Under the design ground rules used for this study, the slow low-spool speed necessitates a large numberof low pressure turbine (LPT) stages, leading to an extremely heavy and long engine. Both of these engines werecarried through the complete set of analyses, however, in order to fully investigate performance trends as fanpressure ratio was decreased to the extreme.)
10American Institute of Aeronautics and Astronautics
For Spiral 2, pursuing minimum noise (geared, high work LPC, FPR=1.4), leads to a penalty in fuel consumptionof ~6%. Conversely, pursuing minimum fuel consumption (direct drive, low work LPC, FPR=1.6) leads to ~12EPNdB higher cumulative noise. Which design is better overall depends, in part, on the relative value of low noiseand low fuel consumption to the airlines, which in turn depends on external factors such as fuel cost and airportnoise restrictions. Similar analysis was also performed for Spirals 1 and 3 and, although the magnitudes of the trade-offs varied slightly, the minimum cases for each metric and general conclusions were the same. Selecting a balanceddesign is somewhat subjective; however, for all three Spirals the FPR=1.5 cases seemed to offer the best overallperformance. In particular, the low work, geared and direct drive cases and the high work, geared case haverelatively good weight, fuel efficiency, noise, and emissions results. (The high work, direct drive, FPR=1.5 case hasinferior performance to the other FPR=1.5 cases.) Bypass ratios for these engines are in the ~12.5-14.5 range, at thelower end of what is usually considered “ultra-high bypass ratio.” It is interesting to compare the generalcharacteristics of these engines to those of the geared engine being offered by Pratt and Whitney for the BombardierCSeries aircraft. Although the details of the Pratt and Whitney engine are not publically known, there are somesimilarities in the general parameters. The target thrust level for the CSeries engine is 23,000 lb, 26 the same SLStarget thrust used in this study. The fan diameter for the CSeries engine is 73 inches ,26 the same as the Spiral 1 and 2FPR=1.5 engines. Bypass ratio is expected to be 12, 27 again similar to the FPR=1.5 engines in the study. Noiseperformance for the P&W engine is projected to be Stage 4 minus 20 EPNdB. 27 The FPR=1.5 configurations in thisstudy result in a Stage 4 margin of ~19-24 EPNdB (the range reflects uncertainty in ANOPP flyover noisepredictions).
The potential overall benefits of the advanced study vehicles compared to current aircraft were also assessed.The baseline for comparison was a 1998 EIS technology level vehicle (equivalent technology to 737-800/CFM56-7B), sized to match the design mission of the study vehicles. The advanced Spiral 1 vehicles offer up to a 15%reduction in ramp weight, up to a 24% reduction in block fuel consumption, up to a 73% reduction in block NO X
(block fuel and NOX based on a 3250 nm mission), and up to a 58% reduction in NO X emissions per landing-takeoffcycle. These maximum potential reductions occur for different engines designs, and a single vehicle would notachieve all of these reductions. The advanced technology of the Spiral 2 vehicles offers even greater potential thanthe Spiral 1 vehicles for reducing fuel consumption compared to current single-aisle vehicles. The potential fuelconsumption benefit is up to 29% and ramp weight could be up to 16% less. The Spiral 2 vehicles have less NO X
reduction potential than Spiral 1 due to the higher emission indices associated with the higher overall pressure ratioengines. The advanced combustor technology assumed for these engines still results in large NO X emission
11American Institute of Aeronautics and Astronautics
reductions, however. Up to 64% reduction in block NO X emissions and 54% reduction in NOX per LTO cyclecompared to the 1998 EIS technology baseline vehicle. The fuel consumption benefit of the ASAT, Spiral 3configurations is up to a 29% reduction compared to a 737-800 equivalent technology airplane designed for the
same mission (M=0.72 cruise with modified wing sweep, etc.), the same benefit as found in Spiral 2. Note however,that the reduction in fuel consumption of the Spiral 3 vehicles compared to a 737-800 type airplane (M=0.785) isslightly greater because of the additional benefit of lower cruise Mach. One area where the Spiral 3 technologybenefits differ from Spiral 2 is block NO X . The lower emission indices associated with the lower cruise Mach lead toa larger reduction in block NO X than in Spiral 2 (up to 69% compared to the 1998 EIS technology baseline airplane).In terms of noise benefits, the lowest noise practical ASAT configurations have almost a 25 EPNdB cumulativenoise reduction compared to the 737-800.
VI. Conclusions
• UHB engines are feasible for a 737/A320-class vehicle. In general, the larger diameter associated with UHBengines can be accommodated on this class of vehicle with relatively simple measures such as increased landinggear length or changes to wing dihedral (changes to wing dihedral were not explored in this study).
• Optimum engine fan pressure ratio depends on the metric of interest, as well as the ground rules, basic enginearchitectures, and assumptions used in the analysis. With the ground rules, architectures, and assumptions used inthis study: empty and ramp weight (often surrogate indicators of cost) are minimized with high fan pressure ratio;block fuel consumption is minimized with a fan pressure ratio of ~1.6; block NO X emissions are minimized withhigh fan pressure ratio; and LTO NO X and certification noise are minimized with fan pressure ratio as low aspossible. These fan pressure ratio trends do not change with variation in engine overall pressure ratio or designMach number.
• The primary benefit of the geared fan approach is to enable viable propulsion systems at lower fan pressureratios than possible with a direct drive fan. The geared fan approach is preferred for fan pressure ratios (top-of-climb) below 1.5 (roughly BPR >13). At a fan pressure ratio of 1. 5, a low work LPC, direct drive engine can provideoutcomes similar to a geared engine. Above a fan pressure ratio of 1.5, a low work, direct drive engine provides abetter overall aircraft system (for the metrics tracked in this study) than the geared engines.
• If the design goal is to minimize ramp weight, block fuel, or block NO X, for the engines in this study gearedfan engine technology is not necessary (since the minimums for these metrics occur at fan pressure ratios greaterthan 1.5.)
• If the design goal is to minimize airport area environmental impacts (i.e., aircraft noise and LTO NO X), ageared system would be the preferred approach because it enables a practical low fan pressure ratio engine design.
• Among the cases analyzed, the best balanced designs, performing well across all the metrics of interest (rampweight, fuel consumption, emissions, and noise), are fan pressure ratio 1.5 designs; either the high work LPC with ageared fan, or the low work LPC with either a geared or direct drive fan.
• Relative to 1998 EIS technology, the advanced configurations studied have the potential for significantbenefits: up to 29% reduction in fuel consumption and greater than 24 EPNdB cumulative noise reduction. Thesebenefits do not occur with the same engine design, however. The minimum fuel consumption designs have ~12EPNdB (cumulative) higher noise than the minimum noise designs and the minimum noise designs have up to 6%higher fuel consumption than the minimum fuel consumption designs.
Acknowledgments
The authors would like to thank Fay Collier for his support of this study while Principal Investigator for theSubsonic Fixed Wing Project of NASA’s Fundamental Aeronautics Program. Craig Nickol and Dennis Bartlett (ret.)of NASA Langley Research Center are acknowledged for their review and critique of the study approach andresults.
References
1Norris, G., “THE 737 STORY: Smoke and mirrors obscure 737 and Airbus A320 replacement studies,” Flight International,7 Feb. 2006.
2Lyon, T. A., and Hillery, R. D., “Geared Fan Engine Systems – Their Advantages and Potential Reliability,” AIAA 72-1173,November 1972.
3Dunican, M. G., “Installation of Innovative Turbofan Engines on Current Transport Airplanes,” AIAA 87-2921, September1987.
12American Institute of Aeronautics and Astronautics
4Daggett, D. L., Brown, S. T., and Kawai, R. T., “Ultra-Efficient Engine Diameter Study,” NASA CR-2003-212309, May2003.
5“Current Market Outlook 2008.” Boeing Commercial Airplanes, 2008.6Guynn, M. D., Berton, J. J., Fisher, K. L., Tong, M. T, and Thurman, D. R, “Engine Concept Study for an Advanced Single-
Aisle Transport,” NASA TM-2009-215784, 2009.7Lytle, J.K., “The Numerical Propulsion System Simulation: An Overview,” NASA TM-2000-209915.8NPSS User Guide Software Release: NPSS_1.6.3 AL.9NPSS Reference Sheets Software Release: NPSS_1.6.3 AL.10Onat, E., and Klees, G., “A Method to Estimate Weight and Dimensions of Large and Small Gas Turbine Engines,” NASA
CR 159481, 1979.11 Tong, M.T., Halliwell, I., Ghosn, L.J., “A Computer Code for Gas Turbine Engine Weight and Life Estimation,” ASME
Journal of Engineering for Gas Turbine and Power, volume 126, no. 2, April 2004.12 Tong, M.T., Naylor, B.A., “An Object-Oriented Computer Code for Aircraft Engine Weight Estimation,” GT2008-50062,
ASME Turbo-Expo 2008, June 9-13, 2008.13McCullers, L., “Aircraft Configuration Optimization Including Optimized Flight Profiles,” Proceedings of the Symposium
on Recent Experiences in Multidisciplinary Analysis and Optimi2ation, NASA CP 2327, April 1984.14Ardema, M. D., Chambers, M. C., Patron, A. P, Hahn, A. S., Miura, H., and Moore, M. D., “Analytical Fuselage and Wing
Weight Estimation of Transport Aircraft,” NASA TM 110392, May 1996.5“737 Airplane Characteristics for Airport Planning,” D6-58325-6, Boeing Commercial Airplanes, October 2005.
16Torenbeek, E., Synthesis of Subsonic Airplane Design. Kluwer Academic Publishers, Dordrecht, 1982, pp. 553-554.17Gillian, R. E., “Aircraft Noise Prediction Program User’s Manual,” NASA TM-84486, 1983.18Zorumski, W. E., “Aircraft Noise Prediction Program Theoretical Manual,” NASA TM-83199, 1981, Parts 1 and 2.19“Noise standards: Aircraft type and airworthiness certification,” Code of Federal Regulations, Title 14, Chapter I, Part 36.20Burley, C.L., Rawls, J.W., Jr., Berton, J.J., and Marcolini, M.A., “Aircraft System Noise Prediction,” NASA report to be
published, 2009.21 Stone, J.R., Krejsa, E.A., Clark, B.J., and Berton, J.J., “Jet Noise Modeling for Suppressed and Unsuppressed Aircraft in
Propulsion and Noise Reduction Technologies for Future Commercial Subsonic Engines – Separate-Flow Exhaust System NoiseReduction Evaluation,” Final Report: NAS3–27720, Area of Interest 14.3, General Electric Report R98AEB 152, May 1998.
23Kontos, K.B., Kraft, R.E., and Gliebe, P.R., “Improved NASA-ANOPP Noise Prediction Computer Code for AdvancedSubsonic Propulsion Systems. Volume 2: Fan Suppression Model Development,” NASA CR-202309, 1996.
24Neubert, R., Bock, L., Malmborg, E., and Owen-Peer, W., “Advanced Low Noise Research Fan Stage Design,” NASA CR97-206308, 1997.
25 Jones, M., Parrott, T., Sutliff, D., Hughes, C., “Assessment of Soft Vane and Metal Foam Engine Noise ReductionConcepts,” AIAA-2009-3142, 2009.
26Norris, G., “Simplified GTF,” Aviation Week and Space Technology, Vol. 168, No. 9, 3 Mar. 2008, pp. 26-27.27Flint, P., “Gearing Up for the Future,” Air Transport World, February 2008.
13American Institute of Aeronautics and Astronautics