51
Chapter 8 Analysis of Variance: Part 1 Oneway ANOVA
Chapter 8
Analysis of Variance: Part 1
Oneway ANOVA
Chapter 8
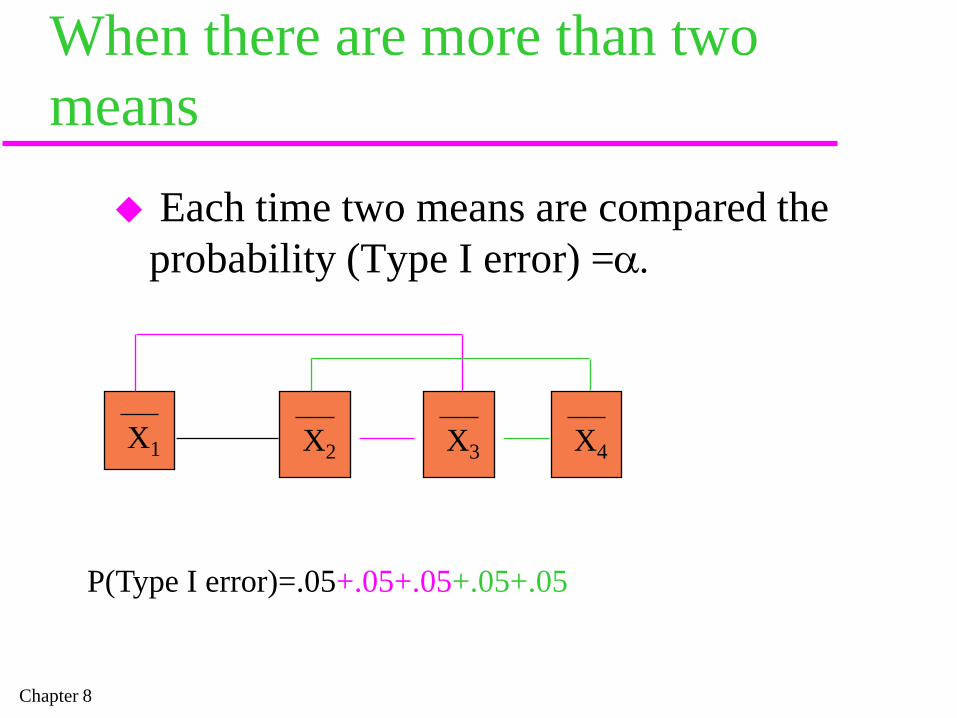
When there are more than two means
Each time two means are compared the probability (Type I error) =α.
Chapter 8
When there are more than two means
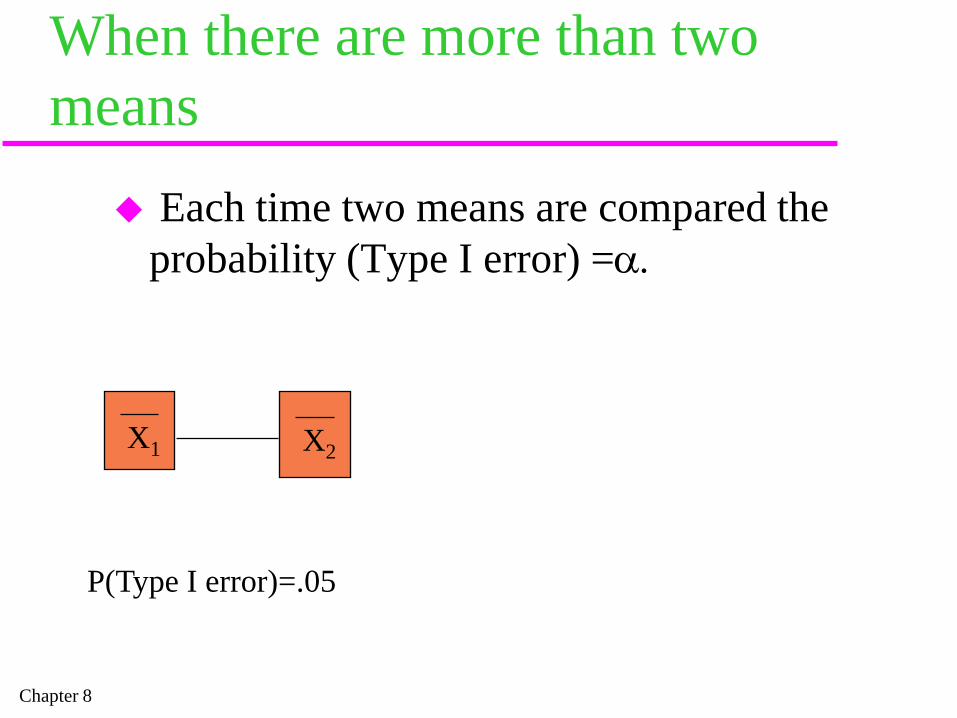
Each time two means are compared the probability (Type I error) =α.
X1 X2
P(Type I error)=.05
Chapter 8
When there are more than two means
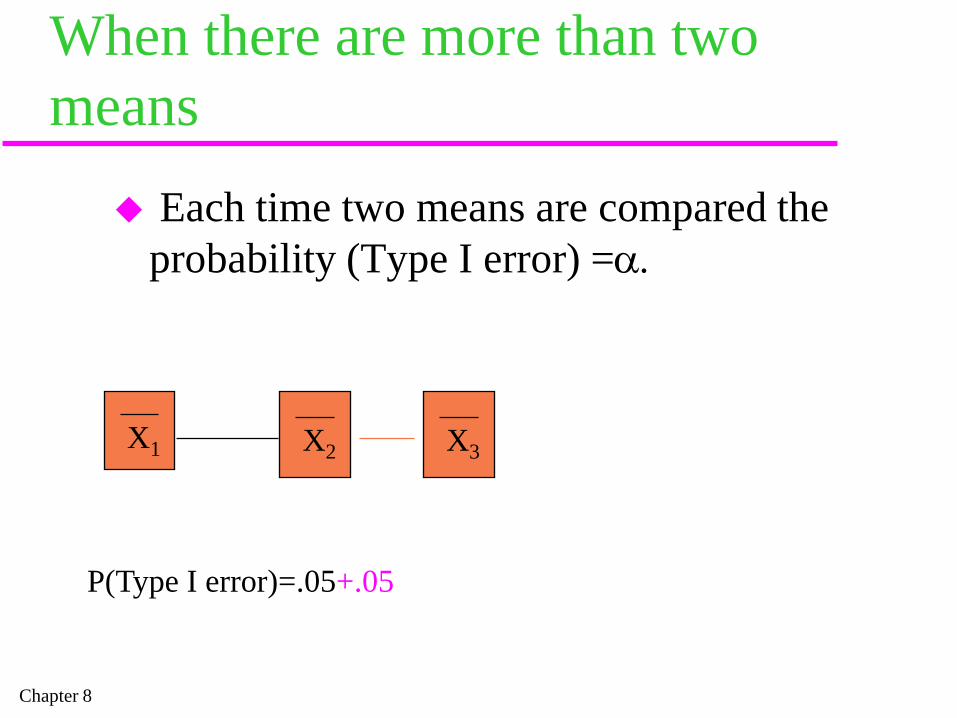
Each time two means are compared the probability (Type I error) =α.
X1 X2
P(Type I error)=.05+.05
X3

Chapter 8
When there are more than two means
Each time two means are compared the probability (Type I error) =α.
X1 X2
P(Type I error)=.05+.05+.05=.15
X3

Chapter 8
When there are more than two means
Each time two means are compared the probability (Type I error) =α.
X1 X2
P(Type I error)=.05+.05+.05+.05
X3 X4
Chapter 8
When there are more than two means
Each time two means are compared the probability (Type I error) =α.
X1 X2
P(Type I error)=.05+.05+.05+.05+.05
X3 X4
Chapter 8
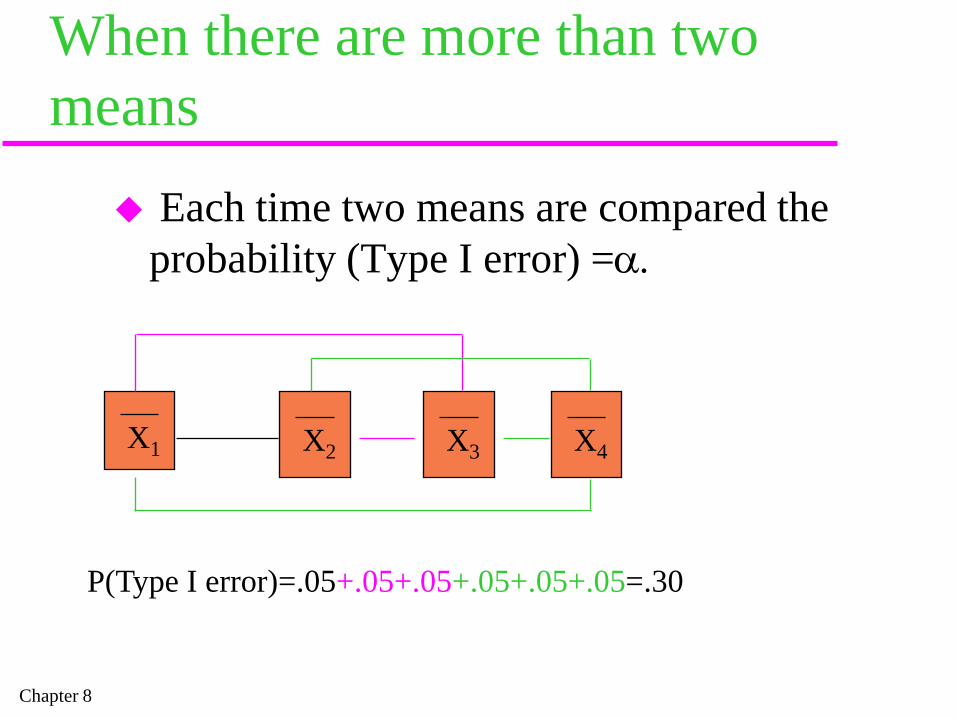
When there are more than two means
Each time two means are compared the probability (Type I error) =α.
X1 X2
P(Type I error)=.05+.05+.05+.05+.05+.05=.30
X3 X4
Chapter 8
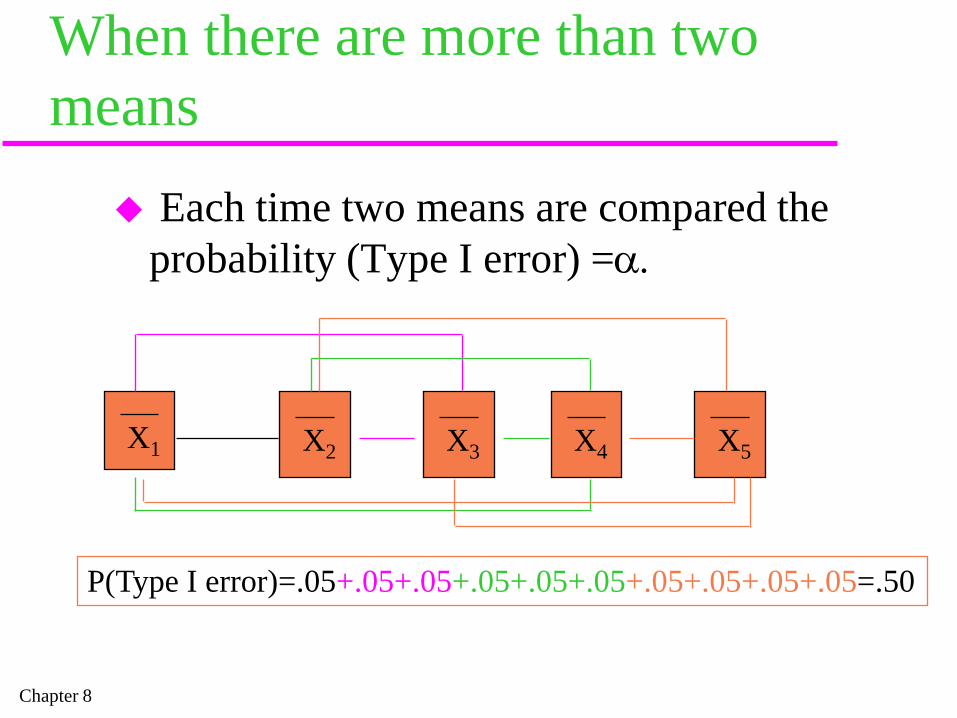
When there are more than two means
Each time two means are compared the probability (Type I error) =α.
X1 X2
P(Type I error)=.05+.05+.05+.05+.05+.05+.05+.05+.05+.05=.50
X3 X4 X5
Chapter 8
Protection levelAnalysis of Variance protects from
inflating Type I errors by making the
experiment-wiseProbability (Type 1 Error) < α.
Chapter 8
Partitioning the Variance
Total Variance
Chapter 8
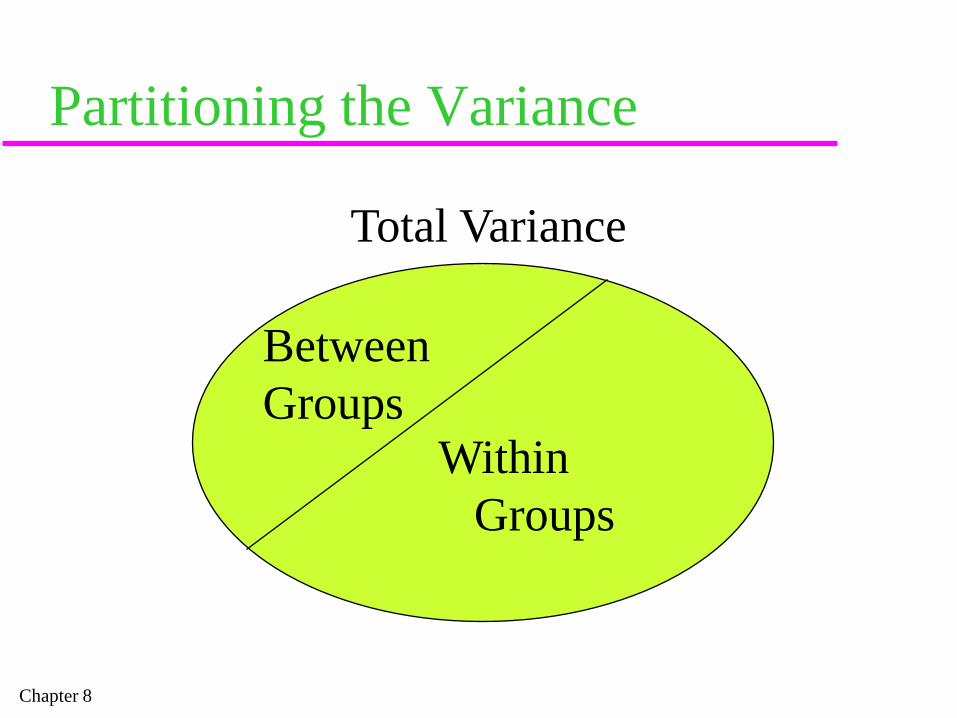
Partitioning the Variance
Total Variance
BetweenGroups
WithinGroups
Chapter 8
Between Groups VarianceThe variance in the data that can be
attributed to the independent variable.The variance among the means.
Chapter 8
Within Groups VarianceVariance due to all other sources.
– Subject factors– Error variance– Residual variance
Variances among data and group means in each group.
Chapter 8
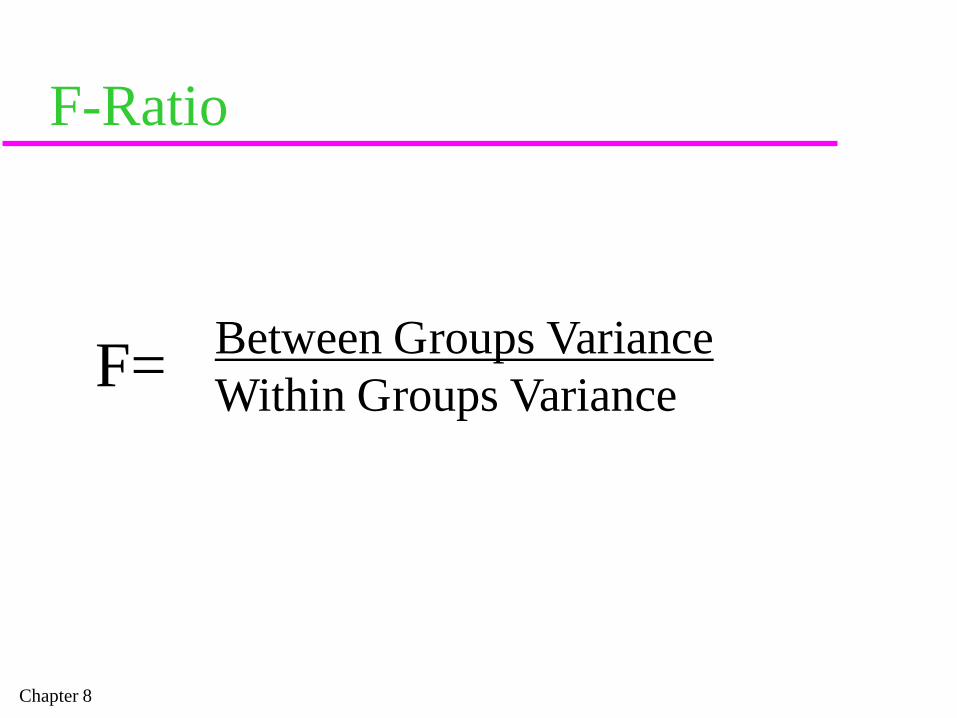
F-Ratio
Between Groups VarianceWithin Groups VarianceF=

Chapter 8
AssumptionsTreatments are IndependentDependent Variable is measured on at least
an ordinal scaleDependent Variable is normally distributed

Chapter 8
When to use Between Groups ANOVA
Different Subjects are in each treatment.There are 2 means or more to compare. (Can use for 2 groups: t is easier)

Chapter 8
How to set up the ANOVA Summary Table
Source
Chapter 8
How to set up the ANOVA Summary Table
Source
Total

Chapter 8
How to set up the ANOVA Summary Table
Source
Total
Between
Within
Chapter 8
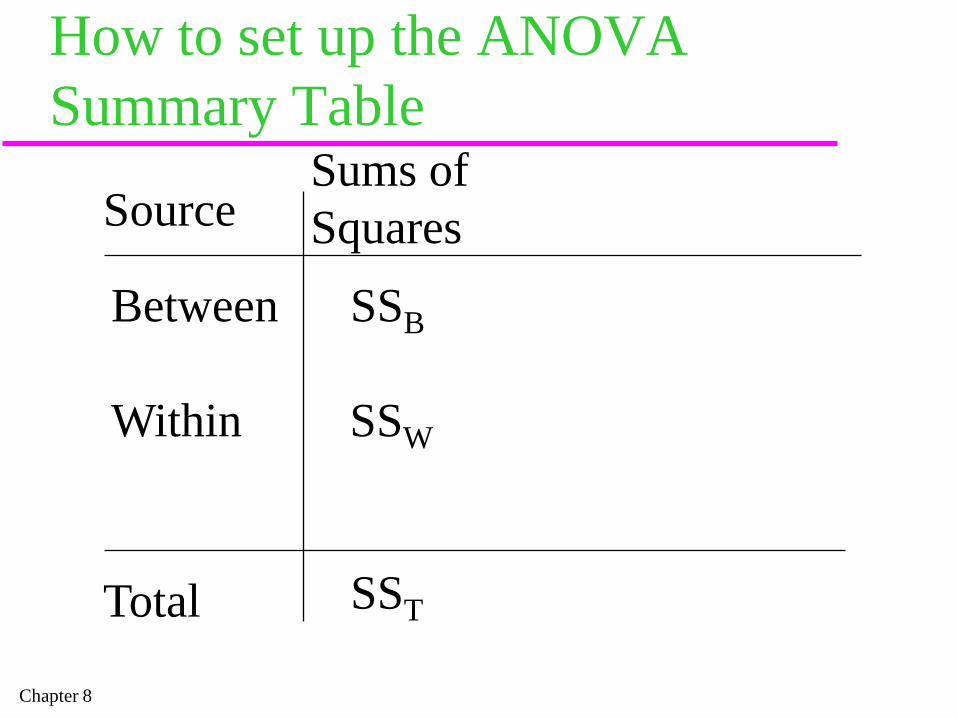
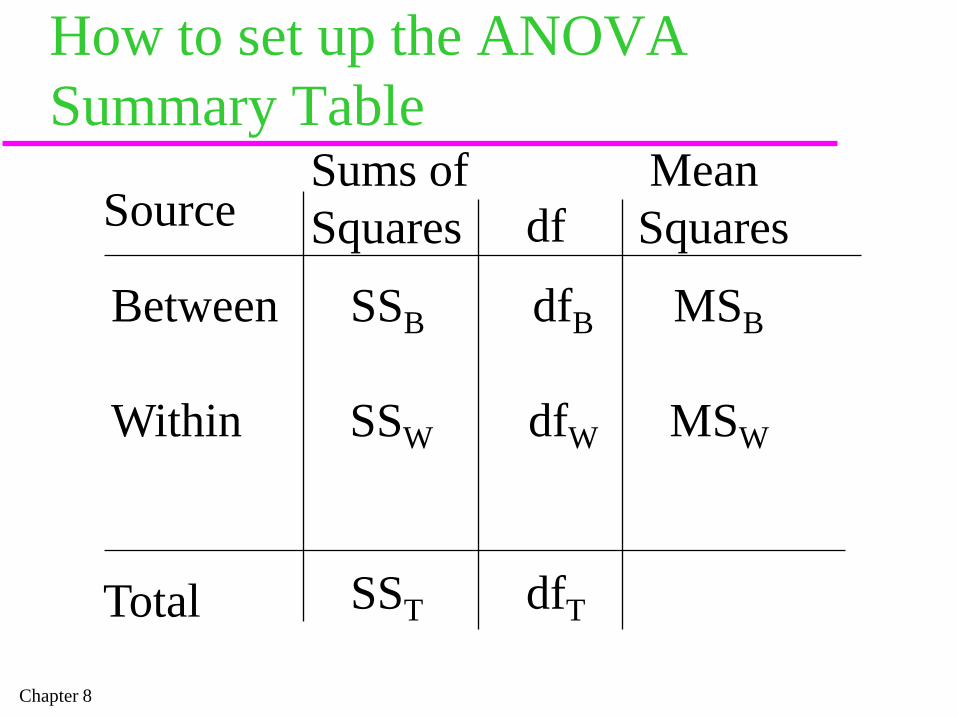
How to set up the ANOVA Summary Table
Source
Total
Between SSB
Within SSW
Sums ofSquares
SST
Chapter 8
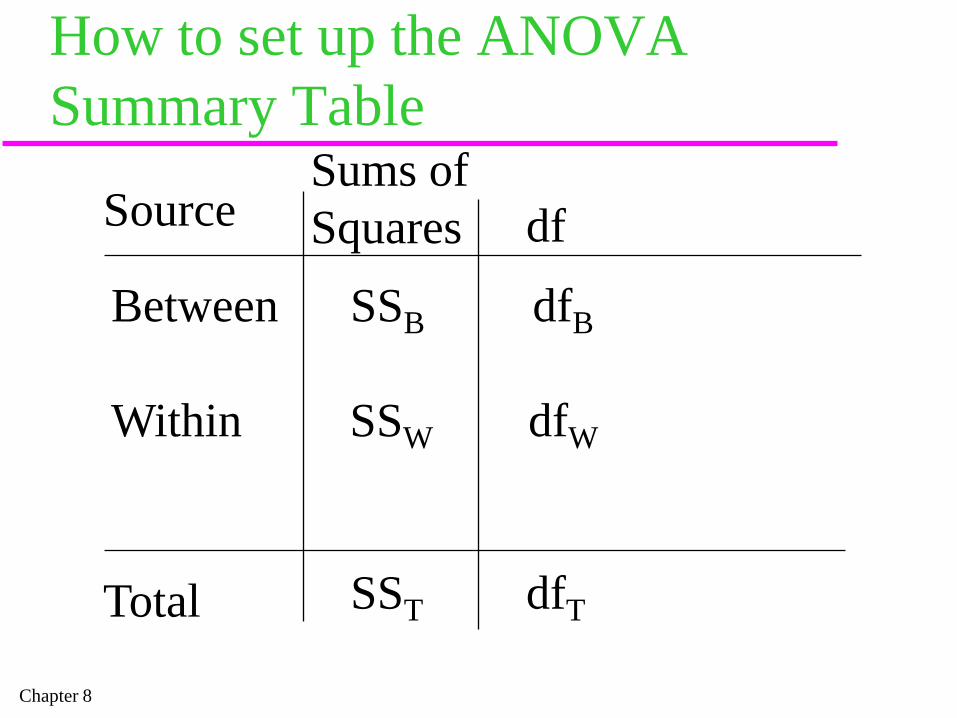
How to set up the ANOVA Summary Table
Source
Total
Between SSB dfB
Within SSW dfW
Sums ofSquares
SST
df
dfT
Chapter 8
How to set up the ANOVA Summary Table
Source
Total
Between SSB dfB MSB
Within SSW dfW MSW
Sums ofSquares
SST
df
dfT
MeanSquares
Chapter 8
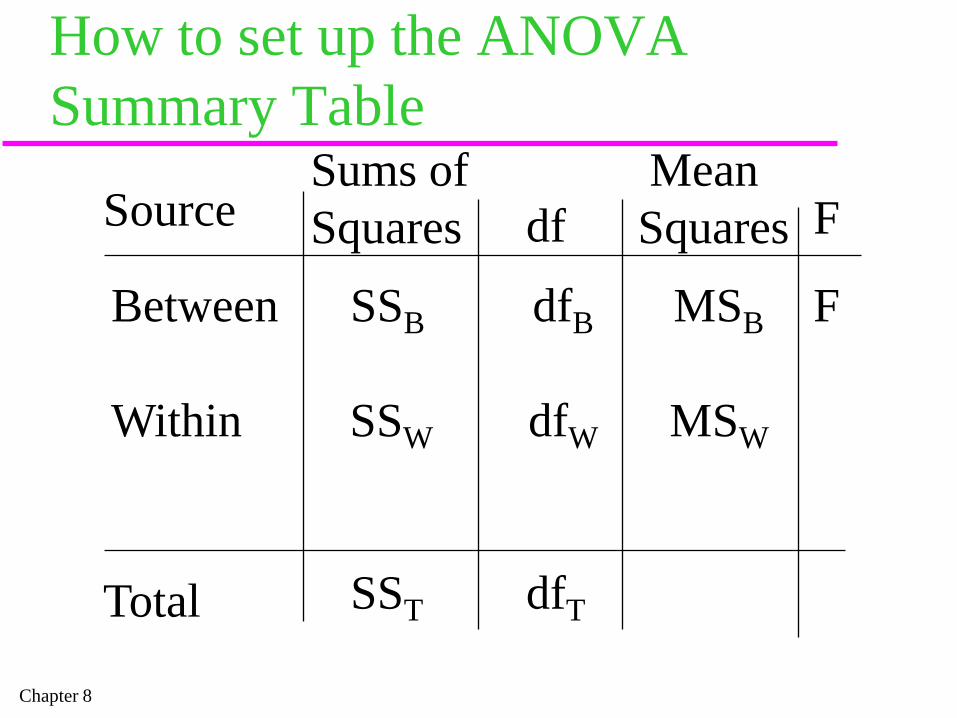
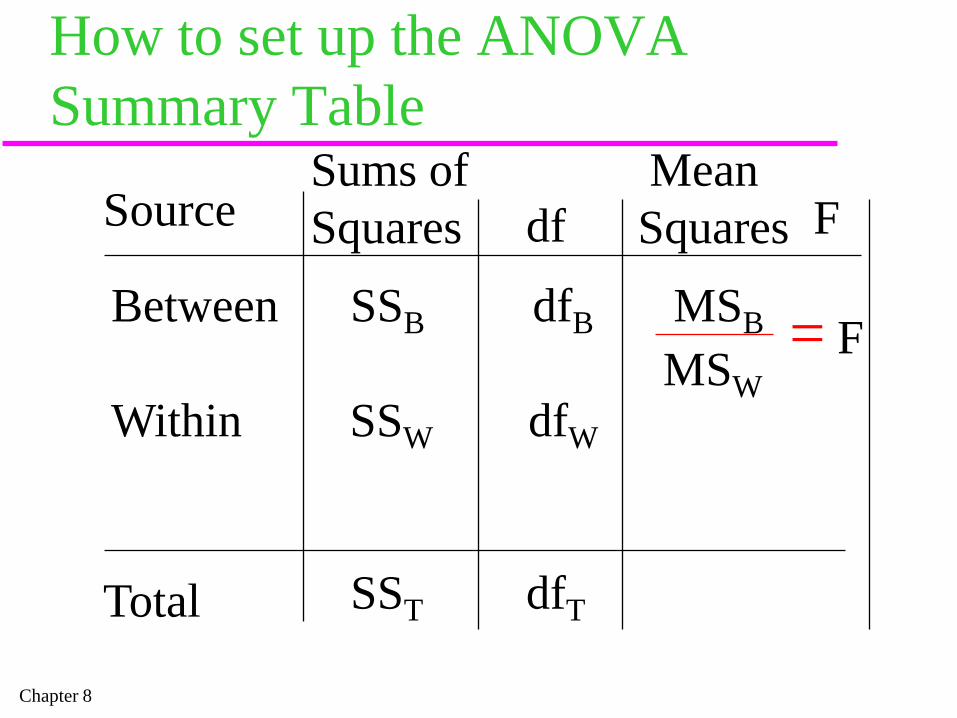
How to set up the ANOVA Summary Table
Source
Total
Between SSB dfB MSB
Within SSW dfW MSW
Sums ofSquares
SST
df
dfT
MeanSquares F
F

Chapter 8
Calculating the F StatisticCalculate Sums of SquaresCalculate dfCalculate Mean SquaresCalculate F
Chapter 8
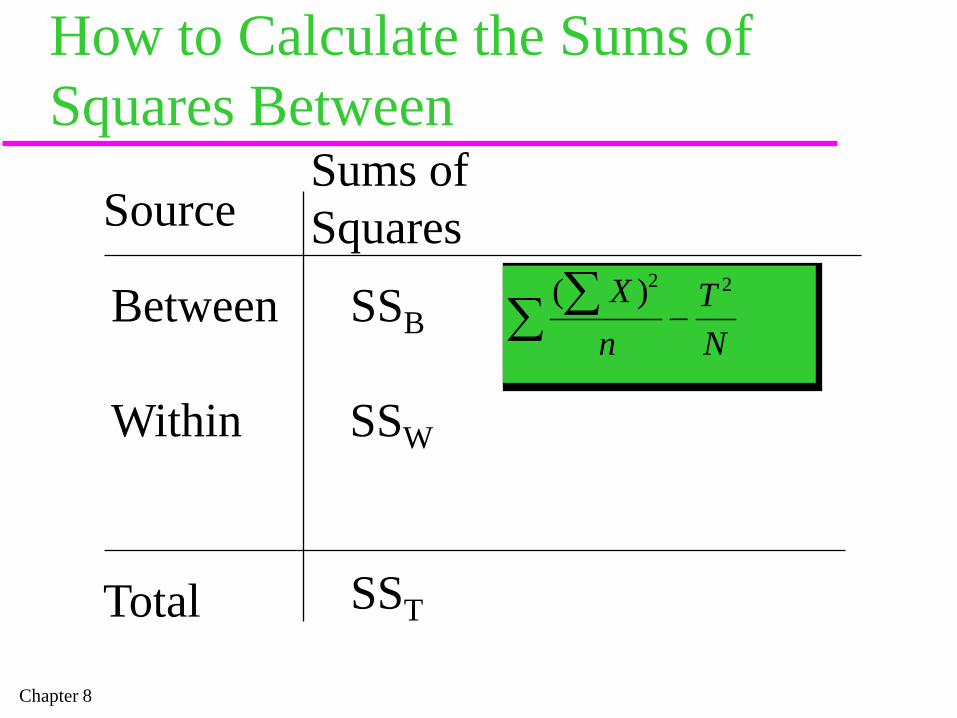
How to Calculate the Sums of Squares Between
Source
Total
Between SSB
Within SSW
Sums ofSquares
SST
( )Xn
TN
∑∑ −2 2
Chapter 8
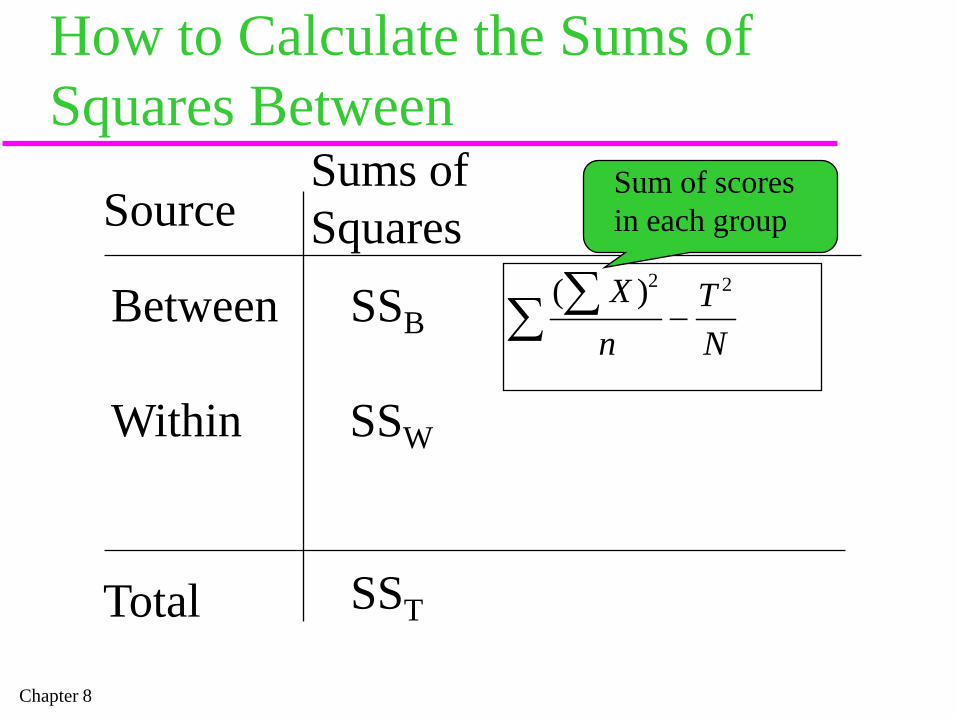
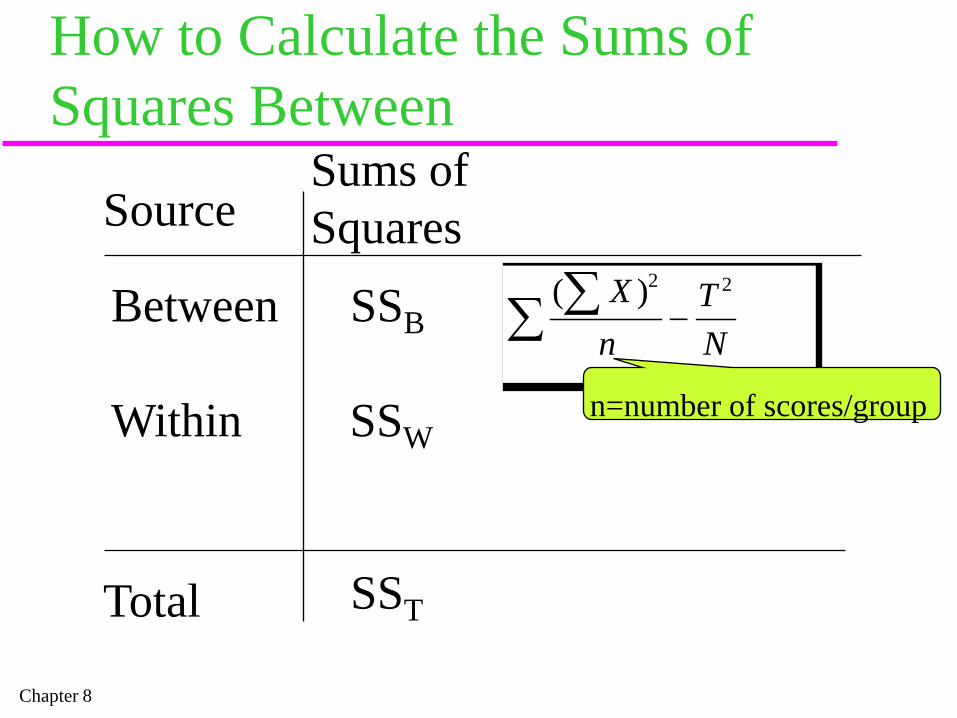
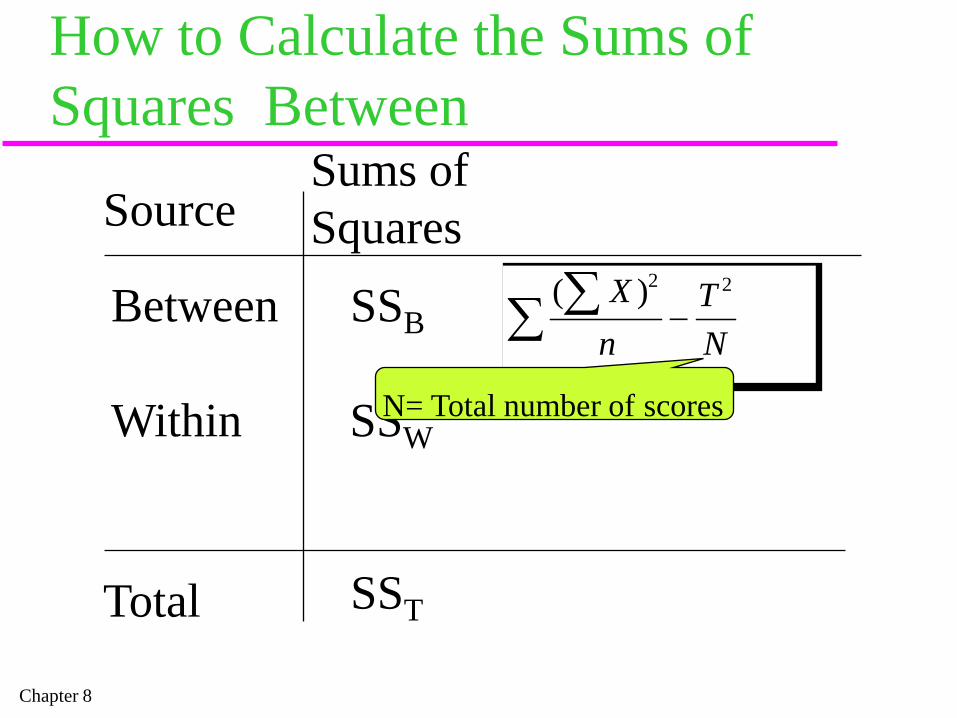
How to Calculate the Sums of Squares Between
Source
Total
Between SSB
Within SSW
Sums ofSquares
SST
( )Xn
TN
∑∑ −2 2
Sum of scoresin each group

Chapter 8
How to Calculate the Sums of Squares Between
Source
Total
Between SSB
Within SSW
Sums ofSquares
SST
T=Total=Sum of all scores.
( )Xn
TN
∑∑ −2 2
Chapter 8
How to Calculate the Sums of Squares Between
Source
Total
Between SSB
Within SSW
Sums ofSquares
SST
( )Xn
TN
∑∑ −2 2
n=number of scores/group
Chapter 8
How to Calculate the Sums of Squares Between
Source
Total
Between SSB
Within SSW
Sums ofSquares
SST
( )Xn
TN
∑∑ −2 2
N= Total number of scores
Chapter 8
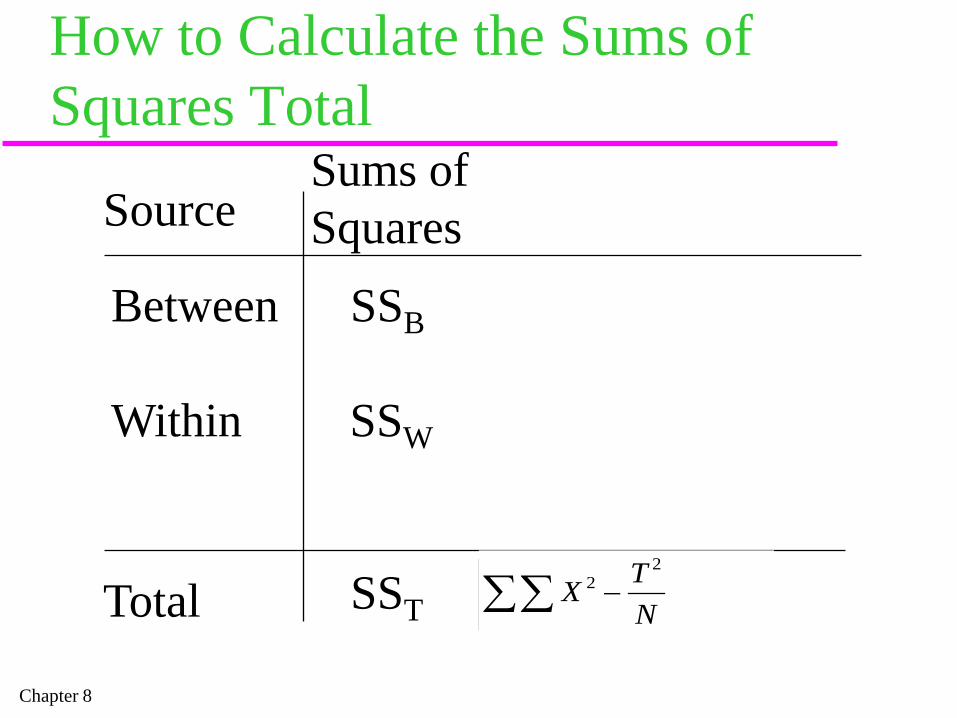
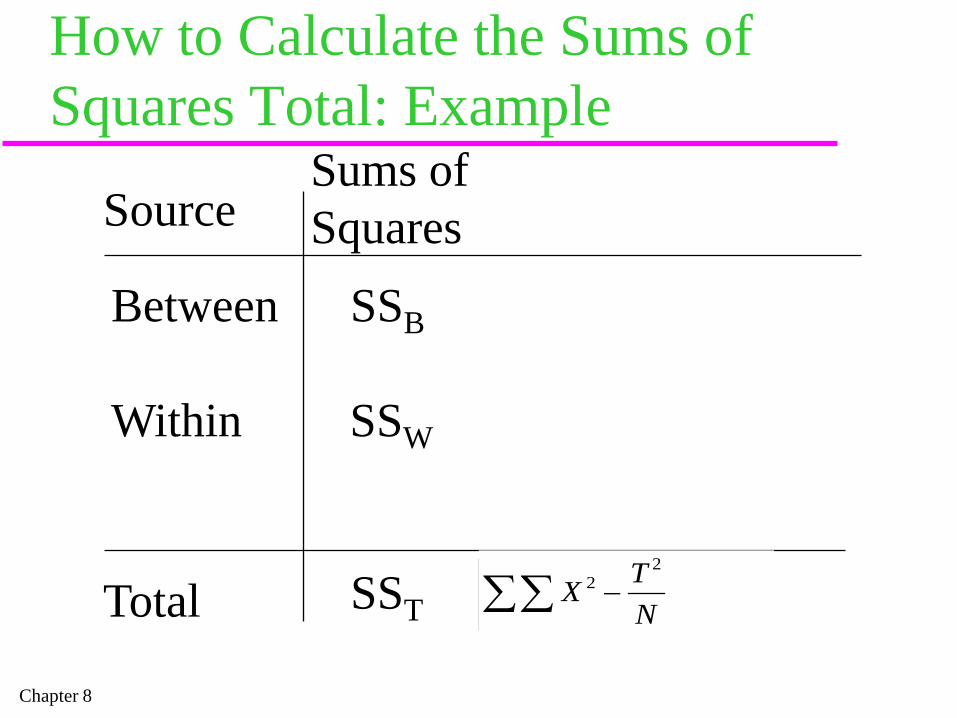
How to Calculate the Sums of Squares Total
Source
Total
Between SSB
Within SSW
Sums ofSquares
SST X TN
22
∑∑ −
Chapter 8
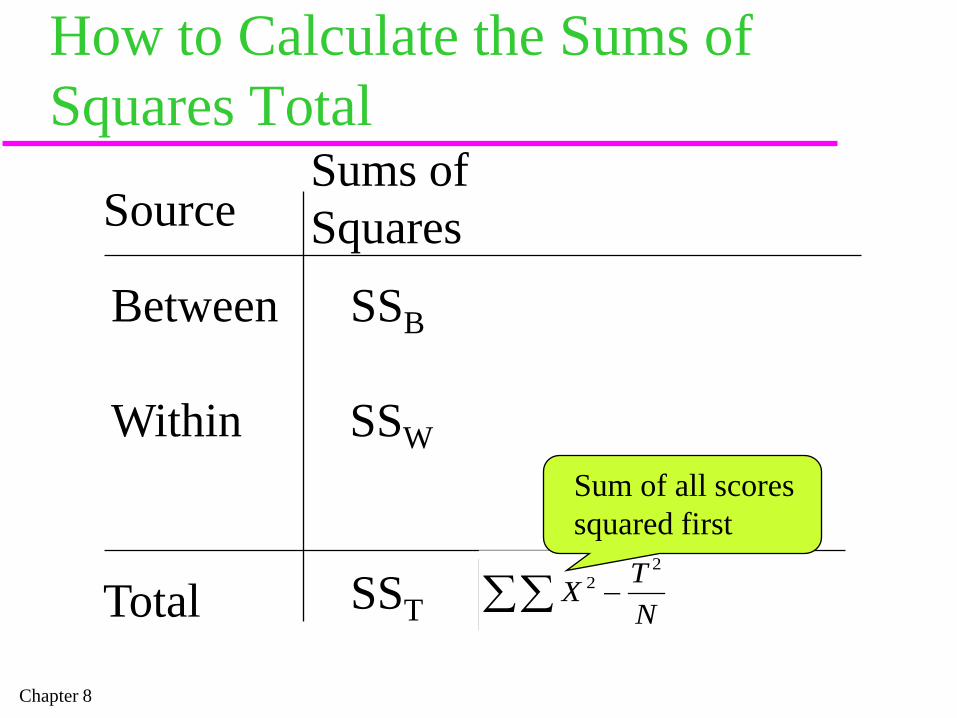
How to Calculate the Sums of Squares Total
Source
Total
Between SSB
Within SSW
Sums ofSquares
SST X TN
22
∑∑ −
Sum of all scoressquared first

Chapter 8
How to Calculate the Sums of Squares Within
Source
Total
Between SSB
Within SSW
Sums ofSquares
SST X TN
22
∑∑ −
( )Xn
TN
∑∑ −2 2
SST-SSB
Chapter 8
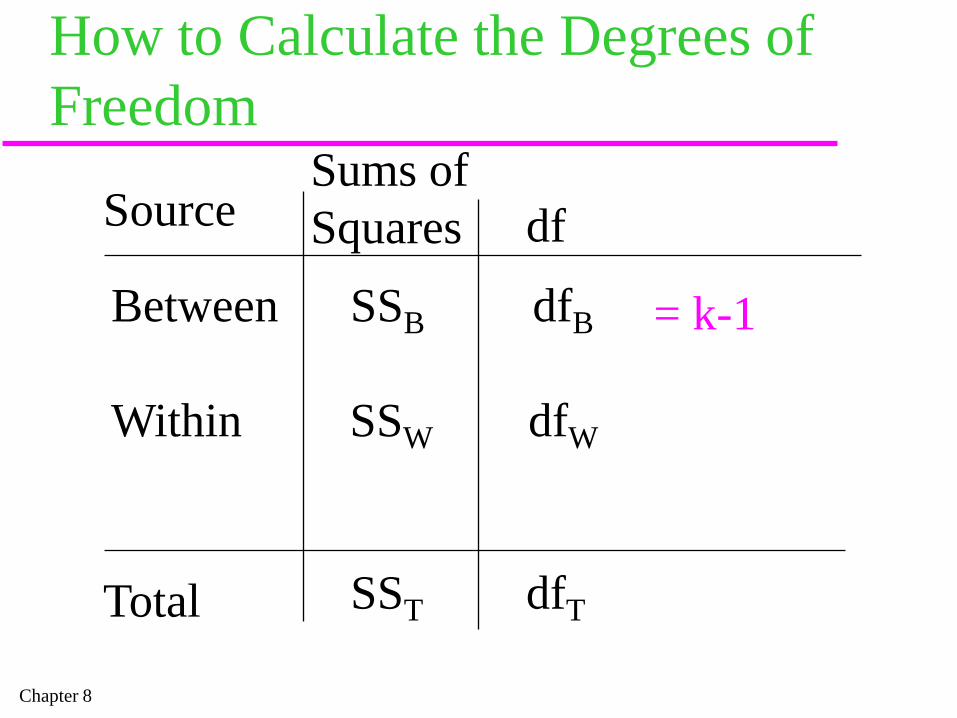
How to Calculate the Degrees of Freedom
Source
Total
Between SSB dfB
Within SSW dfW
Sums ofSquares
SST
df
dfT
= k-1
Chapter 8
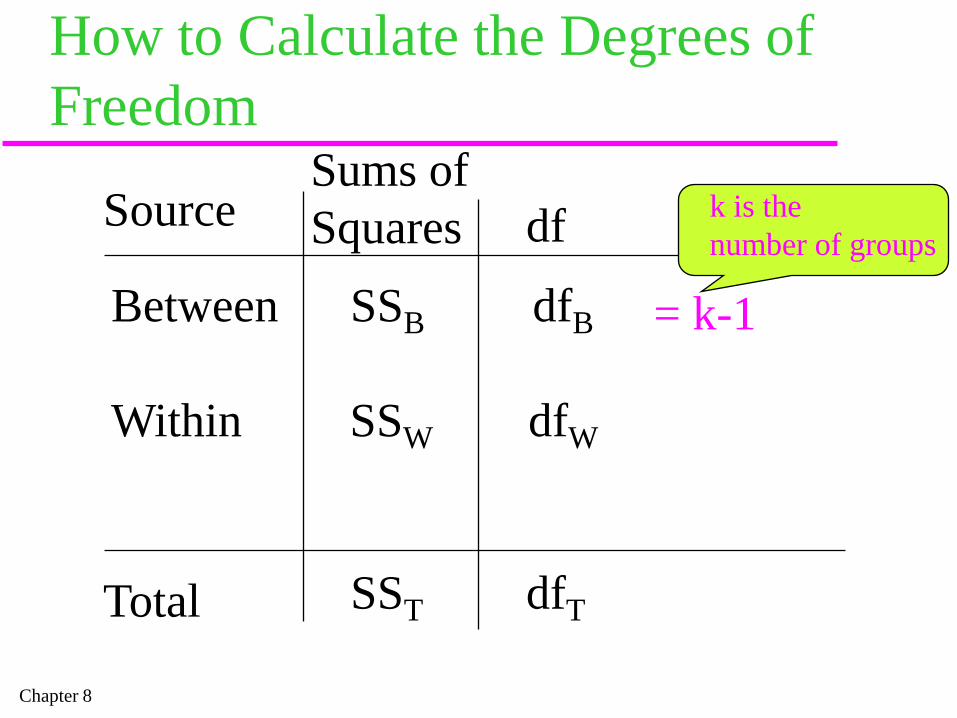
How to Calculate the Degrees of Freedom
Source
Total
Between SSB dfB
Within SSW dfW
Sums ofSquares
SST
df
dfT
= k-1
k is the number of groups

Chapter 8
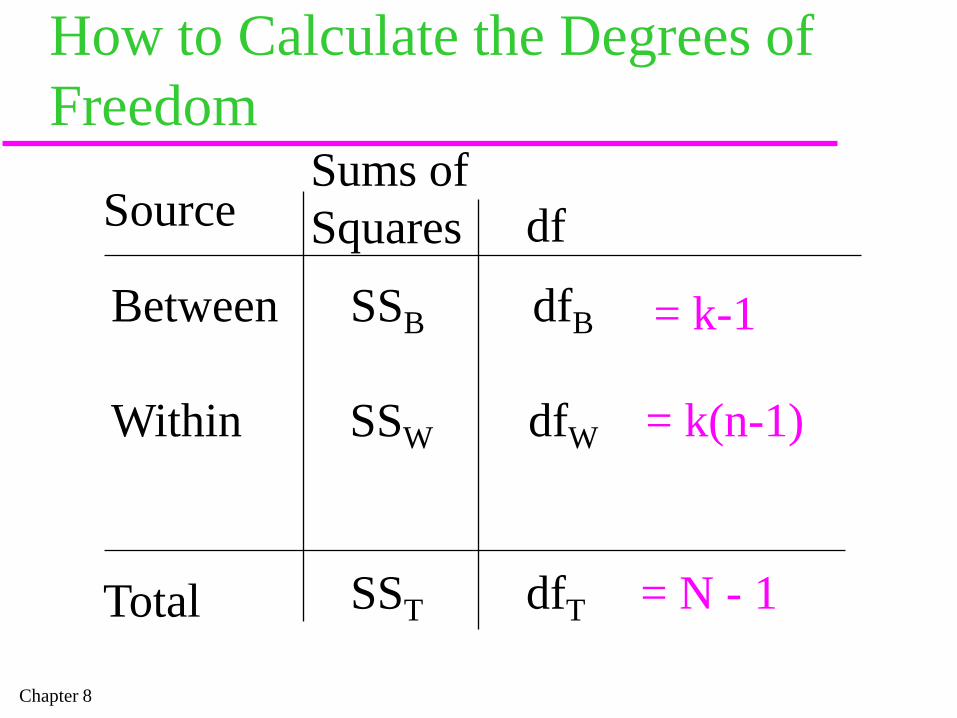
How to Calculate the Degrees of Freedom
Source
Total
Between SSB dfB
Within SSW dfW = k(n-1)
Sums ofSquares
SST
df
dfT
= k-1
Chapter 8
How to Calculate the Degrees of Freedom
Source
Total
Between SSB dfB
Within SSW dfW = k(n-1)
Sums ofSquares
SST
df
dfT = N - 1
= k-1
Chapter 8
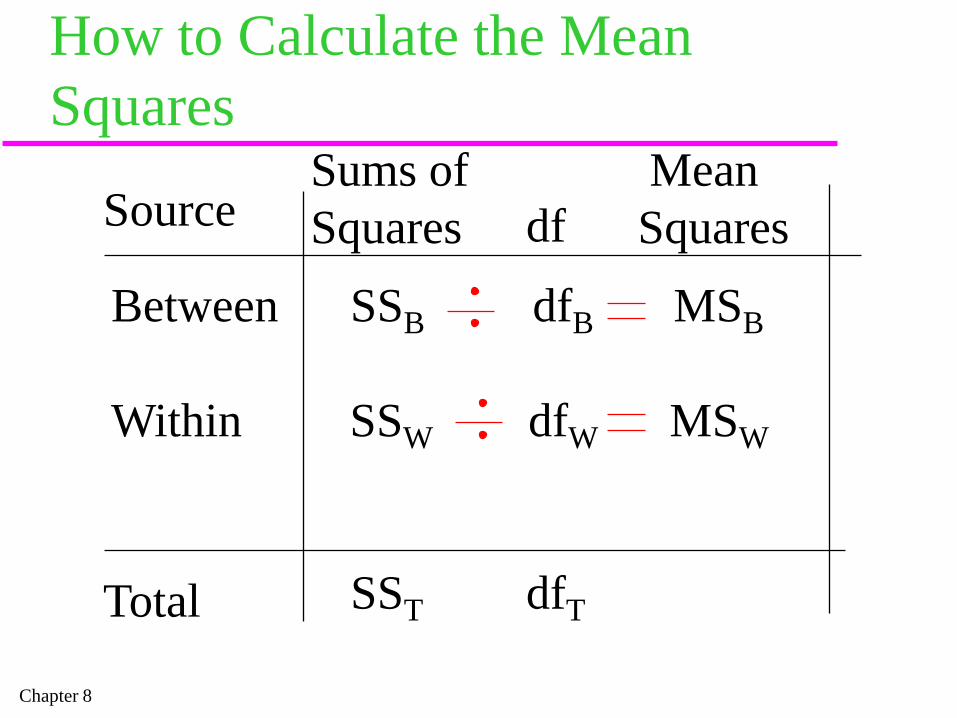
How to Calculate the Mean Squares
Source
Total
Between SSB dfB MSB
Within SSW dfW MSW
Sums ofSquares
SST
df
dfT
MeanSquares
Chapter 8
How to set up the ANOVA Summary Table
Source
Total
Between SSB dfB MSB
Within SSW dfW
Sums ofSquares
SST
df
dfT
MeanSquares F
FMSW
=

Chapter 8
Determining the Critical FAlpha = .05Find Column for df BetweenFind Row for df WithinCompare Critical F to Obtained F

Chapter 8
Statistical Decision Making If Critical F > Obtained F
– failed to reject null hypothesis If Critical F < Obtained F
– reject the null hypothesis
Chapter 8
Interpreting the ResultsGraph MeansUse a multiple Comparison test
– to determine which means are– significantly different
Chapter 8
Example: The Effects of Mood on Originality
Scott Halam’s Senior Thesis, 1997H1: Positive mood will facilitate creativity
more than negative mood or neutral mood.H1: Xpositive> XNeutral =XNegative
Chapter 8
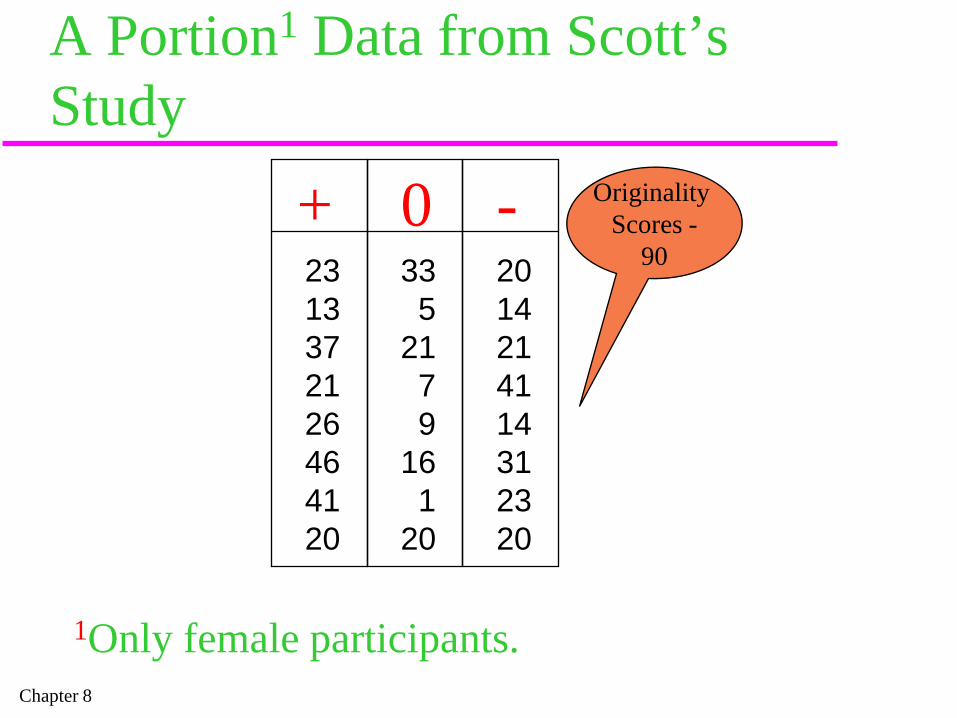
A Portion1 Data from Scott’s Study
1Only female participants.
23 33 2013 5 1437 21 2121 7 4126 9 1446 16 3141 1 2320 20 20
+ 0 - Originality Scores -
90

Chapter 8
How to set up the ANOVA Summary Table:Example
Source
Total
Between SSB
Within SSW
Sums ofSquares
SST
Mood
Chapter 8
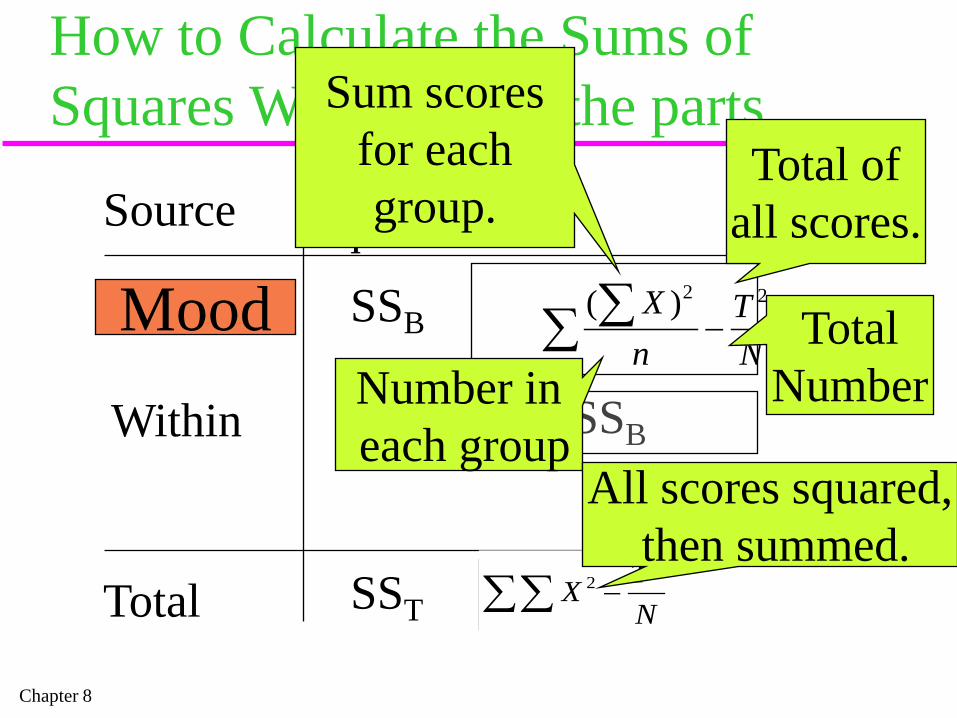
How to Calculate the Sums of Squares Within: Find the parts
Source
Total
Between SSB
Within SSW
Sums ofSquares
SST X TN
22
∑∑ −
NT
nX 22)(
−∑ ∑
SST-SSB
Mood
Sum scoresfor eachgroup.
Total ofall scores.
Number ineach group
TotalNumber
All scores squared,then summed.
Chapter 8
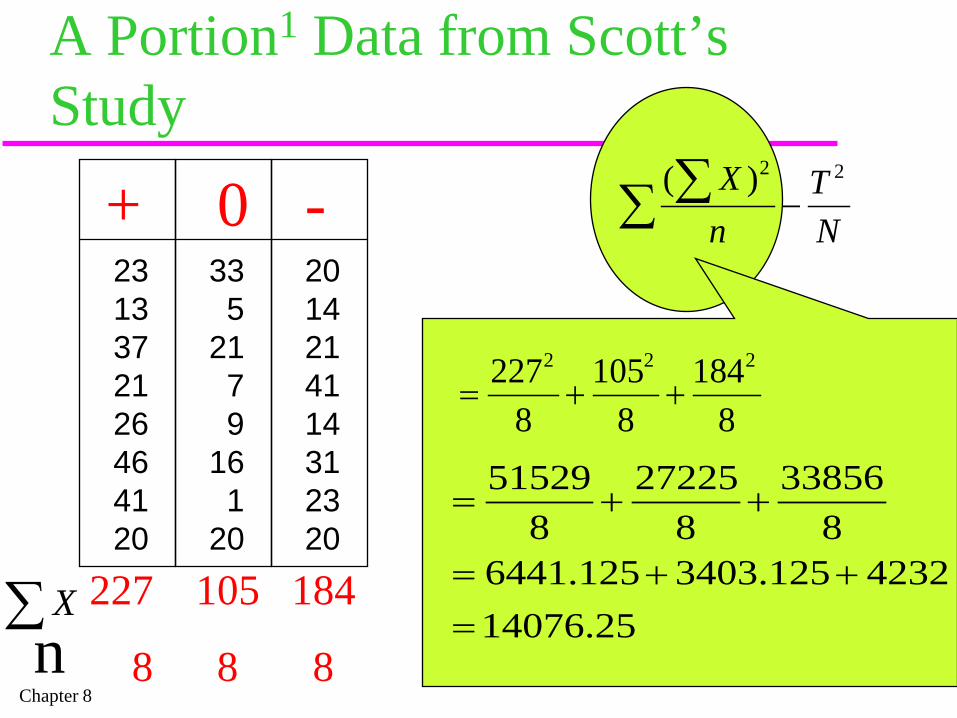
A Portion1 Data from Scott’s Study
+ 023 33 2013 5 1437 21 2121 7 4126 9 1446 16 3141 1 2320 20 20
-
∑ Xn
NT
nX 22)(
−∑ ∑
8184
8105
8227 222
++=
25.140764232125.3403125.6441
833856
827225
851529
=++=
++=
227 105 184
8 8 8
Chapter 8
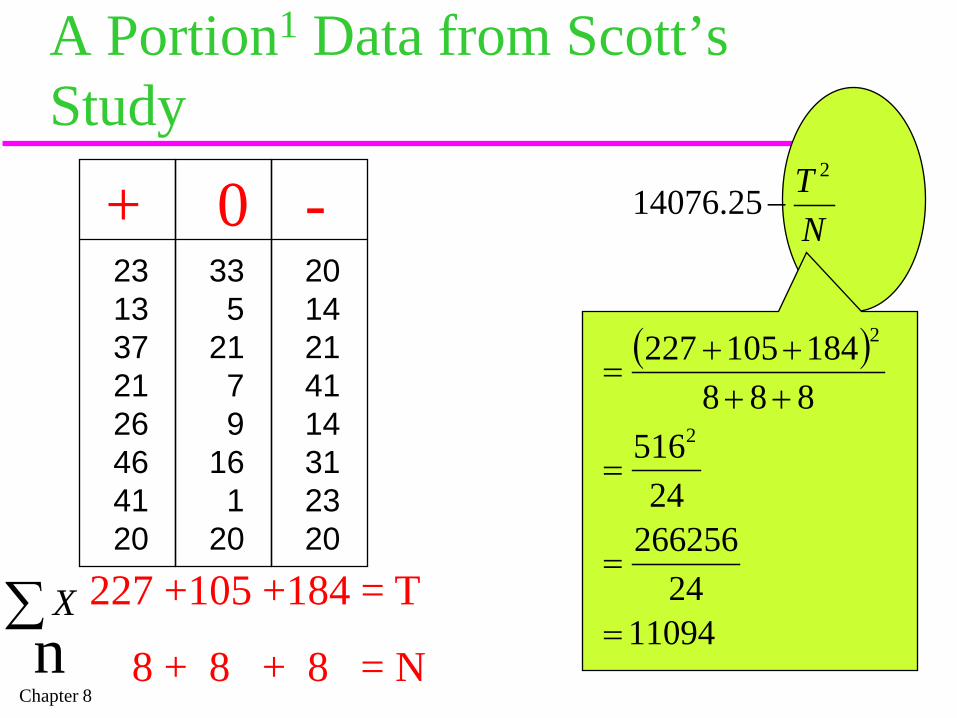
A Portion1 Data from Scott’s Study
+ 023 33 2013 5 1437 21 2121 7 4126 9 1446 16 3141 1 2320 20 20
-
∑ Xn
NT 2
25.14076 −
( )
1109424
26625624
516888184105227
2
2
=
=
=
++++
=
227 +105 +184 = T
8 + 8 + 8 = N
Chapter 8
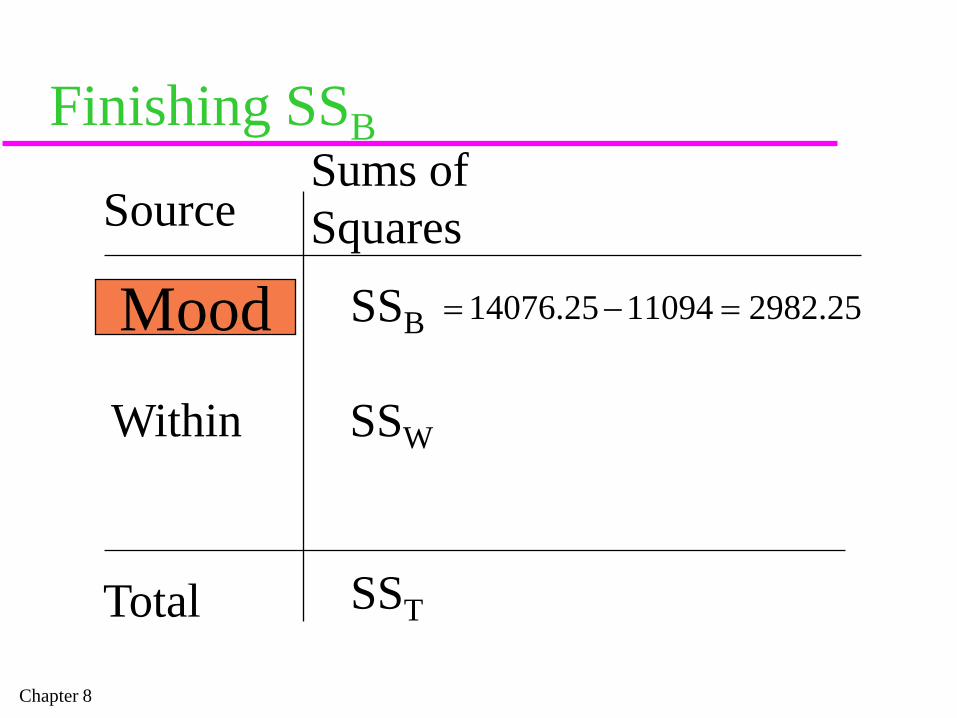
Finishing SSB
Source
Total
Between SSB
Within SSW
Sums ofSquares
SST
Mood 25.29821109425.14076 =−=
Chapter 8
How to Calculate the Sums of Squares Total: Example
Source
Total
Between SSB
Within SSW
Sums ofSquares
SST X TN
22
∑∑ −

Chapter 8
Finding SSw
+23 13 37 21 26 46 41 20
033 5 21 7 9 16 1 20
-20 14 21 41 14 31 23 20
X TN
22
∑∑ −
+2529 169 1369 441 676 2116 1681 400
021089 25 441 49 81 256 1 400
-2400 196 441 1681 196 961 529 400


