7/22/12 Analysis of variance - Wikipedia, the free encyclopedia 1/15 en.wikipedia.org/wiki/Analysis_of_variance Analysis of variance From Wikipedia, the free encyclopedia In statistics, analysis of variance (ANOVA) is a collection of statistical models, and their associated procedures, in which the observed variance in a particular variable is partitioned into components attributable to different sources of variation. In its simplest form, ANOVA provides a statistical test of whether or not the means of several groups are all equal, and therefore generalizes t -test to more than two groups. Doing multiple two-sample t-tests would result in an increased chance of committing a type I error. For this reason, ANOVAs are useful in comparing two, three, or more means. Contents 1 Background and terminology 2 Design of experiments terms 3 Models 3.1 Fixed-effects models (Model 1) 3.2 Random-effects models (Model 2) 3.3 Mixed-effects models (Model 3) 4 Assumptions of ANOVA 4.1 Textbook analysis using a normal distribution 4.2 Randomization-based analysis 4.2.1 Unit-treatment additivity 4.2.2 Derived linear model 4.2.3 Statistical models for observational data 4.3 Summary 5 Logic of ANOVA 5.1 Partitioning of the sum of squares 5.2 The F-test 6 Worked numeric examples 7 Associated Analysis 7.1 Preparatory Analysis 7.1.1 Estimating Sample Size 7.1.2 Power analysis 7.1.3 Effect size 7.2 Followup Analysis 7.2.1 Model Confirmation 7.2.2 Follow-up tests 8 Study designs and ANOVAs 9 ANOVA Cautions 10 Generalizations 11 History 12 See also
Transcript
7/22/12 Analysis of variance - Wikipedia, the free encyclopedia
1/15en.wikipedia.org/wiki/Analysis_of_variance
Analysis of varianceFrom Wikipedia, the free encyclopedia
In statistics, analysis of variance (ANOVA) is a collection of statistical models, and their associated procedures,in which the observed variance in a particular variable is partitioned into components attributable to differentsources of variation. In its simplest form, ANOVA provides a statistical test of whether or not the means of severalgroups are all equal, and therefore generalizes t-test to more than two groups. Doing multiple two-sample t-testswould result in an increased chance of committing a type I error. For this reason, ANOVAs are useful in comparingtwo, three, or more means.
Contents
1 Background and terminology2 Design of experiments terms
3 Models
3.1 Fixed-effects models (Model 1)
3.2 Random-effects models (Model 2)
3.3 Mixed-effects models (Model 3)4 Assumptions of ANOVA
4.1 Textbook analysis using a normal distribution
4.2 Randomization-based analysis
4.2.1 Unit-treatment additivity
4.2.2 Derived linear model4.2.3 Statistical models for observational data
4.3 Summary
5 Logic of ANOVA
5.1 Partitioning of the sum of squares
5.2 The F-test
6 Worked numeric examples
7 Associated Analysis
7.1 Preparatory Analysis
7.1.1 Estimating Sample Size7.1.2 Power analysis
7.1.3 Effect size
7.2 Followup Analysis
7.2.1 Model Confirmation
7.2.2 Follow-up tests
8 Study designs and ANOVAs
9 ANOVA Cautions
10 Generalizations
11 History
12 See also
7/22/12 Analysis of variance - Wikipedia, the free encyclopedia
2/15en.wikipedia.org/wiki/Analysis_of_variance
13 Footnotes
14 Notes
15 References
16 Further reading
17 External links
Background and terminology
ANOVA is a particular form of statistical hypothesis testing heavily used in the analysis of experimental data. Astatistical hypothesis test is a method of making decisions using data. A test result (calculated from the nullhypothesis and the sample) is called statistically significant if it is unlikely to have occurred by chance alone. Astatistically significant result (when a probability (p-value) is less than a threshold (significance level)) justifies therejection of the null hypothesis.
In the typical application of ANOVA, the null hypothesis is that all groups are simply random samples of the samepopulation. This implies that all treatments have the same effect (perhaps none). Rejecting the null hypothesis impliesthat different treatments results in altered effects. By construction, hypothesis testing limits the rate of Type I errors(false positives leading to false scientific claims) to a significance level. Experimenters also wish to limit Type IIerrors (false negatives resulting in missed scientific discoveries). The Type II error rate is a function of several thingsincluding sample size (positively correlated with experiment cost), significance level (when the standard of proof ishigh, the chances of overlooking a discovery are also high) and effect size (when the effect is obvious to the casualobserver, Type II error rates are low).
The terminology of ANOVA is largely from the statistical design of experiments. The experimenter adjusts factorsand measures responses in an attempt to determine an effect. Factors are assigned to experimental units by acombination of randomization and blocking to ensure the validity of the results. Blinding keeps the weighingimpartial. Responses show a variability that is partially the result of the effect and is partially random error.
ANOVA is the synthesis of several ideas and it is used for multiple purposes. As a consequence, it is difficult todefine concisely or precisely. "Classical ANOVA for balanced data does three things at once:
1. As exploratory data analysis, an ANOVA is an organization of an additive data decomposition, and its sumsof squares indicate the variance of each component of the decomposition (or, equivalently, each set of terms
of a linear model).2. Comparisons of mean squares, along with F-tests ... allow testing of a nested sequence of models.
3. Closely related to the ANOVA is a linear model fit with coefficient estimates and standard errors.[1] In short,ANOVA is a statistical tool used in several ways to develop and confirm an explanation for the observed
data.
Additionally:
4. It is computationally elegant and relatively robust against violations to its assumptions.5. ANOVA provides industrial strength (multiple sample comparison) statistical analysis.
6. It has been adapted to the analysis of a variety of experimental designs.
As a result: ANOVA "has long enjoyed the status of being the most used (some would say abused) statistical
technique in psychological research."[2] ANOVA "is probably the most useful technique in the field of statistical
7/22/12 Analysis of variance - Wikipedia, the free encyclopedia
3/15en.wikipedia.org/wiki/Analysis_of_variance
inference."[3]
ANOVA is notoriously difficult to teach, particularly for complex experiments.[4] In some cases the properapplication of the method is best determined by problem pattern recognition followed by the consultation of a
classic authoritative text.[5]
Design of experiments terms
(Condensed from the NIST Engineering Statistics handbook: Section 5.7. A Glossary of DOE Terminology.)[6]
Analysis of Variance (ANOVA)
A mathematical process for separating the variability of a group of observations into assignable causes andsetting up various significance tests.
Balanced Design
An experimental design where all cells (i.e. treatment combinations) have the same number of observations.Blocking
A schedule for conducting treatment combinations in an experimental study such that any effects on theexperimental results due to a known change in raw materials, operators, machines, etc., become
concentrated in the levels of the blocking variable. The reason for blocking is to isolate a systematic effectand prevent it from obscuring the main effects. Blocking is achieved by restricting randomization.
DesignA set of experimental runs which allows the fit of a particular model and the estimate of effects.
EffectHow changing the settings of a factor changes the response. The effect of a single factor is also called a maineffect.
ErrorUnexplained variation in a collection of observations. DOE's typically require understanding of both random
error and lack of fit error.Experimental Unit
The entity to which a specific treatment combination is applied.Factors
Process inputs an investigator manipulates to cause a change in the output.Fixed Effect
An effect associated with an input variable that has a limited number of levels or in which only a limitednumber of levels are of interest to the experimenter.
Lack of Fit Error
Error that occurs when the analysis omits one or more important terms or factors from the process model.
Including replication in a DOE allows separation of experimental error into its components: lack of fit andrandom (pure) error.
Model
Mathematical relationship which relates changes in a given response to changes in one or more factors.
Random EffectAn effect associated with input variables chosen at random from a population having a large or infinite
number of possible values.
Random errorError that occurs due to natural variation in the process. Random error is typically assumed to be normally
7/22/12 Analysis of variance - Wikipedia, the free encyclopedia
4/15en.wikipedia.org/wiki/Analysis_of_variance
distributed with zero mean and a constant variance. Random error is also called experimental error.
Randomization
A schedule for allocating treatment material and for conducting treatment combinations in a DOE such thatthe conditions in one run neither depend on the conditions of the previous run nor predict the conditions in
the subsequent runs.
Replication
Performing the same treatment combination more than once. Including replication allows an estimate of therandom error independent of any lack of fit error.
Responses
The output(s) of a process. Sometimes called dependent variable(s).Treatment
A treatment is a specific combination of factor levels whose effect is to be compared with other treatments.
Variance Components
Partitioning of the overall variation into assignable components.
Models
There are three classes of models used in the analysis of variance, and these are outlined here.
Fixed-effects models (Model 1)
Main article: Fixed effects model
The fixed-effects model of analysis of variance applies to situations in which the experimenter applies one or moretreatments to the subjects of the experiment to see if the response variable values change. This allows theexperimenter to estimate the ranges of response variable values that the treatment would generate in the populationas a whole.
Random-effects models (Model 2)
Main article: Random effects model
Random effects models are used when the treatments are not fixed. This occurs when the various factor levels aresampled from a larger population. Because the levels themselves are random variables, some assumptions and themethod of contrasting the treatments (a multi-variable generalization of simple differences) differ from the fixed-
effects model.[7]
Mixed-effects models (Model 3)
Main article: Mixed model
A mixed-effects model contains experimental factors of both fixed and random-effects types, with appropriatelydifferent interpretations and analysis for the two types.
Example: Teaching experiments could be performed by a university department to find a good introductorytextbook, with each text considered a treatment. The fixed-effects model would compare a list of candidate texts.The random-effects model would determine whether important differences exist among a list of randomly selected
7/22/12 Analysis of variance - Wikipedia, the free encyclopedia
5/15en.wikipedia.org/wiki/Analysis_of_variance
texts. The mixed-effects model would compare the (fixed) incumbent texts to randomly selected alternatives.
Defining fixed and random effects has proven elusive, with competing definitions arguably leading toward a linguistic
quagmire.[8]
Assumptions of ANOVA
The analysis of variance has been studied from several approaches, the most common of which uses a linear modelthat relates the response to the treatments and blocks. Even when the statistical model is nonlinear, it can beapproximated by a linear model for which an analysis of variance may be appropriate.
Textbook analysis using a normal distribution
The analysis of variance can be presented in terms of a linear model, which makes the following assumptions about
the probability distribution of the responses:[9] [10] [11] [12]
Independence of observations – this is an assumption of the model that simplifies the statistical analysis.
Normality – the distributions of the residuals are normal.Equality (or "homogeneity") of variances, called homoscedasticity — the variance of data in groups should
be the same.
The separate assumptions of the textbook model imply that the errors are independently, identically, and normallydistributed for fixed effects models, that is, that the errors ( 's) are independent and
Randomization-based analysis
See also: Random assignment and Randomization test
In a randomized controlled experiment, the treatments are randomly assigned to experimental units, following theexperimental protocol. This randomization is objective and declared before the experiment is carried out. Theobjective random-assignment is used to test the significance of the null hypothesis, following the ideas of C. S.Peirce and Ronald A. Fisher. This design-based analysis was discussed and developed by Francis J. Anscombe at
Rothamsted Experimental Station and by Oscar Kempthorne at Iowa State University.[13] Kempthorne and hisstudents make an assumption of unit treatment additivity, which is discussed in the books of Kempthorne and
David R. Cox.[citation needed]
Unit-treatment additivity
In its simplest form, the assumption of unit-treatment additivity states that the observed response from
experimental unit when receiving treatment can be written as the sum of the unit's response and the
treatment-effect , that is [14][15][16]
The assumption of unit-treatment addivity implies that, for every treatment , the th treatment have exactly the
7/22/12 Analysis of variance - Wikipedia, the free encyclopedia
6/15en.wikipedia.org/wiki/Analysis_of_variance
same effect on every experiment unit.
The assumption of unit treatment additivity usually cannot be directly falsified, according to Cox and Kempthorne.However, many consequences of treatment-unit additivity can be falsified. For a randomized experiment, theassumption of unit-treatment additivity implies that the variance is constant for all treatments. Therefore, bycontraposition, a necessary condition for unit-treatment additivity is that the variance is constant.
The use of unit treatment additivity and randomization is similar to the design-based inference that is standard infinite-population survey sampling.
Derived linear model
Kempthorne uses the randomization-distribution and the assumption of unit treatment additivity to produce aderived linear model, very similar to the textbook model discussed previously.
The test statistics of this derived linear model are closely approximated by the test statistics of an appropriatenormal linear model, according to approximation theorems and simulation studies by Kempthorne and his
students[17]. However, there are differences. For example, the randomization-based analysis results in a small but
(strictly) negative correlation between the observations.[18][19] In the randomization-based analysis, there is noassumption of a normal distribution and certainly no assumption of independence. On the contrary, theobservations are dependent!
The randomization-based analysis has the disadvantage that its exposition involves tedious algebra and extensivetime. Since the randomization-based analysis is complicated and is closely approximated by the approach using anormal linear model, most teachers emphasize the normal linear model approach. Few statisticians object to model-based analysis of balanced randomized experiments.
Statistical models for observational data
However, when applied to data from non-randomized experiments or observational studies, model-based analysis
lacks the warrant of randomization.[20] For observational data, the derivation of confidence intervals must usesubjective models, as emphasized by Ronald A. Fisher and his followers. In practice, the estimates of treatment-effects from observational studies generally are often inconsistent. In practice, "statistical models" and observational
data are useful for suggesting hypotheses that should be treated very cautiously by the public.[21]
Summary
The textbook ANOVA analysis assumes the independence, normality and homogeneity of the variances of theresiduals, while the randomization-based analysis assumes only the homogeneity of the variances of the residuals (asa consequence of unit-treatment additivity). Homoscedasticity seems the most general requirement for comparingmeans via ANOVA. However, studies of processes that change variances rather than means (called dispersion
effects) have been successfully conducted using ANOVA.[22] There are no necessary assumptions for ANOVA isits full generality, but the F-test used for ANOVA hypothesis testing has assumptions and practical limitations whichare of continuing interest.
Problems which do not satisfy the assumptions of ANOVA can often be transformed to satisfy the assumptions.The property of unit-treatment additivity is not invariant under a "change of scale", so statisticians often use
7/22/12 Analysis of variance - Wikipedia, the free encyclopedia
7/15en.wikipedia.org/wiki/Analysis_of_variance
transformations to achieve unit-treatment additivity. If the response variable is expected to follow a parametricfamily of probability distributions, then the statistician may specify (in the protocol for the experiment or
observational study) that the responses be transformed to stabilize the variance.[23] Also, a statistician may specify
that logarithmic transforms be applied to the responses, which are believed to follow a multiplicative model.[24][25]
According to Cauchy's functional equation theorem, the logarithm is the only continuous transformation thattransforms real multiplication to addition.
Logic of ANOVA
Partitioning of the sum of squares
Main article: Partition of sums of squares
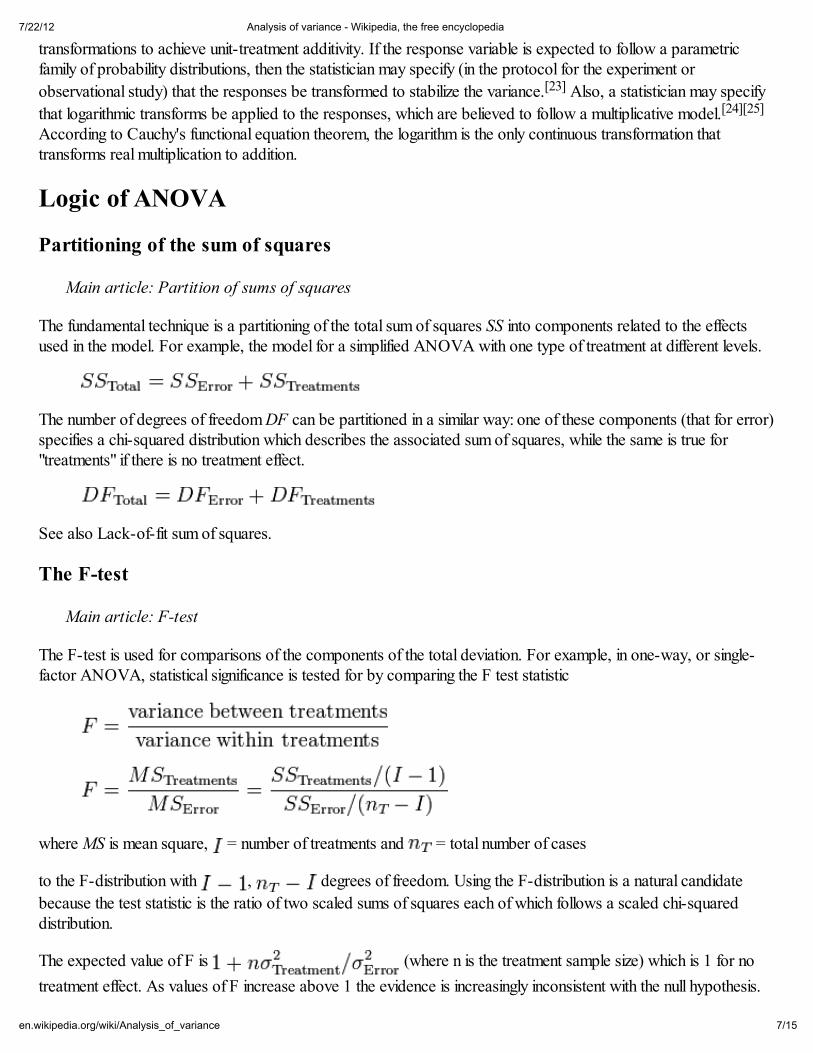
The fundamental technique is a partitioning of the total sum of squares SS into components related to the effectsused in the model. For example, the model for a simplified ANOVA with one type of treatment at different levels.
The number of degrees of freedom DF can be partitioned in a similar way: one of these components (that for error)specifies a chi-squared distribution which describes the associated sum of squares, while the same is true for"treatments" if there is no treatment effect.
See also Lack-of-fit sum of squares.
The F-test
Main article: F-test
The F-test is used for comparisons of the components of the total deviation. For example, in one-way, or single-factor ANOVA, statistical significance is tested for by comparing the F test statistic
where MS is mean square, = number of treatments and = total number of cases
to the F-distribution with , degrees of freedom. Using the F-distribution is a natural candidate
because the test statistic is the ratio of two scaled sums of squares each of which follows a scaled chi-squareddistribution.
The expected value of F is (where n is the treatment sample size) which is 1 for no
treatment effect. As values of F increase above 1 the evidence is increasingly inconsistent with the null hypothesis.
7/22/12 Analysis of variance - Wikipedia, the free encyclopedia
8/15en.wikipedia.org/wiki/Analysis_of_variance
Two apparent experimental methods of increasing F are increasing the sample size and reducing the error varianceby tight experimental controls.
The textbook method of concluding the hypothesis test is to compare the observed value of F with the critical valueof F determined from tables. The critical value of F is a function of the numerator degrees of freedom, thedenominator degrees of freedom and the significance level (α). If F ≥ FCritical (Numerator DF, Denominator DF, α)
then reject the null hypothesis.
The computer method calculates the probability (p-value) of a value of F greater than or equal to the observedvalue. The null hypothesis is rejected if this probability is less than or equal to the significance level (α). The twomethods produce the same result.
The ANOVA F-test is known to be nearly optimal in the sense of minimizing false negative errors for a fixed rate offalse positive errors (maximizing power for a fixed significance level). To test the hypothesis that all treatments haveexactly the same effect, the F-test's p-values closely approximate the permutation test's p-values: The
approximation is particularly close when the design is balanced.[26] Such permutation tests characterize tests with
maximum power against all alternative hypotheses, as observed by Rosenbaum.[nb 1] The ANOVA F–test (of thenull-hypothesis that all treatments have exactly the same effect) is recommended as a practical test, because of its
robustness against many alternative distributions.[27][nb 2]
Worked numeric examples
Several fully worked numerical examples are available. A simple case uses one-way (a single factor) analysis. Amore complex case uses two-way (two-factor) analysis.
Associated Analysis
Some analysis is required in support of the design of the experiment while other analysis is performed after changesin the factors are formally found to produce statistically significant changes in the responses. Becauseexperimentation is iterative, the results of one experiment alter plans for following experiments.
Preparatory Analysis
Estimating Sample Size
A variety of primitive methods are used to estimate the required group sample size. These include graphicalmethods based on limiting the probability of false negative errors, graphical methods based on an expected variation
increase (above the residuals) and methods based on achieving a desired confident interval.[28] More elaboratemethods are based on power analysis which relies on effect size.
Reporting sample size analysis is generally required in psychology. "Provide information on sample size and the
process that led to sample size decisions."[29] The analysis, which is available before the experiment is conducted, isinformative in grant applications and administrative review boards.
Power analysis
7/22/12 Analysis of variance - Wikipedia, the free encyclopedia
9/15en.wikipedia.org/wiki/Analysis_of_variance
Power analysis is often applied in the context of ANOVA in order to assess the probability of successfully rejectingthe null hypothesis if we assume a certain ANOVA design, effect size in the population, sample size and significancelevel. Power analysis can assist in study design by determining what sample size would be required in order to have
a reasonable chance of rejecting the null hypothesis when the alternative hypothesis is true.[30][31][32][33]
Effect size
Main article: Effect size
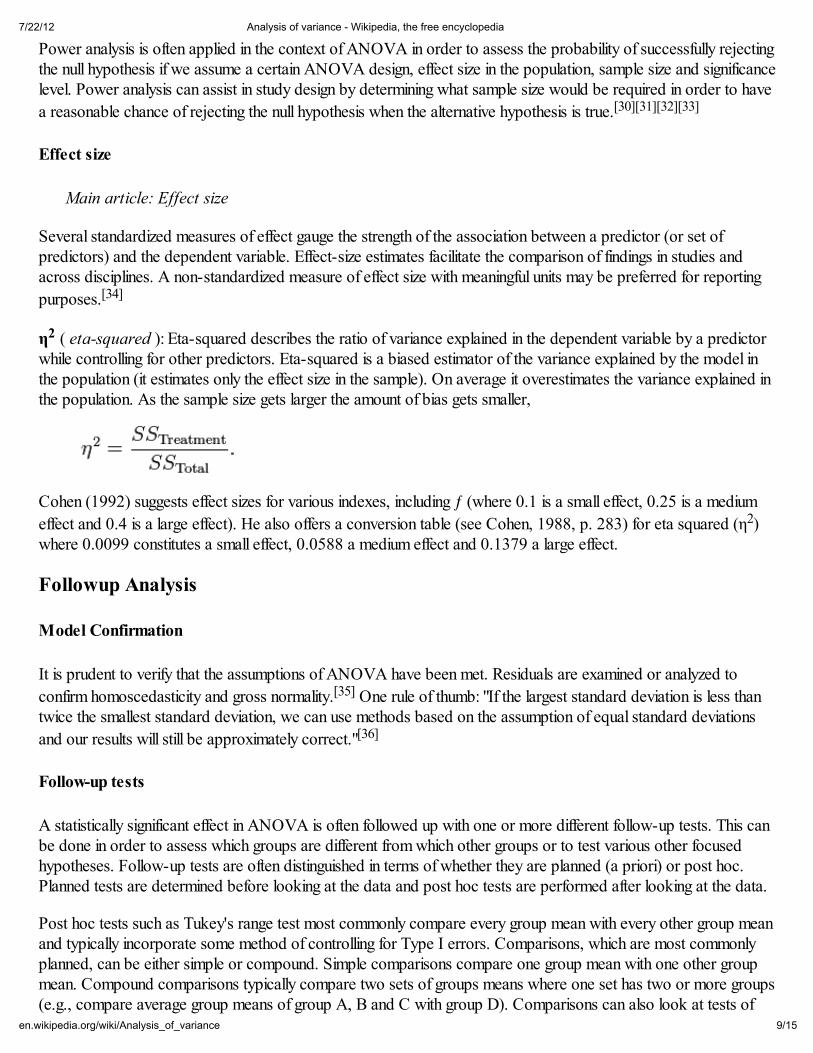
Several standardized measures of effect gauge the strength of the association between a predictor (or set ofpredictors) and the dependent variable. Effect-size estimates facilitate the comparison of findings in studies andacross disciplines. A non-standardized measure of effect size with meaningful units may be preferred for reporting
purposes.[34]
η2 ( eta-squared ): Eta-squared describes the ratio of variance explained in the dependent variable by a predictorwhile controlling for other predictors. Eta-squared is a biased estimator of the variance explained by the model inthe population (it estimates only the effect size in the sample). On average it overestimates the variance explained inthe population. As the sample size gets larger the amount of bias gets smaller,
Cohen (1992) suggests effect sizes for various indexes, including ƒ (where 0.1 is a small effect, 0.25 is a medium
effect and 0.4 is a large effect). He also offers a conversion table (see Cohen, 1988, p. 283) for eta squared (η2)where 0.0099 constitutes a small effect, 0.0588 a medium effect and 0.1379 a large effect.
Followup Analysis
Model Confirmation
It is prudent to verify that the assumptions of ANOVA have been met. Residuals are examined or analyzed to
confirm homoscedasticity and gross normality.[35] One rule of thumb: "If the largest standard deviation is less thantwice the smallest standard deviation, we can use methods based on the assumption of equal standard deviations
and our results will still be approximately correct."[36]
Follow-up tests
A statistically significant effect in ANOVA is often followed up with one or more different follow-up tests. This canbe done in order to assess which groups are different from which other groups or to test various other focusedhypotheses. Follow-up tests are often distinguished in terms of whether they are planned (a priori) or post hoc.Planned tests are determined before looking at the data and post hoc tests are performed after looking at the data.
Post hoc tests such as Tukey's range test most commonly compare every group mean with every other group meanand typically incorporate some method of controlling for Type I errors. Comparisons, which are most commonlyplanned, can be either simple or compound. Simple comparisons compare one group mean with one other groupmean. Compound comparisons typically compare two sets of groups means where one set has two or more groups(e.g., compare average group means of group A, B and C with group D). Comparisons can also look at tests of
7/22/12 Analysis of variance - Wikipedia, the free encyclopedia
10/15en.wikipedia.org/wiki/Analysis_of_variance
trend, such as linear and quadratic relationships, when the independent variable involves ordered levels.
Following ANOVA with pair-wise multiple-comparison tests has been criticized on several grounds.[37]There are
many such tests (10 in one table) and recommendations regarding their use are vague or conflicting.[38][39]
Study designs and ANOVAs
There are several types of ANOVA. Many statisticians base ANOVA on the design of the experiment,[40]
especially on the protocol that specifies the random assignment of treatments to subjects; the protocol's descriptionof the assignment mechanism should include a specification of the structure of the treatments and of any blocking. It
is also common to apply ANOVA to observational data using an appropriate statistical model.[citation needed]
Some popular designs use the following types of ANOVA:
One-way ANOVA is used to test for differences among two or more independent groups (means),e.g.
different levels of urea application in a crop. Typically, however, the one-way ANOVA is used to test for
differences among at least three groups, since the two-group case can be covered by a t-test.[41] When there
are only two means to compare, the t-test and the ANOVA F-test are equivalent; the relation between
ANOVA and t is given by F = t2.
Factorial ANOVA is used when the experimenter wants to study the interaction effects among the
treatments.
Repeated measures ANOVA is used when the same subjects are used for each treatment (e.g., in a
longitudinal study).
Multivariate analysis of variance (MANOVA) is used when there is more than one response variable.
ANOVA Cautions
ANOVA is (in part) a significance test. The American Psychological Association holds the view that simply
reporting significance is insufficient and that reporting confidence bounds is preferred.[42]
While ANOVA is conservative (in maintaining a significance level) against multiple comparisons in one dimension, it
is not conservative against comparisons in multiple dimensions.[43]
Generalizations
ANOVA is considered to be a special case of linear regression[44] [45] which in turn is a special case of the general
linear model.[46] All consider the observations to be the sum of a model (fit) and a residual (error) to be minimized.
The Kruskal–Wallis test and the Friedman test are nonparametric tests, which do not rely on an assumption of
normality.[47][48]
History
While the analysis of variance reached fruition in the 20th century, antecedents extend centuries into the past
according to Stigler.[49] These include hypothesis testing, the partitioning of sums of squares, experimental
7/22/12 Analysis of variance - Wikipedia, the free encyclopedia
11/15en.wikipedia.org/wiki/Analysis_of_variance
techniques and the additive model. Laplace was performing hypothesis testing in the 1770s.[50] The development ofleast-squares methods by Laplace and Gauss circa 1800 provided an improved method of combining observations(over the existing practices of astronomy and geodesy). It also initiated much study of the contributions to sums of
squares. Laplace soon knew how to estimate a variance from a residual (rather than a total) sum of squares.[51] By1827 Laplace was using least squares methods to address ANOVA problems regarding measurements of
atmospheric tides.[52] Before 1800 astronomers had isolated observational errors resulting from reaction times (the
"personal equation") and had developed methods of reducing the errors.[53] The experimental methods used in the
study of the personal equation were later accepted by the emerging field of psychology [54] which developed strong
(full factorial) experimental methods to which randomization and blinding were soon added.[55] An eloquent non-
mathematical explanation of the additive effects model was available in 1885.[56]
Sir Ronald Fisher proposed a formal analysis of variance in a 1918 article The Correlation Between Relatives on
the Supposition of Mendelian Inheritance.[57] His first application of the analysis of variance was published in
1921.[58] Analysis of variance became widely known after being included in Fisher's 1925 book StatisticalMethods for Research Workers.
See also
ANOVA on ranks
ANOVA-simultaneous component analysis
AMOVA
ANCOVA
ANORVA
MANOVA
Mixed-design analysis of variance
Two-way analysis of varianceOne-way analysis of variance
2. ^ The F-test for the comparison of variances has a mixed reputation. It is not recommended as a hypothesis test todetermine whether two different samples have the same variance. It is recommended for ANOVA where twoestimates of the variance of the same sample are compared. While the F-test is not generally robust againstdepartures from normality, it has been found to be robust in the special case of ANOVA. Citations from Moore &McCabe (2003): "Analysis of variance uses F statistics, but these are not the same as the F statistic for comparingtwo population standard deviations." (page 554) "The F test and other procedures for inference about variances areso lacking in robustness as to be of little use in practice." (page 556) "[The ANOVA F test] is relatively insensitiveto moderate nonnormality and unequal variances, especially when the sample sizes are similar." (page 763) ANOVAassumes homoscedasticity, but it is robust. The statistical test for homoscedasticity (the F-test) is not robust.Moore & McCabe recommend a rule of thumb.
Notes
1. ^ Gelman (2005 p 2)
7/22/12 Analysis of variance - Wikipedia, the free encyclopedia
12/15en.wikipedia.org/wiki/Analysis_of_variance
2. ^ Howell (2002 p 320)
3. ^ Montgomery (2001 p 63)
4. ^ Gelman (2005 p 1)
5. ^ Gelman (2005 p 5)
6. ^ "Section 5.7. A Glossary of DOE Terminology" (http://www.itl.nist.gov/div898/handbook/pri/section7/pri7.htm). NIST Engineering Statistics handbook. NIST. http://www.itl.nist.gov/div898/handbook/pri/section7/pri7.htm.Retrieved 5 April 2012.
7. ^ Montgomery (2001, Chapter 12: Experiments with random factors)
8. ^ Gelman (2005 pp 20-21)
9. ^ Snedecor, George W.; Cochran, William G. (1967). Statistical Methods (6th ed.). p. 321.
10. ^ Cochran & Cox (1992, p 48)
11. ^ Howell 2002 p 323
12. ^ Anderson, David R.; Sweeney, Dennis J.; Williams, Thomas A. (1996). Statistics for business and economics(6th ed.). Minneapolis/St. Paul: West Pub. Co. pp. 452-453. ISBN 0314063781.
13. ^ Anscombe (1948)
14. ^ Kempthorne (1979, p 30)
15. ^ Cox (1958, Chapter 2: Some Key Assumptions)
16. ^ Hinkelmann and Kempthorne (2008, Volume 1, Chapters 5-6)
17. ^ Hinkelmann and Kempthorne (2008)
18. ^ Hinkelmann and Kempthorne (2008, Volume 1, Chapter 7: Comparison of Treatments)
19. ^ Bailey (2008, Chapter 1.14)
20. ^ Kempthorne (1979, pp 125-126, "The experimenter must decide which of the various causes that he feels willproduce variations in his results must be controlled experimentally. Those causes that he does not controlexperimentally, because he is not cognizant of them, he must control by the device of randomization." "[O]nlywhen the treatments in the experiment are applied by the experimenter using the full randomization procedure is thechain of inductive inference sound. It is only under these circumstances that the experimenter can attributewhatever effects he observes to the treatment and the treatment only. Under these circumstances his conclusionsare reliable in the statistical sense.")
39. ^ Montgomery (2001, Section 3-5: Practical interpretation of results)
40. ^ Cochran & Cox (1957, p 9, "[T]he general rule [is] that the way in which the experiment is conducteddetermines not only whether inferences can be made, but also the calculations required to make them.")
41. ^ "The Probable Error of a Mean". Biometrika 6: 1–0. 1908. DOI:10.1093/biomet/6.1.1(http://dx.doi.org/10.1093%2Fbiomet%2F6.1.1) .
7/22/12 Analysis of variance - Wikipedia, the free encyclopedia
13/15en.wikipedia.org/wiki/Analysis_of_variance
42. ^ Wilkinson (1999, p 599)
43. ^ Wilkinson (1999, p 600)
44. ^ Gelman (2005 p 1) (with qualification in the later text)
45. ^ Montgomery (2001 Section 3.9: The Regression Approach to the Analysis of Variance)
46. ^ Howell (2002 p 604)
47. ^ Howell (2002, Chapter 18: Resampling and nonparametric approaches to data)
48. ^ Montgomery (2001, Section 3-10: Nonparametric methods in the analysis of variance)
49. ^ Stigler (1986)
50. ^ Stigler (1986, p 134)
51. ^ Stigler (1986, p 153)
52. ^ Stigler (1986, pp 154-155)
53. ^ Stigler (1986, pp 240-242)
54. ^ Stigler (1986, Chapter 7 - Psychophysics as a Counterpoint)
55. ^ Stigler (1986, p 253)
56. ^ Stigler (1986, pp 314-315)
57. ^ The Correlation Between Relatives on the Supposition of Mendelian Inheritance. Ronald A. Fisher.Philosophical Transactions of the Royal Society of Edinburgh. 1918. (volume 52, pages 399–433)
58. ^ On the "Probable Error" of a Coefficient of Correlation Deduced from a Small Sample. Ronald A. Fisher. Metron,1: 3-32 (1921)
References
Anscombe, F. J. (1948). "The Validity of Comparative Experiments". Journal of the Royal StatisticalSociety. Series A (General) 111 (3): 181–211. DOI:10.2307/2984159
Bailey, R. A. (2008). Design of Comparative Experiments(http://www.maths.qmul.ac.uk/~rab/DOEbook) . Cambridge University Press]. ISBN 978-0-521-68357-9.http://www.maths.qmul.ac.uk/~rab/DOEbook. Pre-publication chapters are available on-line.
Cochran, William G.; Cox, Gertrude M. (1992). Experimental designs (2nd ed.). New York: Wiley.ISBN 9780471545675.
Cohen, Jacob (1988). Statistical power analysis for the behavior sciences (2nd ed.). Routledge ISBN978-0-8058-0283-2
Cohen, Jacob (1992). "Statistics a power primer". Psychology Bulletin 112: 155–159.DOI:10.1037/0033-2909.112.1.155 (http://dx.doi.org/10.1037%2F0033-2909.112.1.155) .PMID 19565683 (//www.ncbi.nlm.nih.gov/pubmed/19565683) .
Cox, David R. (1958). Planning of experiments. Reprinted as ISBN 978-0-471-57429-3Freedman, David A.; Pisani, Robert; Purves, Roger (2007) Statistics, 4th edition. W.W. Norton &
Company ISBN 978-0-393-92972-0Freedman, David A.(2005). Statistical Models: Theory and Practice, Cambridge University Press. ISBN
978-0-521-67105-7Gelman, Andrew (2005). "Analysis of variance? Why it is more important than ever". The Annals ofStatistics 33: 1-53. DOI:10.1214/009053604000001048
(http://dx.doi.org/10.1214%2F009053604000001048) .Hinkelmann, Klaus & Kempthorne, Oscar (2008). Design and Analysis of Experiments. I and II (Second
ed.). Wiley. ISBN 978-0-470-38551-7.Howell, David C. (2002). Statistical methods for psychology (5th ed.). Pacific Grove, CA:
7/22/12 Analysis of variance - Wikipedia, the free encyclopedia
14/15en.wikipedia.org/wiki/Analysis_of_variance
Duxbury/Thomson Learning. ISBN 053437770X.
Kempthorne, Oscar (1979). The Design and Analysis of Experiments (Corrected reprint of (1952) Wileyed.). Robert E. Krieger. ISBN 0-88275-105-0.Lehmann, E.L. (1959) Testing Statistical Hypotheses. John Wiley & Sons.
Montgomery, Douglas C. (2001). Design and Analysis of Experiments (5th ed.). New York: Wiley.ISBN 9780471316497.
Moore, David S. & McCabe, George P. (2003). Introduction to the Practice of Statistics (4e). W HFreeman & Co. ISBN 0716796570
Rosenbaum, Paul R. (2002). Observational Studies (2nd ed.). New York: Springer-Verlag. ISBN 978-0-387-98967-9
Stigler, Stephen M. (1986). The history of statistics : the measurement of uncertainty before 1900.Cambridge, Mass: Belknap Press of Harvard University Press. ISBN 0-674-40340-1.Wilkinson, Leland (1999). "Statistical Methods in Psychology Journals; Guidelines and Explanations".
American Psychologist 54 (8): 594–604.
Further reading
Box, G. E. P. (1953). "Non-Normality and Tests on Variances". Biometrika (Biometrika Trust) 40 (3/4):
318-335. JSTOR 2333350 (http://www.jstor.org/stable/2333350) .Box, G. E. P. (1954). "Some Theorems on Quadratic Forms Applied in the Study of Analysis of VarianceProblems, I. Effect of Inequality of Variance in the One-Way Classification". The Annals of Mathematical
Box, G. E. P. (1954). "Some Theorems on Quadratic Forms Applied in the Study of Analysis of VarianceProblems, II. Effects of Inequality of Variance and of Correlation Between Errors in the Two-Way
Classification". The Annals of Mathematical Statistics 25 (3): 484. DOI:10.1214/aoms/1177728717(http://dx.doi.org/10.1214%2Faoms%2F1177728717) .Caliński, Tadeusz & Kageyama, Sanpei (2000). Block designs: A Randomization approach, Volume I:
Analysis. Lecture Notes in Statistics. 150. New York: Springer-Verlag. ISBN 0-387-98578-6.Christensen, Ronald (2002). Plane Answers to Complex Questions: The Theory of Linear Models (Third
ed.). New York: Springer. ISBN 0-387-95361-2.Cox, David R. & Reid, Nancy M. (2000). The theory of design of experiments. (Chapman & Hall/CRC).
ISBN 978-1-58488-195-7Fisher, Ronald (1918). "Studies in Crop Variation. I. An examination of the yield of dressed grain fromBroadbalk" (http://www.library.adelaide.edu.au/digitised/fisher/15.pdf) . Journal of Agricultural Science
11: 107–135. http://www.library.adelaide.edu.au/digitised/fisher/15.pdf.Hettmansperger, T. P.; McKean, J. W. (1998). Robust nonparametric statistical methods. Kendall's
Library of Statistics. 5 (First ed.). New York: Edward Arnold. pp. xiv+467 pp.. ISBN 0-340-54937-8, 0-471-19479-4. MR 1604954 (http://www.ams.org/mathscinet-getitem?mr=1604954) . }
Lentner, Marvin; Thomas Bishop (1993). Experimental design and analysis (Second ed.). P.O. Box 884,Blacksburg, VA 24063: Valley Book Company. ISBN 0-9616255-2-X.
Tabachnick, Barbara G. & Fidell, Linda S. (2007). Using Multivariate Statistics (5th ed.). Boston:Pearson International Edition. ISBN 978-0-205-45938-4Wichura, Michael J. (2006). The coordinate-free approach to linear models. Cambridge Series in
Statistical and Probabilistic Mathematics. Cambridge: Cambridge University Press. pp. xiv+199. ISBN 978-
7/22/12 Analysis of variance - Wikipedia, the free encyclopedia
15/15en.wikipedia.org/wiki/Analysis_of_variance
0-521-86842-6, ISBN 0-521-86842-4. MR 2283455 (http://www.ams.org/mathscinet-getitem?mr=2283455) .
External links
SOCR ANOVA Activity
(http://wiki.stat.ucla.edu/socr/index.php/AP_Statistics_Curriculum_2007_ANOVA_1Way) and interactiveapplet (http://www.socr.ucla.edu/htmls/ana/ANOVA1Way_Analysis.html) .
One-Way and Two-Way ANOVA in QtiPlot (http://soft.proindependent.com/qtiplot.html)Examples of all ANOVA and ANCOVA models with up to three treatment factors, including randomized
block, split plot, repeated measures, and Latin squares(http://www.southampton.ac.uk/~cpd/anovas/datasets/index.htm)NIST/SEMATECH e-Handbook of Statistical Methods, section 7.4.3: "Are the means equal?"