WE yU COTROLLED REST VALLE NUCLEAR SERVICES., INC ACM-ICP-1001, Rev. 1 NUCLEAR - ~ u~r.~. * INC AQI-ICP-lO~l, Rev. Effective Date: 06/28/89 AAUICAL CHEMISTRY MEMTOD ANALYTICAL AND PROCESS CHEMISTRY > Analysis of'Wastes and.Water with ICP Spectrometry Approved by: C. V. McVay, Manager Analytical -- nd Process ehaistry Part I 1.0 PURPOSE > This method is used for the elemental analysis of wastes and water using an'inductively coupled plasma-spectrometer (ICP). Because of the large calibration range (4 to 5 orders of-magnitude).and -the simultaneous capabilities of the instrument, it is ideal for many types of samples. 2.0 SCOPE AND APPLICATION - 2.1 -Dissolved elements are determined in filtered and acidified samples. Appropriate-steps must be':taken in'all'analyses to ensure that potential interferences are taken into account. This is especially true when dissolved solids exceed 1,500 mg/L. 2.2 Total elements are determined.,after appropriate digestion procedures are performed. Since digestion techniques increase the dissolved solids content'of the samples,.appropriate steps must be taken to correct for potential interference effects. > 2.3 Attachment A-lists elements'along with recommended wavelengths and required detection levels. 2.4- No'detailed -instrumental operating instructions are provided. Instead, the analyst is referred to the instructions provided by the manufacturer of the ICP. . 3.0' Discussion -3.1 The method-describes a technique for the simultaneous or sequential multielement determination of elements in solution. The basis of the method is the measurement of atomic emission by an optical GEW0405:ENG-118 Page 1 of 20 [ M-32 PDC V U
AAUICAL CHEMISTRY MEMTODANALYTICAL AND PROCESS CHEMISTRY
> Analysis of'Wastes and.Water with ICP Spectrometry
Approved by:
C. V. McVay, ManagerAnalytical --nd Process ehaistry
Part I
1.0 PURPOSE
> This method is used for the elemental analysis of wastes and water usingan'inductively coupled plasma-spectrometer (ICP). Because of the largecalibration range (4 to 5 orders of-magnitude).and -the simultaneouscapabilities of the instrument, it is ideal for many types of samples.
2.0 SCOPE AND APPLICATION -
2.1 -Dissolved elements are determined in filtered and acidifiedsamples. Appropriate-steps must be':taken in'all'analyses to ensurethat potential interferences are taken into account. This isespecially true when dissolved solids exceed 1,500 mg/L.
2.2 Total elements are determined.,after appropriate digestion proceduresare performed. Since digestion techniques increase the dissolvedsolids content'of the samples,.appropriate steps must be taken tocorrect for potential interference effects.
2.4- No'detailed -instrumental operating instructions are provided.Instead, the analyst is referred to the instructions provided by themanufacturer of the ICP. .
3.0' Discussion
-3.1 The method-describes a technique for the simultaneous or sequentialmultielement determination of elements in solution. The basis ofthe method is the measurement of atomic emission by an optical
GEW0405:ENG-118 Page 1 of 20
[ M-32 PDCV U
I
ACK-ICP-1001, Rev. I.Effective Date: 06/28/89
spectroscopic technique. Samples are nebulized and the aerosol thatis produced is transported to the plasma torch where excitationoccurs. Characteristic atomic-line emission spectra are produced bya radio-frequency Inductively Coupled-Plasma (ICP). The spectra aredispersed by a grating spectrometer and the intensities of the lineare monitored by photomultiplier tubes. The photocurrents from thephotomultiplier tubes are processed and controlled by a computersystem. A background correction technique is required to compensatefor variable background contribution to the determination of traceelements. The position selected for the background intensitymeasurement, on either or both sides of the analytical line, will bedetermined by the complexity of the spectrum adjacent to the analyteline. The position used must be free of spectral interference.Background correction is not required in cases of line broadening orwhere a background correction measurement would-actually degrade theanalytical result.
3.2 DEFINITIONS
3.2.1 Dissolved - Those elements which will pass through a0.45 gm membrane filter.
3.2.2 Suspended - Those elements which are retained by a0.45 Am membrane filter.
3.2.3 Total - The concentration determined on an unfiltered samplefollowing vigorous digestion.
3.2.4 Instrumental Detection Limits - The instrumental detection limitsare determined by multiplying by three the average of thestandard deviation obtained from the analysis of a standardsolution at a concentration 3 to 5 times the instrument detectionlimits. This measurement will define the sensitivity for theICP.
3.2.5 Sensitivity - The slope of the analytical curve, i.e., it is therelationship between emission intensity and concentration.
3.2.6 Instrument Check Standard - A multielement standard of knownconcentration prepared by the analyst to monitor and verifyinstrument performance on a daily basis. (See 6.6.1.)
> 3.2.7 Interference Check Sample - A solution containing bothinterfering-and analyte elements of known concentration that canbe used to verify background and interelement correctionfactors. (See 6.6.1).
> 3.2.8 Quality Control Sample - A solution obtained from an outsidesource having known concentration values to be used to verify thecalibration standards. (See 6.6.2.)
GEW0405:ENG-18a Page 2 of 20
ACO-ICP-1001, Rev. 1Effective Date: 06/28/89
3.2.9 Linear Dynamic Range - The concentration range over which theanalytical curve remains linear.
3.2.10 Reagent Blank - A volume of deionized, distilled water containingthe same acid matrix as the calibaiEion standards carried throughthe entire analytical scheme. (See 6.5.2.)
3.2.11 Calibration Blank - A volume 'of deionized, distilled wateracidified with HN03. (See 6.5.1.)
3.2.12 -Method of Standard Addition'-'The' standard addition techniqueinvolves the use of the unknown'and the unknown-plus-a-knownamount of standard by adding known amounts of standard to one or
-more aliquots of the processed sample solution.
3.2.13 Independent Standard - A standard composed of the analytes from adifferent source than those used'in the standards used for theinitial calibration.
3.3 :SAMPLE COLLECTION, PRESERVATION, AND HANDLING
3.3.1 In the collection of sampies- it is-important to perform samplepreservation to prevent loss of anaLyte.
3.2.1.1 Aqueous.samples collected for the determination of-dissolved elements must be filtered through'a0.45 pm membrane filter as soon as practical aftercollection. (Glass or plastic filtering apparatus arerecommended to avoid possible contamination.) Use thefirst 50 to 100 mL to rinse the filter flask. Discardthis portion and collect the required volume offiltrate. Acidify the filtrate with (1 + 1) HNO3 to a pHof two or less.'Normally, '3 mL of (1 + 1) acid per litre.should be sufficient to preserve the sample.
3.2.1.2 Solid samples collected for the determination of totalmetals should be mixed thoroughly to achieve homogeneity.
3.3 INTERFERENCES '
3.3.1 Several types of interference effects may contribute toinaccuracies in the determination of trace elements. They can besummarized as follows:
3.3.2.1 Spectral interferences can-be categorized as (1) overlapof a spectral line from another element; (2) unresolvedoverlap of'molecular band spectra; (3) backgroundcontribution from continuous or recombination phenomena;and-(4) background'contribution from stray light from theline emission of high concentration elements. The firstof these effects can be compensated by utilizing acomputer correction of the raw data, requiring the
GEW0405:ENG-118 Page 3'of 20
ACQ-ICP-1001, Rev. 1.Effective Date: 06/28/89
monitoring and measurement of the interfering element.The second effect may require selection of an alternatewavelength. The third and fourth effect can usually becompensated by a background correction adjacent to theanalyte line.
3.3.2.2 Physical interferences are generally considered to beeffects associated with the sample nebulization andtransport processes. Such properties as change in 1viscosity and surface tension can cause significantinaccuracies especially in samples which may contain highdissolved solids and/or acid concentrations. The use ofa peristaltic pump will lessen these interferences.
3.3.2.3 Chemical interferences are characteristic by molecularcompound formation, ionization effects, and solutevaporization effects. Normally these effects are notprominent with the ICP technique, however, if observedthey can be minimized by careful selection of operatingconditions (that is, incident power, observationposition, and so forth), by buffering the sample, bymatrix matching, and by standard addition procedures.These types of interferences can be highly dependent onmatrix type and the specific analyte element.
4.0 REFERENCES
(1) Winge, R. K., Peterson, V. J., and Fassel, V. A., 'InductivelyCoupled Plasma-Atomic Emission Spectroscopy Prominent Lines,"EPA-600/4-79-017.
(2) Winefordner, J. D., 'Trace Analysis: Spectroscopic Methods forElements," Chemical Analysis, Volume 46, pp. 41-42.
(3) Handbook for Analytical Quality Control in Water and WastewaterLaboratories, PEA600/4-79-019.
(4) Garbarino, J. R., and Taylor, H. E., "An Inductively CoupledPlasma Atomic Emission Spectrometric Method for Routine WaterQuality Testing", Applied Spectroscopy 33, No. 3 (1979).
(5) "Methods for Chemical Analysis of Water and Wastes",EPA-600/4-79-020.
(6) Annual Book of ASTH Standards, Part 31.
(7) 'Carcinogens - Working with Carcinogens", Department of Health,Education, and Welfare, Public Health Service, Center for DiseaseControl, National Institute for Occupational Safety and Health,Publication No. 77-206, August 1977.
GEW0405:ENG-118 Page 4 of 20 j.
i:
f .
- - AAC-ICP-1001, Rev. 1Effective Date: 06/28/89
(8) "OSHA Safety and Health Standards, General Industry",(29 CFR 1910), Occupational Safety and Health Administration,OSHA 2206, (Revised January 1976).'-
(9) Safety in Academic Chemistry Laboratories", American ChemicalSociety Publications, Committee on Chemical Safety, 3rd Edition,1979.
(10). Inductively Coupled Plasma-Atomic Emission Spectrometric Methodof Trace Element Analysis of Water and Waste", Method 200.7modified by CLP Inorganic Data/Protocol Review Committee,-original method by Theodore D. Martin, EMSL/Cincinnati.
(11) .Inductively Coupled Plasma-Atomic Emission Spectrometric Methodfor Trace Element Analysis' ofAqueous and Solid Samples",modified from the Contract Laboratory Program,' SOW No. 785, byP. C. Lindahl, Argonne National Laboratory.
5.1.3 Argon gas supply,' welding grade or better. (Liquid argonis preferred.).
5.1.4 Peristaltic Pump
5.1.5 Printer .
5.1.6'. Mass Flow Controller -
5.1.7 Exhaust Duct
5.1.8 HF Resistant'Torch Assembly
6.0 REAGENTS AND STANDARDS
- NOTE: All standards, solutions and blanks are prepared according toACP 8.1.
6.1 Acids used in the preparation of standards and for sampleprocessing must be reagent grade or better. Ultrapure acids arerecommended and may be necessary for trace element analysis.
6.1.3 (1 + 1) HC1 - Add 50 mL of hydrochloric acid to 50 mL H20(6.2)
6.1.4 Nitric Acid - Conc. (sp gr 1.41)
6.1.5 (1 + 1) HN03 - Add 50 mL of nitric acid to 50 mL H20(6.2)
6.2 Deionized, distilled water - Prepare by passing distilled waterthrough a mixed bed of cation and anion exchange resins. Usedeionized, distilled water for the preparation of all reagents,calibration standards, and as dilution water. The purity of thiswater must be equivalent to ASTH Type II reagent water ofSpecification D 1193 (4.6).
6.3 Standard stock solutions may be purchased or prepared from ultrahigh purity grade chemicals or metals. (See ACP 8.1.) Thesewill have a shelf life of one year.
? 6.4 Mixed calibration standard solutions - Prepare mixed calibrationstandard solutions by combining appropriate volumes of the stocksolutions in acid-cleaned volumetric flashs. Add appropriateconcentrations of acid(s) and dilute to 100 mL with deionized,distilled water. An acid concentration of 2 percent HN03 isrecommended. Calibrated Eppendorf pipets should be used whenpreparing these solutions and care should be taken that theelements are compatable and stable. Transfer the mixed standardsolutions to a teflon or unused polyethylene bottle forstorage. Fresh mixed standards should be prepared as needed withthe realization that concentration can change on aging. Theupper limit on the expiration date is the expiration date of theoldest stock solution used to prepare the calibration standard.Label the standard per ACP 7.1. Calibration standards must beinitialy verified using a quality control sample.
> NOTE: If the addition of silver to the recommended acidcombination results in an initial precipitation, add 15 mL ofdeionized, distilled water and warm the flask until the solutionclears. Cool and dilute to 100 mL with deionized, distilledwater. For this acid matrix the silver concentration should belimited to 2 mg/L. Silver under these conditions is stable in atap water matrix for 30 days. Higher concentrations of silverrequire the addition of HC1.
GEW0405:ENG-118 Page 6 of 20
ACK-ICP-l0Ol, Rev. 1Effective Date: 06/28/89
6.5 Two types of blanks are required for the analysis. -Thecalibration blank (3.2.11) is used in establishing the analyticalcurve while the reagent blank (preparation blank, 3.2.10) is usedto-correct for possible contamination resulting from varyingamount of the acids used in the sample processing.
6.5.1 The calibration blank is prepared by diluting 2 mL of(1 + 1) HNO3 to 100 mL with deionized, distilled water.Prepare a sufficient quantity to be used to flush thesystem between standards and samples.
6.5.2 The reagent blank (or preparation blank) must contain allthe reagents-and in the same volumes as used in theprocessing of the samples. The reagent blank must becarried through the complete procedure and contain thesame acid concentration in the final solution as thesample solution used for analysis.
6.6 In addition to the* calibration standards, -an instrument checkstandard (3.2.6) and a quality control sample (3.2.8) are alsorequired for the analyses. These standards'will have a shelflife of one year...
NOTE: Poor results on the quality control or instrument checkstandard may indicate either a bad calibration standardor quality control samples.' This would indicate a
" - possible incompatibility. amonganalytes in the solution.
6.6.1 The instrument check standard for continuing calibration-verification is prepared by the analyst by combiningcompatible elements 'at a concentration near the mid-pointof their respective calibration curves. (See 9.3.1.3.)
6.6.2 The quality control sample'for the initial calibrationverification should be prepared in the same acid matrixas the calibration standards and in accordance with the-instructions provided by the supplier. (See 9.3.1.1.)
7.0 SAFETY
7.1 The toxicity or carcinogenicity of each reagent used in thismethod has-not been precisely defined; however, each chemicalcompound should be treated'as a potential'health hazard.* Manymetal salts are extremely toxic and may be fatal if swallowed.Wash hands throughly after handling.
7.2 , An exhaust duct must be operating for the ICP.
7.3 Sample digestions are done in fume hoods using usual laboratorysafety precautions (ACP 7.2).
* See ACP 7.2, Laboratory Safety.
GEW0405:ENG-118 Page 7 of 20
ACK-ICP-1001, Rev. 1Effective Date: 06/28/89
8.0 RECORDS
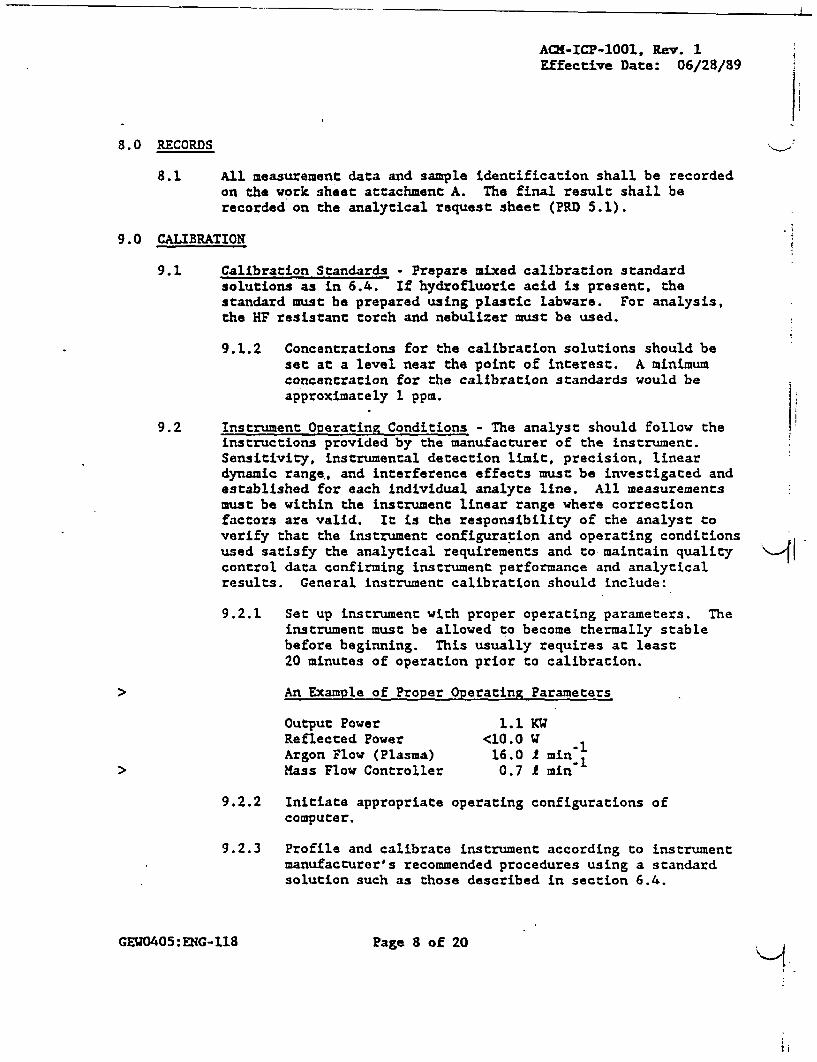
8.1 All measurement data and sample identification shall be recordedon the work sheet attachment A. The final result shall berecorded on the analytical request sheet (PRD 5.1).
9.0 CALIBRATION
9.1 Calibration Standards - Prepare mixed calibration standardsolutions as in 6.4. If hydrofluoric acid is present, thestandard must be prepared using plastic labware. For analysis,the HF resistant torch and nebulizer must be used.
9.1.2 Concentrations for the calibration solutions should beset at a level near the point of interest. A minimumconcentration for the calibration standards would beapproximately 1 ppm.
9.2 Instrument Operating Conditions - The analyst should follow theinstructions provided by the manufacturer of the instrument.Sensitivity, instrumental detection limit, precision, lineardynamic range, and interference effects must be investigated andestablished for each individual analyte line. All measurementsmust be within the instrument linear range where correctionfactors are valid. It is the responsibility of the analyst toverify that the instrument configuration and operating conditionsused satisfy the analytical requirements and to maintain qualitycontrol data confirming instrument performance and analyticalresults. General instrument calibration should include:
9.2.1 Set up instrument with proper operating parameters. Theinstrument must be allowed to become thermally stablebefore beginning. This usually requires at least20 minutes of operation prior to calibration.
> An Example of Proper Operating Parameters
Output Power 1.1 KWReflected Power <10.0 W 1Argon Flow (Plasma) 16.0 1 min 1
9.2.3 Profile and calibrate instrument according to instrumentmanufacturer's recommended procedures using a standardsolution such as those described in section 6.4.
GEW0405:ENG-118 Page 8 of 20
ACK-ICP-1001, Rev. 1Effective Date: 06/28/89
9.2.4 Begin the sample run flushing the system with distilledwater-between each sample. Analyze the instrument checkstandard (6.6.1) and the calibration blank (6.5.1) witheach 20 samples.
9.3 Quality Assurance/Quality Control
9.3.1 Check the instrument standardization by analyzingappropriate quality control check standards-as follows:
> 9.3.1.1 A quality control standard (6.6.3) must be useddaily for the initial calibrationverification. Analyses shall be conducted on anindependent standard at a concentration otherthan that used for calibration, but within thecalibration range. For ICP, the InitialCalibration Verification Solution(s) must be runat each wavelength-used in the analysis of thesample. When measurements exceed the controllimits, the analysis must be terminated, theproblem corrected, the instrument recalibrated,and the calibration reverified. (See ACP 8.2.)
9.3.1.2 Analyze the calibration blank (6.5.1) at afrequency of 10 percent. The result should bewithin *5 times the instrument detection(table 1). If the result is not within thecontrol level, terminate the analysis, correctthe problem, and recalibrate the instrument.
> 9.3.1.3 For continuing calibration verification, analyzean appropriate instrument check standard (6.6.1)containing the elements of interest at afrequency of 10 percent. This check standard is
-- used to determine instrument drift. Ifagreement is not within *10 percent of theexpected values for all elements of interest,the analysis is out of control. The analysismust be terminated, the problem corrected, theinstrument recalibrated, and the preceding10 samples reanalyzed..
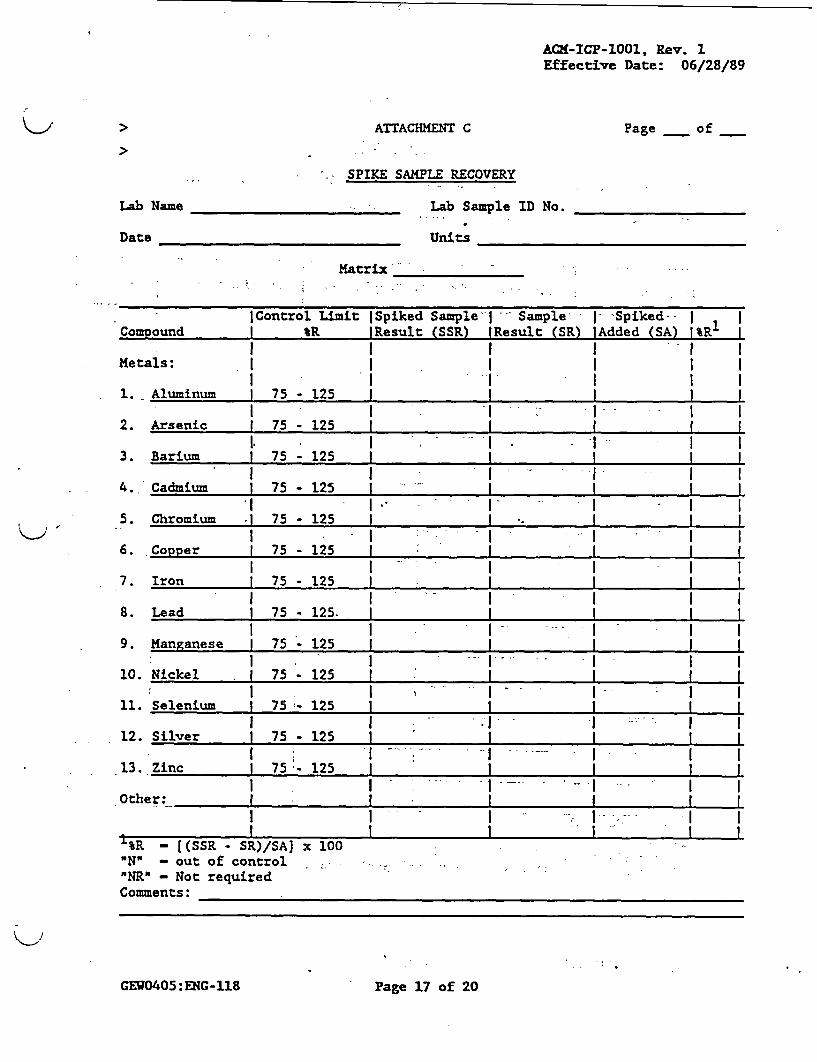
> 9.3.1.4 The spiked sample analysis is designed to- provide information about the effect of the
sample matrix on the digestion and measurementmethodology.N3) The spike is added before thedigestion steps. At least one spiked sample
>(3) Sample spikes and blanks are only required for SPDES analysis.
GEW0405:ENG-118 Page 9 of 20
AC74-ICP-1001, Rev. 1Effective Date: 06/28/89
analysis must be performed on each group ofsamples of a similar matrix type (i.e., water,soil) and concentration,(i.e., low, medium) foreach group of samples or for each 20 samplesreceived, whichever is more frequent. Samplesidentified as field blanks cannot be used forspiked sample analysis. If the spike recoveryis not within the limits of 75 to 125 percent, jithe data of all samples received associated withthat spiked sample must be flagged with theletter IN' on attachments B and C. An exceptionto this rule is granted in situations where thesample concentration exceeds the spikeconcentration by a factor of four or more. Insuch a case, the spike recovery should not beconsidered and the data shall be reportedunflagged even if the percent recovery does notmeet the 75 to 125 percent recovery criteria.In the instance where there is more than onespiked sample per matrix per group, if one spikesample recovery is not within contract criteria,flag all the samples of the same matrix in thegroup. Individual component percent recoveries(IR) are calculated as follows:
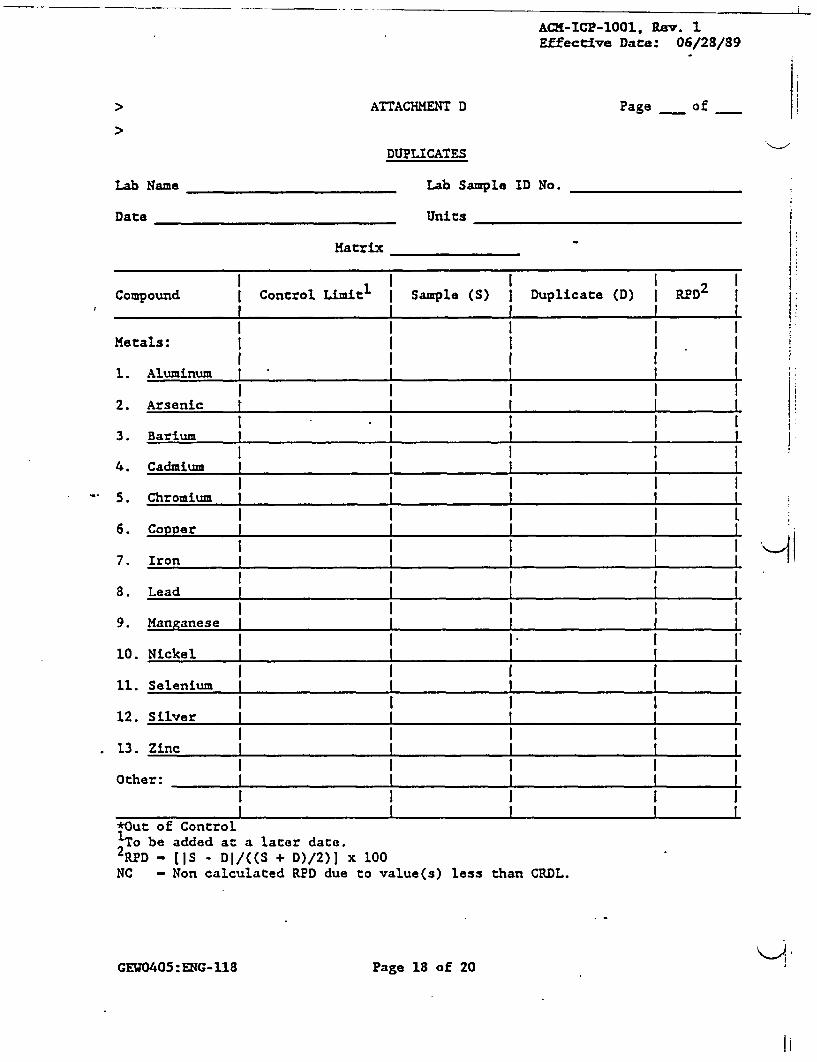
9.3.1.5 At least one duplicate sample must be analyzed.from each group of samples of a similar matrixtype (i.e., water, soil) for each batch ofsamples or for each 20 samp;4 received,whichever is more frequenc. J Samplesidentified as field blanks cannot be used forduplicate sample analysis. The Relative PercentDifference (RPD) for each component arecalculated as follows:
IDI - D2 1RPD - (D1 + D2)/2 x 100
(4) Duplicate samples are only required for SPDES analysis.
GEW0405:ENG-118 Page 10 of 20
ACO-ICP-1001, Rev. 1Effective Date: 06/28/89
Where,
RPD - Relative Percent DifferenceDi - First Sample Value-
- Second Sample Value,(duplicate)
> The'results of the duplicate sample analysismust be reported'on attachment D only if they
-: are.outside th'e control limits. A control'limitof *20 percent'for RPD shall be used for sample
- values greater than 5 times the ContractRequired:Detection Level (CRDL). A controllimit of'* the CLP CRDL shall be used for samplevalues less than 5 times the CRDL (table 1), andthis control limit (±CRDL) should be entered inthe 'Control Limit" column on attachment D. Ifone result is above the 5 x CRDL level and theother is below, use-the *CRDL criteria. Ifeither sample value is less than the CRDL, theRPD is not calculated and is indicated as INC"
* on attachment D.
> , If the duplicate-sample results are outside thecontrol limits, flag all the data for samplesreceived associated with that duplicate sample
.. with an "*" on~attachments B and D.
10.0 PROCEDURE
> 10.1 Aqueous Samples
10.1.1 For the determination of elements in aqueous samples,shake sample and transfer 100 mL mixed sample to a 250 mLbeaker. Add 2 mL of HNO3 to the sample. Heat on a hotplate until the volume has been reduced to
Between 25 and 50 mL making certain the sample does notboil. After this treatment, cool sample and filter toremove insoluble materialthat could clog thenebulizer. Adjust the volume to 100 mL(l) with deionizeddistilled water. The sample is now ready for
*analysis. (2) ','
Concentrations so determined shall be reported as"total."
(1) -For-.trace analysis, the volume may be reduced to 20 mL.(2) Samples may be spiked with Sc'(5-ppm) as an internal standard, which the
results can be ratioed against.
GEWO405:ENG-118 Page 11 of 20
ACK-ICP-1001, Rev. 1Effective Date: 06/28/89
NOTE: In place of filtering, the sample after dilutionand mixing may be centrifuged or allowed to settle bygravity overnight co remove insoluble material.
10.2 Solid Samples
10.2.1 For the determination of elements in solid samples, e.g., jsediments, sludges, and soils, mix the sample thoroughlyto achieve homogeneity. For each digestion procedure,weigh (to the nearest 0.01 gis) a 1.0 to 1.5 g portion ofsample and transfer to a 100 mL beaker.
Add 10 mL of (1:1) nitric acid (HN03), mix the slurrW,and cover with a watch glass. Heat the sample to 95 Cand reflux for 10 minutes without boiling. Allow thesample to cool, add 5 mL of concentrated HNO3, replacethe watch glass, and reflux for 30 minutes. Do not allowthe volume to be reduced to less than 5 mL whilemaintaining a covering of solution over the bottom of thebeaker.
After the second reflux step has been completed and thesample has cooled, add 2 mL of Type II water and 3 mL of30 percent hydrogen peroxide (H2 02 ). Return the beakerto the hot plate for warming to start the peroxidereaction. Care must be taken to ensure that losses donot occur due to excessively vigorous effervescence.Heat until effervescence subsides and cool the beaker.
Continue to add 30 percent H202 in I mL aliquots withwarming until the effervescence is minimal or until thegeneral sample appearance is unchanged. (NOTE: Do notadd more than a total of 10 mL 30 percent H202.)
Next, add 5 mL of 1:1 HC1 and 10 mL of Type II water,return the covered beaker to the hot plate, and heat foran additional 10 minutes. After cooling, filter throughWhatman No. 42 filter paper (or equivalent, or centrifugethe sample). Dilute the filtrate (100 mL final volume)with deionized water. The sample is now ready foranalysis.(2)
10.2.2 For the analysis of glass and melter feed, seeACM-MICRO-1901 and ACM-FUSION-3301.
10.3 Report Forms
10.3.1 All reports in the sample data package must be submittedin a legible form. The data report package for analysesof each sample must be complete before submission andshall include:
GEW0405:ENG-118 Page 12 of 20
ACK-ICP-1001, Rev. 1Effective Date: 06/28/89
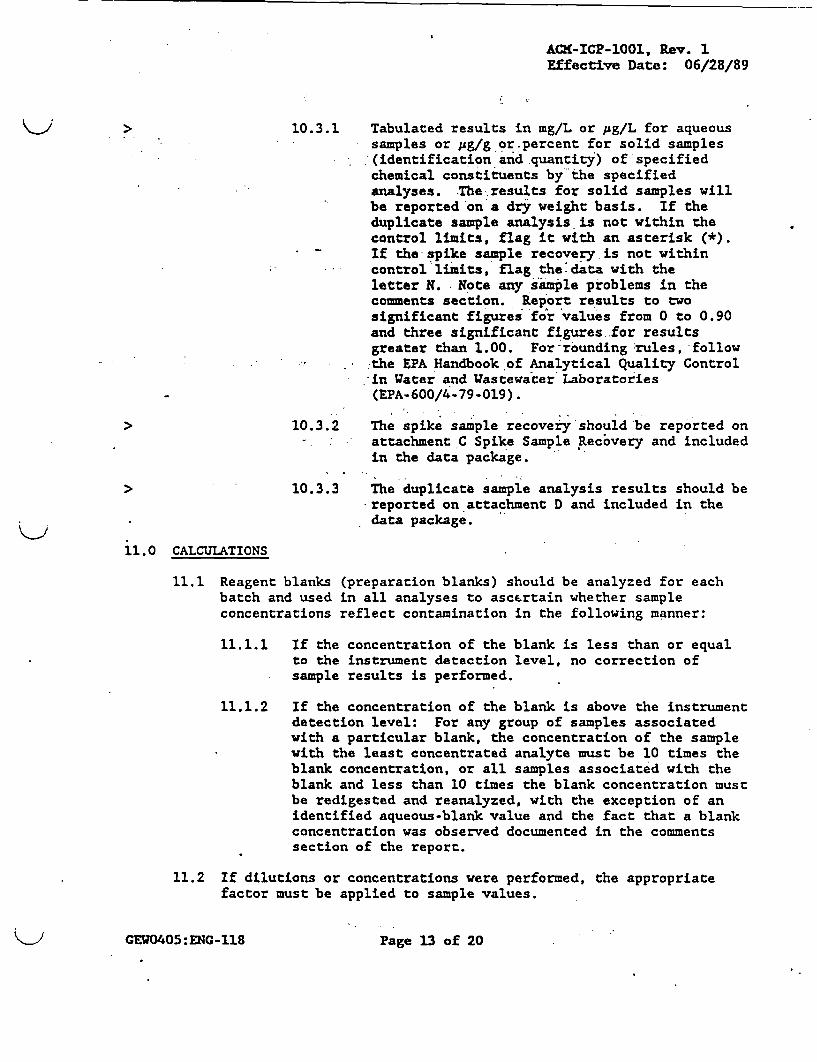
> 10.3.1 Tabulated results in mg/L or pg/L for aqueoussamples or pg/g or.percent for solid samples(identification and quantity) of specifiedchemical constituents by-the specifiedanalyses. The-results for solid samples willbe reported'on a dry weight basis. If theduplicate sample analysis is not within thecontrol limits, flag it with an asterisk (*).If the spike sample recovery is not withincontrol limits, flag the':data with theletter N.- Note any sample problems in thecomments section. Report results to twosignificant figures for values from 0 to 0.90and three significant figures for resultsgreater than 1.00. For-rounding rules, follow:the EPA Handbook of Analytical Quality Control-in Water and Wastewater Laboratories(EPA-600/4-79-019).
> 10.3.2 The spike sample recovery'should-be reported onattachment C Spike Sample Recovery and includedin the data package.
> '' 10.3.3 The duplicate sample analysis results should be-reported on attachment D and included in thedata package.
11.0 CALCULATIONS
11.1 Reagent blanks (preparation blanks) should be analyzed for eachbatch and used in all analyses to ascertain whether sampleconcentrations reflect contamination in the following manner:
11.1.1 If the concentration of the blank is less than or equalto the instrument detection level, no correction ofsample results is performed.
11.1.2 If the concentration of the blank is above the instrumentdetection level: For any group of samples associatedwith a particular blank, the concentration of the samplewith the least concentrated analyte must be 10 times theblank concentration, or all samples associated with theblank and less than 10 times the blank concentration mustbe redigested and reanalyzed, with the exception of anidentified aqueous-blank value and the fact that a blankconcentration was observed documented in the commentssection of the report.
11.2 If dilutions or concentrations were performed, the appropriatefactor must be applied to sample values.
GECJ405:ENC-118 Page 13 of 20
ACM-ICP-1001, Rae. 1:Effective Date: 06/28/89
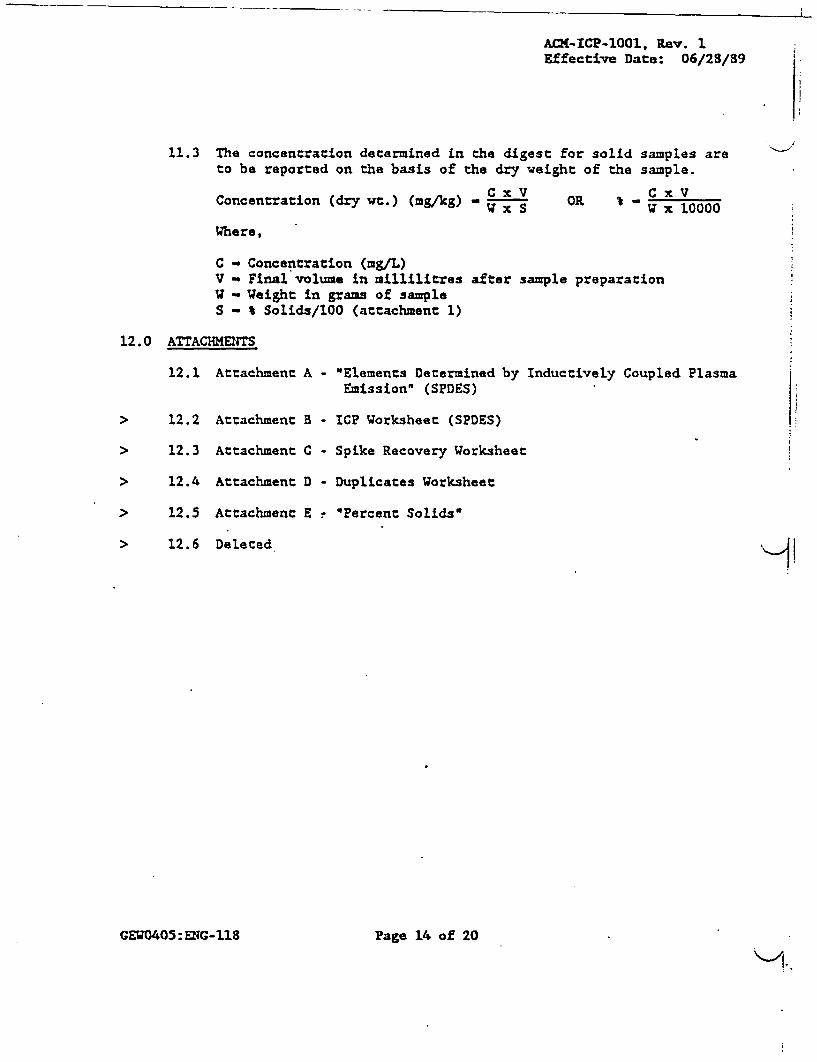
11.3 The concentration determined in the digest for solid samples areto be reported on the basis of the dry weight of the sample.
Concentration (dry wt.) (mg/kg) - C x V OR C x V
Where,
C - Concentration (mg/T.)V - Final volume In millilitres after sample preparationW - Weight in grams of sampleS - I Solids/100 (attachment 1)
12.0 ATTACHMENTS
12.1 Attachment A - "Elements Determined by Inductively Coupled Plasma
12.2
12.3
12.4
12.5
12.6
Attachment
Attachment
Attachment
Attachment
Deleted
B
C
D
Emission' (SPDES)
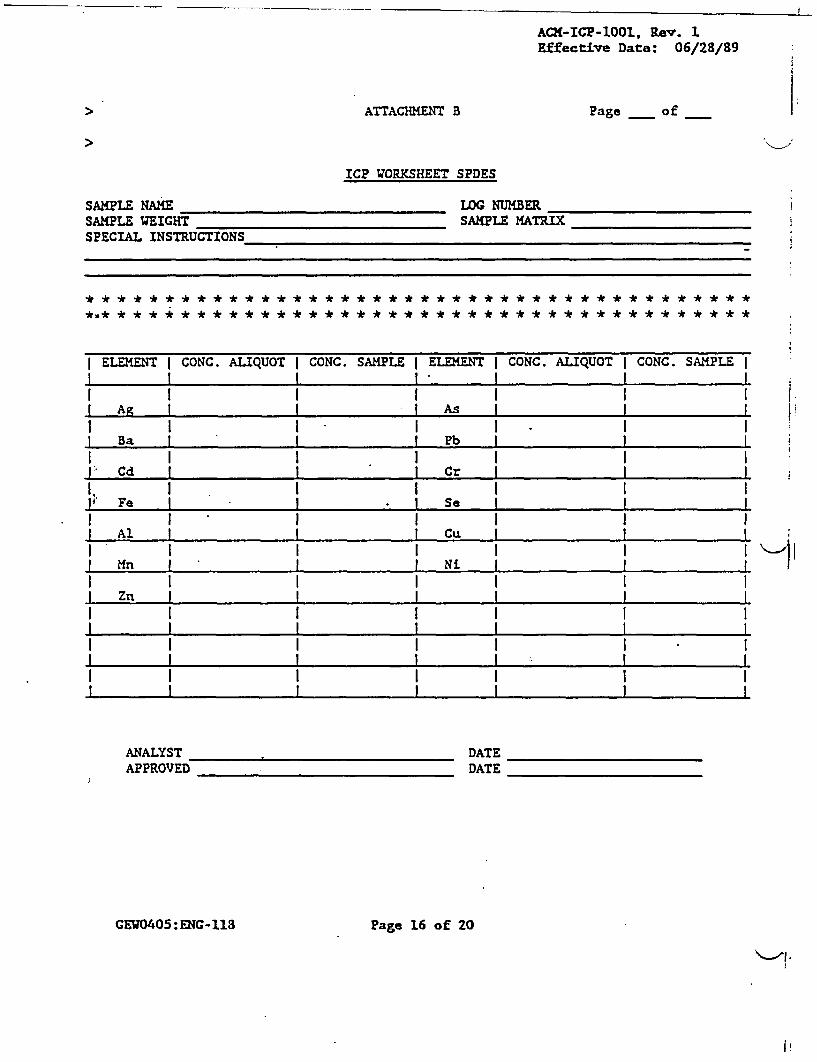
- ICP Worksheet (SPDES)
- Spike Recovery Worksheet
- Duplicates Worksheet
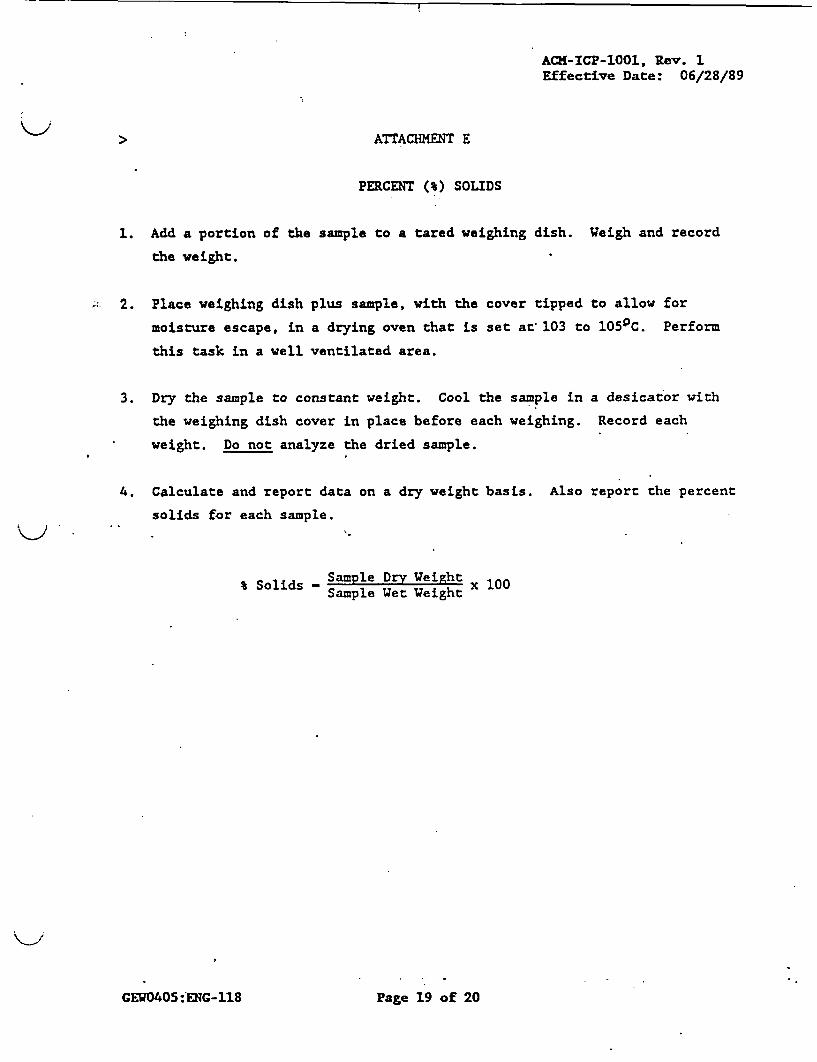
- 'Percent Solids*
GEWO405:ENG-118 Page 14 of 20
AC0-ICP-1001, Rev. 1Effective Date: 06/28/89
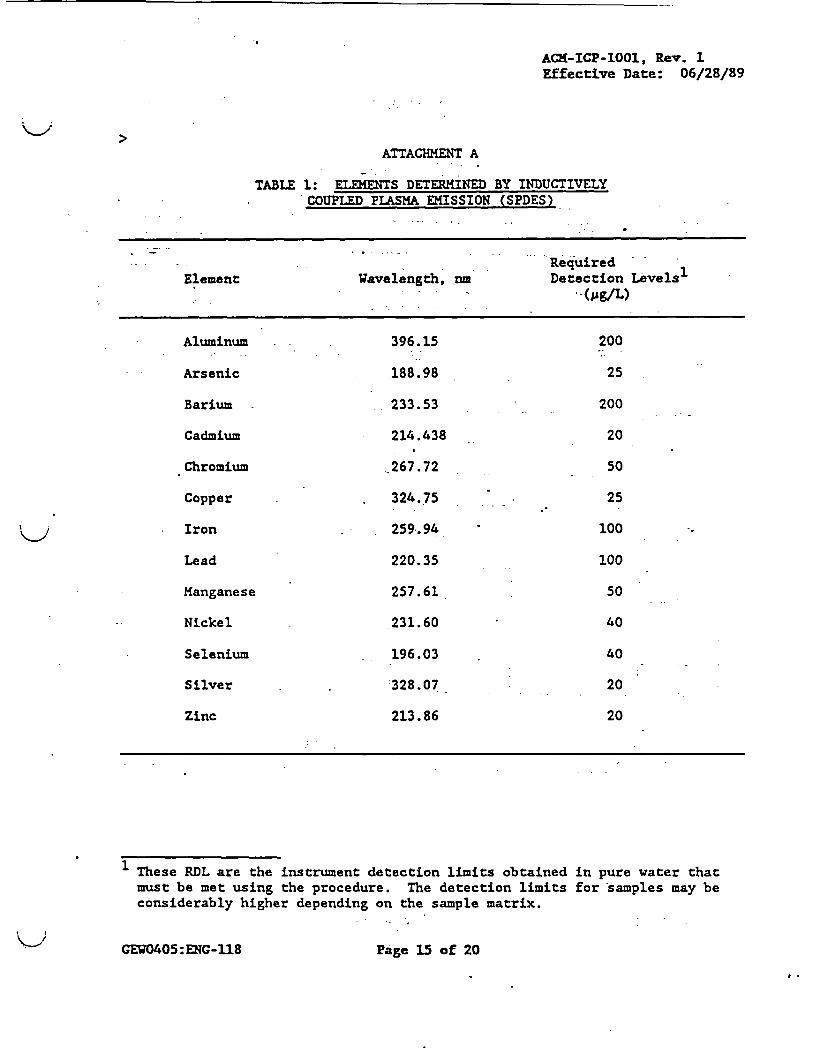
ATTACHMENT A
TABLE 1: ELEMENTS DETERMINED BY INDUCTIVELYCOUPLED PLASMA EMISSION (SPDES)
RequiredElement Wavelength, nm Detection Levels-
(pg/L)
Aluminum 396.15 200
Arsenic .188.98 25
Barium 233.53 200
Cadmium 214.438 20
Chromium 267.72 50
Copper 324.75 25
Iron 259.94 100
Lead 220.35 100
Manganese 257.61 50
Nickel 231.60 40
Selenium 196.03 40
Silver .328.07 20
Zinc 213.86 20
1 These RDL are the instrument detection limits obtained in pure water thatmust be met using the procedure. The detection limits for samples may beconsiderably higher depending on the sample matrix.