Analysis of Wind-Hydro Integration Value in Vermont Princeton Energy Resources International 1 WINDPOWER 2003 ANALYSIS OF WIND-HYDRO INTEGRATION VALUE IN VERMONT WINDPOWER 2003 MAY 21, 2003 10:40AM – 12:00PM HYBRID AND DISTRIBUTED GENERATION SESSION JOSEPH M. COHEN PRINCETON ENERGY RESOURCES INTERNATIONAL 1700 ROCKVILLE PIKE, SUITE 550 ROCKVILLE, MD 20852 [email protected]WWW.PERIHQ.COM GAËTAN LAFRANCE INRS, UNIVERSITY OF QUÉBEC 1650 LIONEL BOULET VARENNES, QUÉBEC, CANADA J3X 1S2 [email protected]STÉPHANE KRAU AND BERNARD SAULNIER INSTITUT DE RECHERCHE D’HYDRO-QUÉBEC (IREQ) 1800 BLVD LIONEL BOULET VARENNES, QUÉBEC, CANADA J3X 1S2 [email protected][email protected]
Transcript
Analysis of Wind-Hydro Integration Value in Vermont
Princeton Energy Resources International 1 WINDPOWER 2003
ANALYSIS OF WIND-HYDRO INTEGRATION VALUE IN VERMONT
WINDPOWER 2003 MAY 21, 2003
10:40AM – 12:00PM HYBRID AND DISTRIBUTED GENERATION SESSION
JOSEPH M. COHEN
PRINCETON ENERGY RESOURCES INTERNATIONAL
1700 ROCKVILLE PIKE, SUITE 550 ROCKVILLE, MD 20852 [email protected]
Analysis of Wind-Hydro Integration Value in Vermont
Princeton Energy Resources International 2 WINDPOWER 2003
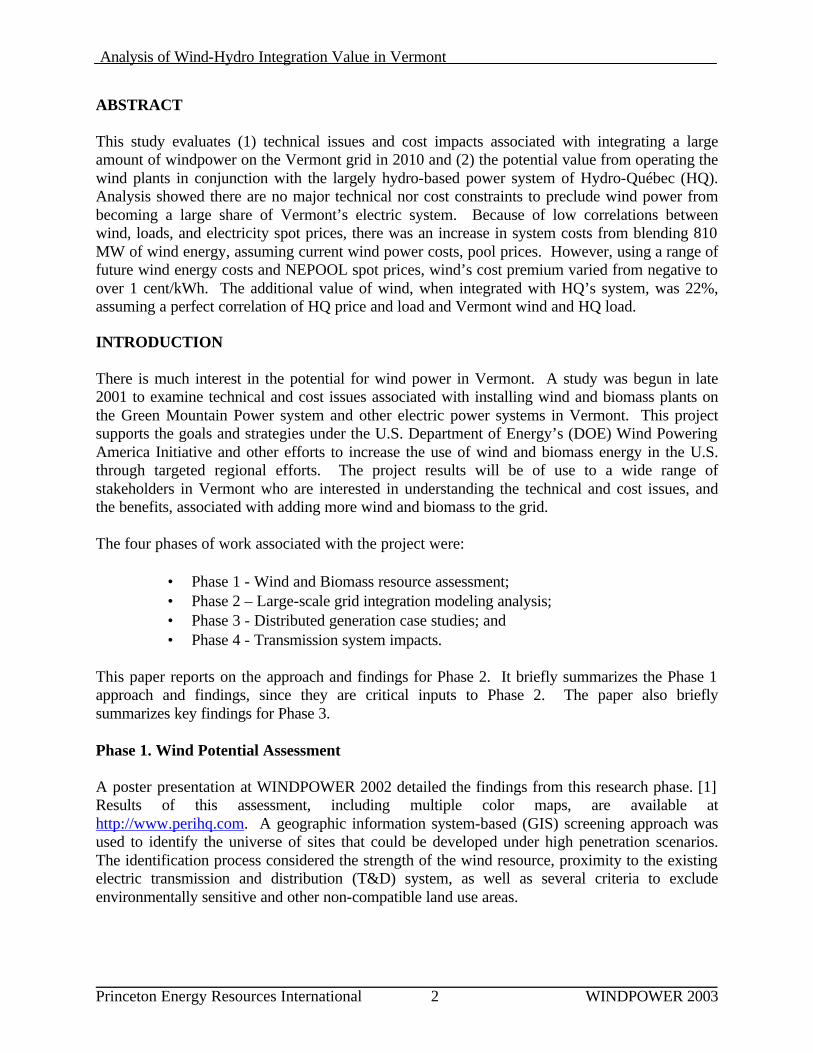
ABSTRACT This study evaluates (1) technical issues and cost impacts associated with integrating a large amount of windpower on the Vermont grid in 2010 and (2) the potential value from operating the wind plants in conjunction with the largely hydro-based power system of Hydro-Québec (HQ). Analysis showed there are no major technical nor cost constraints to preclude wind power from becoming a large share of Vermont’s electric system. Because of low correlations between wind, loads, and electricity spot prices, there was an increase in system costs from blending 810 MW of wind energy, assuming current wind power costs, pool prices. However, using a range of future wind energy costs and NEPOOL spot prices, wind’s cost premium varied from negative to over 1 cent/kWh. The additional value of wind, when integrated with HQ’s system, was 22%, assuming a perfect correlation of HQ price and load and Vermont wind and HQ load. INTRODUCTION There is much interest in the potential for wind power in Vermont. A study was begun in late 2001 to examine technical and cost issues associated with installing wind and biomass plants on the Green Mountain Power system and other electric power systems in Vermont. This project supports the goals and strategies under the U.S. Department of Energy’s (DOE) Wind Powering America Initiative and other efforts to increase the use of wind and biomass energy in the U.S. through targeted regional efforts. The project results will be of use to a wide range of stakeholders in Vermont who are interested in understanding the technical and cost issues, and the benefits, associated with adding more wind and biomass to the grid. The four phases of work associated with the project were:
• Phase 1 - Wind and Biomass resource assessment; • Phase 2 – Large-scale grid integration modeling analysis; • Phase 3 - Distributed generation case studies; and • Phase 4 - Transmission system impacts.
This paper reports on the approach and findings for Phase 2. It briefly summarizes the Phase 1 approach and findings, since they are critical inputs to Phase 2. The paper also briefly summarizes key findings for Phase 3. Phase 1. Wind Potential Assessment A poster presentation at WINDPOWER 2002 detailed the findings from this research phase. [1] Results of this assessment, including multiple color maps, are available at http://www.perihq.com. A geographic information system-based (GIS) screening approach was used to identify the universe of sites that could be developed under high penetration scenarios. The identification process considered the strength of the wind resource, proximity to the existing electric transmission and distribution (T&D) system, as well as several criteria to exclude environmentally sensitive and other non-compatible land use areas.
Analysis of Wind-Hydro Integration Value in Vermont
Princeton Energy Resources International 3 WINDPOWER 2003
The resource assessment process was conducted with consideration for two distinct development perspectives.
Class A turbine strings - Large wind power installations (greater than 6 MW) installed along the windiest ridge lines and interconnected directly to the existing electric transmission system (connected to grid facilities above 34 kV-class levels); and Class B turbine strings - Small installations (50 kW to 6 MW), generally at lower elevation sites where they could be either connected to the existing electric distribution or sub-transmission system (connected to grid facilities below 34 kV-class levels).
The state-wide peak load in Vermont is about 1,000 MW. The Phase 1 assessment found that there is more than enough potential wind resource to meet this study’s target of “high penetration” on Vermont’s grid from wind turbines connected to a combination of Vermont’s transmission or distribution lines. There are comparable amounts of resource available for Class A (6,074 MW) and B (6,153 MW) strings. Even using much more severe land use exclusion criteria, i.e., restrictions for environmentally sensitive land, scenic vistas, etc., would leave enough resource available for a high penetration scenario. In other words, the state is not resource-constrained. However, the reader is cautioned that no conclusions were drawn by the study authors as to the feasibility or likelihood of future wind energy development in Vermont. Other issues, such as achieving public acceptance for siting wind energy facilities, will also have to be addressed for development to occur. Phase 2. Large Integration Modeling and Analysis Approach This phase of the study assessed the impact of integrating a high level of wind generating capacity on the cost of the Vermont electrical system in year 2010. The study considers the addition of a large amount of wind capacity to the grid to determine technical limits without major changes or reinforcement of the grid over a period of several years. Our methodology uses, as a main building block, an existing hydro-thermal medium-term generation planning (MTGP) model available at the Hydro-Québec Research Institute (IREQ). This model was previously modified at the Institut National de la Rechereche Scientifique (INRS) for assessing wind penetration on Hydro-Québec’s power system. The general purpose of such a model is to optimize power system operation for a period that includes hourly load profile cycles analyzed for a full year duration. The objective of the model is to minimize costs while taking into account the full set of actual system operational characteristics (e.g., generation levels, load patterns, and wholesale power prices). The MTGP model was used to analyze the optimal operation of the Vermont generation system assuming 810 MW of wind power is located on the system, taking into account the interconnections with adjoining grids. [2] The choice of this exact number is a result of using the site characterization data developed in Phase 1 of the project to arrive at a capacity close to the state load and current generation capacity. It was assumed, for modeling purposes, that the Vermont generation system is operated in an optimal coordinated manner rather than in a
Analysis of Wind-Hydro Integration Value in Vermont
Princeton Energy Resources International 4 WINDPOWER 2003
decentralized competitive manner. The goal of the analysis was to identify the least cost way to complement the wind generation. This “complementary” generation could be provided either through interconnections to neighboring grids or by existing and/or additional backup power generation units connected to the Vermont grid system. In all instances, the transmission line capacity and electricity generation costs are factored in for comparing scenarios. Two general cases were investigated for operation of the Vermont grid. For Case I, Vermont was modeled to include energy exchanges with NEPOOL, and with Hydro-Québec only under current contractual conditions. That is, wind power is not allowed to be exported to Hydro-Québec in the model. For Case II, the model was extended to include export of wind power to Hydro-Québec, to measure the impact of this integration on the value of Vermont wind energy and on the optimization of the hydro reservoir, when wind is managed with relatively unlimited hydro storage capacities. [2] [3] Correlations For this study, NEPOOL hourly spot prices and load, and Vermont load and hourly wind resource characteristics (extrapolated from the Searsburg, VT wind plant site) are the key factors driving the value of wind generation. The value of wind power in the NEPOOL market is heavily influenced by how well Vermont wind correlates with NEPOOL prices over the year. In addition, the level of correlation between the wind and load in Vermont is key to the level of benefits wind can provide to constrained parts of the distribution system (i.e., delay, reduction, or avoidance of distribution system equipment upgrades or reinforcements). However, even without such correlation, distributed wind installations can provide benefits such as voltage support and reduction of line losses. Finally, if wind energy is exported to Hydro-Québec, then HQ’s load and price must be added to the list of critical factors. The relationship and correlation between all of the factors mentioned above is a fundamental underpinning of the modeling for this study. Wind Energy Supply Curve Since the primary goal of this phase of the project is to estimate the costs of integrating wind generation in Vermont, an important element of the analysis is the estimation of the levelized cost of energy (COE) for each additional increment of wind power that could be added to the grid. A set of such costs versus capacity is known as a “supply curve.” The wind resource GIS database developed in Phase 1 of this project was used to calculate the capacity factor and distance to transmission facilities for each wind plant location, the latter being used to calculate cost of interconnection for each wind plant. A topographic map layer was also used to identify terrain features that would add to installation cost for individual plant sites. The COE was then calculated by combining these inputs with assumptions for current “favorable” financial and technology characteristics. “Favorable” characteristics include various potential combinations of financial factors and approaches, including (1) current low financing rates; (2) balance sheet financing or portfolio financing, where collateral for the project is set against the entire balance sheet of the equity owner, or against a portfolio of projects, thereby lowering the risk of default, and consequently the cost of capital; and (3) use of the Federal Production Tax Credit (PTC) or public utility ownership, which can utilize tax-free debt for project financing.
Analysis of Wind-Hydro Integration Value in Vermont
Princeton Energy Resources International 5 WINDPOWER 2003
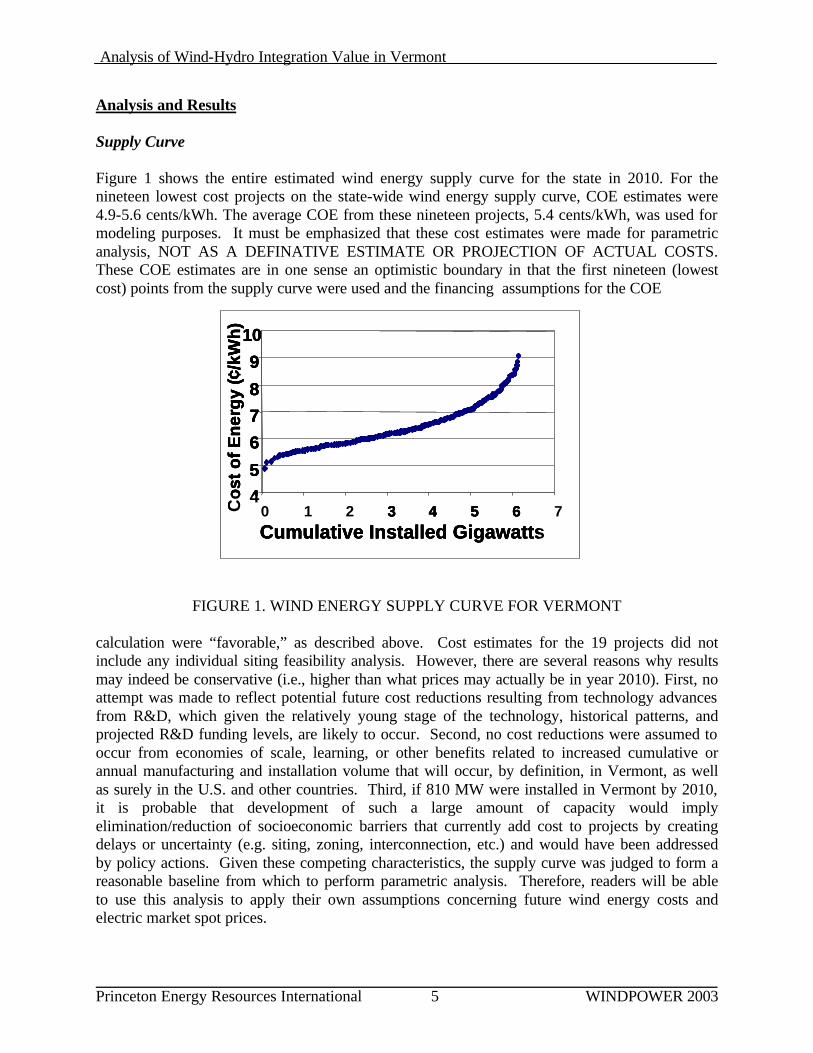
Analysis and Results Supply Curve Figure 1 shows the entire estimated wind energy supply curve for the state in 2010. For the nineteen lowest cost projects on the state-wide wind energy supply curve, COE estimates were 4.9-5.6 cents/kWh. The average COE from these nineteen projects, 5.4 cents/kWh, was used for modeling purposes. It must be emphasized that these cost estimates were made for parametric analysis, NOT AS A DEFINATIVE ESTIMATE OR PROJECTION OF ACTUAL COSTS. These COE estimates are in one sense an optimistic boundary in that the first nineteen (lowest cost) points from the supply curve were used and the financing assumptions for the COE
FIGURE 1. WIND ENERGY SUPPLY CURVE FOR VERMONT calculation were “favorable,” as described above. Cost estimates for the 19 projects did not include any individual siting feasibility analysis. However, there are several reasons why results may indeed be conservative (i.e., higher than what prices may actually be in year 2010). First, no attempt was made to reflect potential future cost reductions resulting from technology advances from R&D, which given the relatively young stage of the technology, historical patterns, and projected R&D funding levels, are likely to occur. Second, no cost reductions were assumed to occur from economies of scale, learning, or other benefits related to increased cumulative or annual manufacturing and installation volume that will occur, by definition, in Vermont, as well as surely in the U.S. and other countries. Third, if 810 MW were installed in Vermont by 2010, it is probable that development of such a large amount of capacity would imply elimination/reduction of socioeconomic barriers that currently add cost to projects by creating delays or uncertainty (e.g. siting, zoning, interconnection, etc.) and would have been addressed by policy actions. Given these competing characteristics, the supply curve was judged to form a reasonable baseline from which to perform parametric analysis. Therefore, readers will be able to use this analysis to apply their own assumptions concerning future wind energy costs and electric market spot prices.
4
5
6
7
8
9
10
0 1 2 3 4 5 6 7Cumulative Installed Gigawatts
Co
st o
f E
ner
gy
(¢/k
Wh
)
4
5
6
7
8
9
10
0 1 2 3 4 5 6 7Cumulative Installed Gigawatts
Co
st o
f E
ner
gy
(¢/k
Wh
)
4
5
6
7
8
9
10
0 1 2 3 4 5 6 7Cumulative Installed Gigawatts
Co
st o
f E
ner
gy
(¢/k
Wh
)
4
5
6
7
8
9
10
0 1 2 3 4 5 6 7Cumulative Installed Gigawatts
Co
st o
f E
ner
gy
(¢/k
Wh
)
Analysis of Wind-Hydro Integration Value in Vermont
Princeton Energy Resources International 6 WINDPOWER 2003
The fact that the COE range is relatively small for the 19 lowest cost wind projects on the supply curve demonstrates that the curve is relatively flat up to at least 810 MW (as figure 1 confirms visually). In other words, the cost of adding each additional MW of wind changes relatively little up to at least 810 MW. This result assumes that each new increment of wind power capacity is installed in the next-most cost-effective location, based on wind resource, topography, and distance to transmission facilities. While in practice, such an installation pattern is improbable due to siting objections and other issues, i.e., cost is not the only criteria for siting. There is, in fact, much more than 810 MW of potential capacity at the low end of the supply cost curve. Transmission Constraints One of the important findings of this research is that there are no major system integration constraints to preclude wind power from becoming a large share of Vermont’s power generation system. Assuming that neighboring markets will accept the energy surplus from wind plants, the results from the simulations indicate that no congestion is expected to occur on main internal and external ties of Vermont when 810 MW of wind capacity is installed within Vermont. Integrating such a capacity in the grid may seem considerable, but this finding is realistic in view of the fact that the Vermont power system is small compared to neighboring power systems. As such, Vermont relies on a set of important ties to NEPOOL in the eastern and southern regions, as shown in figure 2, to allow the load to be continuously adjusted over time. The four regions shown in the figure were developed for this study to facilitate the modeling process. They are based on load growth patterns, wind resource availability, and presence of transmission capacity.
FIGURE 2. TRANSMISSION INTERTIE LINE CAPACITIES AND MODELING REGIONS
Region 1Region 1Region 2Region 2
Region 3Region 3
Region 4Region 4
900 MW
239 MW
239 MW
341 MW244 MW
225 MW
258 MW
239 MW
244 MW
239 MW
239 MW
900 MW
900 MW
Region 1Region 1Region 2Region 2
Region 3Region 3
Region 4Region 4
900 MW
239 MW
239 MW
341 MW244 MW
225 MW
258 MW
239 MW
244 MW
239 MW
239 MW
900 MW
900 MW
Analysis of Wind-Hydro Integration Value in Vermont
Princeton Energy Resources International 7 WINDPOWER 2003
Correlations Table 1 lists the correlations between Vermont load and wind, and NEPOOL load and price, based on 2000 data. The correlation between Vermont wind and load was found to be weak, especially for peak load hours. This is partially explained by the fact that the electrical load in Vermont is not driven by winter space-heating peaks, when the wind resource is the strongest (only a small percentage of space heating is from electricity). Likewise, the correlation between Vermont wind and NEPOOL price was found to be low. The only correlated parameters are Vermont and NEPOOL loads. It is possible that these findings represent a worst case, since they are based on wind characteristics from only one site (Searsburg) and one year of NEPOOL data. In addition, the analysis did not consider the stochastic nature of wind data, or the affect of geographic diversity, both of which could also improve the correlation. It would be worthwhile to reconfirm these results by using a wind database over a wider geographic area in Vermont, coupled with a stochastic treatment of the wind resource based on data from different locations.
TABLE 1. HOURLY CORRELATION FOR KEY PARAMETERS (PEARSON COEFFICIENT)
Case I Results Based on Searsburg wind data and 2000 NEPOOL spot prices, the correlation that exists between NEPOOL peak prices and Vermont wind output was found to be too low to provide wind energy projects with annual revenues greater than the average cost of energy from the pool. Using the wind cost supply curve developed earlier, modeling results from Case I (power exchange with NEPOOL, no export to Canada) indicate that, in a scenario where NEPOOL prices in 2010 are the same as in 2000, the additional cost (“cost premium”) that would have to be paid by Vermont ratepayers for accepting 820 MW of wind capacity amounts to 1.3 cents/kWh. Table 2 shows this case (the entry for zero percent change in 2000 values of NEPOOL price and wind COE). A linear relationship was found between wind cost of energy and the additional cost determined by the model. Using this relationship, Table 2 shows that wind COE would have to drop 24% at current NEPOOL prices to eliminate the cost premium. Conversely, the NEPOOL price would have to increase by 32%, or 2.8 percent annually, at the assumed current wind price to eliminate the premium. The table also lists several intermediate cases.
Vermont
Load
NEPOOL
Load
NEPOOL
Price
Vermont
Wind
Vermont Load 1 0.75 0.07 -0.01
NEPOOL Load 0.75 1 0.12 -0.05
NEPOOL Price 0.07 0.12 1 -0.02
Vermont Wind -0.01 -0.05 -0.02 1
Analysis of Wind-Hydro Integration Value in Vermont
Princeton Energy Resources International 8 WINDPOWER 2003
TABLE 2. RESULTS OF CASE I ANALYSIS (NO EXPORT TO CANADA)
Case II Results In a system where no correlation exists between load, electricity price and wind, where energy storage is unavailable, the wind generation value is derived exclusively from wind generation costs and electricity wholesale prices. This is clearly the worst case for valuing wind energy. However, there may be a number of additional areas from which wind can obtain value in Vermont. First, wind power can be used to diversify generation sources, providing a long-term hedge against electricity price fluctuations. Second, a premium on some of the power may provide additional revenue for its “green” aspects. Third, a cooperative management approach between mostly hydro-based Hydro-Québec and Vermont wind generation may be able to provide value by improving power supply synergies between the two jurisdictions. In contrast to the conditions in Vermont, there is a much better correlation between the Vermont wind resource and the load in Québec, because the higher winds occur during the winter when there is a higher load from predominantly electric space and water heating. Figure 3 demonstrates this strong correlation. Consequently, a second analysis case “Case II” was modeled to explore this potential additional value. The objective of Case II was to calculate the gain for a “Québec+Vermont” system when wind generation added in Vermont is exported during periods of peak Québec demand. This strategy was implemented by synthesizing a strong price-load correlation in the Québec system. Such a relationship is present, despite the fact that the load peaks in winter due to heavy space heating demand, because when water flows are at their lowest. Figure 4 clearly demonstrates this relationship. In electrical grid systems where wind/load correlation exists and/or where some storage capacity exists, e.g., Québec or Scandinavia, wind generation is, in effect, backed-up by existing complementary sources such as hydroelectric generating units and it is found in these grids that spot prices are highly correlated to water level in the hydro system. For this analysis, 529 MW of wind projects were assumed to be in place in Vermont with the transmission capacity of the Québec-Vermont ties limited to 300 MW (225 MW through region 1 and 75 MW through New Hampshire).
-32% -24 % 0
3.9 (-10% ) 0 0.4 1.7
4.3 (0.0% ) -0.4 0 1.3
5.7 (32% ) -1.7 -1.3 0
Change in C O E Needed For Win d T o B re a k E v e n In 2010 (cents/kWh, year 2000 do lla rs)
Average Annual NEPOOL
W h o lesale Price - cents/kWh (% change
from 2000 value)
Percent Change From 2000
Average W ind COE of 5.4
cents/kWh
Analysis of Wind-Hydro Integration Value in Vermont
Princeton Energy Resources International 9 WINDPOWER 2003
FIGURE 3. CORRELATION OF VERMONT WIND WITH HQ LOAD Model results show that the presence of this correlation significantly improves the optimization of the hydro reservoir in Canada, thereby adding value to the wind power. Assuming a perfect correlation of HQ prices and load to produce an upper bound estimate, the value of Vermont wind power increased by 22 percent over the market value of wind if it were sold directly in the NEPOOL system.
FIGURE 4. CORRELATION OF HQ WATER FLOWS AND LOAD
The results from these simulations show that under the specific system profile of Vermont and Québec, a significant added value can be attributed to wind. Under such a cooperative wind-hydro energy management scenario, wind generation produces measurable benefits to the “Québec + Vermont” system over a complete annual cycle.
Wind
1985
1986
1987
1988
1989
1990
1991
1992
1993
1994
1995
HQ LOADWind
1985
1986
1987
1988
1989
1990
1991
1992
1993
1994
1995
1985
1986
1987
1988
1989
1990
1991
1992
1993
1994
1995
HQ LOAD
Week
Water Inflow
HQ Load
Summer Fall Winter SpringWeek
Water Inflow
HQ Load
Summer Fall Winter Spring
Analysis of Wind-Hydro Integration Value in Vermont
Princeton Energy Resources International 10 WINDPOWER 2003
DISTRIBUTED GENERATION CASE STUDIES Although the focus of this paper is on the value of wind-hydro integration, a brief summary of Phase 3 is also given here. A complete discussion of this research is contained in the project final report and technical reference document. [4] Two case studies were conducted to examine the steady state and transient impacts of wind generation connected to a distribution grid. Detailed models of the local power system network were created using the Matlab modeling platform. Matlab, from Mathworks, is a commercial scientific/engineering calculation software package that incorporates modules suitable for such analysis. IREQ has developed a library of objects for that software, called SimPowerSystems, devoted specifically to the analysis of power systems/networks and components. Using that software, IREQ built detailed models of the two case study areas. The analysis included steady state stability, and affects of wind gusts, faults, and full-to-no generation. The first case study selected was a ski resort area located at the end of a long radial combination 34.5/12.47 kV distribution circuit. Eight 1.5 MW wind turbines (12 MW total capacity) were modeled at this location. This application had a high level of interest to the project team for a number of reasons. First, the ski resort has plans for expansion and new electrical facilities would be proposed to serve the load increase. Also, the demand has already reached the loading limits of the existing electrical facilities and the ski area now falls under the definition of a constrained area. The high level of correlation between wind speed and winter peak loading periods makes the ski resort application potentially very attractive for wind power. The second case study selected was also a recreational area, located in southern Vermont. Eleven 550 kW (6.05 MW) wind turbines were modeled. The case study added several new dimensions not found in the first case study. The participant is served by 12.47 kV distribution facilities served from 69 kV transmission facilities. In addition, there is other existing generation (hydro and wind) connected to the transmission system and the same electrical system model used for this analysis can also be used to look at expanding the existing wind farm at little additional cost. Detailed data (load, electric line length/wire type/impedance, transformer nameplates, etc.) was collected from each case study site owner and its distribution company. Steady-state and transient analysis was conducted for the integration of 12 MW of wind power in the electric distribution network. Both recreational resorts have various motor loads such as snow-blowers, pumps and chair lifts, with a variety of resistive loads distributed along the distribution lines. The major findings from the case studies are:
• Wind generation provides significant benefits to the distribution system in steady state conditions. The benefits include an improved voltage profile and reduced energy losses from supplying load locally when wind is present.
• The wind turbines did not have a significant effect on the stability of the system for
strong wind gusts (+/- 5 meters per second), faults or full-to-no generation events. When,
Analysis of Wind-Hydro Integration Value in Vermont
Princeton Energy Resources International 11 WINDPOWER 2003
after fault clearing, an instability is observed, its cause is directly related to the low inertia constant of the motor load, not the wind turbines.
• Wind generation costs are lower than retail energy rates from Vermont distribution
companies. This allows the consumer to reduce its overall power costs with self-generation.
• Wind generation cannot by itself defer the need for infrastructure improvements in
constrained areas. Wind needs to be matched with other complementary generation (i.e., storage, hydro or diesel), interruptible load stragtegies, and/or aggressive demand side management to be able to defer infrastructure improvements.
ACKNOWLEDGEMENTS This work was sponsored by the U.S. Department of Energy under project number FG01-00EE10762, a cost sharing project with Green Mountain Power Corporation and the Public Service Department of the State of Vermont. The results and views expressed in this paper are those of the authors alone and do not necessarily reflect those of the United States Government or any agency thereof. John Zimmerman and Martha Staskus, of Vermont Environmental Research Associates (VERA), developed the wind resource and supply curve data for this study. Craig Myotte and his staff at E/PRO Engineering and Environmental Consulting, LLC, provided engineering expertise and project management and liaison services. Jean Lemay and Richard Gagnon, of IREQ, lead the analysis for the distributed generation case studies, with assistance from Craig Myotte. REFERENCES
1. Princeton Energy Resources International, Vermont Environmental Research Associates, “Wind and Biomass Integration Scenarios in Vermont, Summary of First Phase Research: Wind Energy Resource Analysis,” Prepared under DOE project number DE-FG01-00EE10762, March 2002. Available for download at www.perihq.com.
2. Gaëtan Lafrance INRS University of Québec, Stéphane Krau, Bernard Saulnier, Hydro Québec Research Institute (IREQ), “Assessment of the Impact of Wind Power Penetration on the Vermon Electricity Grid,” Technical Reference 1 of 3, under contract to Green Mountain Power Corporation, Vermont, a cost sharing contribution to U.S. Department of Energy project number DOE DE-00EE10722 “Wind and Biomass Integration Scenarios in Vermont,” December, 2002.
3. Bernard Saulnier, Stéphane Krau, Richard Gagnon, Hydro-Québec Research Institute (IREQ), Gaétan Lafrance, INRS, Varennes, Energy management and grid stability aspects of Wind energy integration in the Power Market,” CANWEA 2002 Conference, Halifax, N.S., October 20-23, 2002.
4. Richard Gagnon, Jean Lemay, Hydro-Québec Research Institute (IREQ), “Assessment of the Impact of Wind Power Penetration on the Vermon Electricity Grid,” Technical Reference 2 of 3, under contract to Green Mountain Power Corporation, Vermont, a cost sharing contribution to U.S. Department of Energy
Analysis of Wind-Hydro Integration Value in Vermont
Princeton Energy Resources International 12 WINDPOWER 2003
project number DOE DE-00EE10722 “Wind and Biomass Integration Scenarios in Vermont,” December, 2002.