ANALYSIS ON INFLUENCING FACTORS TOWARD CUSTOMER LOYALTY (A CASE STUDY OF APPLE PRODUCTS) By Syarifah Ade Mutia ID no. 014201000009 A Skripsi presented to the Faculty of Business President University in partial fulfillment of the requirements for Bachelor Degree in Economics Major of Management January 2014
Transcript
ANALYSIS ON INFLUENCING FACTORS TOWARD
CUSTOMER LOYALTY
(A CASE STUDY OF APPLE PRODUCTS)
By
Syarifah Ade Mutia
ID no. 014201000009
A Skripsi presented to the
Faculty of Business President University
in partial fulfillment of the requirements for Bachelor Degree in Economics Major of Management
January 2014
i
SKRIPSI ADVISER RECOMMENDATION LETTER
This skripsi entitled “ANALYSIS ON INFLUENCING FACTORS
TOWARD CUSTOMER LOYALTY (A CASE STUDY OF
APPLE PRODUCTS)” prepared and submitted by Syarifah Ade
Mutia in partial fulfillment of the requirements for the degree of
bachelor in the Faculty of Business has been reviewed and found to
have satisfied the requirements for a skripsi fit to be examined. I
therefore recommend this skripsi for Oral Defense.
Cikarang, Indonesia, January 27, 2014
Acknowledged by, Recommended by,
Vinsensius Jajat K., MBA Vinsensius Jajat K., MBA
Head of Management Study Program Skripsi Adviser
ii
DECLARATION OF ORIGINALITY
I declare that this skripsi, entitled “ANALYSIS ON
INFLUENCING FACTORS TOWARD CUSTOMER LOYALTY
(A CASE STUDY OF APPLE PRODUCTS)” is, to the best of my
knowledge and beliefs, an original piece of work that has not been
submitted, either in a whole or in a part, to another university to
obtain a degree.
Cikarang, Indonesia, January 27, 2014
SYARIFAH ADE MUTIA
iii
PANEL OF EXAMINERS APPROVAL SHEET
The Panel of Examiners declares that the skripsi entitled
“ANALYSIS ON INFLUENCING FACTORS TOWARD
CUSTOMER LOYALTY (A CASE STUDY OF APPLE
PRODUCTS)” that was submitted by Syarifah Ade Mutia majoring
in Management from the Faculty of Business was assessed and
approved to have passed the Oral Examinations on February 19, 2014.
Dra. Genoveva, M.M.
Chair – Panel of Examiners
T. Manivasugen, MBA
Examiner 1
V. Jajat Kristanto, MBA
Examiner 2
iv
ABSTRACT
This research is focusing on assessing the influencing factors of several independent variables such as Marketing Mix elements (4P), Brand Image, and Customer Satisfaction toward Customer Loyalty as the dependent variable, limited to Indonesia online based community of Apple users. The data collected were from 98 respondents using Slovin formula, and simple random sampling method was used in the distribution of questionnaire, and is in Likert-scale type. Quantitative analysis including validity and reliability test, classic assumption test, and multiple regression were conducted in this research to test the appropriate hypothesis through T-test, F-test, and Coefficient Determination (R square). Results of the analysis found that from the six factors, price, product, place, promotion, brand image, and customer satisfaction, there are three variables that were proven have negative significant influence toward customer loyalty. The other three variables were proven has positive influence, such as price as the most influential variable, also customer satisfaction, and brand image did influence customer loyalty. Furthermore, the F-test has shown that the independent variables together have significant correlation to dependent variable, supported by R square value which accounted for 75.7% of how much the dependent variable can be explained by the independent variables. Keywords: Marketing Mix, Brand Image, Customer Satisfaction, Customer Loyalty
v
ACKNOWLEDGEMENT
“The Originator of the heavens and the earth. When He decrees a matter, He only
says to it: “Be!_and it is.” (QS 2:117)
First of all, the researcher would like to praises Allah SWT for all the never end
blessings, and guidence for all the process of finishing this thesis. And the
opportunity of this given time to finally met the ending of this university life.
Through this opportunity, the researcher would like to express her gratitude to the
following imperative persons which have been very valuable to the researcher’s
life and journey:
1) The very first to mention is the researcher parent and family, the all time
love, the father in earth and heaven, Said Rachmatna, and a lovely mother
Yayah Puntiawati, for all the prayers, the wonderful caring, and the
supportive actions that always strengthen the researcher when she was at
her lowest. And for the greatest family of the researcher’s own, the twins
Syarifah Rahmi Azizi and Syarifah Nurul Azizi that the researcher cared
the most. Also a brother and his family, Said Tiar Purnama and Devi
Linda Kartini, and the source of smile and laugh, the researcher’s niece
and nephew, Cut Adja Sabrina, and Said Nazmi Azka. No other words can
describe how thankful she is for having a great family like them.
2) The researcher would also like to express the grateful feelings and
apreciation over the completion of this thesis to all those who already
gave cooperation, support, guidance, and encouragement that make the
completion of this skripsi achieved. Mr. Orlando R. Santos, MBA,
Mr.Vinsensius Jajat K., MM, MBA. Not to mention the words of thank
you very much also given for the honorable examiners Mam Genoveva,
MM, and Mam Filda Rahmiati.
vi
3) The researcher’s appreciation for all the best colleges for over three and a
half year, Lauransia Oktaviany, Dwini Rahmadina, Fabiola Nola, Grece
Situmorang, Lystia, Edwin Cinwang Rinaldy, Mohammad Syarif, Noni
Trisnawati, Joudy Marsya, Sherly Silvia, Kevin Adisya, Nurinda
Table 4.3: Descriptive Analysis of Product (𝑿𝟐) 59
Table 4.4: Descriptive Analysis of Place (𝑿𝟑) 60
Table 4.5: Descriptive Analysis of Promotion (𝑿𝟒) 61
Table 4.6: Descriptive Analysis of Brand Image (𝑿𝟓) 62
Table 4.7: Descriptive Analysis of Customer Satisfaction (𝑿𝟔) 63
Table 4.8: Descriptive Analysis of Customer Loyalty (𝒀𝟏) 64
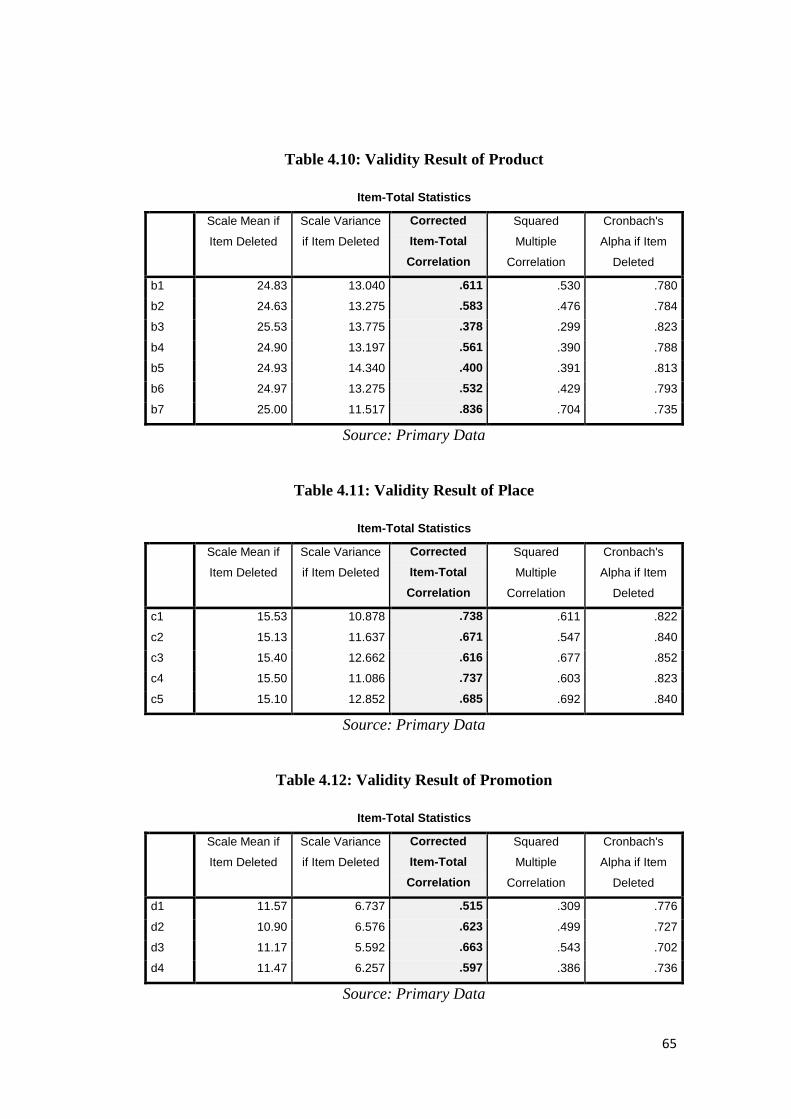
Table 4.9: Validity Result of Price 65
Table 4.10: Validity Result of Product 66
Table 4.11: Validity Result of Place 66
Table 4.12: Validity Result of Promotion 66
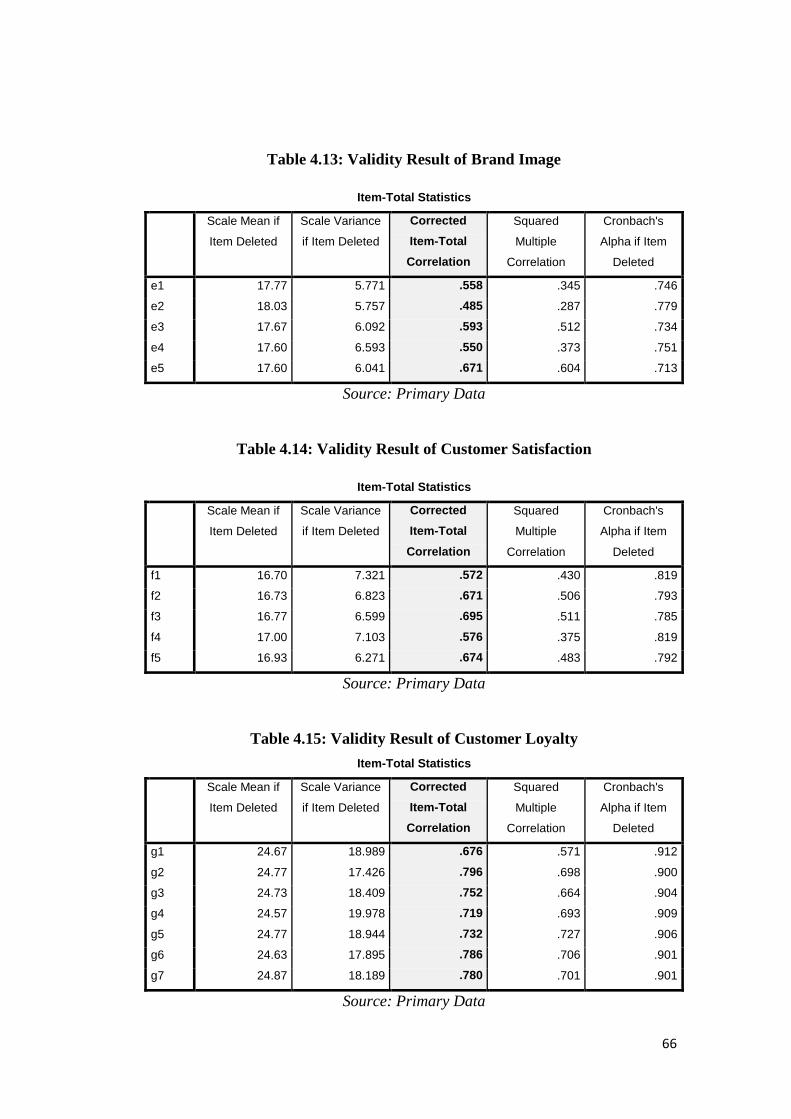
Table 4.13: Validity Result of Brand Image 67
Table 4.14: Validity Result of Customer Satisfaction 67
Table 4.15: Validity Result of Customer Loyalty 67
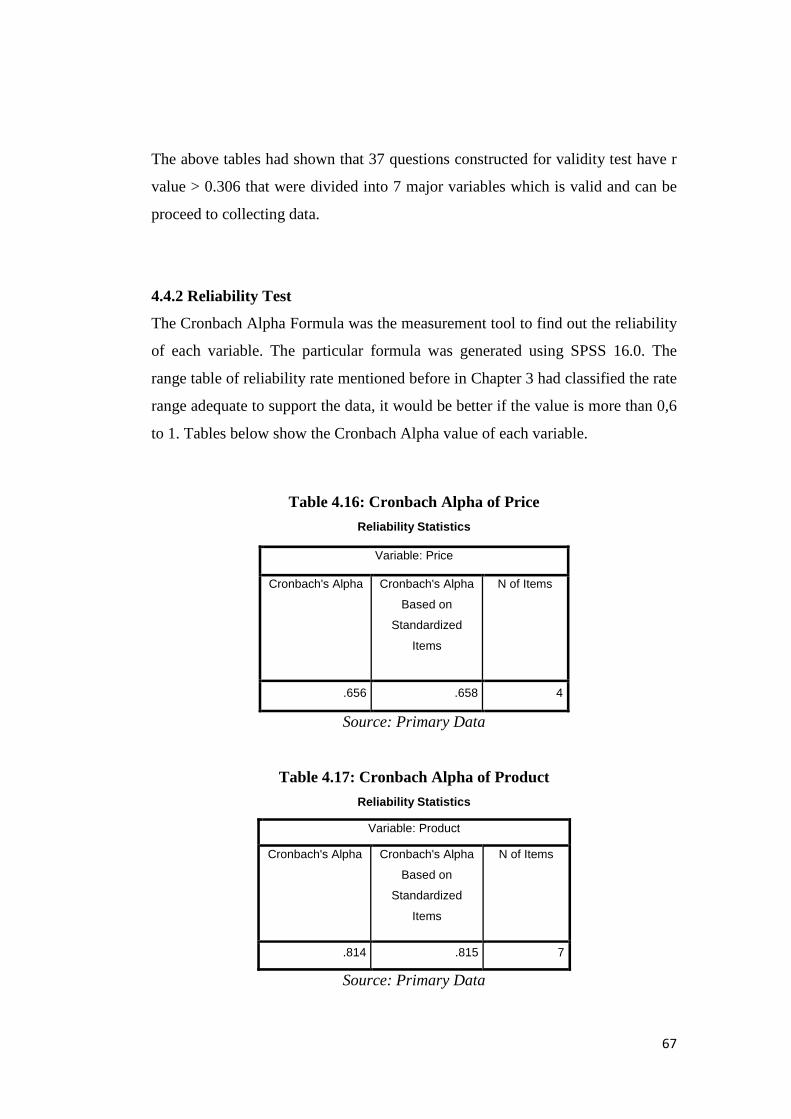
Table 4.16: Cronbach Alpha of Price 68
Table 4.17: Cronbach Alpha of Product 68
Table 4.18: Cronbach Alpha of Place 69
Table 4.19: Cronbach Alpha of Promotion 69
xii
Table 4.20: Cronbach Alpha of Brand Image 69
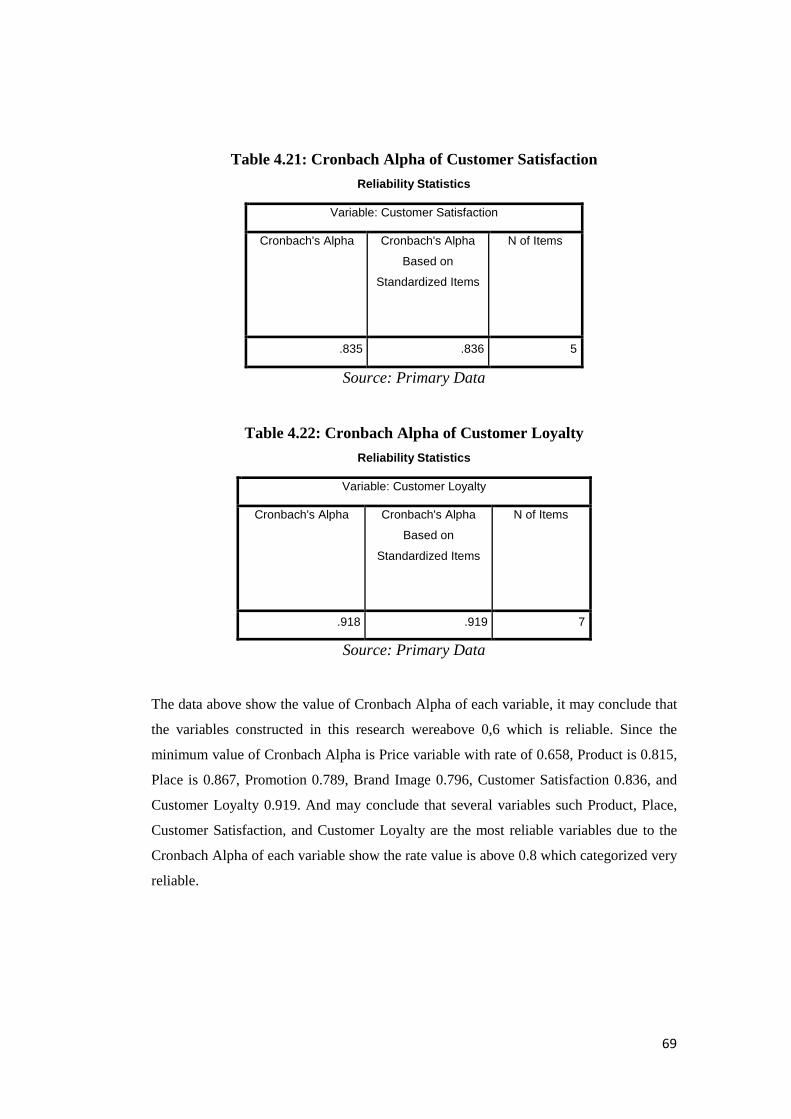
Table 4.21: Cronbach Alpha of Customer Satisfaction 70
Table 4.22: Cronbach Alpha of Customer Loyalty 70
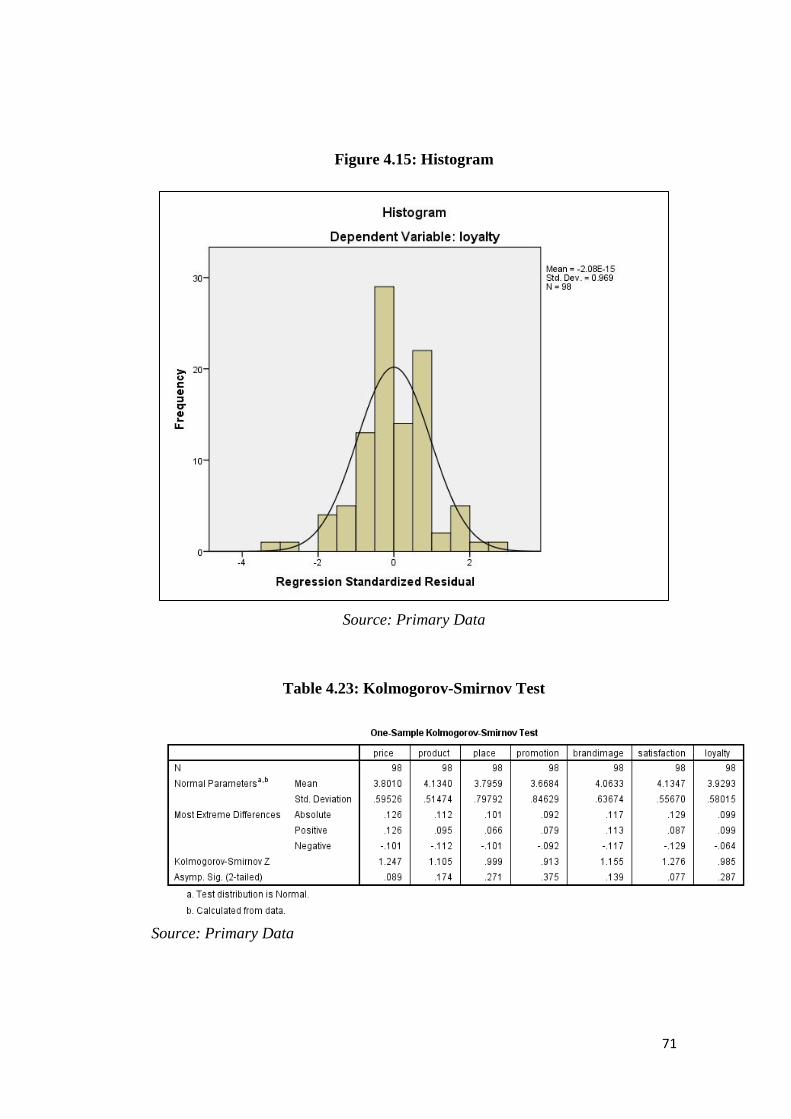
Table 4.23: Kolmogrov-Smirnof Test 72
Table 4.24: Multi-collinearity Test 73
Table 4.25: Autocorrelation Test 74
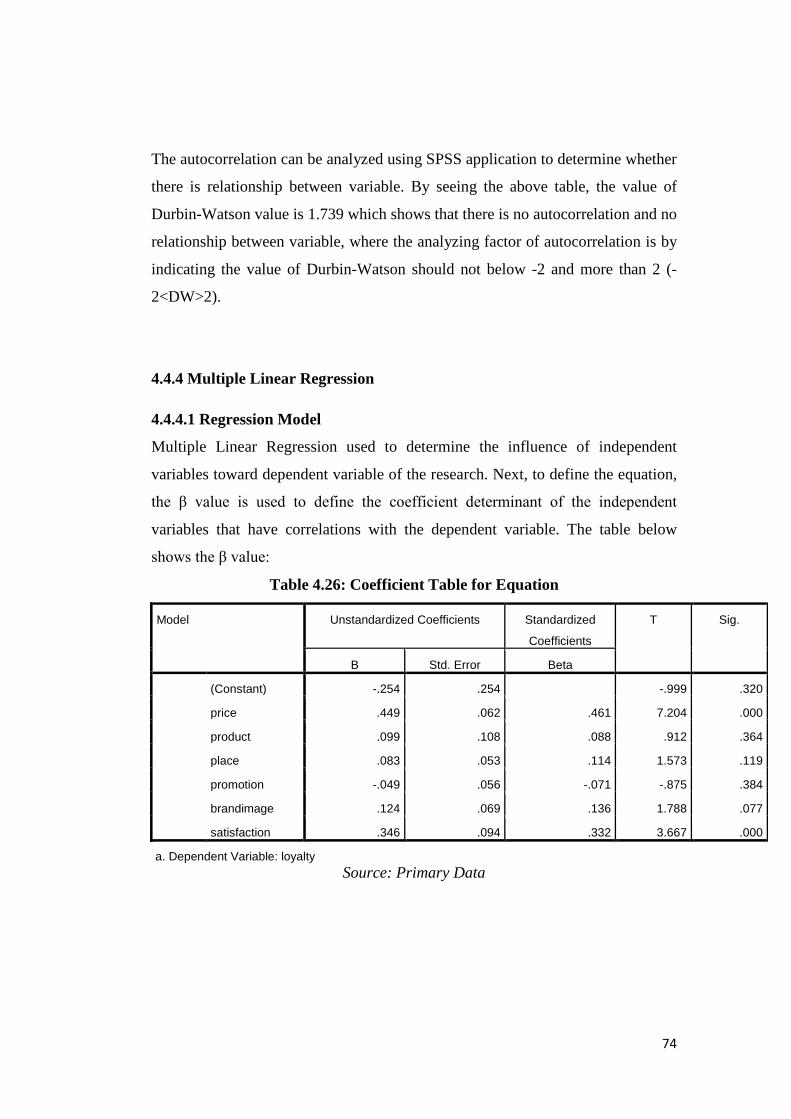
Table 4.26: Coefficient Table for Equation 75
Table 4.27: Analysis of R Value 77
Table 4.28: Anova 77
Table 4.29: t Test value 79
xiii
LIST OF FIGURES
Figure 1.1: Smartphone Market Share 3
Figure 1.2: Operating System 2010-2013 4
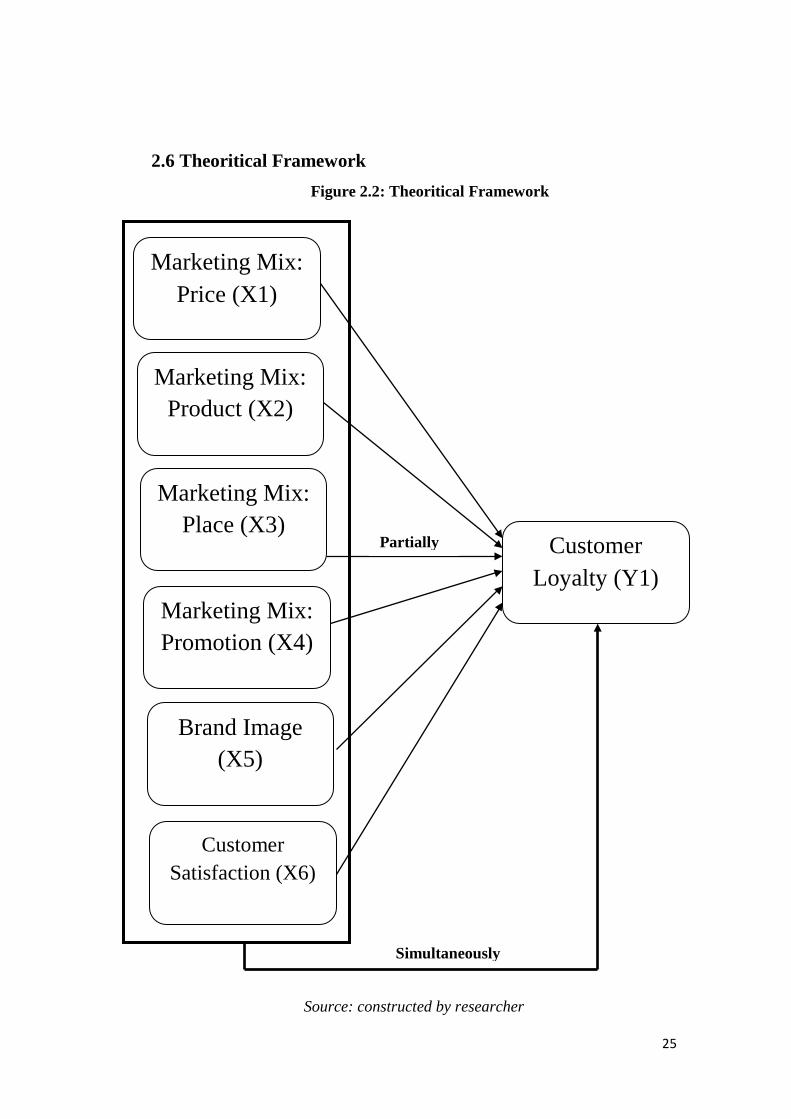
Figure 2.1: Possible value proposition 16
Figure 2.2: Theoritical Framework 25
Figure 3.1: Research Framework 34
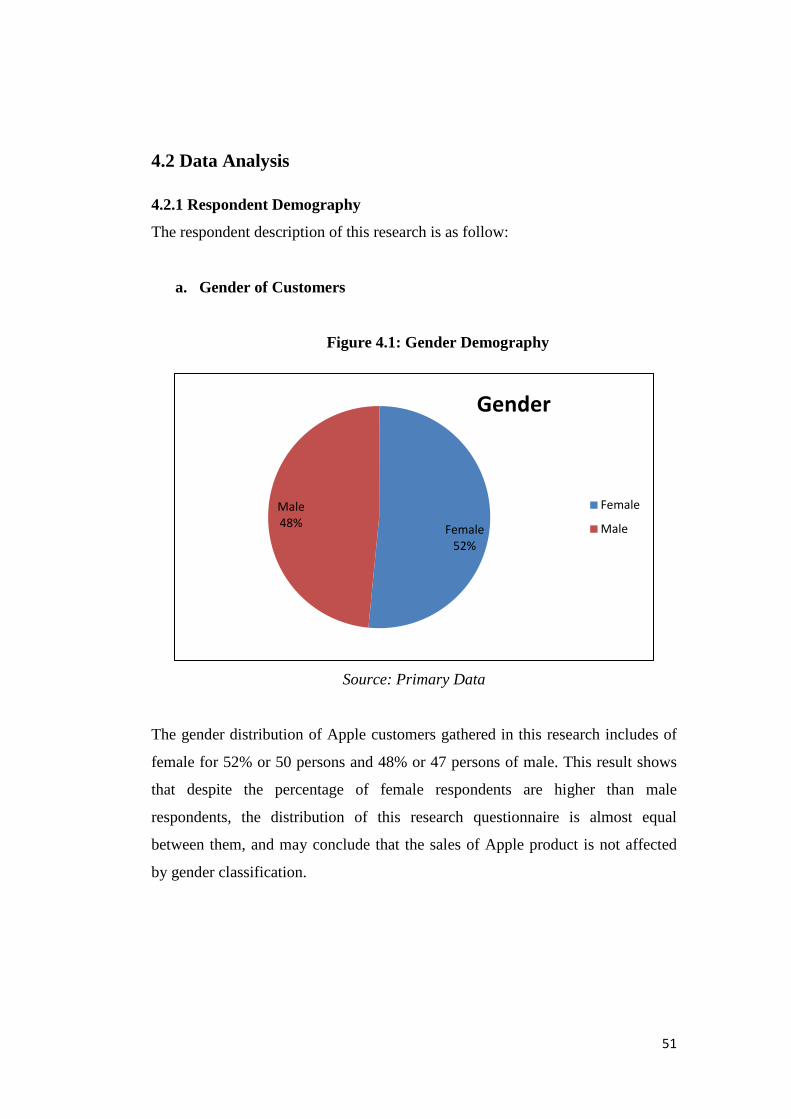
Figure 4.1: Gender Demography 52
Figure 4.2: Age Demography 53
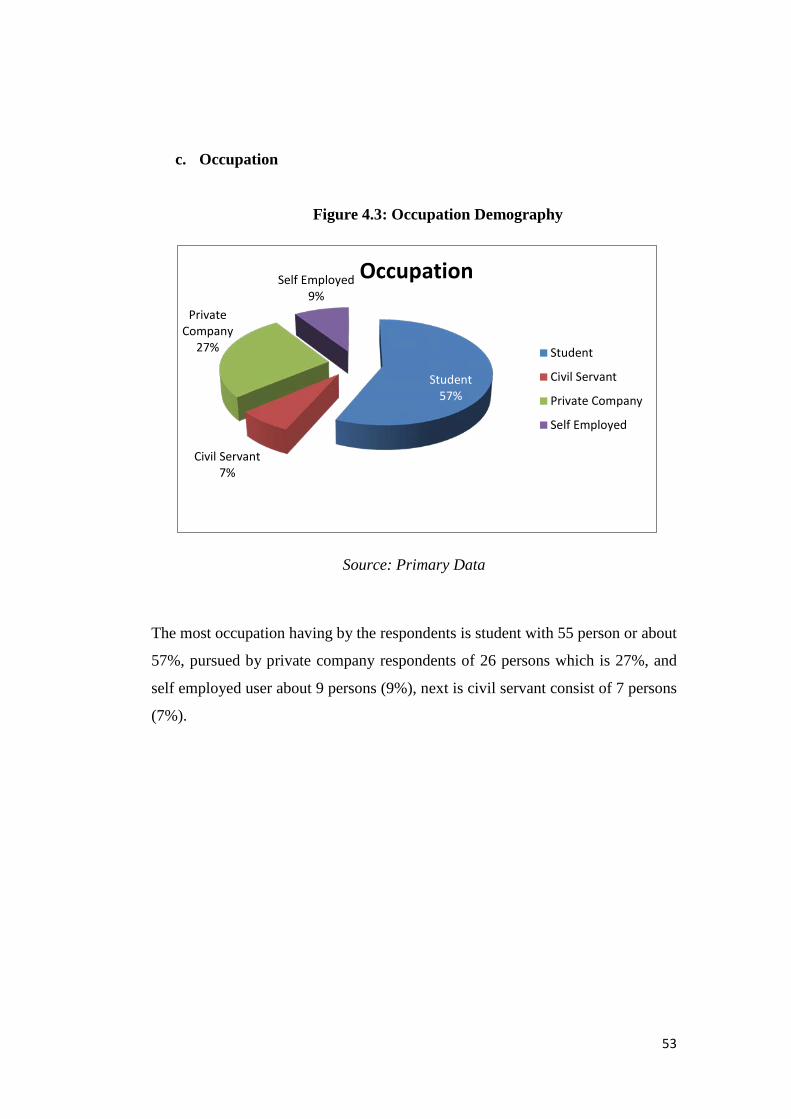
Figure 4.3: Occupation Demography 54
Figure 4.4: Income Demography 55
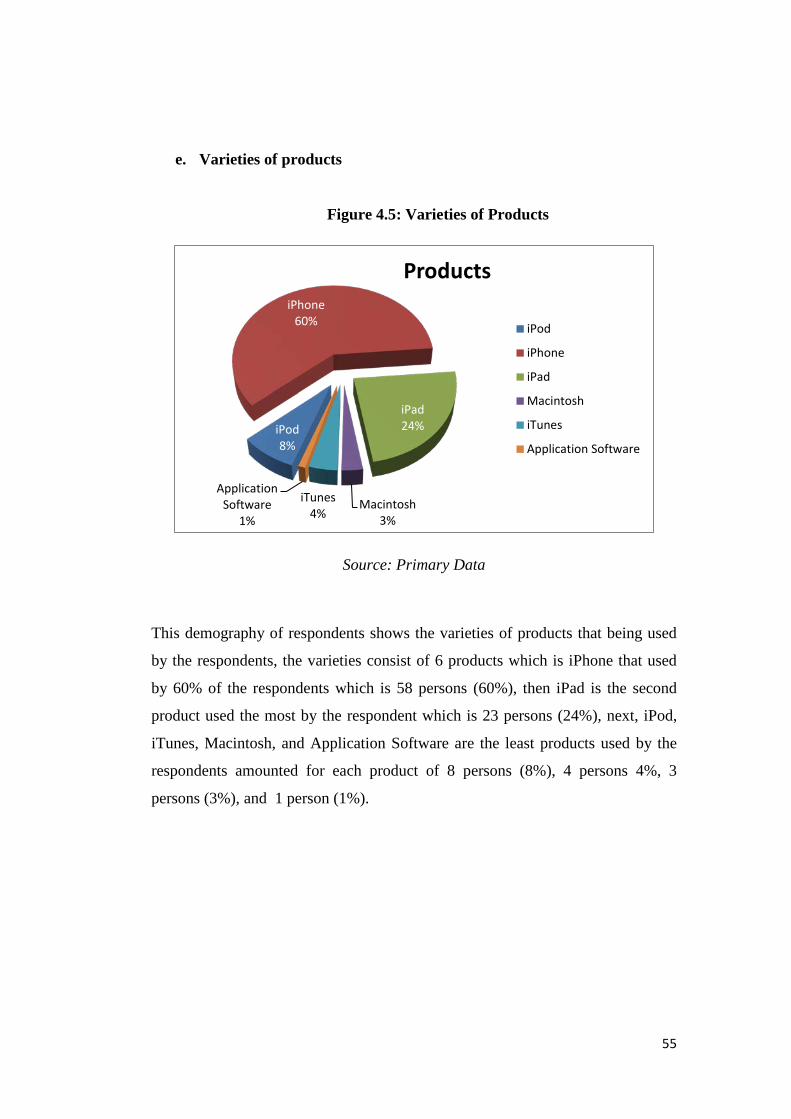
Figure 4.5: Varieties of Products 56
Figure 4.6: Years of Using 57
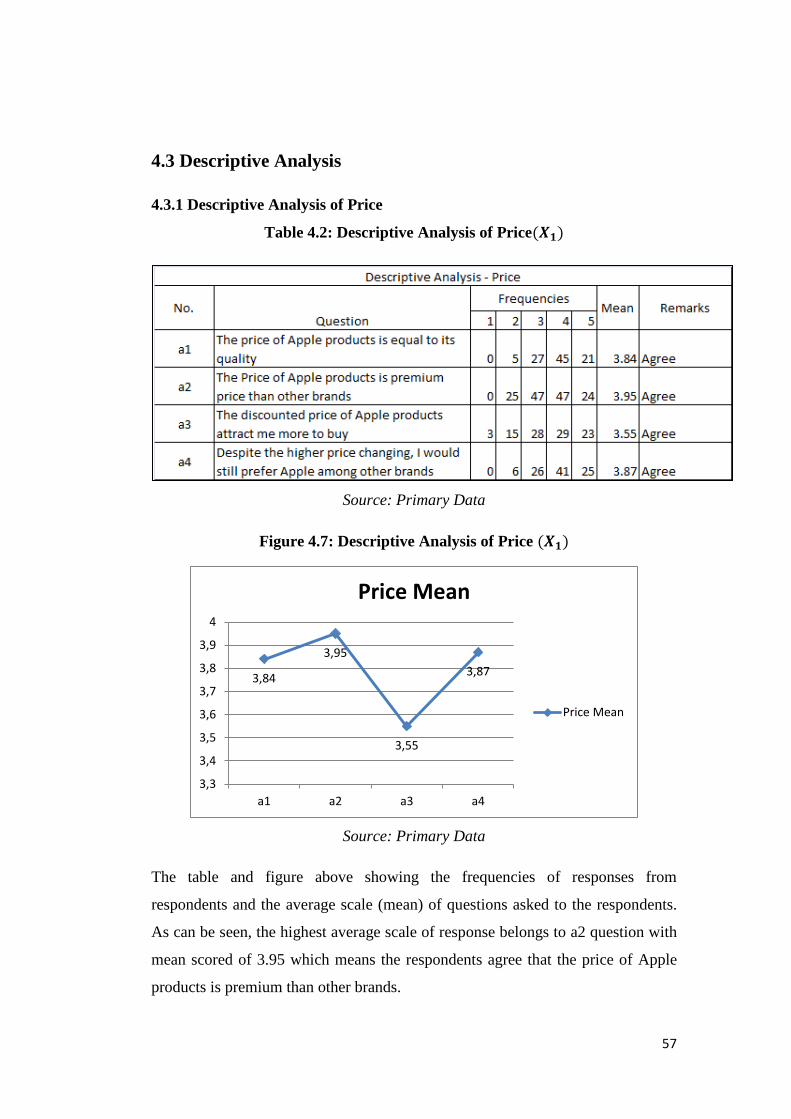
Figure 4.7: Descriptive Analysis of Price (𝑿𝟏) 58
Figure 4.8: Descriptive Analysis of Product (𝑿𝟐) 59
Figure 4.9: Descriptive Analysis of Place (𝑿𝟑) 60
Figure 4.10: Descriptive Analysis of Promotion (𝑿𝟒) 61
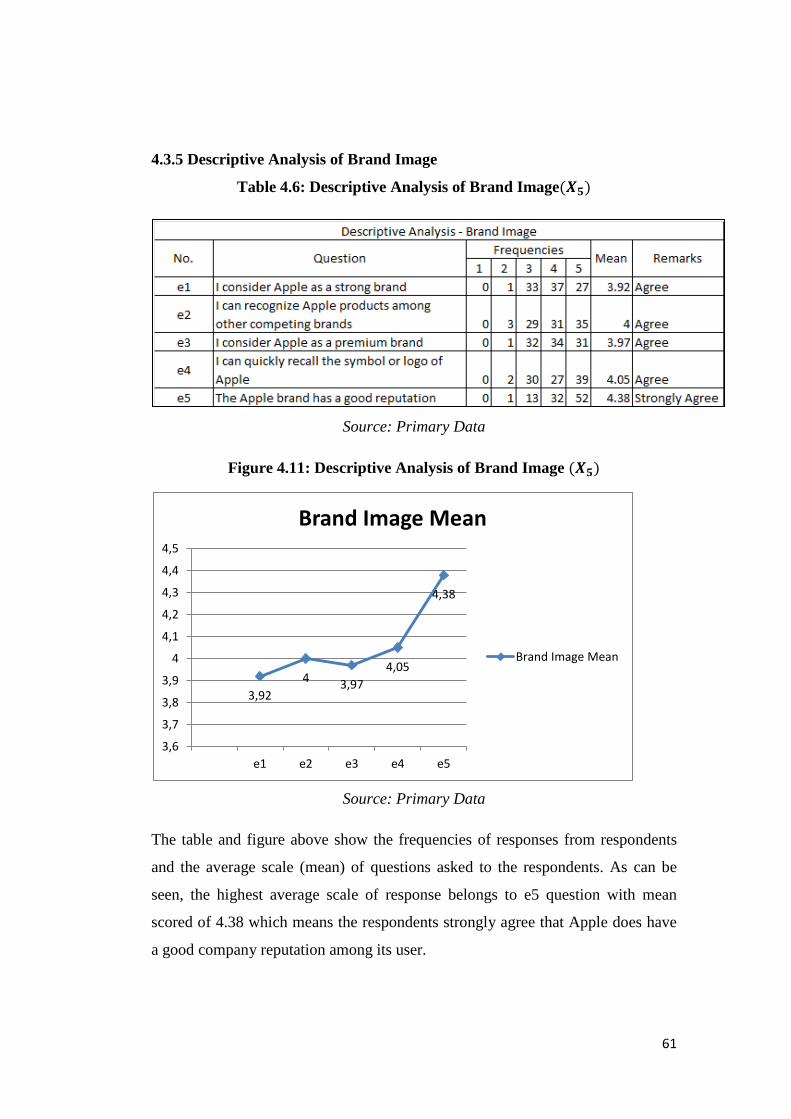
Figure 4.11: Descriptive Analysis of Brand Image (𝑿𝟓) 62
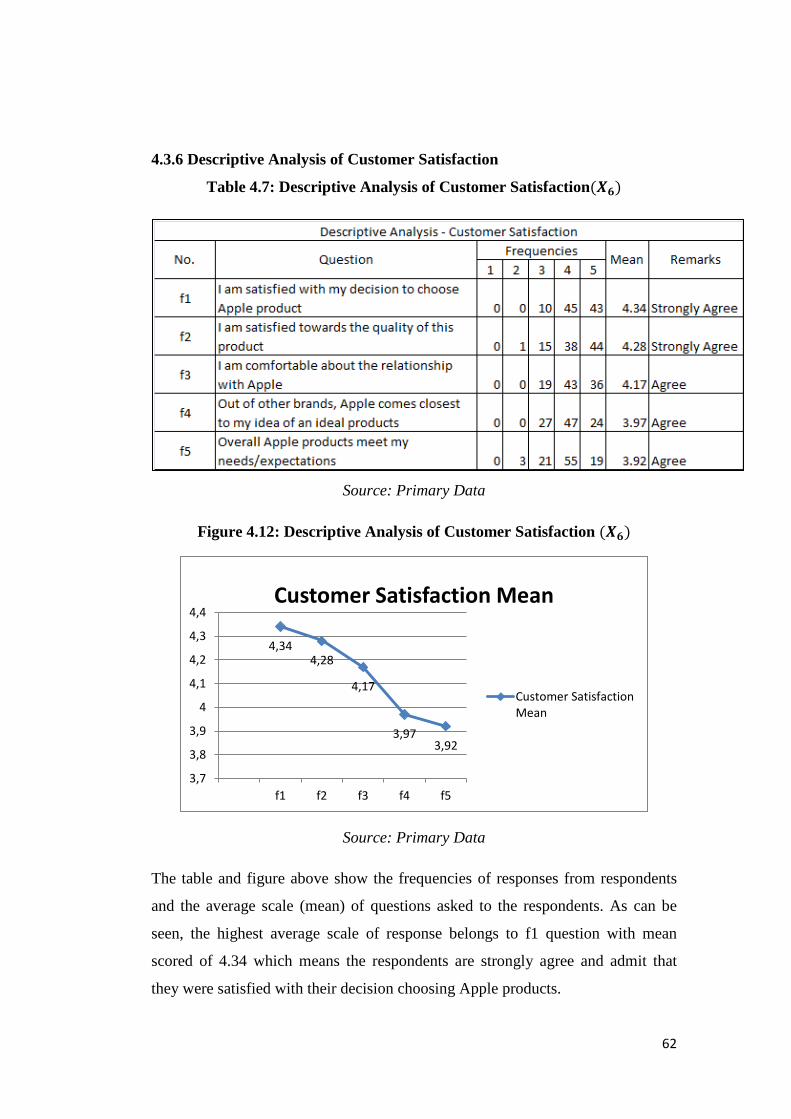
Figure 4.12: Descriptive Analysis of Customer Satisfaction (𝑿𝟔) 63
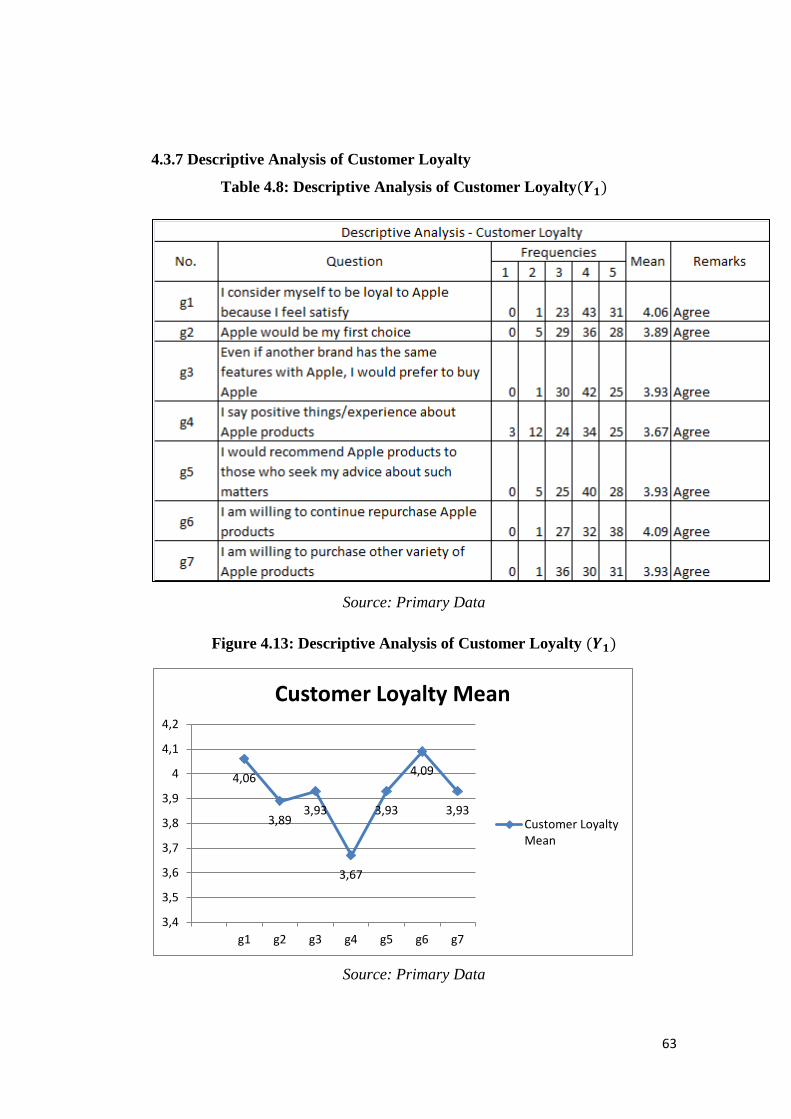
Figure 4.13: Descriptive Analysis of Customer Loyalty (𝒀𝟏) 64
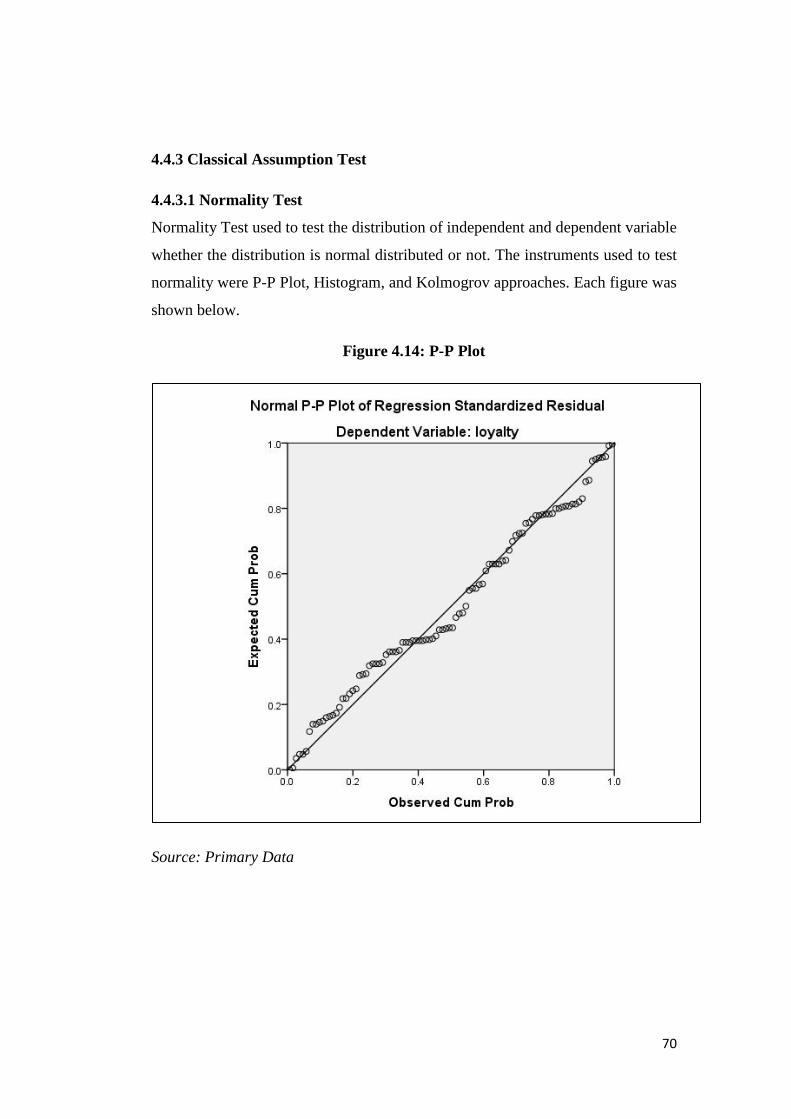
Figure 4.14: P-P Plot 71
Figure 4.15: Histogram 72
Figure 4.16: Heteroscedasticity Test 74
1
CHAPTER I
I. INTRODUCTION After the death of Apple co-founder which is Steve Jobs, have made the
shareholders of its company worried about the business run by this company, not
to mention the declining market share of this company, also the less innovations
given to its customers. Yet, the high demand of several varieties of Apple
products disclosed the high level of loyalty from its customer.
As the time goes by, with so many choices offered by gadget producer, it now
become a complicated process that needs a deep knowledge of the product
technology itself, involving the knowledge of brand image, available features,
price setting, package plans and many more. But with a little priming, anybody
can do a smart decision on choosing their final option of device. This is why
company needs to keep their customer attract with their product and maintain a
good quality and service until loyalty is one big factor that bound customer and
the company.
Customer loyalty nowadays is one of important aspect to the business growth,
since discussed by Reichheld (1999) that the advantages of customer loyalty to
the service provider, in terms of continuous profit, reducing marketing cost,
increasing per-customer revenue growth and referrals. Thus, such as maintaining
customer loyalty would give advantages to the company, company should have a
high concern on their customer satisfaction to better learn the customer perception
toward their product, and in the end will lead to the loyalty a customer feel about
the products. Thus, the researcher wants to conduct the ANALYSIS OF
INFLUENCING FACTORS TOWARD CUSTOMER LOYALTY (A CASE
STUDY OF APPLE PRODUCTS).
2
1.1 Research Background Based on well developed innovations, there are a lot of changes and futuristic
features that being offered by mobile technology provider, one of the world’s best
technology producer was Apple Inc. and is a great manufacturer of not only
mobile device, but also other entertainment device and a so called Macintosh that
can help ease the working life sector. Steven Jobs had created masterpieces as his
legacy by providing innovations in many aspects of digital tools produced by this
company and lately has become the pioneer of the device expansion.
The idea of innovations given in Apple new products was a great idea, until
competitors stop pretending everything is fine, and started to duplicate and
rebuild the products, just like Ipad phenomenon. Ipad was a very first tablet that
created in a minimize computer functions into a lighter, flat, and square device, its
first generation was released on April 2010, and were dominating market share at
that time, for selling 3 million iPad during the first 80 days. Due to the Apple
success with the technology, the other company can see this as an opportunity if
they can create their products as an alternative.
Indeed after Ipad was released, not so long after it, there were so many products
that also implement the same physical characteristics with Ipad, added with some
innovations, also cheaper materials that make competitors can produce cheaper
similar products such as Samsung, Asus, Acer, Toshiba, Motorola and so forth.
Thus, this factor has lead middle-lowered customers to choose some other brands
beside Apple products. Not to mention, the death of the co-founder, since then
Apple has not produced another significant innovations to its products.
And it has been proven as being reported by CNBC on Friday, November 15,
2013, Gartner said that Samsung, which is Apple’s competitor managed to sell
80.357 units of smart phones worldwide during July until September 2013.
Meanwhile, Apple only sold 30.330 handsets of theirs. Samsung is one of the
strongest competitors for Apple. And from last year’s period for Samsung share
in the smart phone market remained unchanged at 32.1 percent, meanwhile,
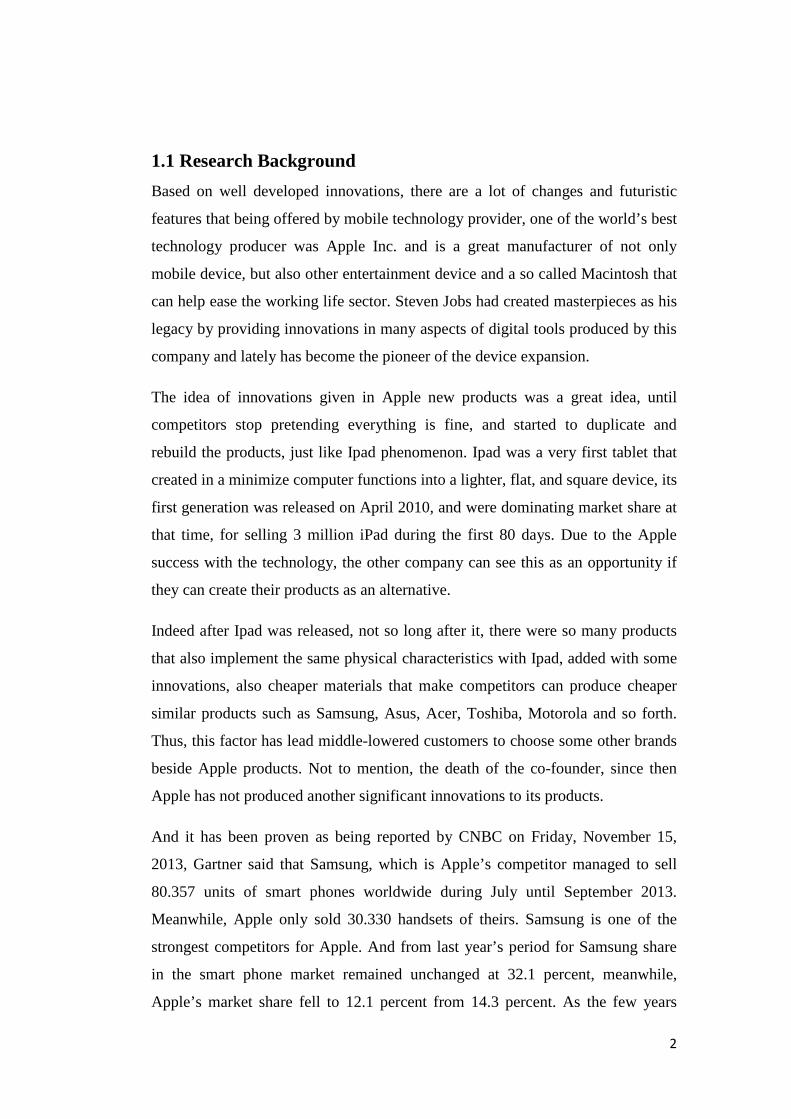
Apple’s market share fell to 12.1 percent from 14.3 percent. As the few years
3
before, Apple keep experienced the falling amount of market share as cited by
IDC data, the previous share of Apple have fallen from 18.8% to 16.9% disclosed
by the table below,
Figure 1.1: Smartphone market share
Source: IDC data
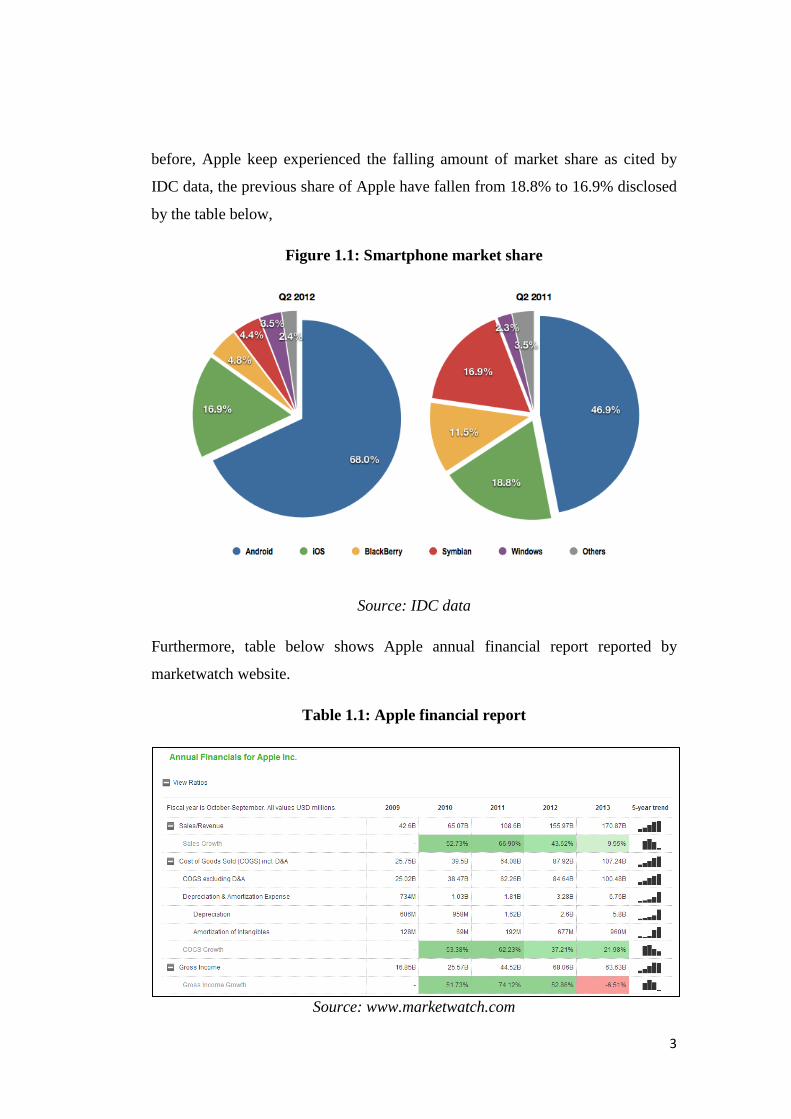
Furthermore, table below shows Apple annual financial report reported by
marketwatch website.
Table 1.1: Apple financial report
Source: www.marketwatch.com
4
The table 1.2 above disclose the downturn ratio of gross income in financial year
of 2012 to 2013, despite the rising of revenue amount, Apple should worry about
the decreasing of its gross income, according to Carasco (2010), gross income is
how much the company makes before taxes, this is an important amount when
analyzing a company, this amount is a company’s revenue minus cost of goods
sold, this indicating of how efficient a company is in managing labor and supplies
in the production process.
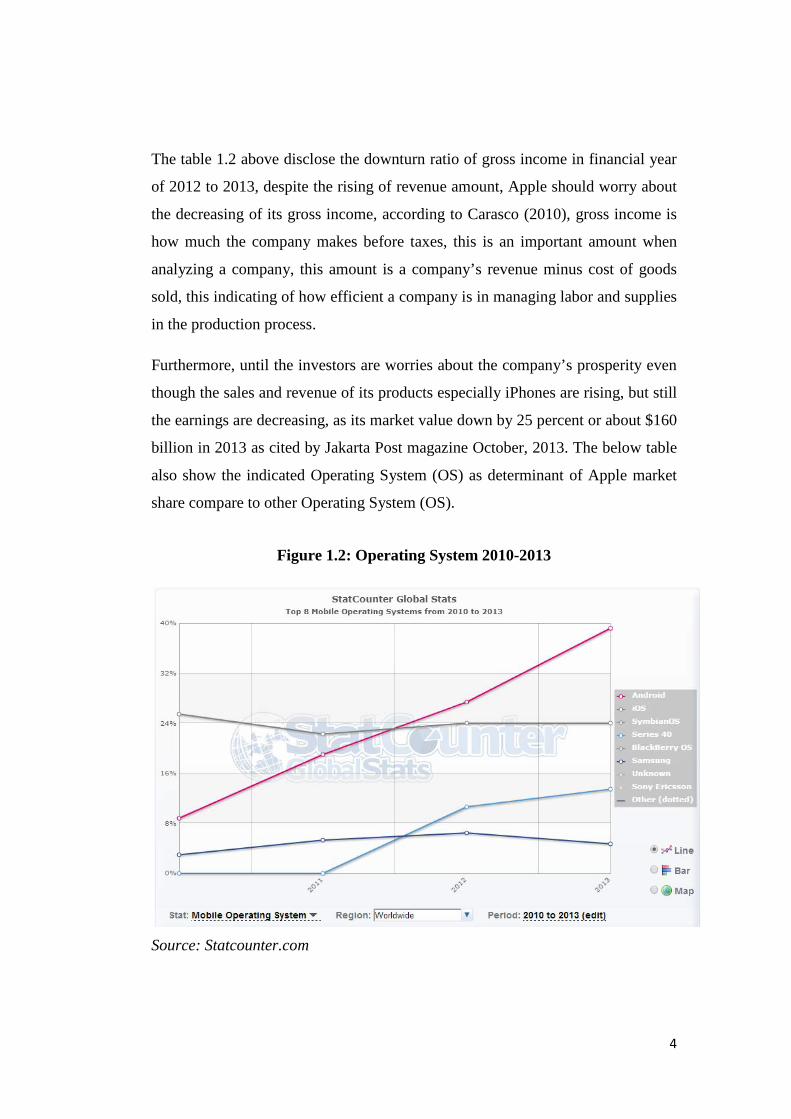
Furthermore, until the investors are worries about the company’s prosperity even
though the sales and revenue of its products especially iPhones are rising, but still
the earnings are decreasing, as its market value down by 25 percent or about $160
billion in 2013 as cited by Jakarta Post magazine October, 2013. The below table
also show the indicated Operating System (OS) as determinant of Apple market
share compare to other Operating System (OS).
Figure 1.2: Operating System 2010-2013
Source: Statcounter.com
5
Despite the plunged of iOS user in the worldwide, indicated from the downturn
from 25.48% to 22.29% on 2011, and being beaten by several Operating System
(OS) like Android, Samsung, and Series 40. However, the increasing percentage
in the end of 2011 does not taking back its highest position in early 2011. As
Strategy Analytics Paul Brown said that by creating a powerful brand image,
along with a compelling user experience, Apple has managed to create a high
level of brand loyalty amongst existing users, bizjournal cited. Apple is still the
world’s most valuable company, despite the downturn and a tight competition,
Apple is in a good market positioning, and has a strong loyalty of its customer.
For instance, as cited by BGR.com (2013), despite the Android tablets have led
Apple in market share and Windows based tablets will likely to take off at some
point, Apple do not need to worry and again was showing that the company care
much less in maintaining the market share than the company do in maintaining
high margins in profit. The company instead rise the price to generates its revenue
as IHS researcher Rhoda Alexander explained that hardware profit plays a big
role in Apple’s success, enabling the design, durability and performance
innovations that in turn support Apple’s premium pricing, while other brands
using price cuts as their powerful marketing tool.
In the era of developed technology, and a tight competition in technology market,
measuring and maintaining customer loyalty is a solution to keep collecting
earnings. As the average business loses 10-30 percent of its customer each year,
but they often don’t know which customer they have lost, when they were lost,
why they were lost, or how much sales revenue and profit this customer decay has
cost them (Nigel Hill, Handbook of customer satisfaction and loyalty
measurement 1996).
By the loosing of customer, as has been shown by several research, that
decreasing the retention rate by only a few percentages can have a major impact
on the level of profitability of a company (Reichheld and Sasser 1990). Because
the costs of recruiting new customers are said to be higher than the costs of
retaining customer old customers, and research has found positive relationship
6
between customer loyalty and the organization’s profitability (Christina Nordman
2004). Reducing marketing costs, is definitely one of the benefit of having a loyal
customer (Evans and Laskin 1994; Mittal and Lassar 1998), because there would
be tendencies of a loyal customer to be demanding less time in personal selling, to
be less price sensitive, to spread positive word-of-mouth (e.g. Reichheld and
Sasser 1990; Reichheld 1996; Narayandas 1998), these benefits are a company
treasure that have to be kept in good maintenance.
1.2 Problem identification
Apple has experiencing the downturn since the death of its co-founder Steve Jobs
two years ago. Fortunately, the co-founder has set the image to its product as
premium brand which made them different with another brands. A company
which can differentiate its product to provide superior value to customers through
the lines of product, services, personnel, location or image (Kotler et al 2006) is a
set of act in designing meaningful differences to distinguish the company’s
offering from competitior’s offerings (Kotler 1997, 282), through this
differentiation and brand image, customers may acknowledge a difference even
when competing offers look the same (Armstrong, Kotler, Harker Brennan 2009).
In the end, the aim of this research is to analyze which factor of 4Ps of marketing
mix elements is the most dominant, also brand image, and customer satisfaction
are the variables to be determined in defining the loyalty of Apple customers,
since the main problem is occurwhen competing with the other brands but lack of
innovations has made to the products after the death of Steve jobs, Apple co-
founder and innovators.
7
1.3 Statement of problem
Thus, the research questions of this study are:
a. Is there partial significant influence of the “price” variable towards
customer loyalty?
b. Is there partial significant influence of the “product” variable towards
customer loyalty?
c. Is there partial significant influence of the “place” variable towards
customer loyalty?
d. Is there partial significant influence of the “promotion” variable towards
customer loyalty?
e. Is there partial significant influence of the “brand image/market
positioning” variable towards customer loyalty?
f. Is there partial significant influence of the “customer satisfaction” variable
with customer loyalty?
g. Are there simultan significant influence of “price, product, place,
promotion, brand image, and customer satisfaction” toward customer
loyalty?
1.4 Research Objectives In order to overcome the issue caused by lacking innovations that Apple had
given to its customer after the death of co-founder and the most initiator of
innovations, that can impact to company’s profit and earnings, also the needs to
analyze the factors of several elements in determining the loyalty of Apple
customers, the researcher intend to implement the selected dimensions of
marketing mix as the tools to better know the dominant factors of what makes
people are loyal to Apple products.
8
Thus, the objectives of this research are:
a. To find out partial significant influence of price towards customer loyalty
b. To find out partial significant influence of product towards customer
loyalty
c. To find out partial significant influence of place towards customer loyalty
d. To find out partial significant influence of promotion towards customer
loyalty
e. To find out partial significant influence of brand image/market positioning
towards customer loyalty
f. To find out partial significant influence of customer satisfaction towards
customer loyalty
g. To find out significant influence of price, product, place, promotion, brand
image, and customer satisfaction toward customer loyalty
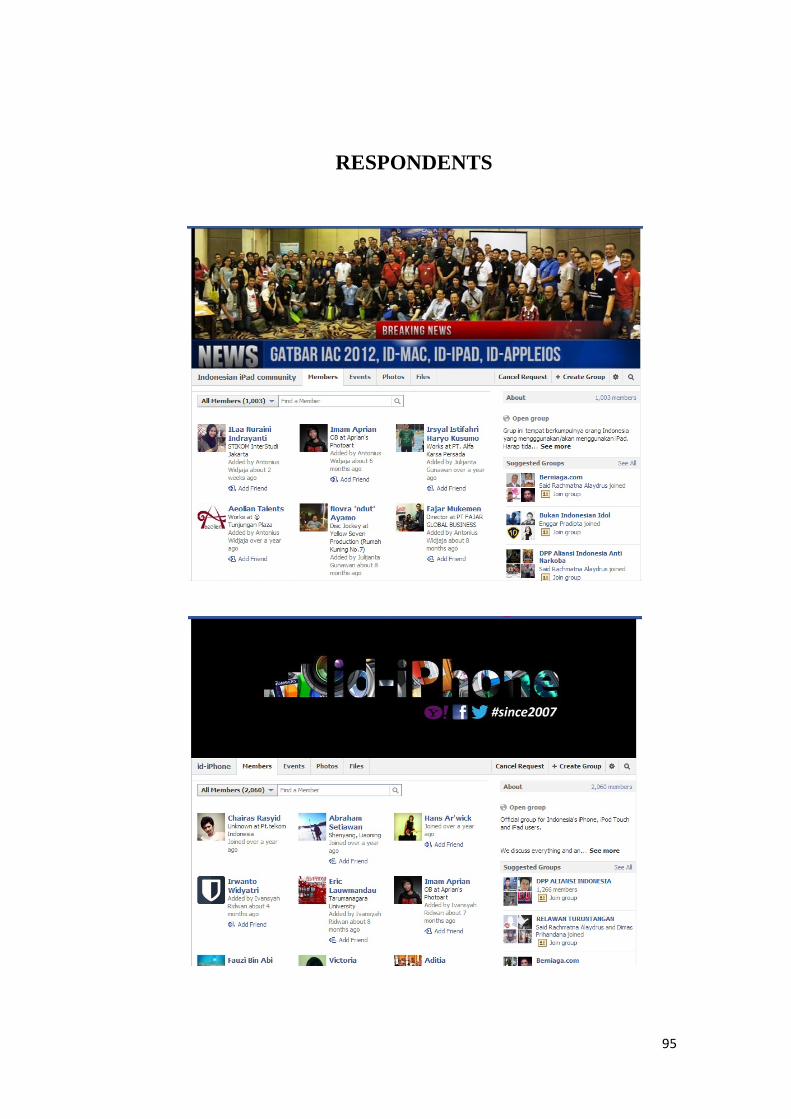
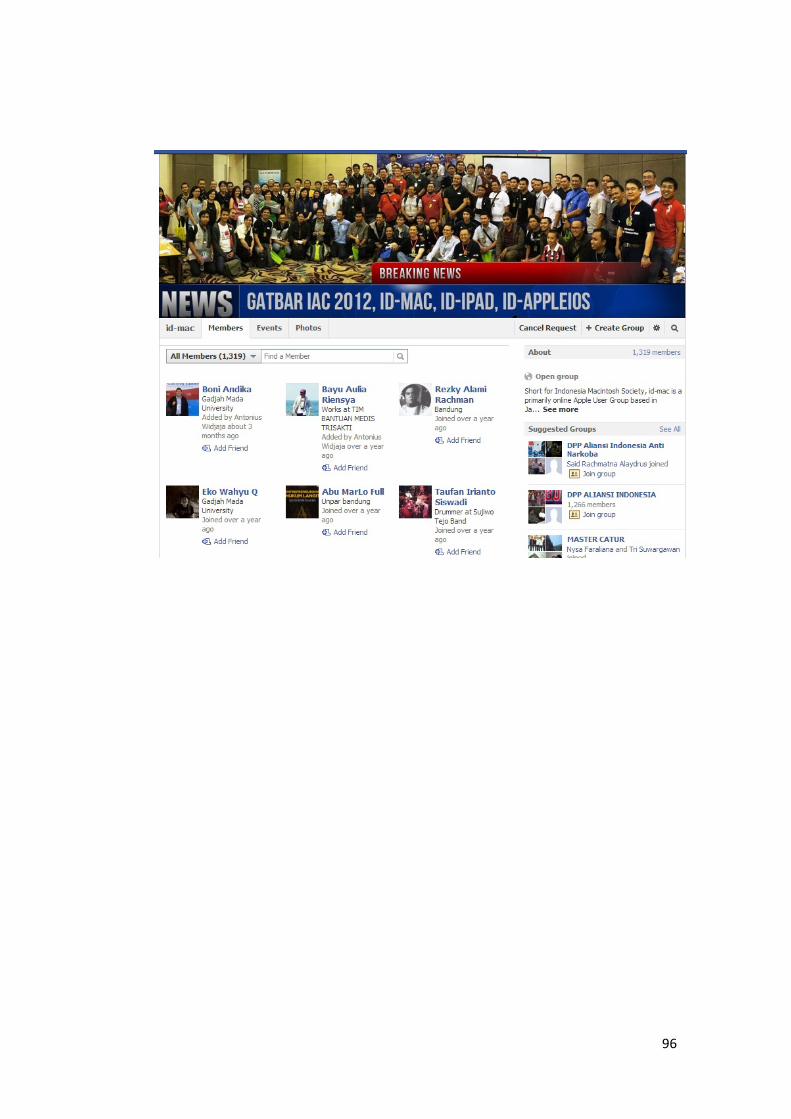
1.5 Research Limitation This study is focused on Apple user who’s also a member of Indonesia Apple
user which divided to several online based communities (via facebook) such as
Indonesia-Mac community, Indonesia-iPad community, Indonesia-iPhone and
iPod community. The particular questionnaires are distributed to 98 members of
Indonesia Apple user community in Indonesia based on their perceptions while
using Apple products. This study will analyze the impact of customer satisfaction
towards customer loyalty.
9
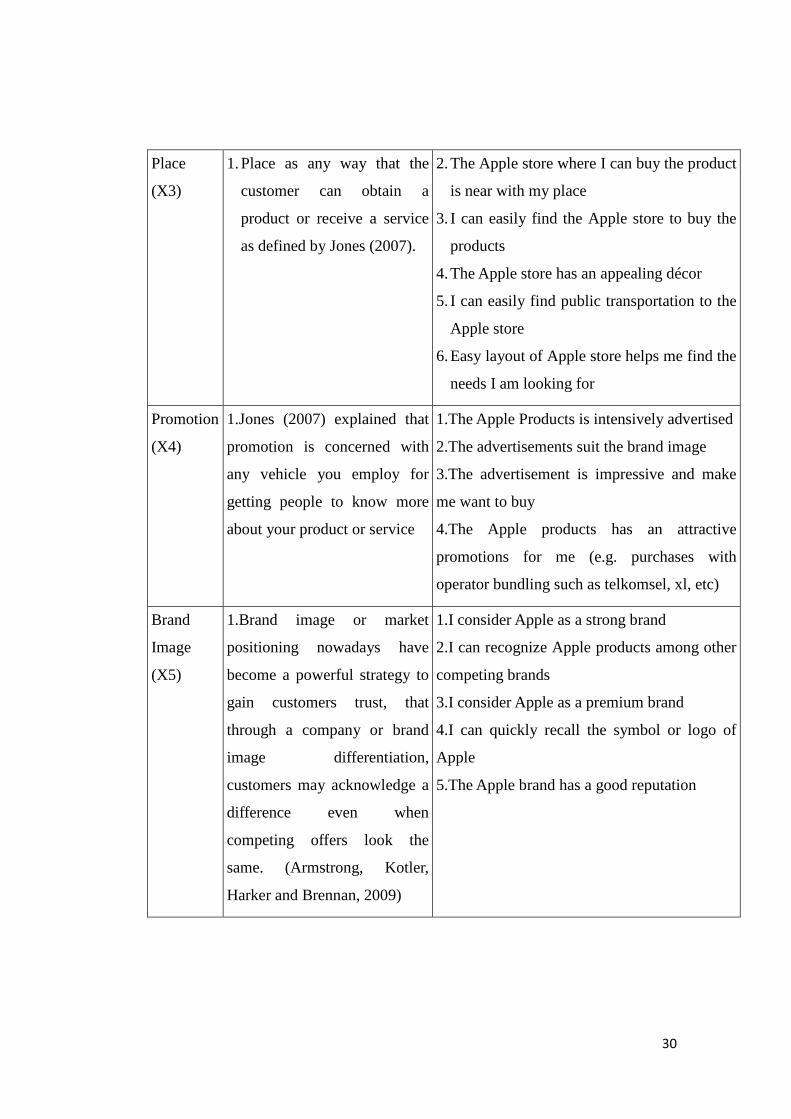
1.6 Definition of Terms a. Brand image a positioning strategy to gain customers trust (Armstrong,
Kotler, Harker and Brennan, 2009)
b. Customer loyalty is positive attitudes of a customer towards brand and
company
c. Customer satisfaction is how customer compares a perceived of
performance of a product and their expectations, customer will get
satisfied if the perceived performance is better than their expectation
(Kotler and Armstrong, 2010)
d. Id-mac is a community consisting of Indonesian Macintosh users.
e. Id-ipad is a community consisting of Indonesian iPad users.
f. Id-iphone is a community consisting of Indonesia iPhone and iPod users.
g. Marketing mix is the set of controllable tactical marketing tools such-
product, price, place, and promotion that the firm blends to produce the
response it wants in the target market (Kotler 2005).
h. Place / distribution defined as any way that the customer can obtain a
product or receive a service (Jones, 2007)
i. Price is the amount of money that people pay in order to get service or
product (Kotler et al. 2008).
j. Product is everything that companies provide for its customer and target
market, it can mean a physical object which customer can see and touch or
it can mean service, ideas, and almost anything (Groonroos, 2005).
k. Promotion explained that promotion is concerned with any vehicle you
employ for getting people to know more about your product or service
(Jones, 2007).
10
1.7 Significance of the Study The importance of this research can give knowledge, information, and suggestion
for particular parties as follows:
a. Customer: To provide review of existing user of their satisfaction level,
and loyalty attitudes toward the brand.
b. Apple: The findings of this research could become reference for Apple in
order to strengthen its factors of marketing mix, also to improve its brand
image and higher its customer satisfaction based on the differences of life
style and culture in Indonesia.
c. Researcher: To find out the significance influence of marketing mix
aspects and brand image of Apple products, and the correlation between
Apple customer satisfaction impact towards its customer loyalty.
d. Future Researcher: The findings of this research could become a reference
to expand the knowledge and information of future researcher who would
do research about Marketing Mix, Brand Image, Customer Satisfaction,
and Customer Loyalty.
e. The University: To add more reference and literature studies in the field of
Marketing Mix, Brand Image, Customer Satisfaction, and Customer
Loyalty.
11
CHAPTER II
II. REVIEW OF LITERATURE
2.1 Marketing Mix Chai Lee Goi (2009) explained in his journal of marketing studies that the
marketing mix term used is first claimed by Borden (1965) and was suggested by
Culliton’s (1984) as “mixer of ingredients” is an executive who sometimes
follows a recipe as he goes along, sometimes adapts a recipe to the ingredients
immediately available, and sometimes experiments with or invents ingredients no
one else has tried.
Borden’s (1965) original marketing mix had a set of 12 elements such as product
planning, pricing, branding, channels of distribution, personal selling, advertising,
promotions, packaging, display, servicing, physical handling and fact finding and
analysis. In the other hand, Frey (1961) suggests that marketing variables should
be divided into two parts, the offering part which is product, packaging, brand,
price and service, the other one is methods and tools which is distribution
channels, personal selling, advertising, sales promotion and publicity.
McCarthy (1964) defined the marketing mix as a combination of all of the factors
at a marketing manager’s command to satisfy the target market. Later, he
separated Borden’s 12 elements to four elements or 4ps, namely product, price,
promotion and place and place, since then, 4P generally known as marketing mix
management paradigm that has dominated marketing. But then there were many
researchers proposed new Ps and elements into marketing mix because they think
the 4P cannot deliver a high degree of satisfaction, and numerous critics has come
from the service marketing area (Rafiq and Ahmed, 1995), later Booms and
Bitner (1981) support that 7P should replace the 4P framework as the generic
marketing mix, added three extra elements include people, process and physical
12
evidence which is good because its more comprehensive but also more
complicated than 4P.
And nowadays, the 4P still remains the most common marketing mix, despite its
limitations and its simplicity, the use of this framework remains strong and is
somehow become fundamental in the marketing mix (kent and Brown, 2006).
Due to its useful when physical products represented a larger portion in economy
(Chee Lee Goi, 2009) while 7P is more detailed and can also be used in
relationship and service marketing (Eeva Rajakallio, 2012).
The main reasons why marketing mix is a powerful concept that makes marketing
seem easy to handle, allows the separation of marketing from other activities of
the firm and delegation of marketing tasks to specialists, and the components of
marketing mix can change a firm’s competitive position said Gronroos (1994),
Chee Lee Goi (2009) cited.
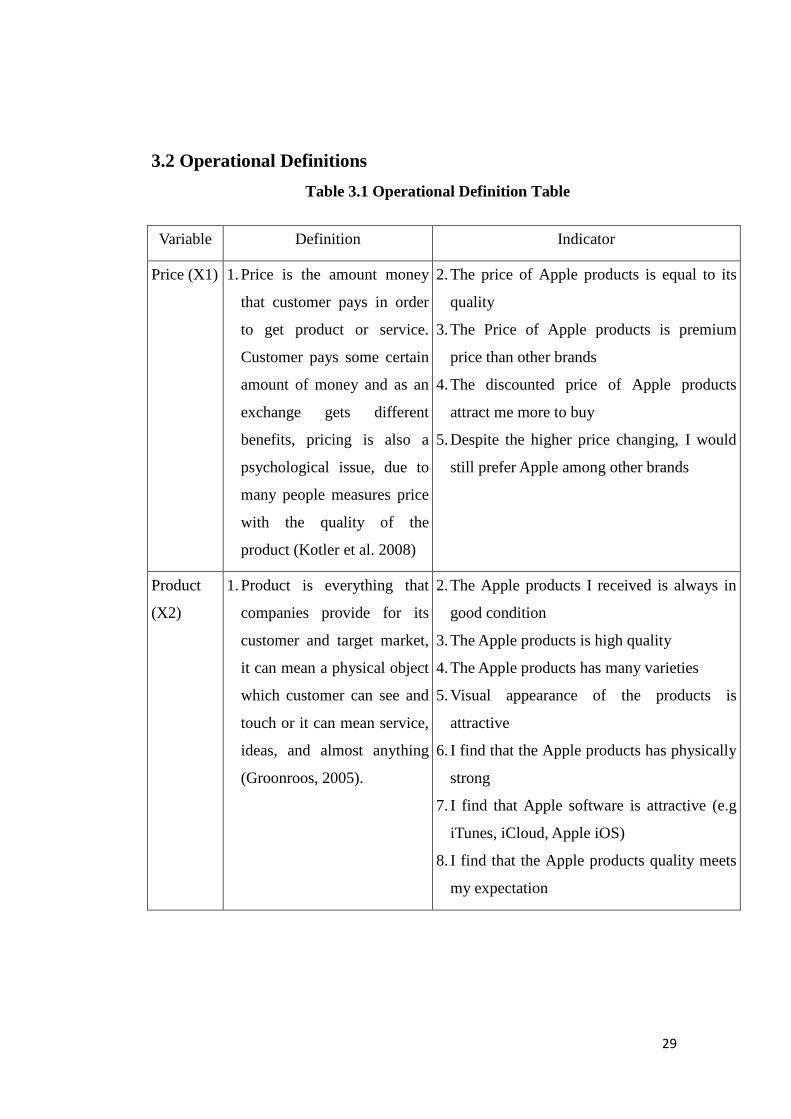
2.1.1 Price
Price is the amount money that customer pays in order to get product or service.
Customer pays some certain amount of money and as an exchange gets different
benefits, pricing is also a psychological issue, due to many people measures price
with the quality of the product (Kotler et al. 2008). Kotler et al (2008) added to
also notice that there are two kinds of costs which is variable costs and fixed cost.
Zeithmal (1998) and Kotler et al (2008) describe that price is the view that
monetary cost is one of the factors that influence consumer’s perception of a
product’s value, it can be started as the actual or rated value of a valuable product
which is up for exchange or as amount of money paid for product.
According to Jones (2007) the price you set for products or services plays a large
role in its marketability. Pricing for products or services that are commonly
available in the market is more elastic, meaning that unit sales will go up or down
more responsively in response to price changes.
13
Kotler et al (2008) in Eeva Rajakallio (2012) previous research had divides
segmented pricing into four categories. Customer-segment pricing means
different prices for different customers. For example, the amusement park tariff is
different in the segmented age, the cheaper tariff for children rather than adult.
Product-form pricing is that different forms of certain product have different
prices, taken pineapple and canned pineapple as an example, which basically,
these are the same products but are different in pricing. Location pricing
determines if the company wants for example charge higher fees from non US-
citizens than from US-citizens. Time pricing is usual form, for example food
seller which will lower their food at the end of the day to avoid loss.
2.1.2 Product
Product is everything that companies provide for its customer and target market,
it can mean a physical object which customer can see and touch or it can mean
service, ideas, and almost anything (Groonroos, 2005). Customers are not buying
only the certain product but there comes so much more with it. Product can be
divided into three different levels which each of them increases the value of
product (Kotler et al. 2008). The first level is core product which is the real
product bought by customer. Next, is the supplementary materials include within
the product such as packaging, brand, and quality. The last level is additional
product including delivery, credit, warranties, and after sales.
2.1.3 Promotion
Jones (2007) explained that promotion is concerned with any vehicle you employ
for getting people to know more about your product or service. Advertising public
relations, point-of-scale displays, and word-of-mouth promotion are all traditional
ways for promoting a product. Promotion can be seen as a way of closing the
information gap between would-be sellers and would-be buyers.
Promotion is a part of specific effort to encourage customers to tell others about
their services, promotion have become a critical factor in the product marketing
14
mix which consists of the specific blend of advertising, personal selling, sales
promotion, public relations and direct marketing tools that the company uses to
pursue its advertising and marketing objective cited by Owomoyela, Olasunkanmi
and Oyeniyi (2013). (Zeithaml et al. 1995; Kotler 2007).
Promotion means everything companies do in order to sell their products and
services and how they tell about their products to the customers (Eeva Rajjakalio,
2012). The promotion mix which includes different tools which company uses in
their business, these tools are advertising, sales promotion, public relations,
personal selling and direct marketing tools. There are used in order to improve
customer value and in order to maintain customer relationship. Promotion also
defined as the tools which used to build the company’s image and difference from
competitiors (Kotler et al, 2008; Khrisna, 2010).
2.1.4 Place/Distribution
Place as any way that the customer can obtain a product or receive a service as
defined by Jones (2007). Distribution also considered as another name for place,
it encompasses all decisions and tools which relate to making products and
services available to customers, and claimed that place could be categorized into
open market, merchant houses, institutional houses, and direct delivery
(Bowersox and closs, 1996)
Traditionally, a market was a physical place where buyers and sellers are gathered
to exchange goods. Now, marketers view the sellers as the industry and the
buyers as the market. (Kotler, 2002)
But recently, location is not so vital anymore for every companies, it depends on
the type of the company. Internet now has made everything easier. Although
place is an important aspect to think in business but more vital is the availability
and accessibility (Eeva Rajakallio, 2012; Krhisna, Gopala Raghavan, and Reddy,
2010). Products need to be available for the customers and accessibility needs to
be simple. Selling can be direct selling at the place via sales people but it may
15
happen via catalogues, telephone, or trade fairs and many uses combination of
different selling tactics (Tracy, 2004).
2.1.5 Correlation between Marketing Mix and Customer Loyalty
Mellens, Dekimpe, and Steenkamp (1996) concluded that brand loyalty can be
quantified using the brand-specific intercepts in market share attraction models
(Cooper and Nakanishi, 1988). In those models a brand’s market share is
determined by its relative attractiveness vis-à-vis the other brands. This
attractiveness itself is determined by the (1) value and effectiveness of its
marketing mix variables and (2) a constant, which is assumed to reflect the
brand’s loyalty.
Cengiz and Yayla (2007) find marketing mix to have positive effect on
satisfaction and loyalty on word of mouth. Especially, product and promotion
components have the important influence on word of mouth communication
indirectly.
2.2 Brand Image or Market Positioning Brand image or market positioning nowadays have become a powerful strategy to
gain customers trust, as being described before by Armstrong, Kotler, Harker and
Brennan (2009) that through a company or brand image differentiation, customers
may acknowledge a difference even when competing offers look the same. A lot
of advantages became an easy target to catch if this strategy implemented on
track. According to Barwise (1993); Farquhar et al (1991); Keller (1993); Simon
and Sullivan (1993); and Smith and Park (1992); may indicate the probability of
brand choice, willingness to pay premium prices, marketing communication
effectiveness, and brand licensing opportunities, and decreases vulnerability to
competitive marketing actions and elastic responses to price increases, were the
advantages may be achieved by maintaining brand image as cited by Boonghee
Yoo, Naveen Donthu and Sungho Lee (2000)
16
As the co-founder has set the positioning of Apple products nicely, a strong brand
image has been created by the innovators. When the company understands brand
personality and image, they have the tools to successfully differentiate their brand
(Jung et al 2010). Yang (2010) also say that brand personality ultimately affiliates
with the brand by product attributes, brand name, category associations,
advertisements, price, symbol or logo, and distribution channel. The brand
personality of the characterization of the brand is mainly what the firm
communicates to the public. Strategy is based on a differentiated customer value
proposition. Satisfying customers is the source of sustainable value creation.
Strategy requires a clear articulation of targeted customer segments and the value
proposition to please them. Clarify of this value proposition is the single most
important dimension of strategy (Kaplan and Norton 2004).
Since each company must decide and develop its own winning positioning
strategy, one that makes it appealing and special to its target customers
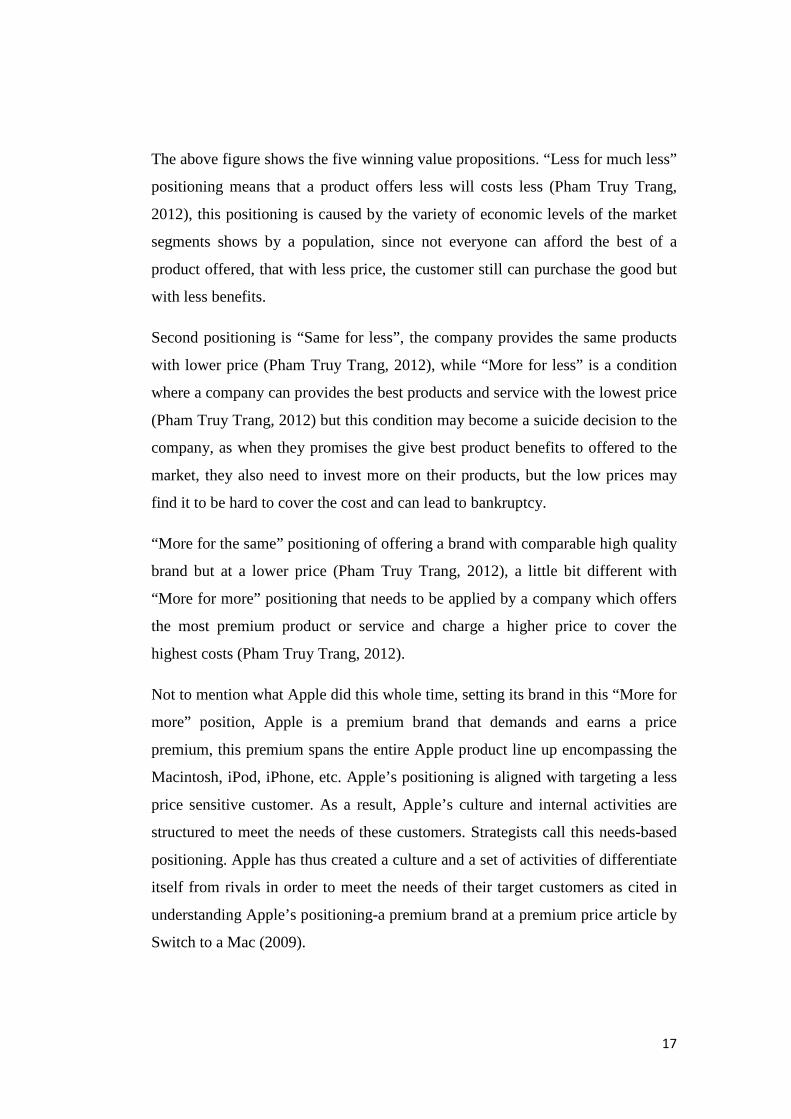
(Armstrong et al. 2009), there are five winning value propositions: less for much
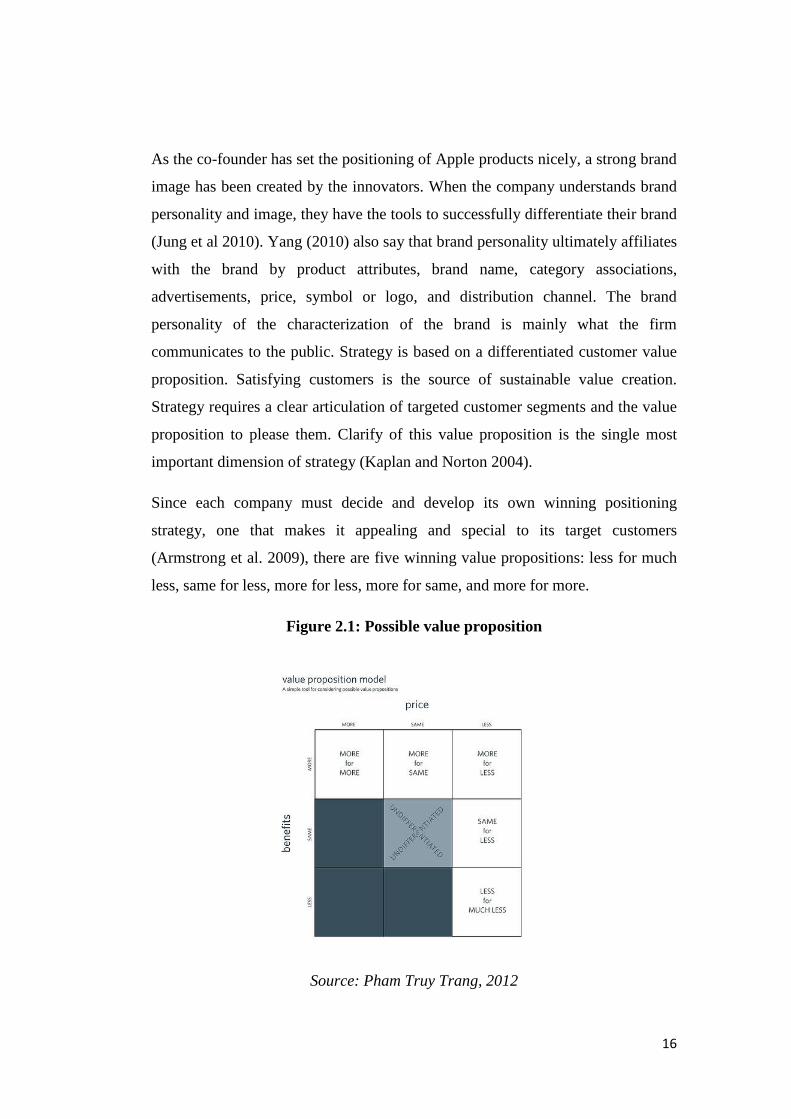
less, same for less, more for less, more for same, and more for more.
Figure 2.1: Possible value proposition
Source: Pham Truy Trang, 2012
17
The above figure shows the five winning value propositions. “Less for much less”
positioning means that a product offers less will costs less (Pham Truy Trang,
2012), this positioning is caused by the variety of economic levels of the market
segments shows by a population, since not everyone can afford the best of a
product offered, that with less price, the customer still can purchase the good but
with less benefits.
Second positioning is “Same for less”, the company provides the same products
with lower price (Pham Truy Trang, 2012), while “More for less” is a condition
where a company can provides the best products and service with the lowest price
(Pham Truy Trang, 2012) but this condition may become a suicide decision to the
company, as when they promises the give best product benefits to offered to the
market, they also need to invest more on their products, but the low prices may
find it to be hard to cover the cost and can lead to bankruptcy.
“More for the same” positioning of offering a brand with comparable high quality
brand but at a lower price (Pham Truy Trang, 2012), a little bit different with
“More for more” positioning that needs to be applied by a company which offers
the most premium product or service and charge a higher price to cover the
highest costs (Pham Truy Trang, 2012).
Not to mention what Apple did this whole time, setting its brand in this “More for
more” position, Apple is a premium brand that demands and earns a price
premium, this premium spans the entire Apple product line up encompassing the
Macintosh, iPod, iPhone, etc. Apple’s positioning is aligned with targeting a less
price sensitive customer. As a result, Apple’s culture and internal activities are
structured to meet the needs of these customers. Strategists call this needs-based
positioning. Apple has thus created a culture and a set of activities of differentiate
itself from rivals in order to meet the needs of their target customers as cited in
understanding Apple’s positioning-a premium brand at a premium price article by
Switch to a Mac (2009).
18
2.2.1 Correlation between Brand Image/Market Positioning with Customer
Loyalty
Heng, Yeong, Siong, Shi and Kuan (2011) had concluded that there is a strong
perception of both corporate reputation and image would tend to increase the
degree of customer loyalty, also the trust and satisfaction that that interwoven
tightly with the traditional constructs such as image could substantially contribute
to loyalty (Nguyen and Leblanc, 2001; Orth and Green, 2009).
Also, Izquierdo et al, (2005) explained that the process of developing customer-
firm relationships starts when the firm invests in activities directed towards
attracting customers and positioning on the market. However, a greater effort is
needs in order to make these customers loyal. Attraction and loyalty programs
that are necessary in the process of creating customers-firm relationships that are
valuable both to customers and the firm.
Kotler (2002) also presents many strategies to offer a product in the market,
known as product branding strategies, manufacturer brand is a product branding
that sells under the name of the producer that have benefits of customer loyalty
and price premium.
In his book, Kotler (2000) he explained that manufacturers have learnt that
market power comes from building their own brands, and in case the companies
can no longer afford to manufacture their products in their homeland, strong
brand names continue to command customer loyalty.
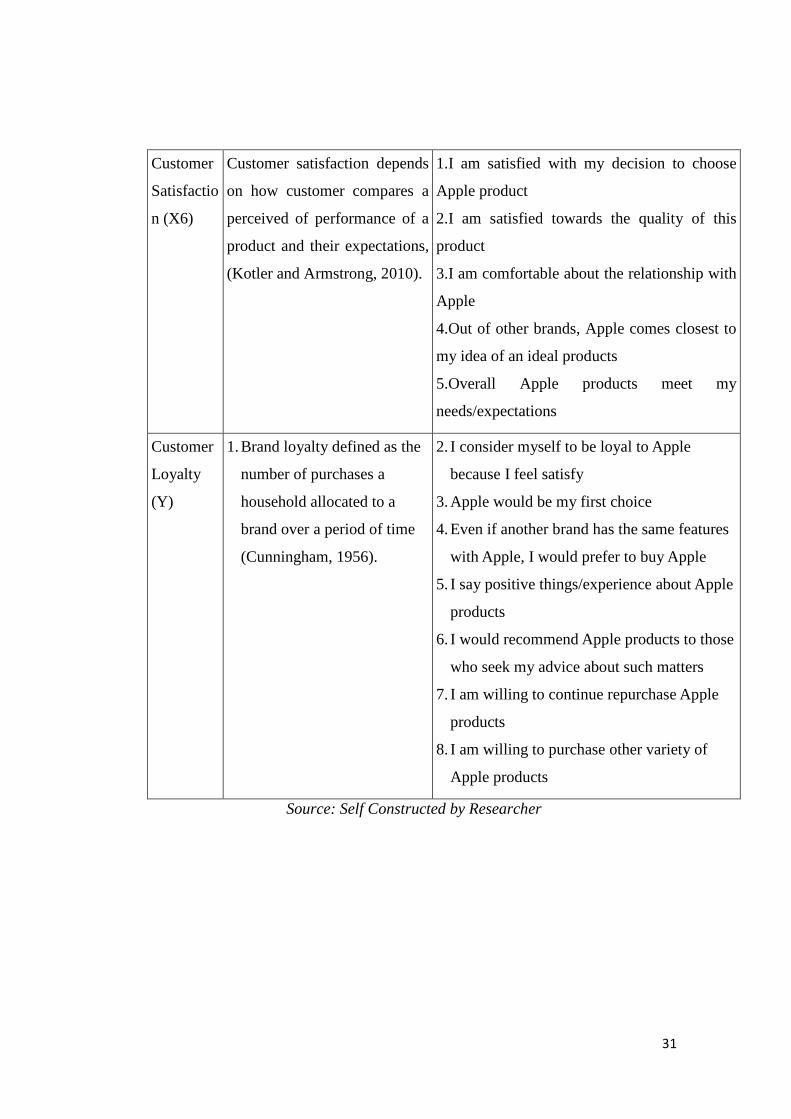
2.3 Customer Satisfaction Customer satisfaction depends on how customer compares a perceived of
performance of a product and their expectations, customer will get satisfied if the
perceived performance is better than their expectation. Customers who get
satisfied will purchase repeatedly and would like to share their good experience to
other people (Kotler and Armstrong, 2010).
19
Kotler (2002) also defined buyer’s satisfaction with a purchase is a function of the
closeness between the buyer’s expectation and the product’s perceived
performance. If performance falls short of expectations, the customer is
disappointed, but if it meets expectations, the customer is satisfied.
Customer satisfaction is a fundamental thing towards the growth and expansion of
a business as it leads to an increase in market share, and to acquiring repeat and
referral business, which ultimately results in greater profitability (Barsky, 1992).
Therefore, achieving customer satisfaction is crucial to business, as being
described by Getty and Thompsons (1994) that the relationships between quality,
satisfaction and the subsequent effect on customers; intention to recommend the
product to other potential customers. Their results suggest that customer’s
perceptions of both satisfaction and quality greatly impact the customers’
intention to recommend (which is a measure of customer loyalty) (Martina
Donelly, 2009).
2.3.1 Correlation between customer satisfaction and customer loyalty
Donelly (2009) summarized that, due to the importance correlation between
customer satisfaction and customer loyalty, customer satisfaction had given a
considerable attention since it is assumed to be a significant determinant of repeat
sales, positive word-of-mouth and customer loyalty (Cronin et al., 2000; Cronin
and taylor, 1992; Oliver 1980; Bearden and Teel 1983). Several studies by Bowen
and Che (2001); Oliva et al., (1992) and Coyne (1989) also proved that a minimal
change in the level of satisfaction can lead to a significant change in loyalty
growth.
Gremler and Gwinner (2000) had shown a positive relationship between overall
satisfaction and loyalty intention. Hu Beibei, Wang Shiyang and Xu Jiahong
(2013) cited that customer satisfaction is believed to have a significant positive
correlation with customer loyalty (Colgate and Stewart, 1998; Bitner and
Gremler, 2006).
20
Previously, Fornell (1992) and Jones (1990) found that loyal customers are not
necessarily satisfied customers, but satisfied customers tend to be loyal
customers. Highly satisfied customers are much more loyal than satisfied
customers and any drop in total satisfaction results in a major drop in loyalty as
cited by Rasha Ali Eliwa (2006).
Donelly (2009) also concluded that there is a positive relationship between
customer satisfaction, quality, and customer loyalty based on the research done by
Getty and Thompson mentioned before of how the relationships between those
variables will result to recommend the product to other potential customers which
is a measurement factor of loyalty. Mattsson (2009) also conclude that most of
the companies make a huge mistake. When they do not paying enough attention
to their customer satisfaction. Keeping customer satisfied is the best competitive
advantage against competitors.
2.4 Customer Loyalty Martina Donelly (2009) explained that building customer loyalty leads to positive
outcomes such as augmented sales, a reduction in costs, more foreseeable profit
flows, increased competitive advantage, and is critical to a firm’s survival and
growth. This consistent with customer relationship management (CRM) theory
which argues that a firm’s overriding strategy should be the attraction and
retention of profitable customers, because loyal customers will, in the long-term,
buy more and pay a premium for doing business with those they trust and like
(Terrill et al., 2000; Otrowsky et al., 1993; Bharadwaj et al., 1993; Reichheld,
1996; Peppers and Rogers, 2004).
Loyalty was investigated in terms of brand loyalty with respect to tangible good
(Day, 1969; Tucker, 1964; Cunningham, 1956). Brand loyalty defined as the
number of purchases a household allocated to a brand over a period of time
(Cunningham, 1956). And because of the conceptualization and measurement of
the loyalty concept has become more and more complex, thus the vast majority of
market researchers view loyalty as a multi-dimensional concept, however there is
21
debate as to how many dimensions (Jones and Taylor, 2007; Martina Donelly
2009). Willingness to recommend is the only indicator utilized by Reichheld
(2003) from investigating service organization in measuring customer loyalty,
while Chitty, Ward and Chua (2001) explained that customer loyalty can be
conceptualized by three dimensions, behavioral loyalty, indicated by repeat-
purchase behavior, and attitudinal behavior, referring to the inherent affective and
cognitive facets of loyalty.
The behavioral approach involves the individual altering their behavior, showing
strong intentions to repurchase from one service provider over alternative service
providers. Both the marketing and psychological literatures indicate that
behavioral loyalty is measured by re-purchasing intentions, switching intentions,
and exclusively purchasing intentions (Jones and Taylor, 2007).
The attitudinal approach considers both emotional and psychological aspects in
loyalty. For example, an individual may have positive attitude towards a product
and may recommend about the product to others, but they may not have or buy
the product because the product is too expensive for them, but still the positive
attitude will benefit the company. Building attitudinal loyalty towards a product
or service takes more than a basic marketing transaction inducement. Positive
attitudes towards the product or service must be developed over a longer period of
time (Kumar and Shah, 2004).
Furthermore, Lee and Cunningham (2001) added a cognitive approach which
entails an individual completely reforming what she/he believes about the
relationship with his/her service provider. Martina Donelly (2009) explained that
the cognitive measures include top of mind, first choice, price tolerance, exclusive
consideration, identification with the service provider, that is “my service
provider”, and willingness to pay more (Dwyer et al., 1987; Ostrowsky et al.,
1993; De Ruyter et al., 1998; Anderson 1996; Gremler and Brown, 1996; Butcher
et al., 2001; Bloemer et al., 1999). The table below shows a full breakdown of the
loyalty dimensions of behavioral, attitudinal, and cognitive.
22
Table 2.1: Loyalty Dimensions
Dimensions Loyalty Related Outcome
Definition Related Research
Behavioral Repurchase Intention
Customer’s aim to maintain a relationship with a particular service provider and make his or her next purchase in the category from this service provider
Jones et al. (2000); Zeithmal et al. (1996)
Switching Intention
Customer’s aim to terminate a relationship with a particular service provider and patronize another in the same category
Bansal abd Taylor (1999); Dabholkar and Walls (1999)
Exclusive Intention
Customer’s aim to dedicate all of his or her purchase in a category to a particular service provider
Reynolds and Arnold (2000); Reynolds and Beatty (1999)
Attitudinal Relative Attitude The appraisal of the service, including the strength of that appraisal and the degree of differentiation from alternatives
Dick and Basu (1994); Mattila (2001); Pritchard et al. (1996)
Willingness to Recommend
Consumer’s willingness to recommend a service provider to other consumers
Butcher et al. (2001); Zeithmal et al (1996)
Altruism Consumer willingness to assist the service provider or other service consumers in the effective delivery of the service
Price et al. (1995)
Cognitive Willingness to pay more
Consumer’s indifference to price differences between that of his or her current service provider and others in the same category
Anderson (1996); De Ruyter et al (1998)
Exclusive Consideration
The extent to which the consumer considers the service provider as his or her only choice when purchasing this type of service
Dwyer et al (1987); Ostrowski et al. (1993)
Identification The sense of ownership over the service affiliation with the service provider, or congruence values that exists between service provider and the consumer
Butcher et al. (2001)
Source: Martina Donelly (2009) adapted from Jones and Taylor (2007)
23
2.5 Previous Research There are several previous research has been conducted regarding to Marketing
Mix, Customer Satisfaction, Brand Image, and Customer Loyalty, such as:
a. Based on the study done by Owomoyela, Olasunkami, and Oyeniyi (2013)
about investigating the impact of marketing mix elements on consumer
loyalty: an empirical study on Nigerian breweries PLC. The survey
research design method used in this research which involves self-design
questionnaire in collecting data from sixty respondent, six managers, and
ten sales representatives of Nigerian breweries Plc, ten distributors and
thirty four consumers from different joints in Ibadan were selected
respectively. The instrument used in this research is a close-ended
questionnaire that was designed by the researchers. Correlation coefficient
and multiple regression analysis were used to analyze the data with the aid
of statistical package for social sciences (SPSS) version 20. The result
showed that marketing mix elements have significant effect on customer
loyalty. Subsequently, recommendations were made to the management of
Nigerian breweries that they should continue produce superior products;
charge competitive prices, position appropriately, promote widely, and
provide other distinctive functional benefits to consumers.
b. The second research done by Khoo Chong Heng, Kuit Sui Yeong, Lee
Choon Siong, Tan Yi Shi, Yee Mei Kuan (2011) about Customers’
perceptions of the marketing mix and the effect on Malaysian
Hypermarkets’ brand loyalty. Due to Malaysians hypermarket are
increasing rapidly, therefore, brand loyalty has become a critical retailing
topic. Meanwhile, plentiful studies are more concern on the effects of
marketing mix towards brand equity instead of brand loyalty. By
conducting this research study, the main goal is to identify which
marketing mix will affect brand loyalty in Malaysian hypermarkets in
relation to contribute hypermarkets’ management and future researchers in
Malaysia. However, the researchers are adapting the studies done by Chen
24
(2007) in relation to its five independent variables (IVs) which are price,
store image, advertising spending, distribution intensity, and price
promotion as examining the relationship between five IVs and Malaysian
hypermarkets’ brand loyalty. As such, researchers adapted it by reason of
comparing the results between Malaysian and Taiwan hypermarkets.
Furthermore, researchers will distribute 250 questionnaire surveys to
customers in Malaysia hypermarkets. Lastly, this study is a descriptive
and explanatory study by using descriptive and inferential analysis.
c. The research by Rasha Ali Eliwa (2006) was a cross-secrtional descriptive
research. The objective of the study was to examine how the image and
customer satisfaction of a fine dining restaurant affects customers’ loyalty.
the study also examined the two perquisites of customer loyalty which are
customer satisfaction and the image of the fine dining restaurant. The
study design employed two sets of variables: multiple criterion
(dependent) variables and multiple predictor (independent) variables.
Multiple regression analysis was used to predict the value of a dependent
variable (e.g. ‘Overall Satisfaction’, ‘Likelihood of Return’, and
‘Likelihood of Recommendation’) from a linear function of a set of
independent variables (e.g perceptions on restaurant customer satisfaction
image-related attributes). A detailed questionnaire was distributed to
customers who had lunch and dinner at a fine dining restaurant.
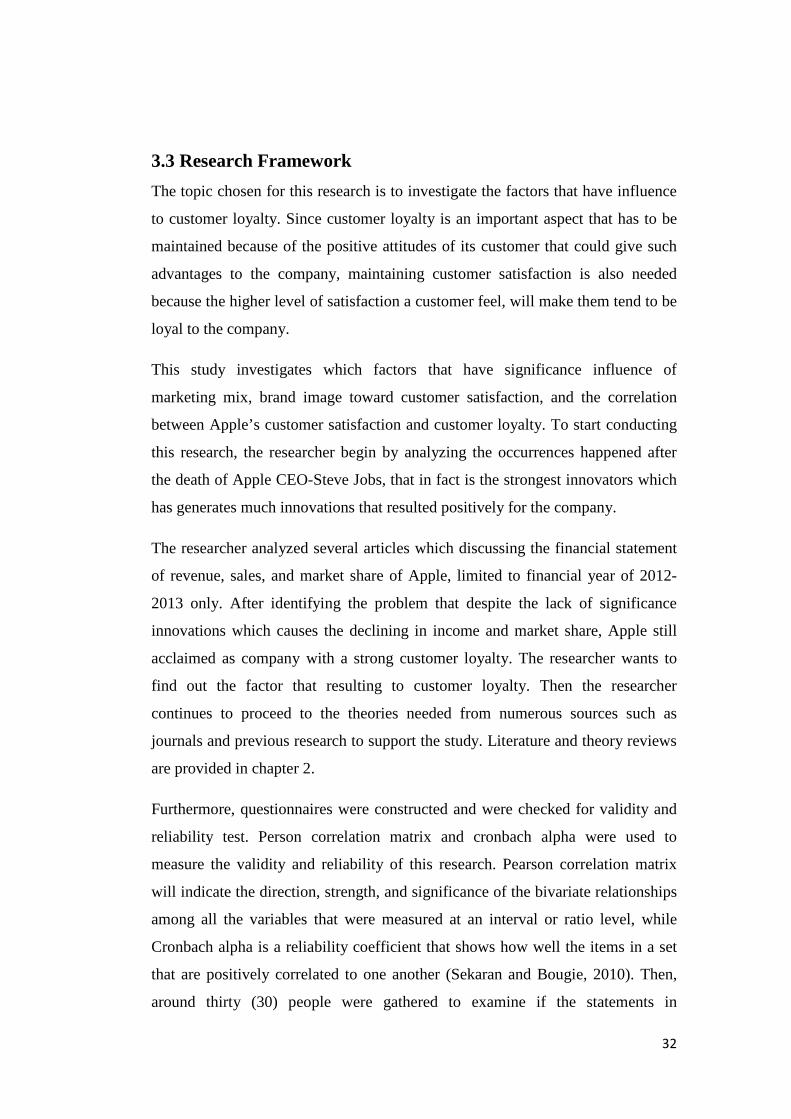
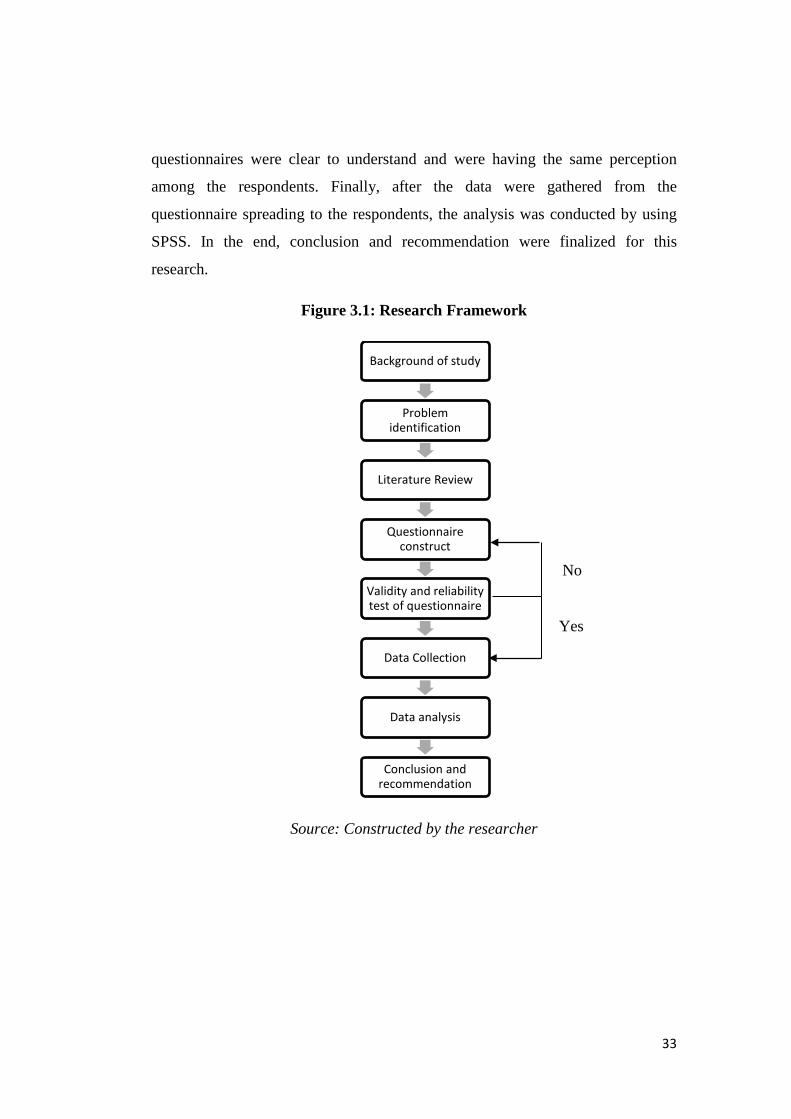
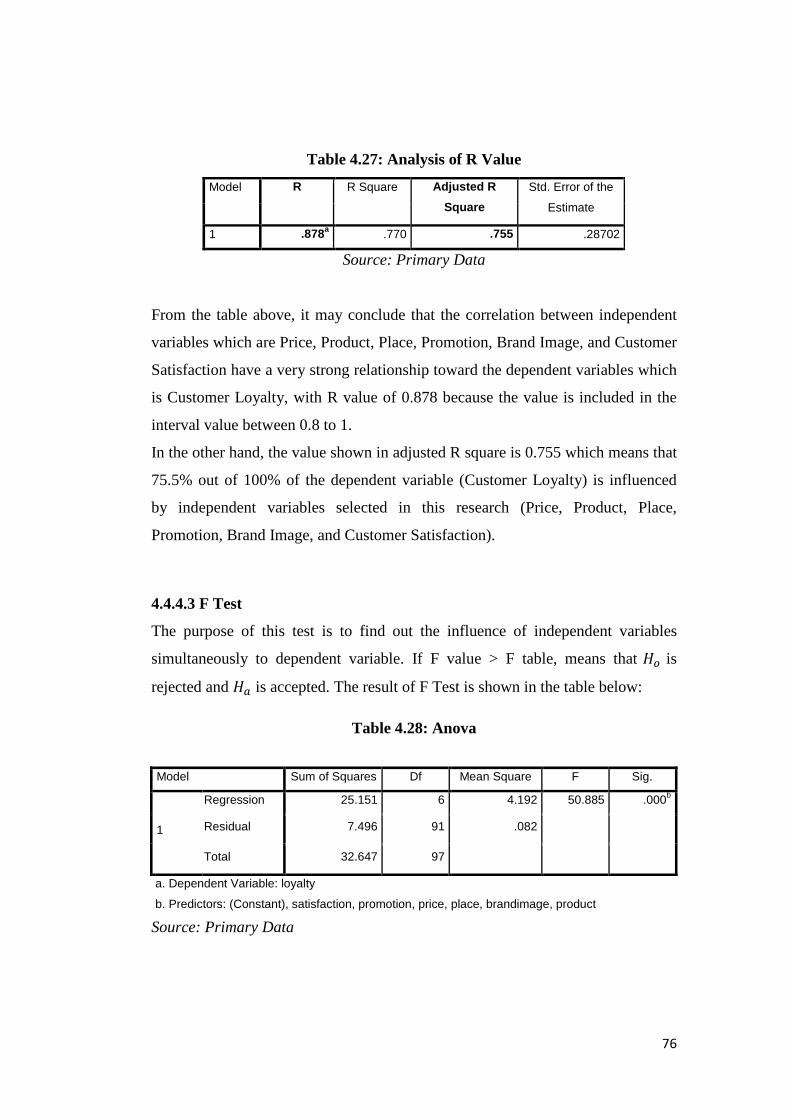
4.4.4.2 Correlation Coefficient (R) and Coefficient Determination (𝐑𝟐)
The correlation coefficient or can be called Pearson Correlation Coefficient (R)
used to determine how strength is the correlation between independent variables
and dependent variables. While coefficient determination used to measure the
level of contribution of independent variables to dependent variable. Based on the
data had gathered by the researcher, the result model is as follow:
76
Table 4.27: Analysis of R Value
Model R R Square Adjusted R Square
Std. Error of the
Estimate
1 .878a .770 .755 .28702
Source: Primary Data
From the table above, it may conclude that the correlation between independent
variables which are Price, Product, Place, Promotion, Brand Image, and Customer
Satisfaction have a very strong relationship toward the dependent variables which
is Customer Loyalty, with R value of 0.878 because the value is included in the
interval value between 0.8 to 1.
In the other hand, the value shown in adjusted R square is 0.755 which means that
75.5% out of 100% of the dependent variable (Customer Loyalty) is influenced
by independent variables selected in this research (Price, Product, Place,
Promotion, Brand Image, and Customer Satisfaction).
4.4.4.3 F Test
The purpose of this test is to find out the influence of independent variables
simultaneously to dependent variable. If F value > F table, means that 𝐻𝑜 is
rejected and 𝐻𝑎 is accepted. The result of F Test is shown in the table below:
Table 4.28: Anova
Model Sum of Squares Df Mean Square F Sig.
1
Regression 25.151 6 4.192 50.885 .000b
Residual 7.496 91 .082
Total 32.647 97
a. Dependent Variable: loyalty
b. Predictors: (Constant), satisfaction, promotion, price, place, brandimage, product
Source: Primary Data
77
The hypotheses can be constructed as follow:
(𝐻0): Price, Product, Place, Promotion, Brand Image, and Customer satisfaction
simultaneously have negative significant influence towards customer loyalty
(𝐻𝑎): Price, Product, Place, Promotion, Brand Image, and Customer satisfaction
simultaneously have positive significant influence towards customer loyalty
Thus, by determining the table above, shows a result of F table value for 50.885
intercepted to significance level of 0.000 is 1.839. Where, the accounted df in F
table are df1 = 6 and df2 = 91, thus the F table value is 1.839.
The F value in Anova table must be greater than F table (F value > F table) to
prove that the independent variables has significant relationship to dependent
variable, and significant value should no more than 0.1 (<0.1), since the F value is
(50.885 > 1.839) and the significant is (0.000 < 0.1), then there is significant
influence between variables simultaneously.
78
4.4.4.4 t Test
The purpose of conducting this test was to determine the influence of one
independent variable (Price, Product, Place, Promotion, Brand Image, and
Customer Satisfaction) each to dependent variable (Customer Loyalty). The t test
value can be indicated in the table below:
Table 4.29: t Test value
Model Unstandardized Coefficients Standardized
Coefficients
T Sig.
B Std. Error Beta
(Constant) -.254 .254 -.999 .320
price .449 .062 .461 7.204 .000
product .099 .108 .088 .912 .364
place .083 .053 .114 1.573 .119
promotion -.049 .056 -.071 -.875 .384
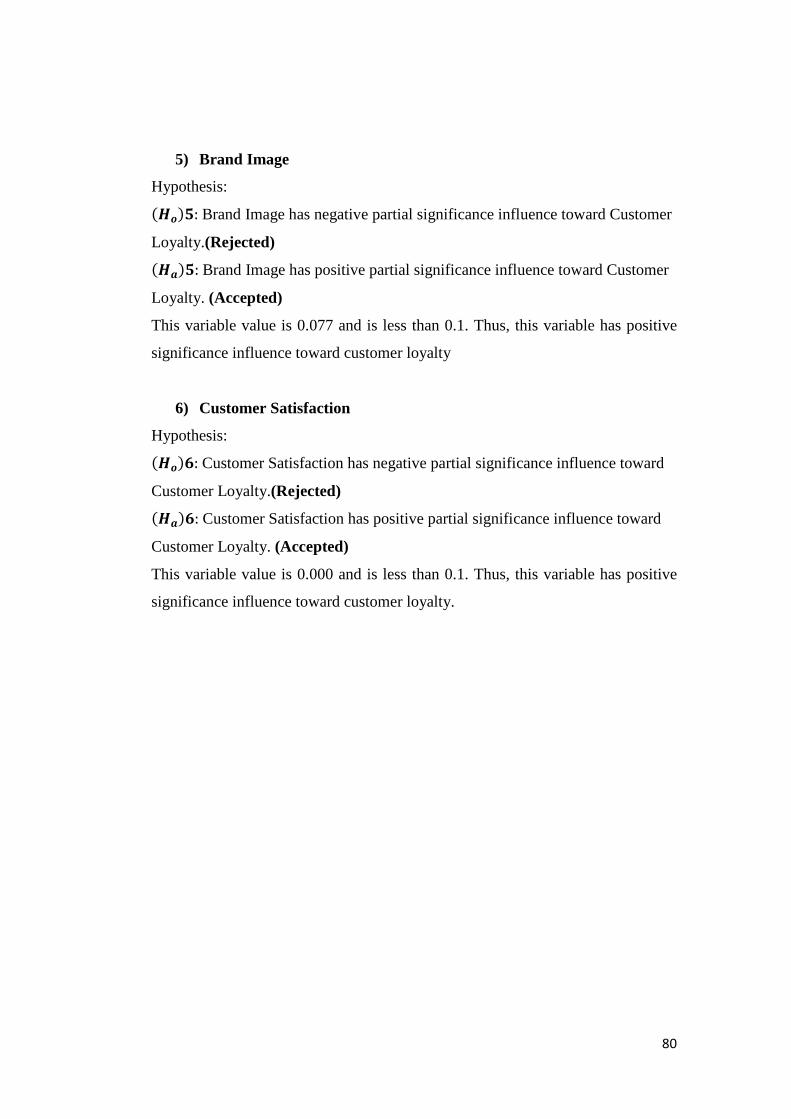
brandimage .124 .069 .136 1.788 .077
satisfaction .346 .094 .332 3.667 .000
a. Dependent Variable: loyalty
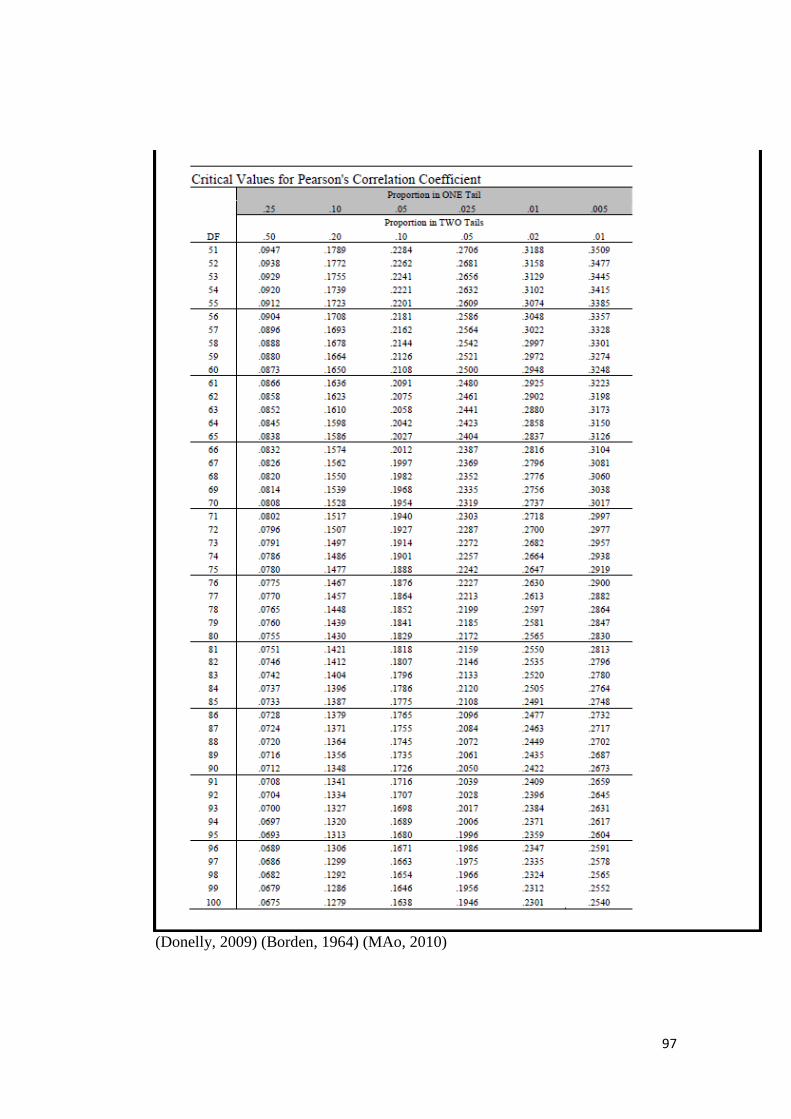
To construct the test, the researcher will compare each t values with t table, which is (1.290) obtained from looking to t table, df = n-1 (df = 98-1).
1) Price
Hypothesis:
(𝑯𝒐)𝟏: Price has negative partial significant influence toward Customer Loyalty.
(Rejected)
(𝑯𝒂)𝟏: Price has positive partial significant influence toward Customer Loyalty
(Accepted)
The value for Price variable significance shows the amount 0.000, which is less
than 0.1. Thus, this variable has significant influence toward customer loyalty.
79
2) Product
Hypothesis:
(𝑯𝒐)𝟐: Product has negative partial significant influence toward Customer
Loyalty.(Accepted)
(𝑯𝒂)𝟐: Product has positive partial significant influence toward Customer
Loyalty(Rejected)
The value for this variable significance is 0.364, and is greater than 0.1. Thus, this
variable has negative partial significant influence toward customer loyalty.
3) Place
Hypothesis:
(𝑯𝒐)𝟑: Place has negative partial significant influence toward Customer
Loyalty.(Accepted)
(𝑯𝒂)𝟑: Place has positive partial significant influence toward Customer Loyalty.
(Rejected)
This variable value is 0.119 and is greater than 0.1. Thus, this variable has
Carasco, J. (2010). Illustrated Fractions. Create Space Independent Publishing Platform.
Kotler, P. (2000). Marketing Management, Millenium Edition. New Jersey: Pearson custom publishing.
Journals
Beibei, H., Shiyang, W., & Jiahong, X. (2013). customer loyalty to coffee shop:a study of swedish generation Y.
Boonghee Yoo; Naveen Donthu; Sungho Lee. (2000). An examination of selected marketing mix elements and brand equity. Journal of the academy of marketing science.
Borden, N. H. (1964). The concept of Marketing Mix. Journal of Adevertising research.
Dennis Pitta; Frank Franzak; Danielk Fowler. (2006). A strategic approach to building onlinecustomer loyalty: integrating customer profitability piers. Journal of Consumer Marketing.
Goi, C. L. (2009). A Review of Marketing Mix: 4Ps or More? International Journal of Marketing Srudies.
Waheed Riaz; Asif Tanveer. (n.d.). Marketing Mix, not branding. Asian journal and management science.
Li, M. L., & Green, R. (n.d.). A mediating influence on customer loyalty: The role of perceived value. Journa of Management and Marketing Research .
MAo, J. (2010). custoer brand loyalty. International Journal of Business and management.
S, O., K, O., & Olasunkanmi. (2013). Investigating The Impact Of Maketing Mix Elements On Consumer Loyalty: An Epirical Study On Nigerian Breweries PLC. Journal of Contemporary Research in Business.
91
Byron Sharp; Anne Sharp. (1997). Loyalty programs and their impact on Repeat-Purchase Loyalty Patterns: a replication and extension.
Donelly, M. (2009). building customer loyalty: a customerexperience based approachin a tourism context.
Eliwa, R. A. (1993). A study of customer loyalty and the image of the fine dining restaurant.
Hooy, K. K. (2012). Customer loyalty, satisfaction and marketing mix: empirical evidencefrom infant formula industry.
ISrael, G. D. (2009). Determining sample size.
Nordman, C. (2004). Understanding Customer Loyalty and Disloyalty - The effect of loyalty-supporting and-repressing factors.
Rajakallio, E. (2012). 7P framework as a development tool for Fintouring's summer cottage holiday product.
Regina Virvilaite; Violeta Saladiene; Dalius Skindras. (2009). The relationship between price and loyalty in service industry.
Trang, P. T. (2012). The Improvement and Development of a Newly-Launched Buffet Program for Moevenpick Hotel Hanoi.
Yang, Z. (2004). Customer perceived value, satisfation, and loyalty:the role of switching cost.
Internet
Apple reports fourth quarter results. (2013, October 28). Retrieved December 2013, from Apple: www.apple.com
Jones, C. (2013, October 31). Apple continues to lose tablet market share but should rebound with the air. Retrieved December 2013, from Forbes: http://www.forbes.com/sites/chuckjones/2013/10/31/apple-continues-to-lose-tablet-market-share-but-should-rebound-with-the-air/
Clevenger, N. (2011, July 29). How the iPad conquer the Enterprises. Retrieved January 2014, from Datamation: www.datamation.com
92
Liedtke, M. (2013, October 29). Apple's earnings fall despite rising iPhone sales. Retrieved December 2013, from The Jakarta Post: http://www.thejakartapost.com/news/2013/10/29/apples-earnings-fall-despite-rising-iphone-sales.html
Reed, B. (2013, July 29). History repaet itself: Android tablet shipments blow past iPad. Retrieved December 2013, from BGR: http://bgr.com/2013/07/29/android-tablet-market-share/
Schubart, C. (2011, October 5). Apple iPhone users are most loyal. Retrieved December 2013, from Business Journal: http://www.bizjournals.com/sanjose/news/2011/10/05/apple-iphone-users-are-most-loyal.html
Statcounter mobile stats: Top 8 Monbile operating systems. (2014). Retrieved January 2014, from StatCounter: http://gs.statcounter.com/#mobile_os-ID-yearly-2010-2013
Tode, C. (2013, February 7). Apple loses top spot in brand loyalty for smartphones, tablets. Retrieved December 2013, from Mobile marketer: www.mobilemarketer.com
Understanding Apple positioning - A premium brand at a premium price. (2009, June 4). Retrieved December 2013, from Switch to A Mac: http://switchtoamac.com/site/understanding-apples-positioning-part-1-a-premium-brand-at-a-premium-price.html
Bare, R. (2007). Apple analysis report.
93
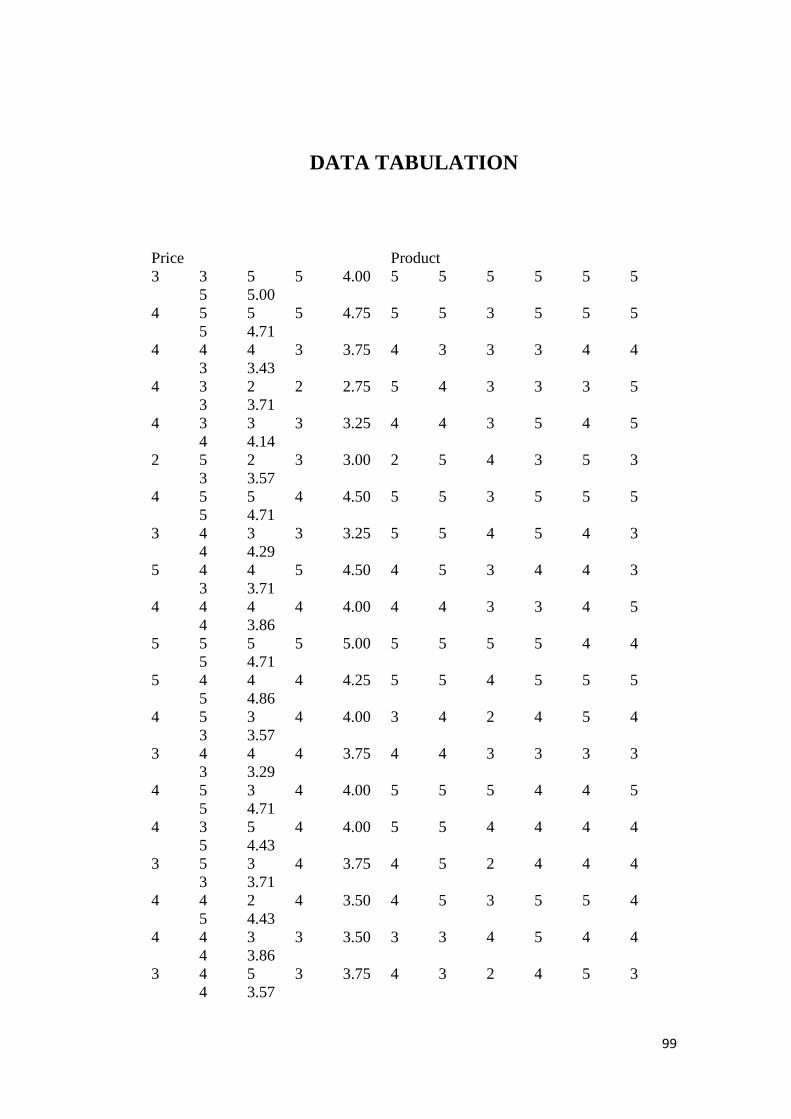
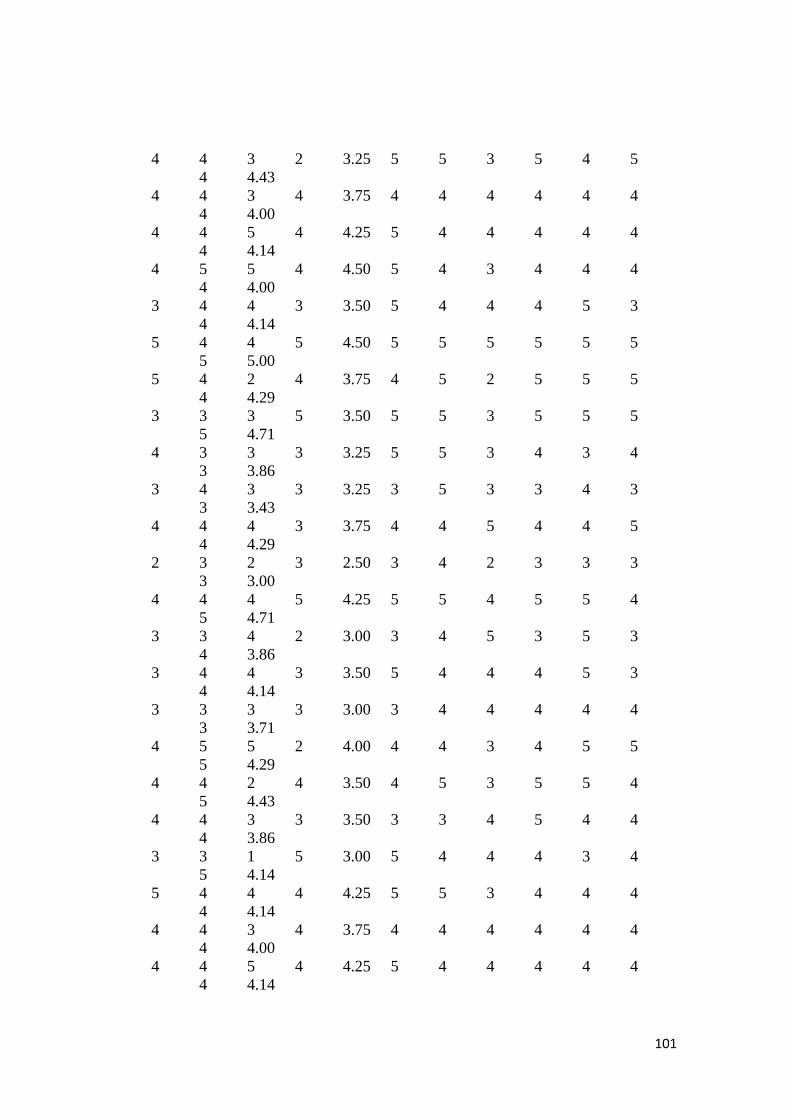
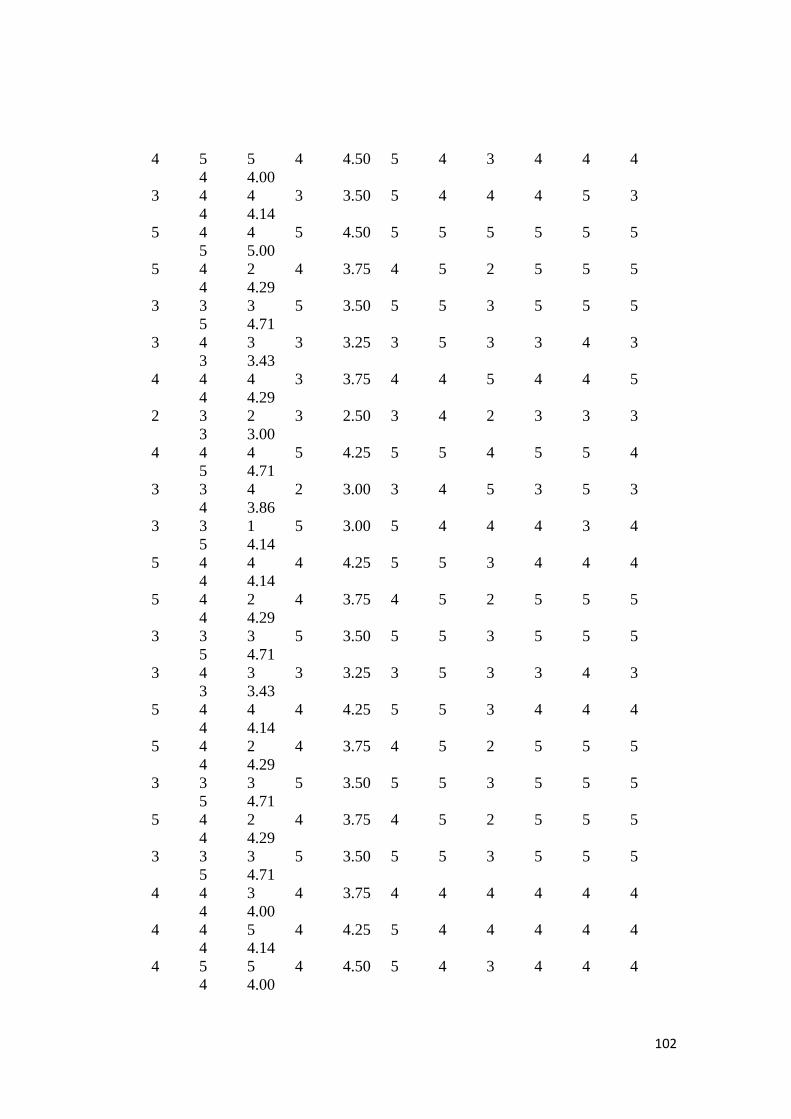
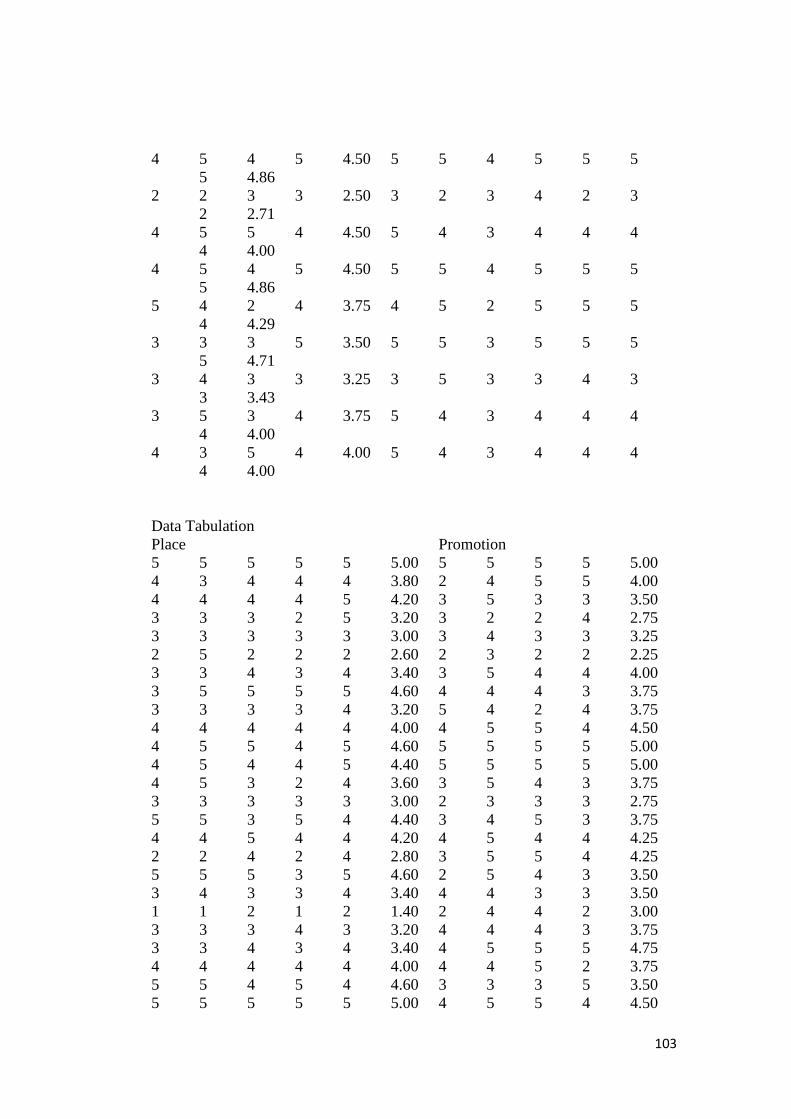
APPENDICES
QUESTIONNAIRE
Questionnaire – Analysis on influencing factors towards customer loyalty
(A Case study of Apple Inc.)
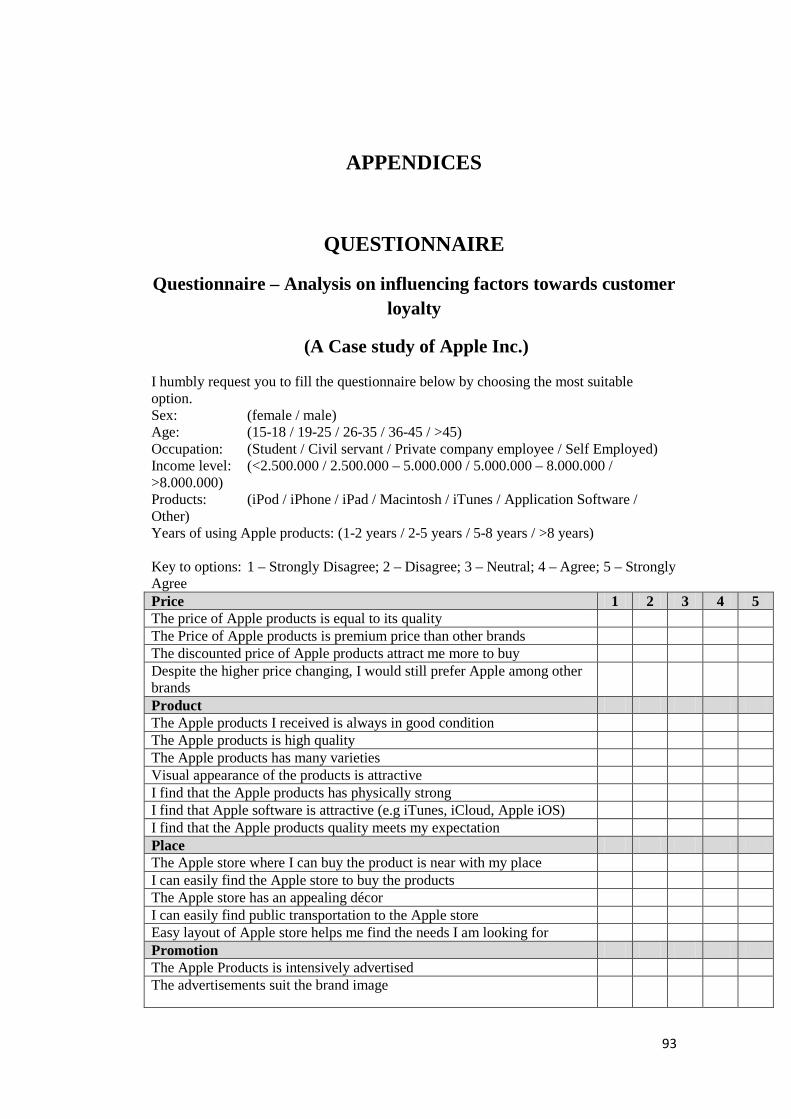
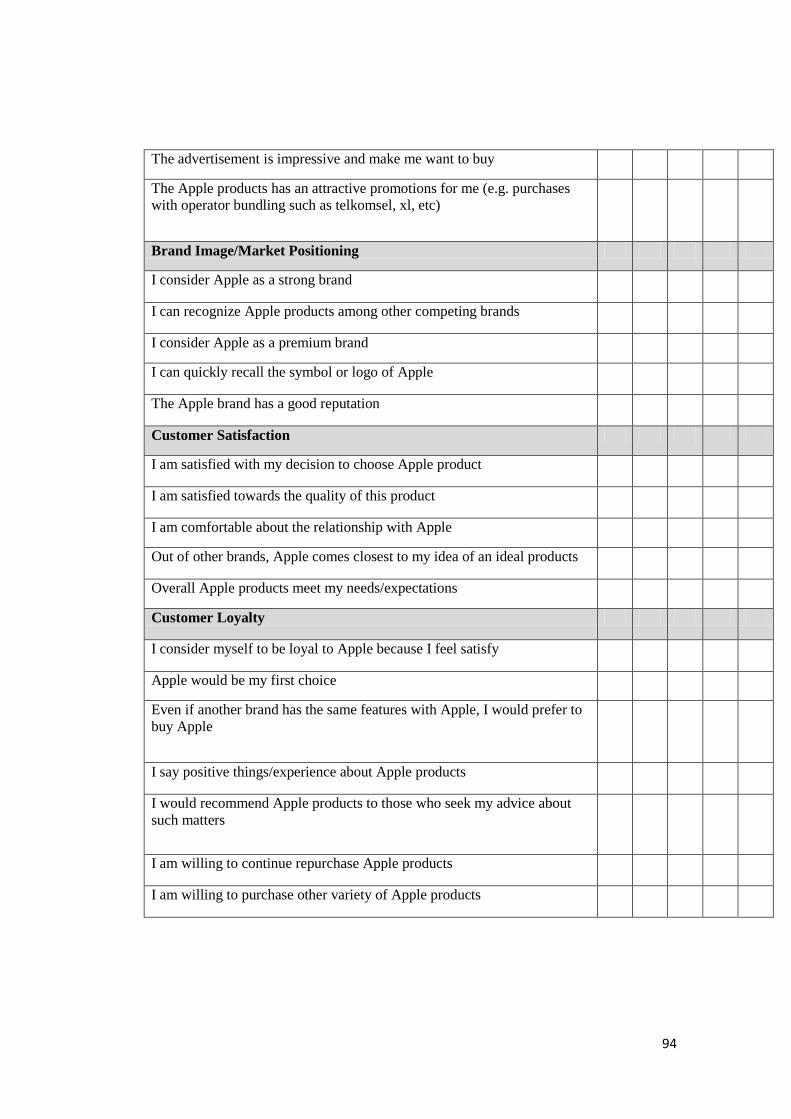
I humbly request you to fill the questionnaire below by choosing the most suitable option. Sex: (female / male) Age: (15-18 / 19-25 / 26-35 / 36-45 / >45) Occupation: (Student / Civil servant / Private company employee / Self Employed) Income level: (<2.500.000 / 2.500.000 – 5.000.000 / 5.000.000 – 8.000.000 / >8.000.000) Products: (iPod / iPhone / iPad / Macintosh / iTunes / Application Software / Other) Years of using Apple products: (1-2 years / 2-5 years / 5-8 years / >8 years) Key to options: 1 – Strongly Disagree; 2 – Disagree; 3 – Neutral; 4 – Agree; 5 – Strongly Agree Price 1 2 3 4 5 The price of Apple products is equal to its quality The Price of Apple products is premium price than other brands The discounted price of Apple products attract me more to buy Despite the higher price changing, I would still prefer Apple among other brands
Product The Apple products I received is always in good condition The Apple products is high quality The Apple products has many varieties Visual appearance of the products is attractive I find that the Apple products has physically strong I find that Apple software is attractive (e.g iTunes, iCloud, Apple iOS) I find that the Apple products quality meets my expectation Place The Apple store where I can buy the product is near with my place I can easily find the Apple store to buy the products The Apple store has an appealing décor I can easily find public transportation to the Apple store Easy layout of Apple store helps me find the needs I am looking for Promotion The Apple Products is intensively advertised The advertisements suit the brand image
94
The advertisement is impressive and make me want to buy
The Apple products has an attractive promotions for me (e.g. purchases with operator bundling such as telkomsel, xl, etc)
Brand Image/Market Positioning
I consider Apple as a strong brand
I can recognize Apple products among other competing brands
I consider Apple as a premium brand
I can quickly recall the symbol or logo of Apple
The Apple brand has a good reputation
Customer Satisfaction
I am satisfied with my decision to choose Apple product
I am satisfied towards the quality of this product
I am comfortable about the relationship with Apple
Out of other brands, Apple comes closest to my idea of an ideal products
Overall Apple products meet my needs/expectations
Customer Loyalty
I consider myself to be loyal to Apple because I feel satisfy
Apple would be my first choice
Even if another brand has the same features with Apple, I would prefer to buy Apple
I say positive things/experience about Apple products
I would recommend Apple products to those who seek my advice about such matters
I am willing to continue repurchase Apple products
I am willing to purchase other variety of Apple products