23
Analysis Software to Verify Mix Designs Iowa DOT Asphalt Team Brian Coree Dan Redmond Mike Heitzman Dan Seward John Hinrichsen Todd Siefken

Analysis Software toVerify Mix Designs
Iowa DOT Asphalt TeamBrian Coree Dan RedmondMike Heitzman Dan SewardJohn Hinrichsen Todd Siefken

Mix Design Information
• Is the design information reasonable?Gyratory Data
% Asphalt Binder 3.85 4.35 4.85 4.87 5.35Corrected Gmb @ N-Des. 2.347 2.370 2.389 2.390 2.415 Number of Gyrations
Max. Sp.Gr. (Gmm) 2.532 2.509 2.490 2.490 2.476 N-Initial% Gmm @ N- Initial 84.8 86.3 87.4 87.5 88.5 8
%Gmm @ N-Max 93.7 95.5 97.1 97.2 98.8 N-Design% Air Voids 7.3 5.5 4.1 4.0 2.5 109
% VMA 14.6 14.2 13.9 13.9 13.5 N-Max% VFA 49.8 60.9 70.9 71.2 81.7 174
Film Thickness 7.27 8.56 9.70 9.74 10.69Filler Bit. Ratio 1.26 1.07 0.95 0.94 0.86
Gsb 2.641 2.641 2.641 2.641 2.641Gse 2.687 2.682 2.682 2.685 2.687 2.647Pbe 3.20 3.78 4.28 4.29 4.71Pba 0.67 0.60 0.60 0.64 0.67
% New Asphalt Binder 100.0 100.0 100.0 100.0 100.0 0.49Asphalt Binder Sp.Gr. @ 25c 1.036 1.036 1.036 1.036 1.036
% Water Abs 1.30 1.30 1.30 1.30 1.30S.A. m^2 / Kg. 4.41 4.41 4.41 4.41 4.41
% + 4 Type 4 Agg. Or Better 100.0 100.0 100.0 100.0 100.0 13.8% + 4 Type 2 or 3 Agg. 25.4 25.4 25.4 25.4 25.4Angularity-method A 45 45 45 45 45% Flat & Elongated 0.0 0.0 0.0 0.0 0.0 Excellent
Sand Equivalent 82 82 82 82 82
Gsb for Angularity
Curve
Mix Check
Method A
Pba / %Abs Ratio
Slope of Compaction
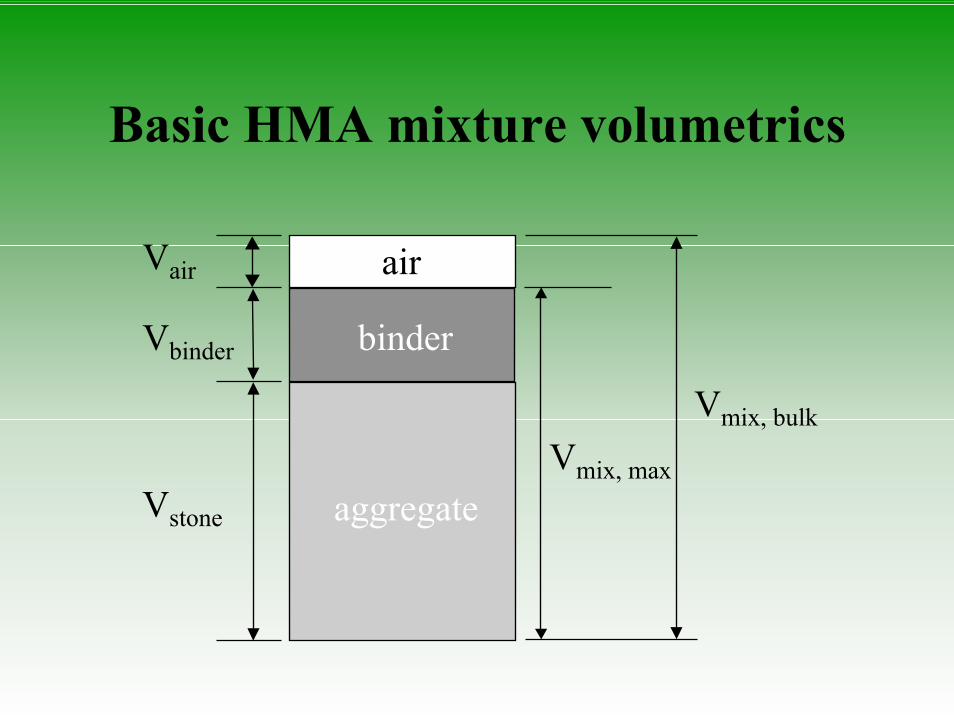
Basic HMA mixture volumetrics
Vair
Vbinder
air
binder
aggregateVstone
Vmix, bulk
Vmix, max

Volumetric Relationship of Gmm
b Sx y +=
seb
bse
bse
mm G100 P
G(GG - (G
G100 +=
))()

Relationship of Gse & Gb
• The resultant value for the slope, S, varies very little within the normal range of the specific gravity of the binder and the effective specific gravity of the aggregate.
• Typical slope range from 0.58 to 0.62.
0.60 slope ))(G(G)G - (G
Sbse
bse ≈==
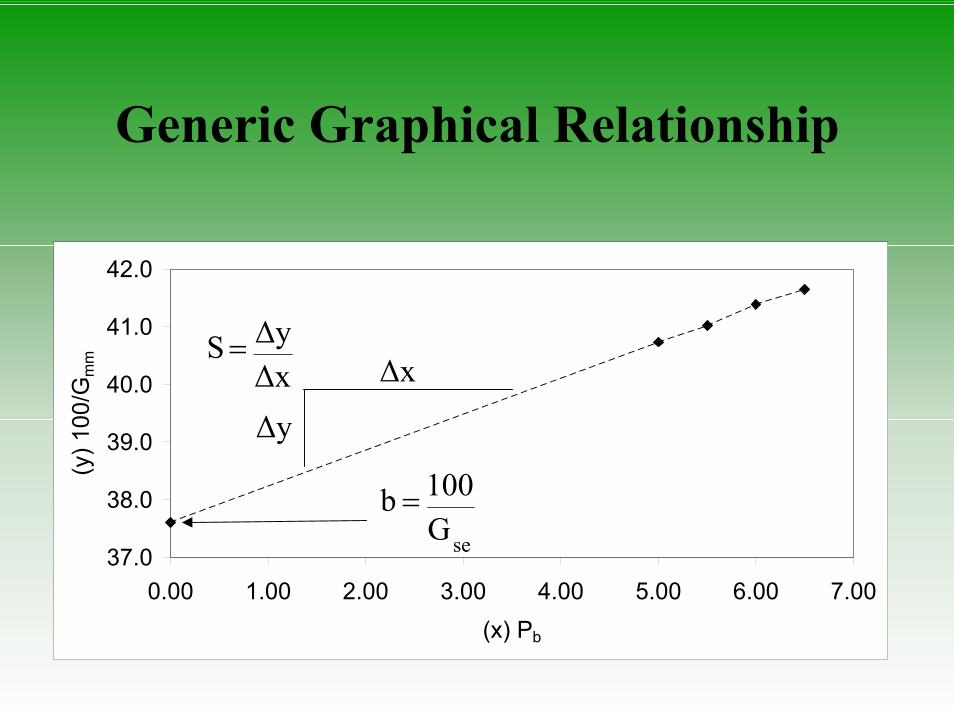
Generic Graphical Relationship
37.0
38.0
39.0
40.0
41.0
42.0
0.00 1.00 2.00 3.00 4.00 5.00 6.00 7.00(x) Pb
(y) 1
00/G
mm ∆x
∆y
seG100 b =
∆x∆y S=

Typical 4-pt. mix design
41.0
41.4
41.8
42.0
40.6
41.0
41.4
41.8
42.2
42.6
5.50 6.00 6.50 7.00 7.50 8.00
Pb
Mix
Vol
ume
Initial Uncorrected
S = 0.72
2.724 b
100 Gse ==

Adjusted 4-pt. mix design
40.6
41.0
41.4
41.8
42.2
42.6
5.50 6.00 6.50 7.00 7.50 8.00
Pb
Mix
Vol
ume
Initial Uncorrected Corrected
41.0
41.1
Gmm differenceS = 0.72
S = 0.6042.042.0

Gmm Diff. Distribution
0
50
100
150
200
250
300
-0.0
22
-0.0
19
-0.0
16
-0.0
13
-0.0
10
-0.0
07
-0.0
04
-0.0
01
0.00
2
0.00
5
0.00
8
0.01
1
0.01
4
0.01
7
0.02
0
0.02
3
Gmm Diff. (original - corrected)
# O
ccur
renc
es
97-01 (765 Designs)

Statistical Analysis of Gmm Diff.
• The average and standard deviation are based on the individual comparisons of each design point.
Average Stdev Low High Low High Low High0.000 0.005 -0.005 0.005 -0.009 0.009 -0.014 0.014
Gmm Difference 1 Stdev 2 Stdev 3 Stdev
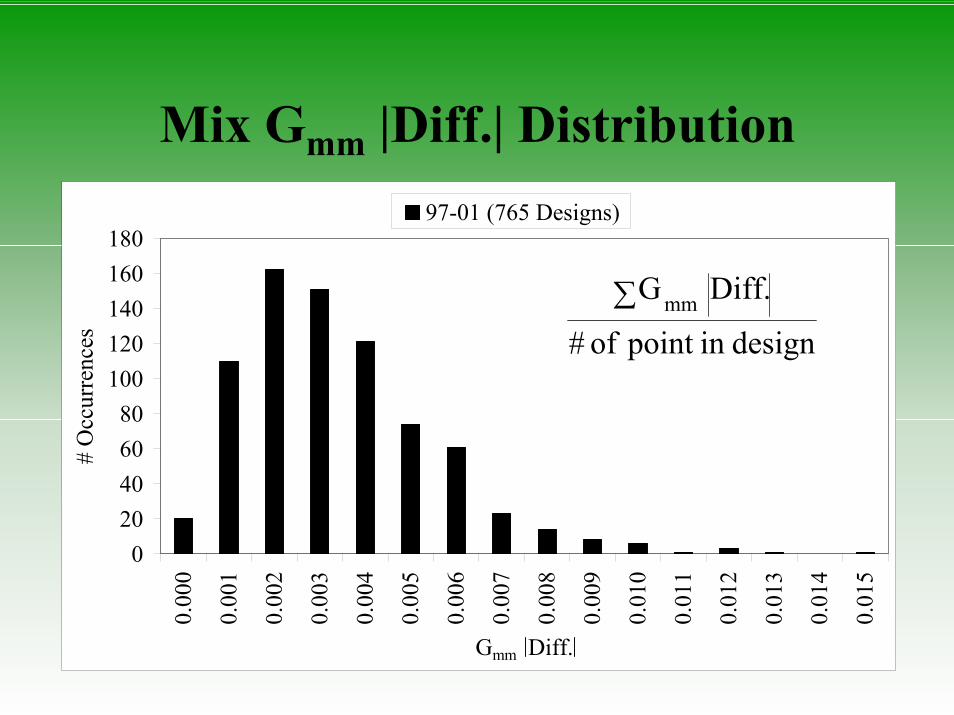
Mix Gmm |Diff.| Distribution
020406080
100120140160180
0.00
0
0.00
1
0.00
2
0.00
3
0.00
4
0.00
5
0.00
6
0.00
7
0.00
8
0.00
9
0.01
0
0.01
1
0.01
2
0.01
3
0.01
4
0.01
5
Gmm Diff.
# O
ccur
renc
es
97-01 (765 Designs)
designin point of #
Diff. Gmm∑

Statistical Analysis of Mix Gmm |Diff.| Distribution
• The average and standard deviation are based on the average Gmm difference of each design on an absolute basis.
1 Stdev 2 Stdev 3 StdevAverage Stdev
0.003 0.002 0.006 0.008 0.010
Gmm Difference

Adjusted 4-pt. mix design
40.6
41.0
41.4
41.8
42.2
42.6
5.50 6.00 6.50 7.00 7.50 8.00
Pb
Mix
Vol
ume
Initial Uncorrected Corrected
41.0
41.1
Gmm differenceS = 0.72
S = 0.6042.042.0

Mix Gmm Slope (S) Diff. Distribution
0
10
20
30
40
50
-0.3
9
-0.3
5
-0.3
1
-0.2
7
-0.2
3
-0.1
9
-0.1
5
-0.1
1
-0.0
7
-0.0
3
0.01
0.05
0.09
0.13
0.17
0.21
0.25
0.29
Smu-Smc (original - corrected)
# O
ccur
renc
es
97-01 (765 Designs)
Soriginal - Scorrected
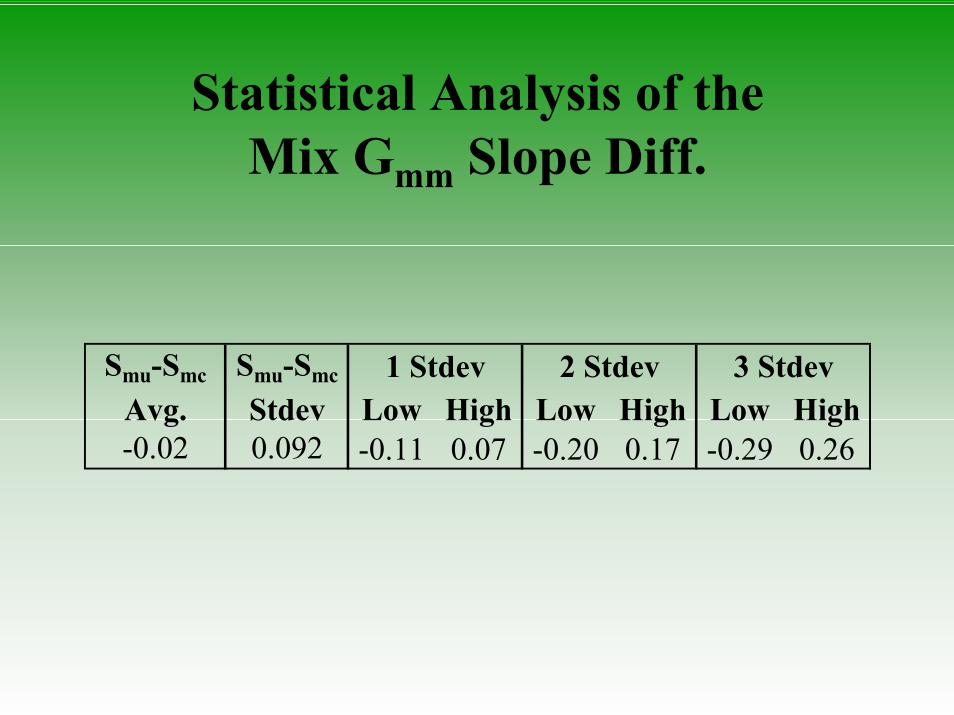
Statistical Analysis of the Mix Gmm Slope Diff.
Smu-Smc Smu-Smc
Avg. Stdev Low High Low High Low High-0.02 0.092 -0.11 0.07 -0.20 0.17 -0.29 0.26
1 Stdev 2 Stdev 3 Stdev

Mix Gmm |Diff.| vs. Mix Gmm Slope Diff.
0.000
0.002
0.004
0.006
0.008
0.010
0.012
0.014
0.016
-0.40 -0.30 -0.20 -0.10 0.00 0.10 0.20 0.30 0.40
Slope Diff.
Gm
m D
iff.
97-01 (765 Designs)
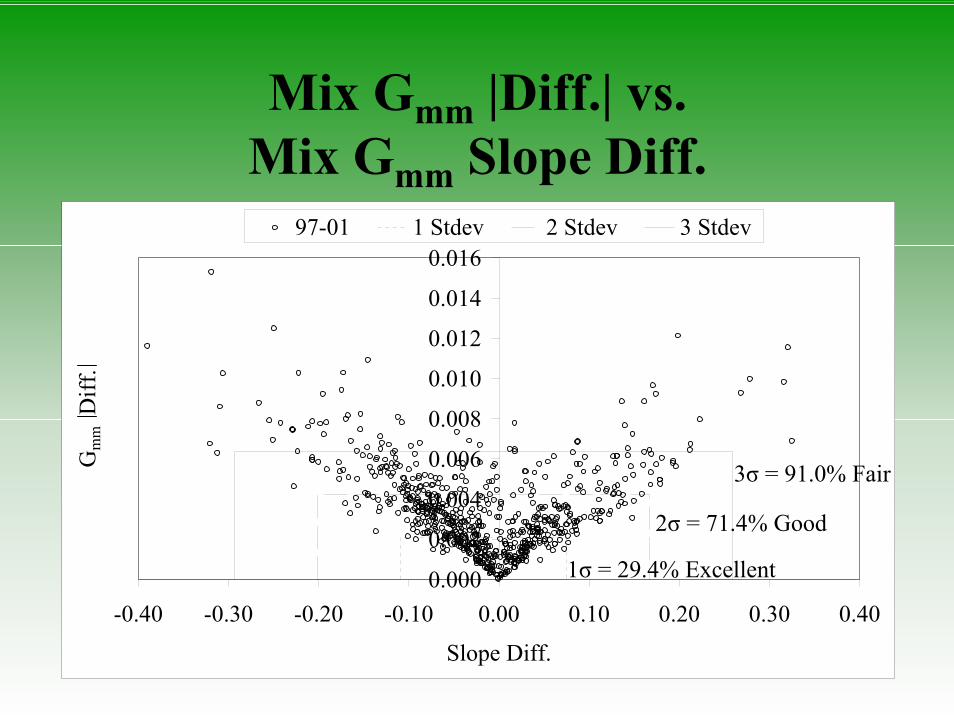
Mix Gmm |Diff.| vs. Mix Gmm Slope Diff.
0.000
0.002
0.004
0.006
0.008
0.010
0.012
0.014
0.016
-0.40 -0.30 -0.20 -0.10 0.00 0.10 0.20 0.30 0.40
Slope Diff.
Gm
m D
iff.
97-01 1 Stdev 2 Stdev 3 Stdev
3σ = 91.0% Fair
2σ = 71.4% Good
1σ = 29.4% Excellent

Case Study No. 1Excellent Mix Design
39.8
40.1
40.5
39.4
39.6
39.8
40.0
40.2
40.4
40.6
40.8
4.50 5.00 5.50 6.00 6.50
Pb
Mix
Vol
ume
Initial Uncorrected CorrectedGmm Difference vs. Slope Difference
0.000
0.002
0.004
0.006
0.008
0.010
0.012
0.014
0.016
-0.40 -0.30 -0.20 -0.10 0.00 0.10 0.20 0.30 0.40
Slope Difference
Gm
m D
iffer
ence
∆S = 0.05
∆Gmm = 0.001
40.1
39.8
40.4

Case Study No. 2Poor Mix Design
40.8
41.6
42.0
42.2
40.4
40.8
41.2
41.6
42.0
42.4
5.00 5.50 6.00 6.50 7.00 7.50
Pb
Mix
Vol
ume
Initial Uncorrected Corrected
Gmm Difference vs. Slope Difference
0.000
0.002
0.004
0.006
0.008
0.010
0.012
0.014
0.016
-0.40 -0.30 -0.20 -0.10 0.00 0.10 0.20 0.30 0.40
Slope Difference
Gm
m Diff
eren
ce
Bad data point
Adjusted JMF41.5
41.8
42.1
41.2

Case Study No. 3Poor Mix Design
40.4 40.5
40.840.7
39.6
40.0
40.4
40.8
41.2
41.6
4.50 5.00 5.50 6.00 6.50
Pb
Mix
Vol
ume
Initial Uncorrected CorrectedGmm Difference vs. Slope Difference
0.000
0.002
0.004
0.006
0.008
0.010
0.012
0.014
0.016
-0.40 -0.30 -0.20 -0.10 0.00 0.10 0.20 0.30 0.40
Slope Difference
Gm
m D
iffer
ence
Bad data points???
41.1
40.8
40.5
40.2

SHADES Mix Design Software (Excel) Mix Check Tab
Smbu Smmc Smmu
-0.79 0.59 0.60
Vmb Vmm
r2 r2
2.685 1.00 0.99
Gse
Mix Check
ExcellentCheckMix Volume vs. Binder Content
39.0
39.5
40.0
40.5
41.0
41.5
42.0
42.5
43.0
3.50 4.00 4.50 5.00 5.50
Binder Content
Mix
Vol
ume
Vmmi
Vmmu
Vmmc
Vmmd
Vmbi
Vmbu
Vmbd

Summary of 2003 JMF Mix Check
Excellent Good Fair Poor
0.0%Designs Received 36.0% 54.0% 10.0%
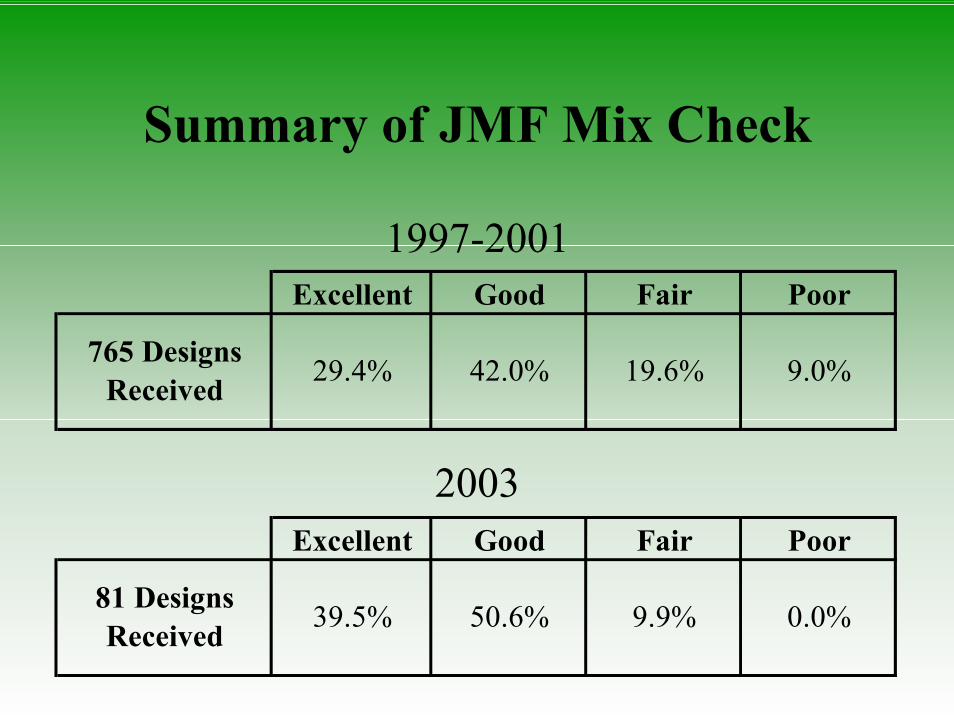
Summary of JMF Mix Check
1997-2001
2003
Excellent Good Fair Poor
42.0% 19.6% 9.0%765 Designs Received 29.4%
Excellent Good Fair Poor
50.6% 9.9% 0.0%81 Designs Received 39.5%

![arXiv:1608.07513v2 [cond-mat.str-el] 6 Oct 2016 · bay, Mumbai, India. ... Rp 5.14% Rexp 4.87% Rwp 6.62% RBragg 4.91% ... with stimulated echo and Hahn spin-echo pulse protocols,](https://static.documents.pub/doc/80x56/5b8a71bf7f8b9a82418c33d6/arxiv160807513v2-cond-matstr-el-6-oct-2016-bay-mumbai-india-rp-514.jpg)


![Table of Contents · SD BA conv. ø SD [%] 16.1 15.2 0.767 33.0 4 15.2 34.9 34.3 1.490 14.5 33.9 31.0 30.9 0.154 23.4 5 31.1 26.2 25.9 2.370 30.8 28.1 41.8 41.6 0.321 07.7 6 41.4](https://static.documents.pub/doc/80x56/5fbaec15d252f247a73e3c0f/table-of-sd-ba-conv-sd-161-152-0767-330-4-152-349-343-1490-145.jpg)


