62
Analyst Day December 6, 2007 KAR Holdings, Inc.
| Date post: | 26-Dec-2015 |
| Category: |
Documents |
| Upload: | sharyl-carpenter |
| View: | 219 times |
| Download: | 2 times |
Analyst Day
December 6, 2007
KAR Holdings, Inc.
2
Forward-Looking Statements
This presentation includes forward-looking statements within the meaning of the Private Securities Litigation Reform Act of 1995. Such statements are subject to certain risks, trends, and uncertainties that could cause actual results to differ materially from those projected, expressed or implied by such forward-looking statements. Many of these risk factors are outside of the company’s control, and as such, they involve risks which are not currently known to the company that could cause actual results to differ materially from forecasted results. The forward-looking statements in this document are made as of the date hereof and the company does not undertake to update its forward-looking statements.

3
AGENDA
• Industry Update - Tom Kontos
• Corporate Update - Eric Loughmiller
• Q&A
Copyright 2007 ADESA, Inc.
Used Vehicle Market Conditions and Outlook
Tom KontosExecutive Vice-PresidentCustomer Strategies and
AnalyticsADESA
December 2007
Copyright 2007 ADESA, Inc. All rights reserved. The information provided here was compiled by and is proprietary to ADESA, Inc. It is for informational purposes only and its accuracy is not warranted. It is intended for the benefit of the named recipient, and may not be relied upon or utilized for any other purpose or by any other person and may not be made available to any other person without the express written permission of ADESA, Inc.
5
ADESA Analytical Services Reports
Plus monthly postings on:www.adesa.com/kontoskorner
Contact Tom [email protected]/249-4235
6
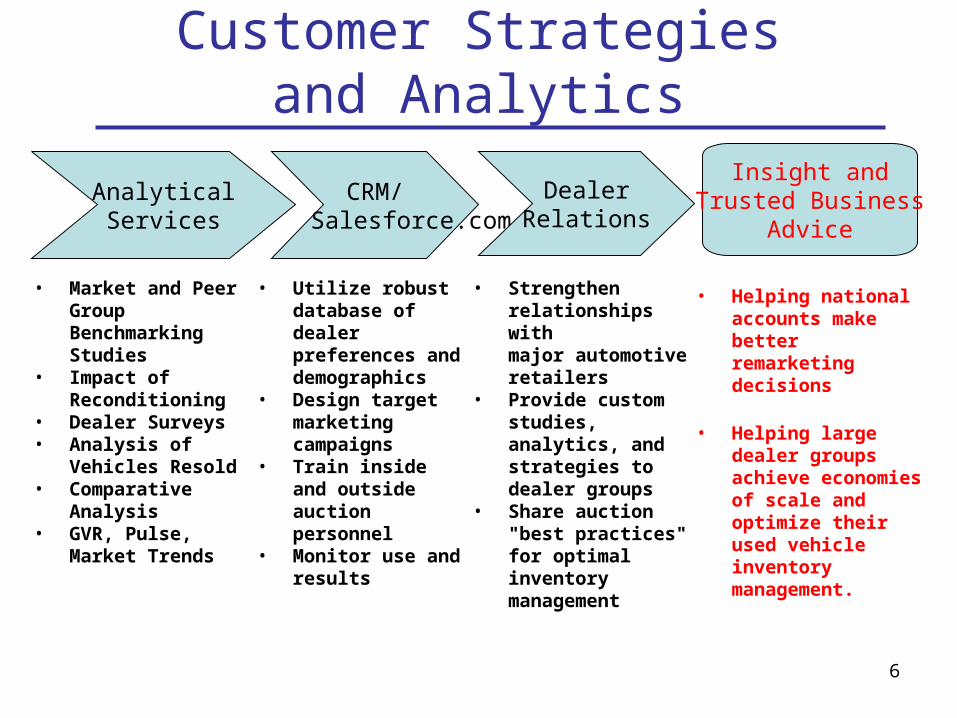
Customer Strategies and Analytics
AnalyticalServices
CRM/ Salesforce.com
DealerRelations
Insight andTrusted Business
Advice
• Market and Peer Group Benchmarking Studies
• Impact of Reconditioning
• Dealer Surveys• Analysis of
Vehicles Resold• Comparative
Analysis • GVR, Pulse,
Market Trends
• Utilize robust database of dealer preferences and demographics
• Design target marketing campaigns
• Train inside and outside auction personnel
• Monitor use and results
• Strengthen relationships with major automotive retailers
• Provide custom studies, analytics, and strategies to dealer groups
• Share auction "best practices" for optimal inventory management
• Helping national accounts make better remarketing decisions
• Helping large dealer groups achieve economies of scale and optimize their used vehicle inventory management.

General Economy
8
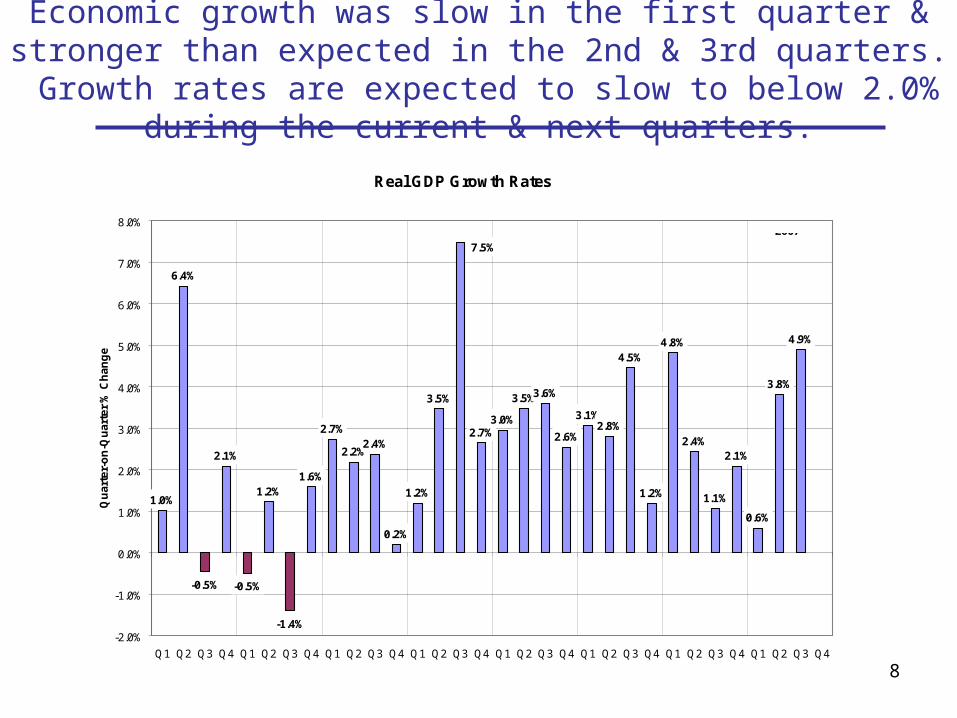
Economic growth was slow in the first quarter & stronger than expected in the 2nd & 3rd quarters. Growth rates are expected to
slow to below 2.0% during the current & next quarters.
Real GDP Growth Rates
1.0%
6.4%
-0.5%
2.1%
-0.5%
-1.4%
1.6%
2.7%
2.2%2.4%
0.2%
1.2%
3.5%
2.7%
3.5%3.6%
2.6%
3.1%2.8%
4.5%
1.2%
4.8%
2.4%
1.1%
2.1%
0.6%
3.8%
4.9%
7.5%
3.0%
1.2%
-2.0%
-1.0%
0.0%
1.0%
2.0%
3.0%
4.0%
5.0%
6.0%
7.0%
8.0%
Q1 Q2 Q3 Q4 Q1 Q2 Q3 Q4 Q1 Q2 Q3 Q4 Q1 Q2 Q3 Q4 Q1 Q2 Q3 Q4 Q1 Q2 Q3 Q4 Q1 Q2 Q3 Q4 Q1 Q2 Q3 Q4
Qu
arte
r-o
n-Q
uar
ter
% C
han
ge
2000 2001 2002 2003 2004 2005 2006 2007
9
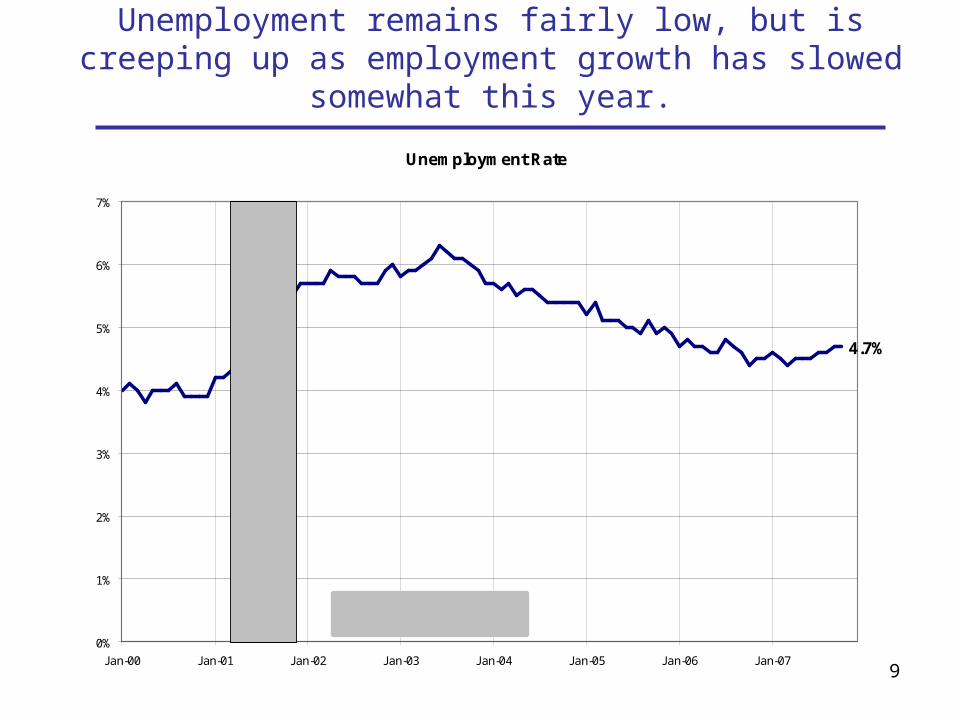
Unemployment remains fairly low, but is creeping up as employment growth has slowed somewhat this year.
Unemployment Rate
4.7%
0%
1%
2%
3%
4%
5%
6%
7%
Jan-00 Jan-01 Jan-02 Jan-03 Jan-04 Jan-05 Jan-06 Jan-07
Recession: March - November 2001
10
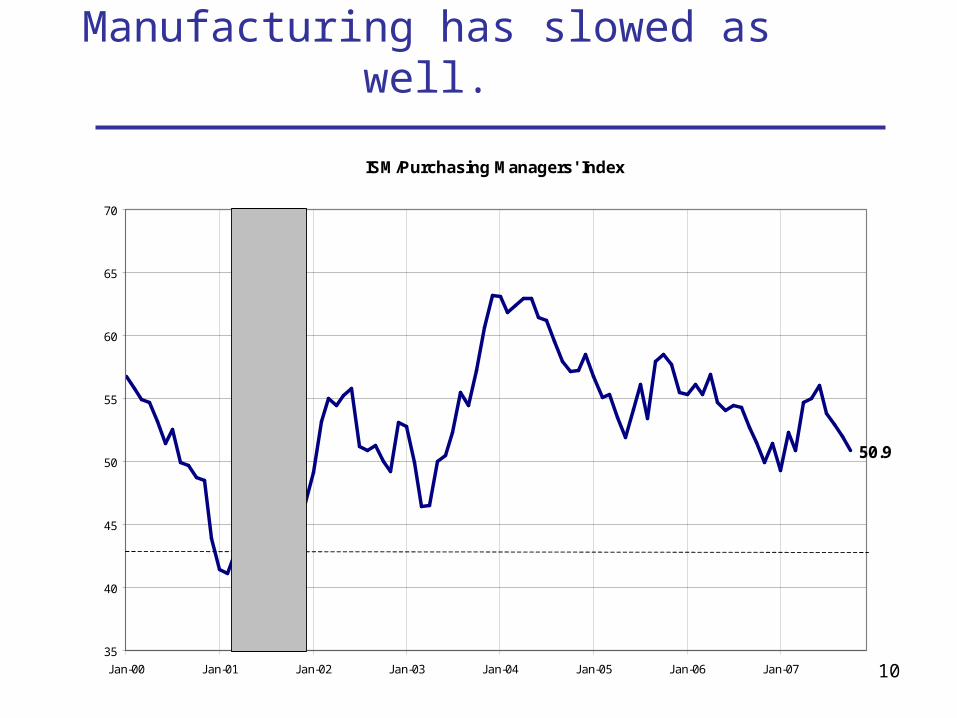
Manufacturing has slowed as well.
ISM/Purchasing Managers' Index
50.9
35
40
45
50
55
60
65
70
Jan-00 Jan-01 Jan-02 Jan-03 Jan-04 Jan-05 Jan-06 Jan-07
Recession Warning Level (42.7)
Manufacturing Sector Breakeven Level (50.0)
11
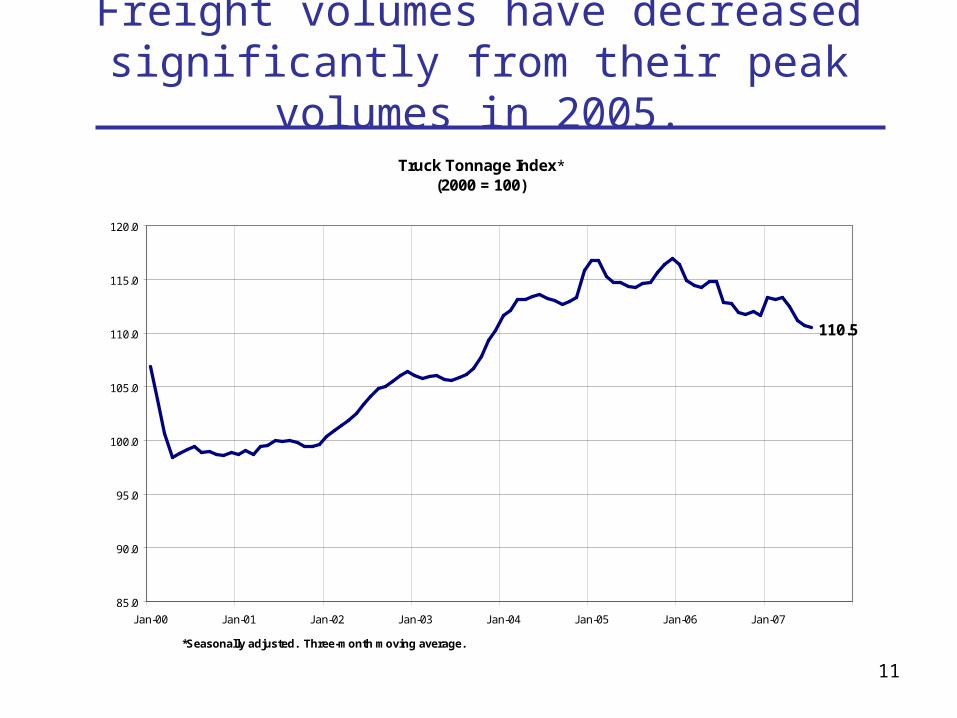
Freight volumes have decreased significantly from their peak volumes in 2005.
Truck Tonnage Index*(2000 = 100)
110.5
85.0
90.0
95.0
100.0
105.0
110.0
115.0
120.0
Jan-00 Jan-01 Jan-02 Jan-03 Jan-04 Jan-05 Jan-06 Jan-07
*Seasonally adjusted. Three-month moving average.
12
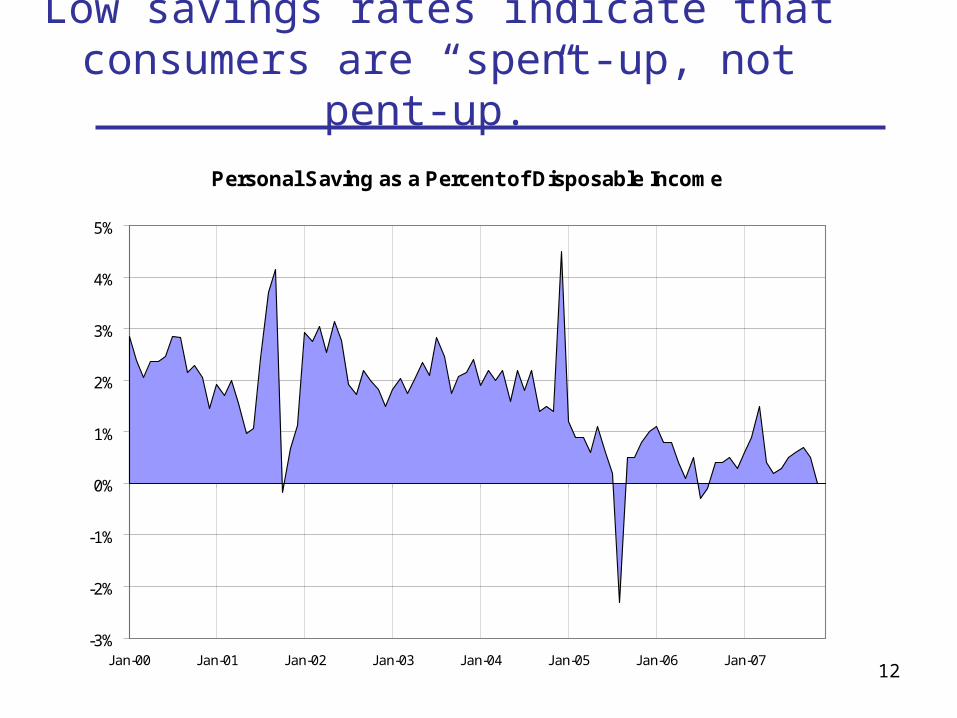
Low savings rates indicate that consumers are “spent-up, not pent-up.”
Personal Saving as a Percent of Disposable Income
-3%
-2%
-1%
0%
1%
2%
3%
4%
5%
Jan-00 Jan-01 Jan-02 Jan-03 Jan-04 Jan-05 Jan-06 Jan-07
13
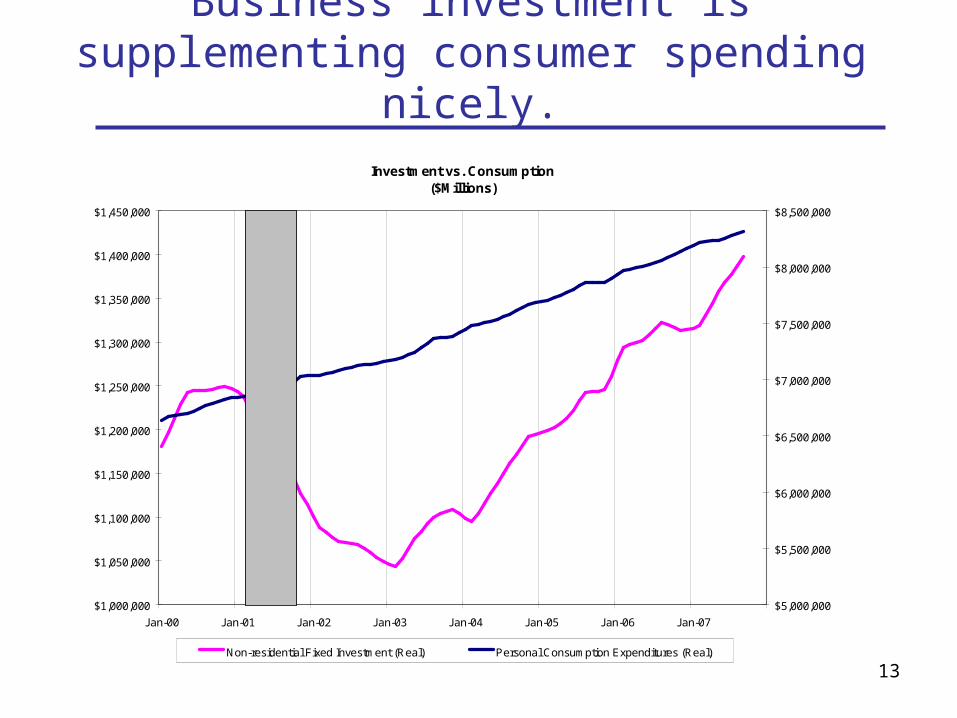
Business investment is supplementing consumer spending nicely.
Investment vs. Consumption($Millions)
$1,000,000
$1,050,000
$1,100,000
$1,150,000
$1,200,000
$1,250,000
$1,300,000
$1,350,000
$1,400,000
$1,450,000
Jan-00 Jan-01 Jan-02 Jan-03 Jan-04 Jan-05 Jan-06 Jan-07
$5,000,000
$5,500,000
$6,000,000
$6,500,000
$7,000,000
$7,500,000
$8,000,000
$8,500,000
Non-residential Fixed Investment (Real) Personal Consumption Expenditures (Real)
14
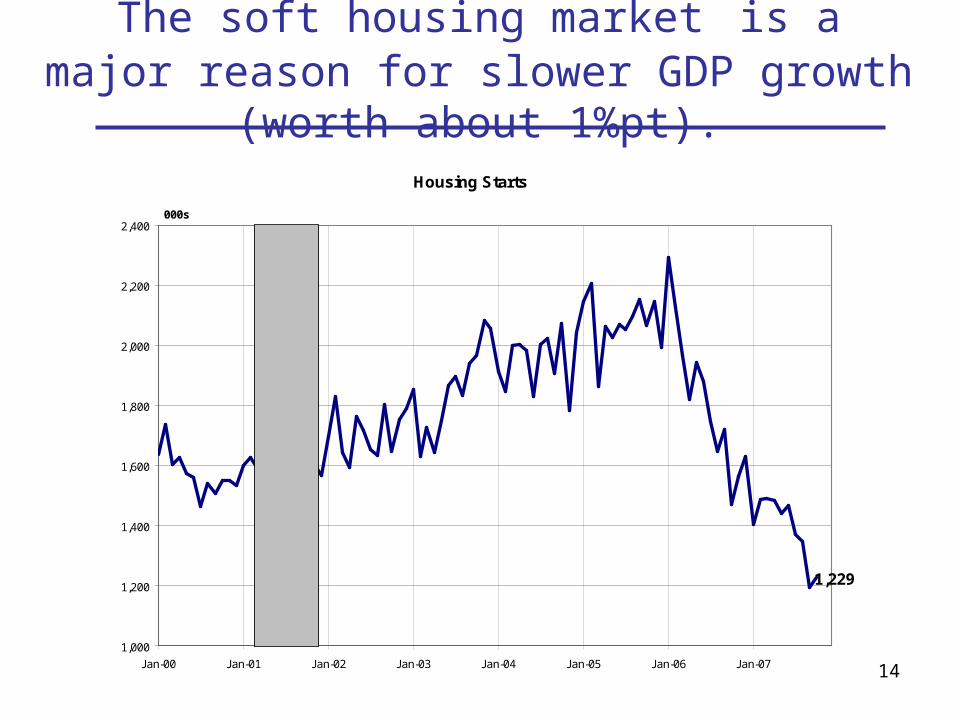
The soft housing market is a major reason for slower GDP growth (worth about 1%pt).
Housing Starts
1,229
1,000
1,200
1,400
1,600
1,800
2,000
2,200
2,400
Jan-00 Jan-01 Jan-02 Jan-03 Jan-04 Jan-05 Jan-06 Jan-07
000s
15
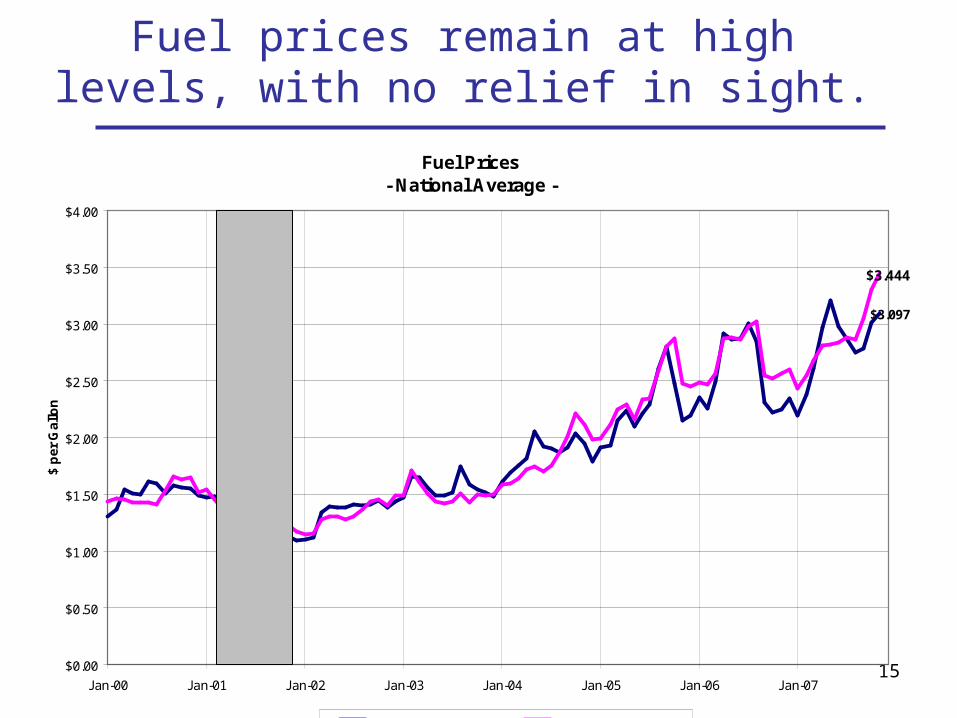
Fuel prices remain at high levels, with no relief in sight.
Fuel Prices - National Average -
$3.097
$3.444
$0.00
$0.50
$1.00
$1.50
$2.00
$2.50
$3.00
$3.50
$4.00
Jan-00 Jan-01 Jan-02 Jan-03 Jan-04 Jan-05 Jan-06 Jan-07
$ p
er G
allo
n
Gasoline (Reg Unld) Diesel (On-Highway)

Remarketing Industry Supply
17
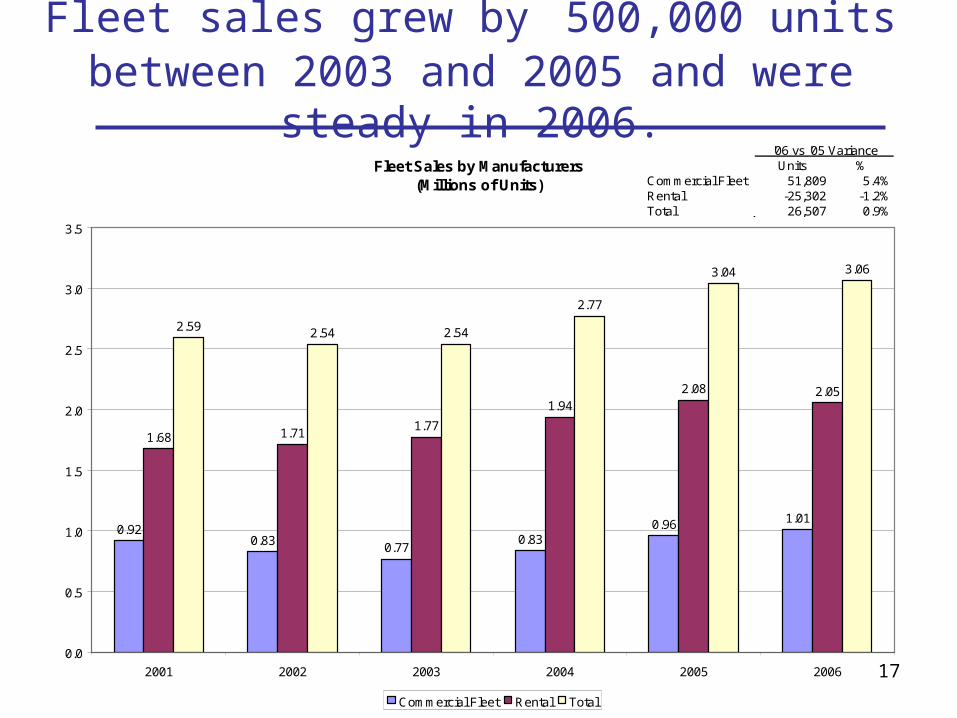
Fleet sales grew by 500,000 units between 2003 and 2005 and were steady in 2006.
Fleet Sales by Manufacturers(Millions of Units)
0.920.83
0.770.83
0.96 1.01
1.68 1.711.77
1.942.08 2.05
2.59 2.54 2.54
2.77
3.04 3.06
0.0
0.5
1.0
1.5
2.0
2.5
3.0
3.5
2001 2002 2003 2004 2005 2006
Commercial Fleet Rental Total(Commercial Fleet figures include government units.)
Units %Commercial Fleet 51,809 5.4%Rental -25,302 -1.2%Total 26,507 0.9%
'06 vs '05 Variance
18
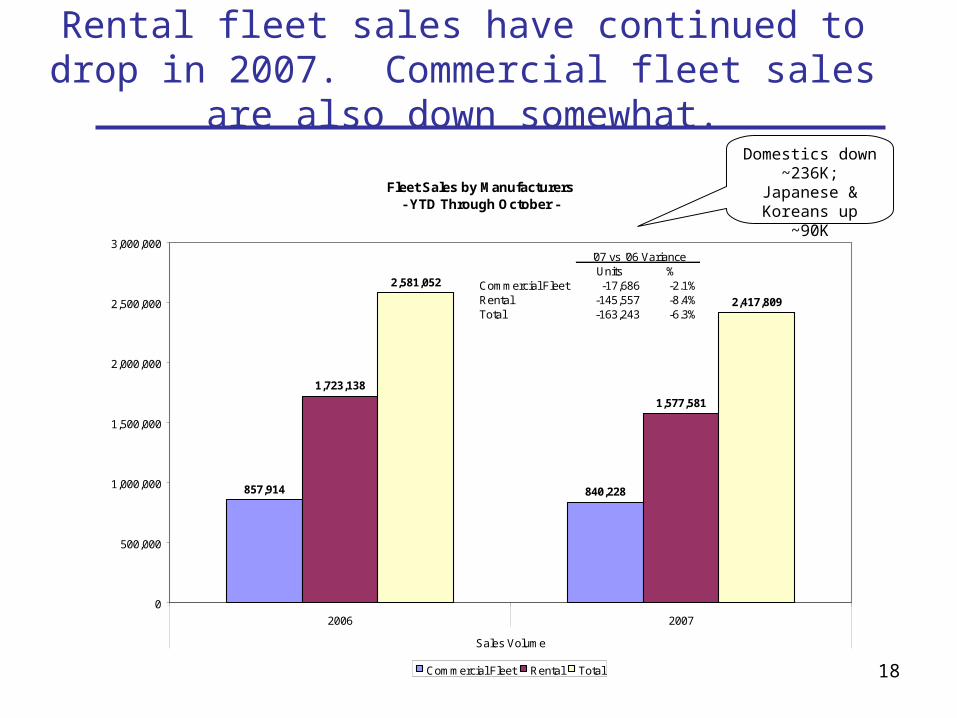
Rental fleet sales have continued to drop in 2007. Commercial fleet sales are also down somewhat.
Domestics down ~236K; Japanese
& Koreans up ~90K
Fleet Sales by Manufacturers- YTD Through October -
857,914 840,228
1,723,138
1,577,581
2,581,052
2,417,809
0
500,000
1,000,000
1,500,000
2,000,000
2,500,000
3,000,000
2006 2007
Sales Volume
Commercial Fleet Rental Total
Units %Commercial Fleet -17,686 -2.1%Rental -145,557 -8.4%Total -163,243 -6.3%
'07 vs '06 Variance
19
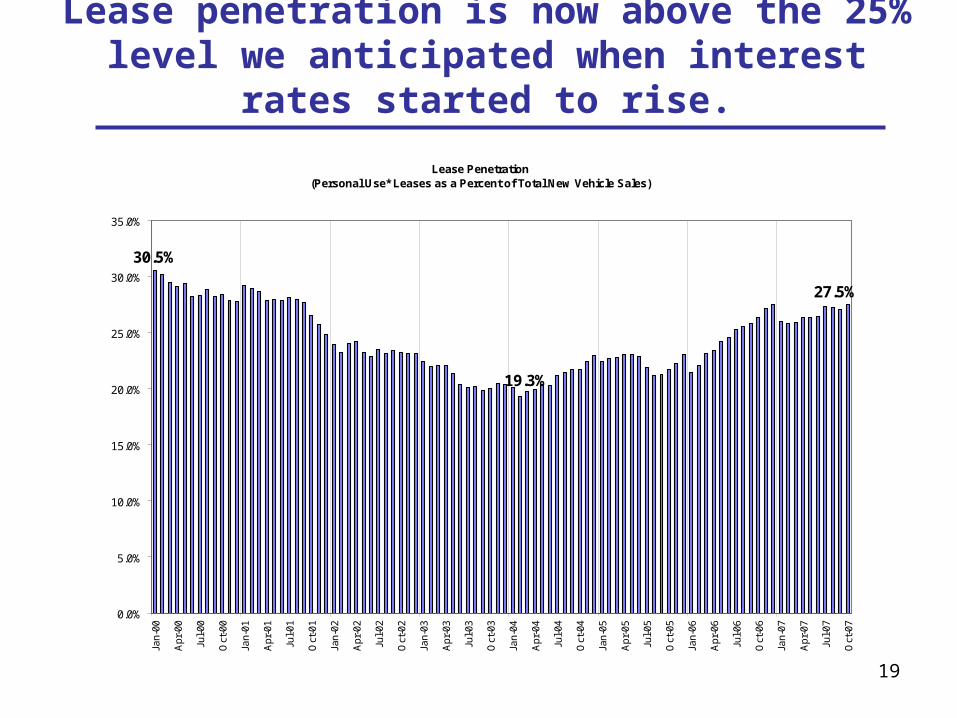
Lease penetration is now above the 25% level we anticipated when interest rates started to rise.
Lease Penetration(Personal Use* Leases as a Percent of Total New Vehicle Sales)
27.5%
30.5%
19.3%
0.0%
5.0%
10.0%
15.0%
20.0%
25.0%
30.0%
35.0%
Jan-
00
Apr
-00
Jul-0
0
Oct
-00
Jan-
01
Apr
-01
Jul-0
1
Oct
-01
Jan-
02
Apr
-02
Jul-0
2
Oct
-02
Jan-
03
Apr
-03
Jul-0
3
Oct
-03
Jan-
04
Apr
-04
Jul-0
4
Oct
-04
Jan-
05
Apr
-05
Jul-0
5
Oct
-05
Jan-
06
Apr
-06
Jul-0
6
Oct
-06
Jan-
07
Apr
-07
Jul-0
7
Oct
-07
*"Personal use" leases are leases on vehicles used by businesses that are also used at least 20% of the time for personal use.
20
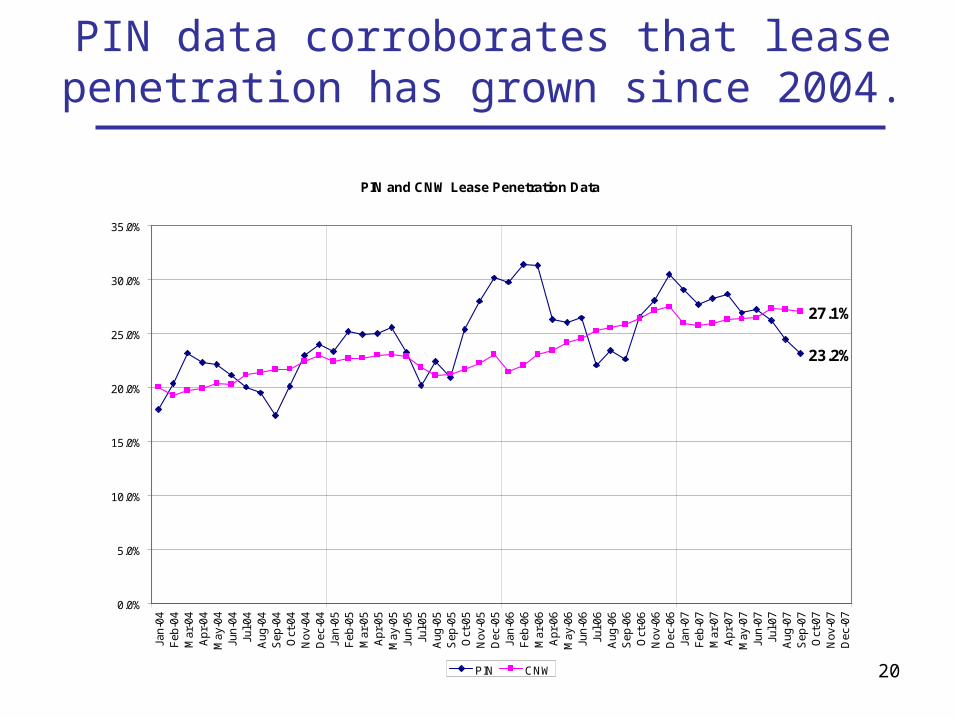
PIN data corroborates that lease penetration has grown since 2004.
PIN and CNW Lease Penetration Data
23.2%
27.1%
0.0%
5.0%
10.0%
15.0%
20.0%
25.0%
30.0%
35.0%
Jan-
04F
eb-0
4M
ar-0
4A
pr-0
4M
ay-0
4Ju
n-04
Jul-0
4A
ug-0
4S
ep-0
4O
ct-0
4N
ov-0
4D
ec-0
4Ja
n-05
Feb
-05
Mar
-05
Apr
-05
May
-05
Jun-
05Ju
l-05
Aug
-05
Sep
-05
Oct
-05
Nov
-05
Dec
-05
Jan-
06F
eb-0
6M
ar-0
6A
pr-0
6M
ay-0
6Ju
n-06
Jul-0
6A
ug-0
6S
ep-0
6O
ct-0
6N
ov-0
6D
ec-0
6Ja
n-07
Feb
-07
Mar
-07
Apr
-07
May
-07
Jun-
07Ju
l-07
Aug
-07
Sep
-07
Oct
-07
Nov
-07
Dec
-07
PIN CNW
21
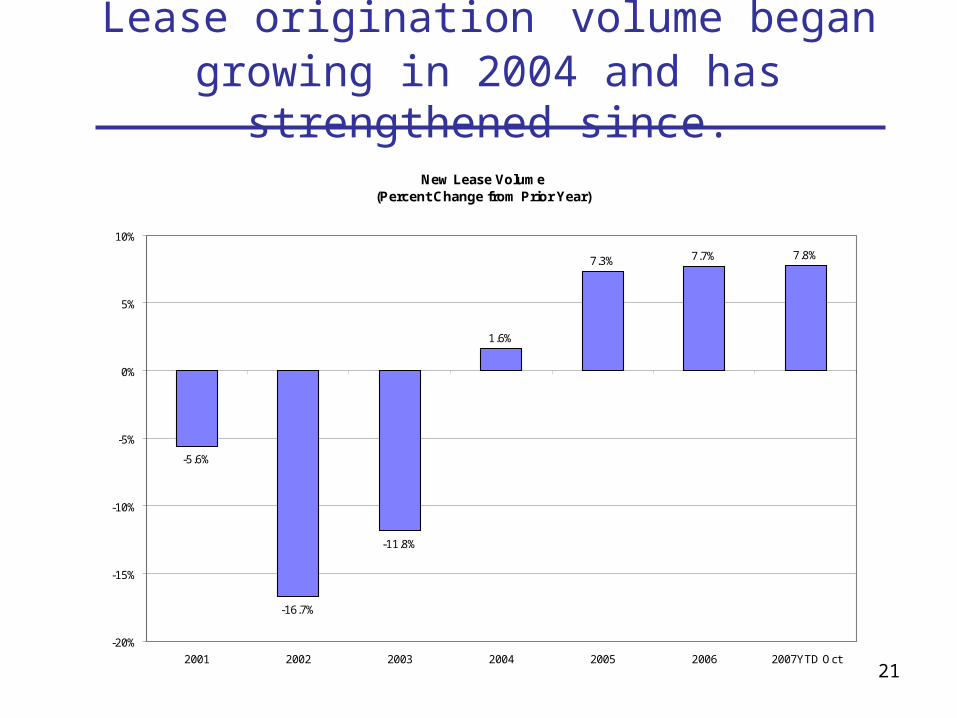
Lease origination volume began growing in 2004 and has strengthened since.
New Lease Volume(Percent Change from Prior Year)
-5.6%
-16.7%
-11.8%
1.6%
7.3% 7.7% 7.8%
-20%
-15%
-10%
-5%
0%
5%
10%
2001 2002 2003 2004 2005 2006 2007YTD Oct
22
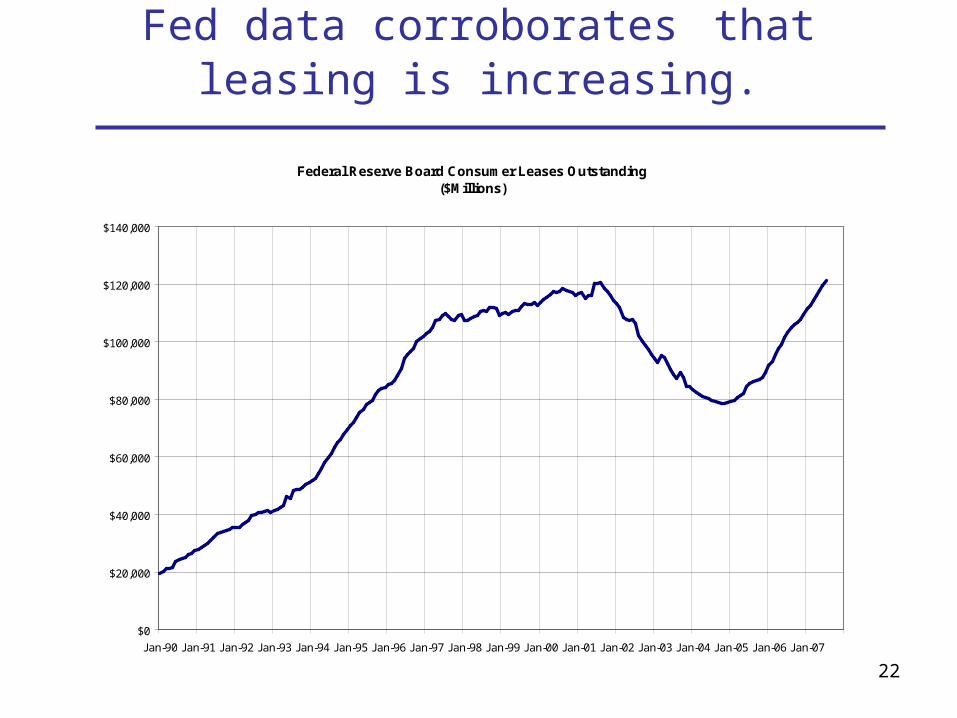
Fed data corroborates that leasing is increasing.
Federal Reserve Board Consumer Leases Outstanding($Millions)
$0
$20,000
$40,000
$60,000
$80,000
$100,000
$120,000
$140,000
Jan-90 Jan-91 Jan-92 Jan-93 Jan-94 Jan-95 Jan-96 Jan-97 Jan-98 Jan-99 Jan-00 Jan-01 Jan-02 Jan-03 Jan-04 Jan-05 Jan-06 Jan-07
23
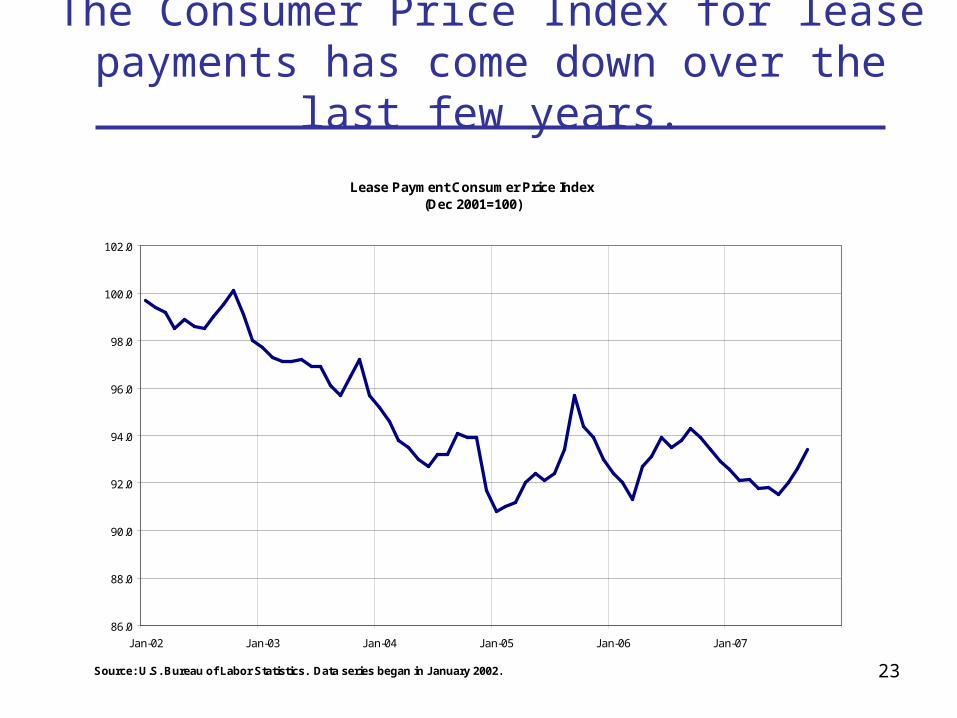
The Consumer Price Index for lease payments has come down over the last few years.
Lease Payment Consumer Price Index(Dec 2001=100)
86.0
88.0
90.0
92.0
94.0
96.0
98.0
100.0
102.0
Jan-02 Jan-03 Jan-04 Jan-05 Jan-06 Jan-07
Source: U.S. Bureau of Labor Statistics. Data series began in January 2002.
24
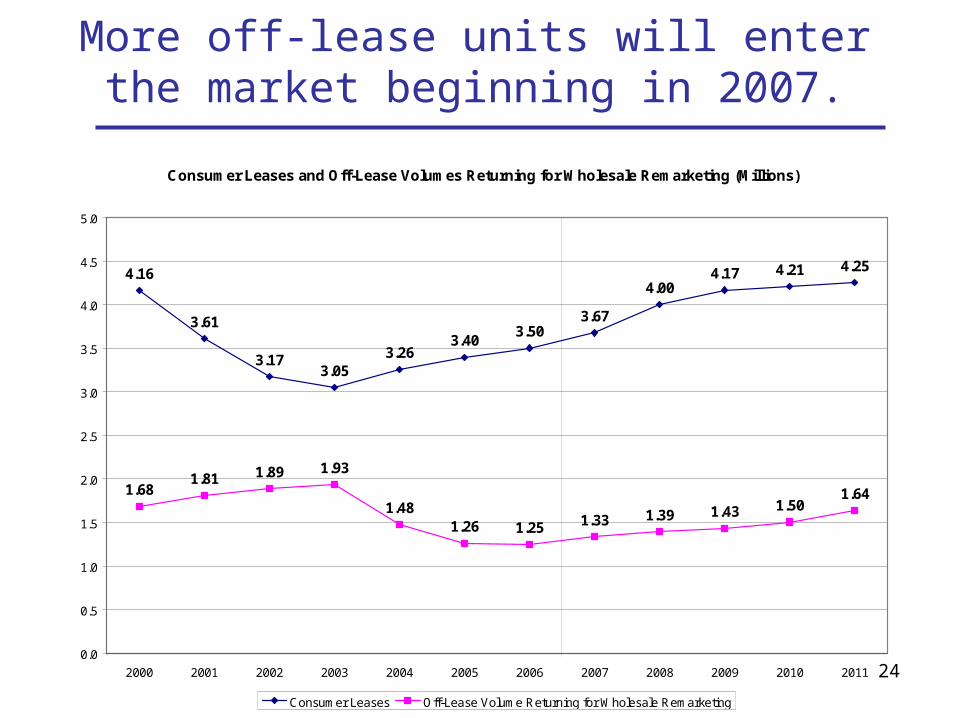
More off-lease units will enter the market beginning in 2007.
Consumer Leases and Off-Lease Volumes Returning for Wholesale Remarketing (Millions)
4.16
3.61
3.173.05
3.263.40
3.503.67
4.004.17 4.21 4.25
1.681.81 1.89 1.93
1.481.26 1.25 1.33 1.39 1.43 1.50
1.64
0.0
0.5
1.0
1.5
2.0
2.5
3.0
3.5
4.0
4.5
5.0
2000 2001 2002 2003 2004 2005 2006 2007 2008 2009 2010 2011
Consumer Leases Off-Lease Volume Returning for Wholesale Remarketing
History Projections
25
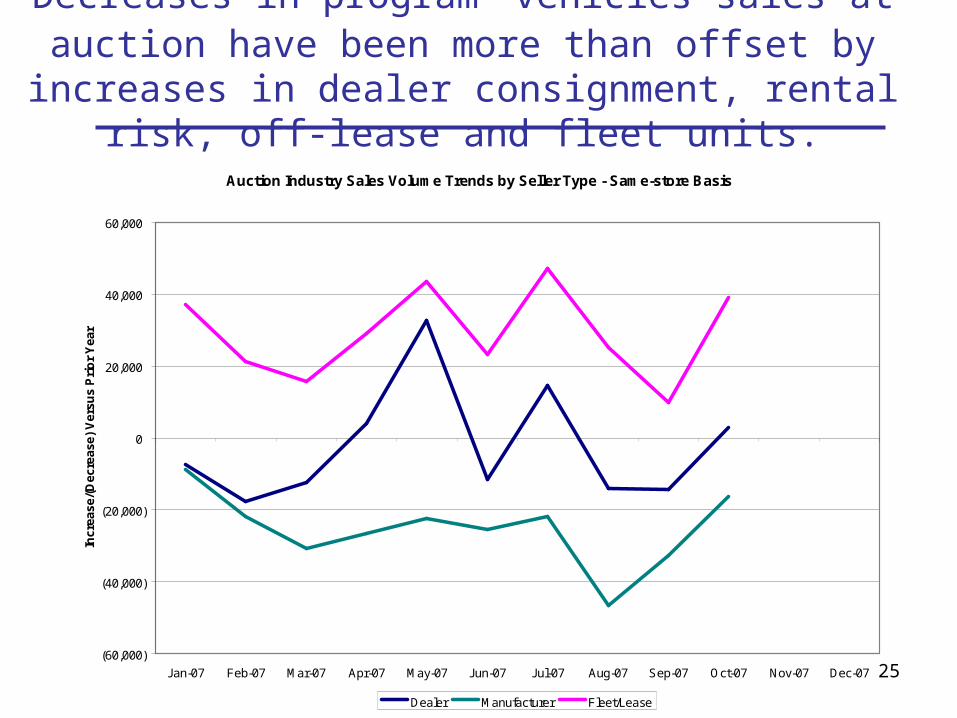
Decreases in program vehicles sales at auction have been more than offset by increases in dealer
consignment, rental risk, off-lease and fleet units.
Auction Industry Sales Volume Trends by Seller Type - Same-store Basis
(60,000)
(40,000)
(20,000)
0
20,000
40,000
60,000
Jan-07 Feb-07 Mar-07 Apr-07 May-07 Jun-07 Jul-07 Aug-07 Sep-07 Oct-07 Nov-07 Dec-07
Incr
ease
/(D
ecre
ase)
Ver
sus
Pri
or
Yea
r
Dealer Manufacturer Fleet/Lease
26
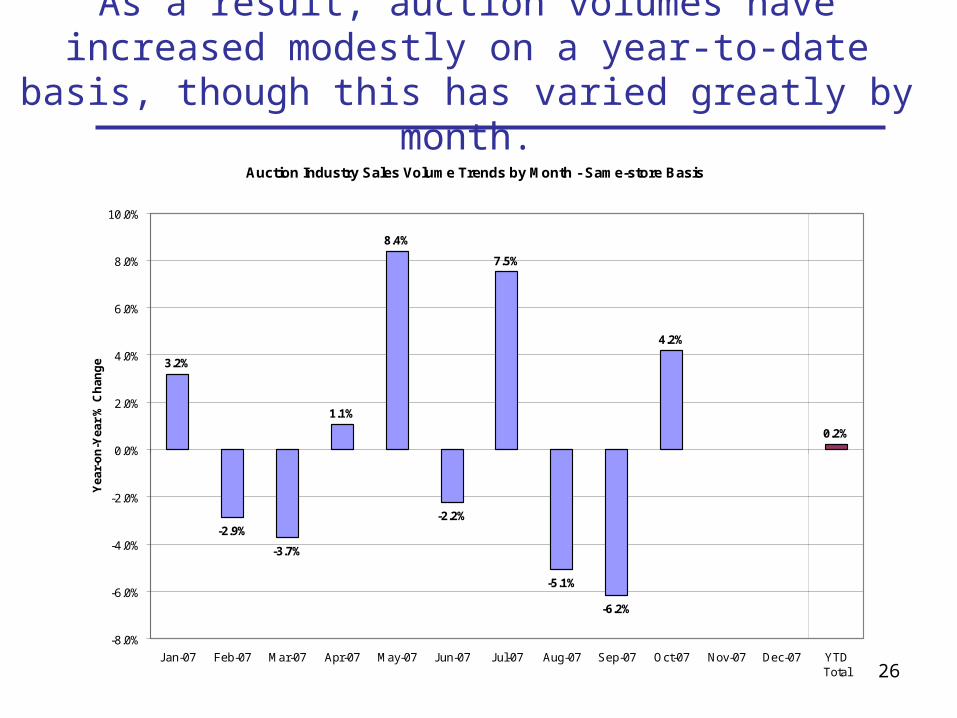
As a result, auction volumes have increased modestly on a year-to-date basis, though this has varied greatly
by month.Auction Industry Sales Volume Trends by Month - Same-store Basis
3.2%
-2.9%
-3.7%
1.1%
8.4%
-2.2%
-5.1%
-6.2%
4.2%
0.2%
7.5%
-8.0%
-6.0%
-4.0%
-2.0%
0.0%
2.0%
4.0%
6.0%
8.0%
10.0%
Jan-07 Feb-07 Mar-07 Apr-07 May-07 Jun-07 Jul-07 Aug-07 Sep-07 Oct-07 Nov-07 Dec-07 YTDTotal
Yea
r-o
n-Y
ear
% C
han
ge

Retail Vehicle Markets
28
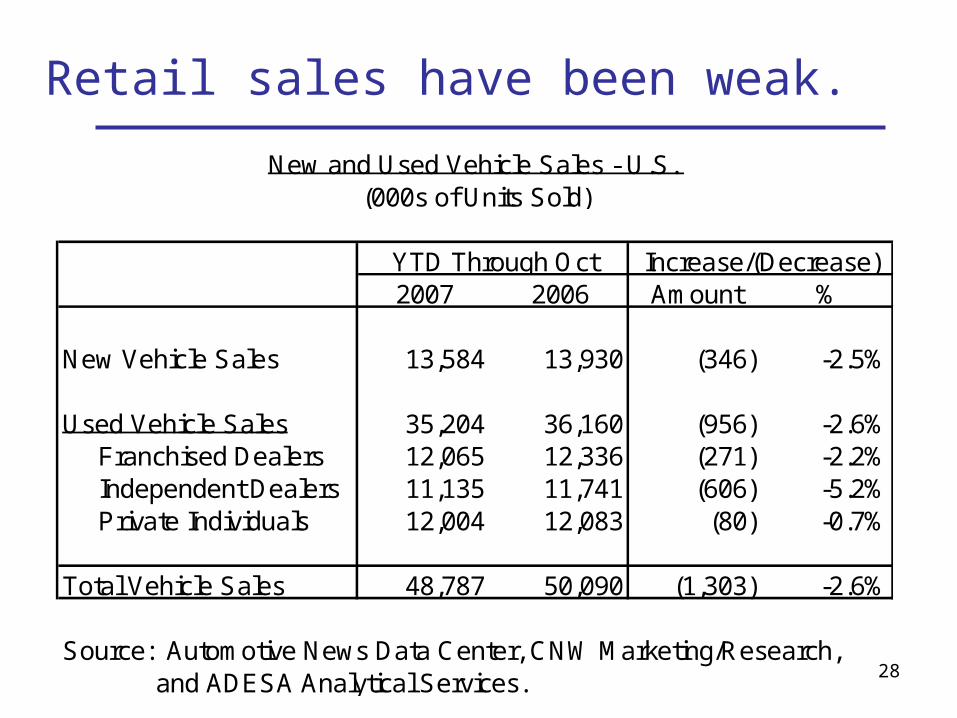
Retail sales have been weak.
2007 2006 Amount %
New Vehicle Sales 13,584 13,930 (346) -2.5%
Used Vehicle Sales 35,204 36,160 (956) -2.6% Franchised Dealers 12,065 12,336 (271) -2.2% Independent Dealers 11,135 11,741 (606) -5.2% Private Individuals 12,004 12,083 (80) -0.7%
Total Vehicle Sales 48,787 50,090 (1,303) -2.6%
Source: Automotive News Data Center, CNW Marketing/Research, and ADESA Analytical Services.
YTD Through Oct Increase/(Decrease)
New and Used Vehicle Sales - U.S. (000s of Units Sold)
29
Reasons for weak retail used vehicle sales:• Used cars priced high relative to discounted new vehicles. More
price adjustment is necessary to jump start used vehicle sales.
• Maturation of economic cycle/slower economic growth.
• More folks are upside down on their longer term vehicle loans.
• Vehicle longevity has improved and more people own longer lasting and lightly challenged trucks and SUVs.
• Lots of used vehicles were bought in 2005 during the employee discount period, which brought lots of young trade-ins to franchised dealerships. This brought forward sales that would have otherwise occurred in 2006 or 2007.
• Hurricane-replacement vehicles were bought in late 2005 as well.
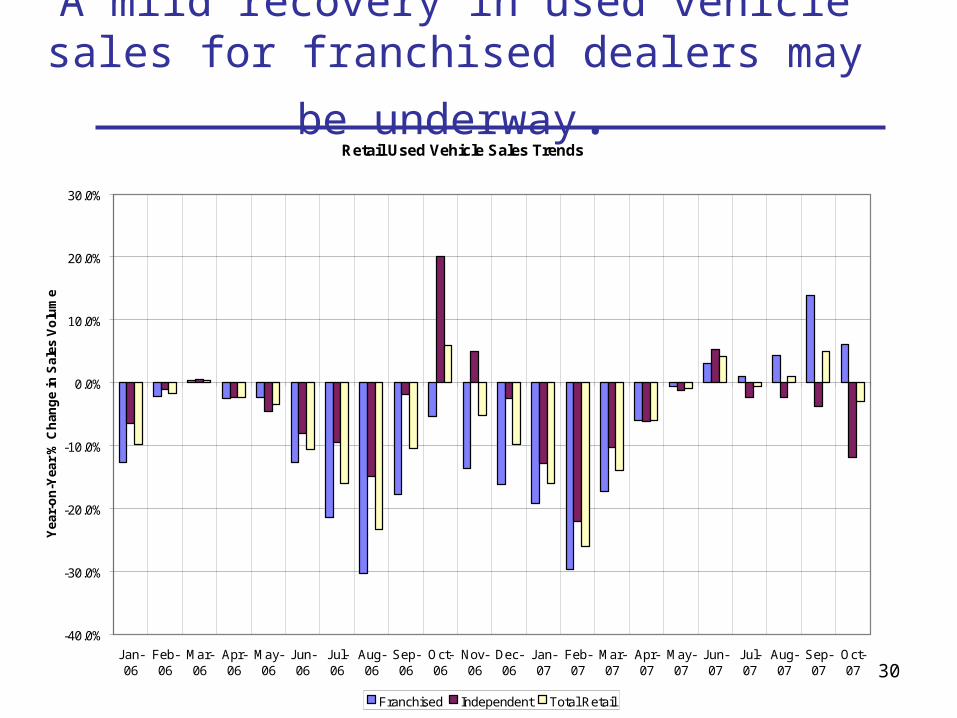
30
A mild recovery in used vehicle sales for
franchised dealers may be underway.Retail Used Vehicle Sales Trends
-40.0%
-30.0%
-20.0%
-10.0%
0.0%
10.0%
20.0%
30.0%
Jan-06
Feb-06
Mar-06
Apr-06
May-06
Jun-06
Jul-06
Aug-06
Sep-06
Oct-06
Nov-06
Dec-06
Jan-07
Feb-07
Mar-07
Apr-07
May-07
Jun-07
Jul-07
Aug-07
Sep-07
Oct-07
Yea
r-o
n-Y
ear
% C
han
ge
in S
ales
Vo
lum
e
Franchised Independent Total Retail
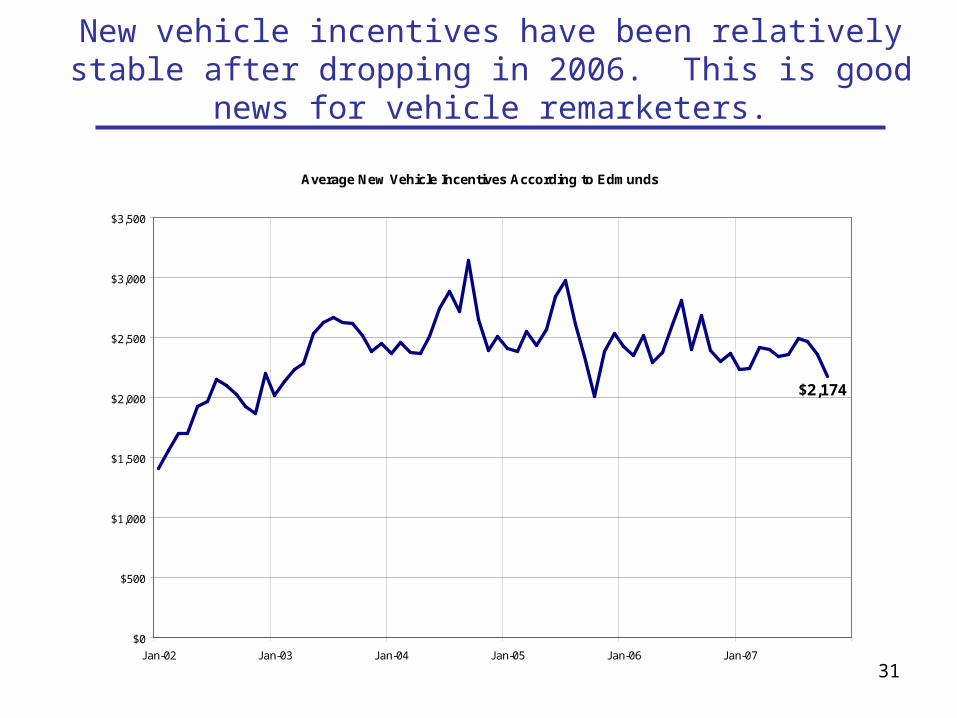
31
New vehicle incentives have been relatively stable after dropping in 2006. This is good news for vehicle remarketers.
Average New Vehicle Incentives According to Edmunds
$2,174
$0
$500
$1,000
$1,500
$2,000
$2,500
$3,000
$3,500
Jan-02 Jan-03 Jan-04 Jan-05 Jan-06 Jan-07
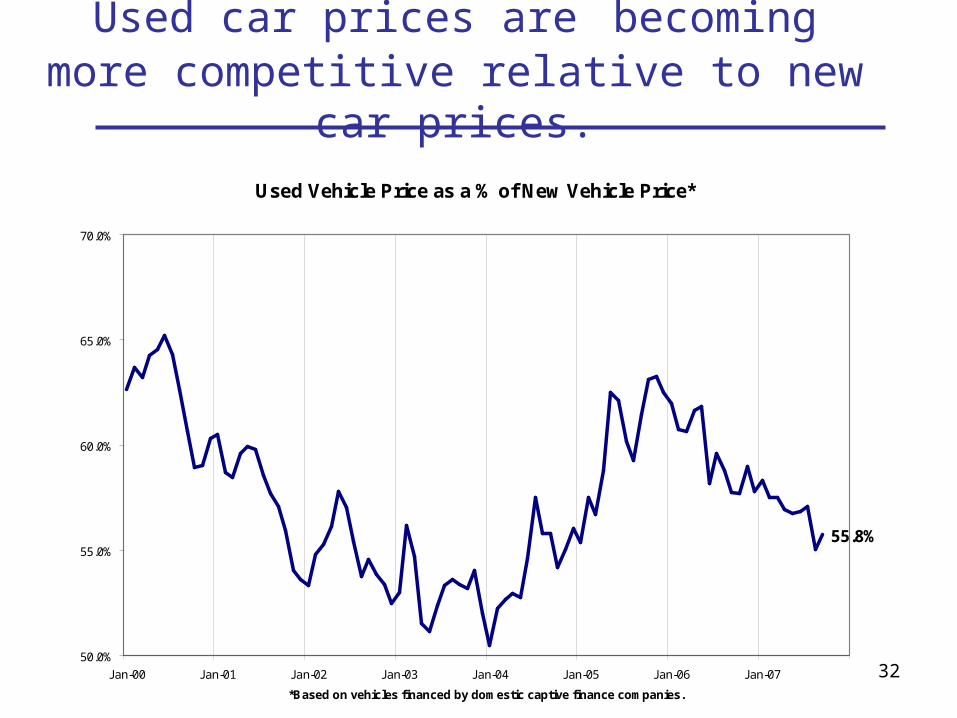
32
Used car prices are becoming more competitive relative to new car prices.
Used Vehicle Price as a % of New Vehicle Price*
55.8%
50.0%
55.0%
60.0%
65.0%
70.0%
Jan-00 Jan-01 Jan-02 Jan-03 Jan-04 Jan-05 Jan-06 Jan-07
*Based on vehicles financed by domestic captive finance companies.
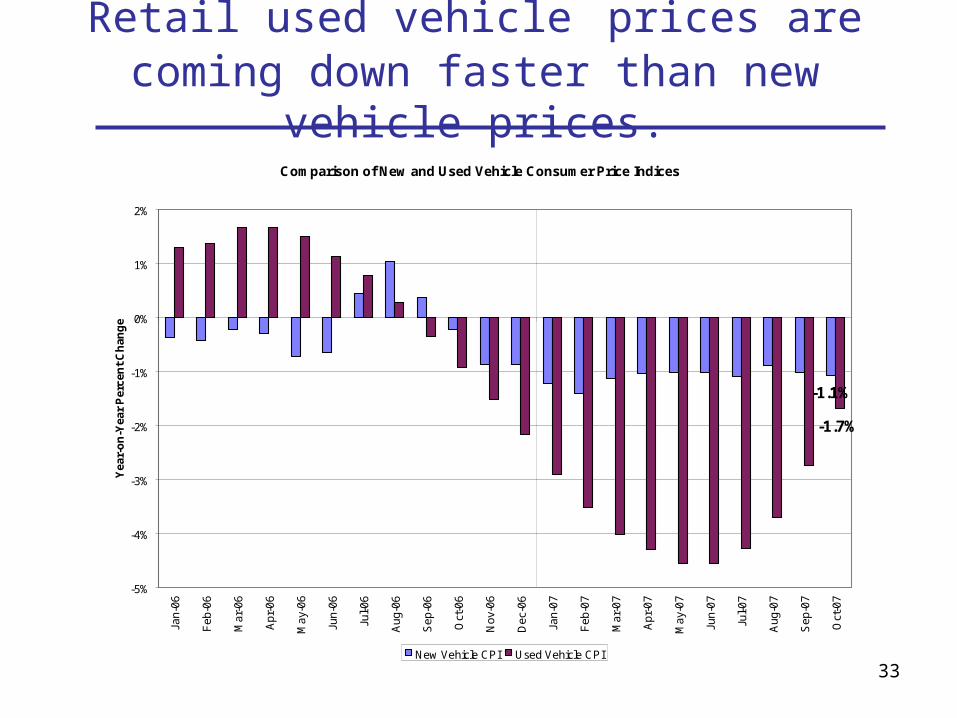
33
Retail used vehicle prices are coming down faster than new vehicle prices.
Comparison of New and Used Vehicle Consumer Price Indices
-1.1%
-1.7%
-5%
-4%
-3%
-2%
-1%
0%
1%
2%
Jan-
06
Feb
-06
Mar
-06
Apr
-06
May
-06
Jun-
06
Jul-0
6
Aug
-06
Sep
-06
Oct
-06
Nov
-06
Dec
-06
Jan-
07
Feb
-07
Mar
-07
Apr
-07
May
-07
Jun-
07
Jul-0
7
Aug
-07
Sep
-07
Oct
-07
Yea
r-o
n-Y
ear
Per
cen
t C
han
ge
New Vehicle CPI Used Vehicle CPI

Wholesale Vehicle Markets
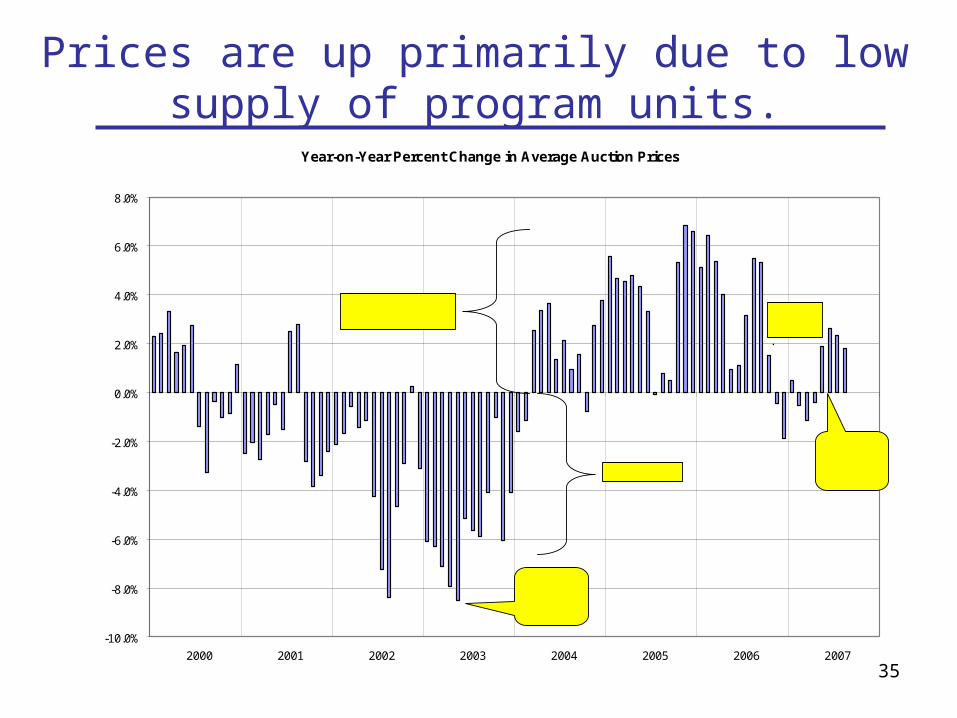
35
Prices are up primarily due to low supply of program units.
Year-on-Year Percent Change in Average Auction Prices
-10.0%
-8.0%
-6.0%
-4.0%
-2.0%
0.0%
2.0%
4.0%
6.0%
8.0%
2000 2001 2002 2003 2004 2005 2006 2007
Inflection Point - May 2003
Price firming
Continued firming/recovery Price
softening.
Supply-drivenrecovery
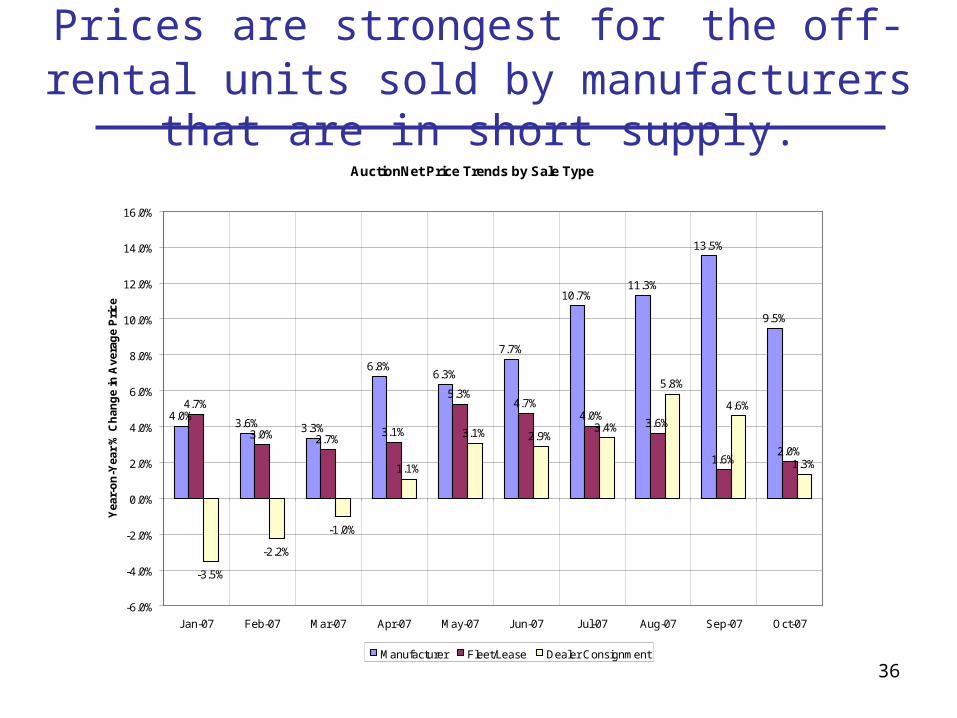
36
Prices are strongest for the off-rental units sold by manufacturers that are in short supply.
AuctionNet Price Trends by Sale Type
4.0%3.6% 3.3%
6.8%6.3%
7.7%
10.7%11.3%
13.5%
9.5%
4.7%
3.0% 2.7%3.1%
5.3%4.7%
4.0%3.6%
1.6%2.0%
-3.5%
-2.2%
-1.0%
1.1%
3.1% 2.9%3.4%
5.8%
4.6%
1.3%
-6.0%
-4.0%
-2.0%
0.0%
2.0%
4.0%
6.0%
8.0%
10.0%
12.0%
14.0%
16.0%
Jan-07 Feb-07 Mar-07 Apr-07 May-07 Jun-07 Jul-07 Aug-07 Sep-07 Oct-07
Yea
r-o
n-Y
ear
% C
han
ge
in A
vera
ge
Pri
ce
Manufacturer Fleet/Lease Dealer Consignment
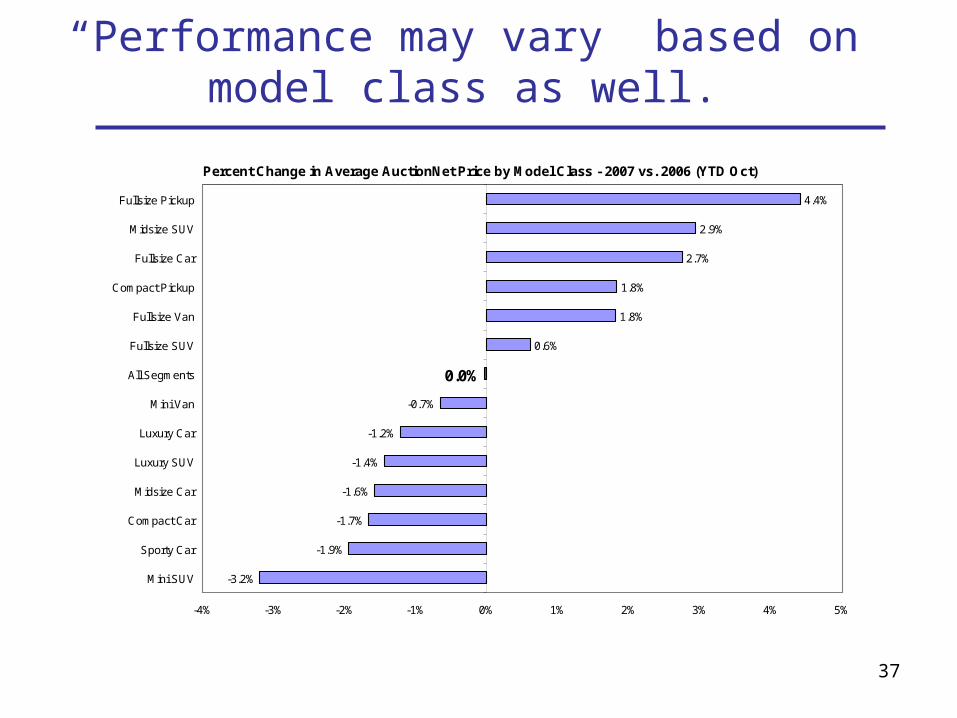
37
“Performance may vary” based on model class as well.
Percent Change in Average AuctionNet Price by Model Class - 2007 vs. 2006 (YTD Oct)
4.4%
2.9%
2.7%
1.8%
1.8%
0.6%
-0.7%
-1.2%
-1.4%
-1.6%
-1.7%
-1.9%
-3.2%
0.0%
-4% -3% -2% -1% 0% 1% 2% 3% 4% 5%
Fullsize Pickup
Midsize SUV
Fullsize Car
Compact Pickup
Fullsize Van
Fullsize SUV
All Segments
Mini Van
Luxury Car
Luxury SUV
Midsize Car
Compact Car
Sporty Car
Mini SUV
38
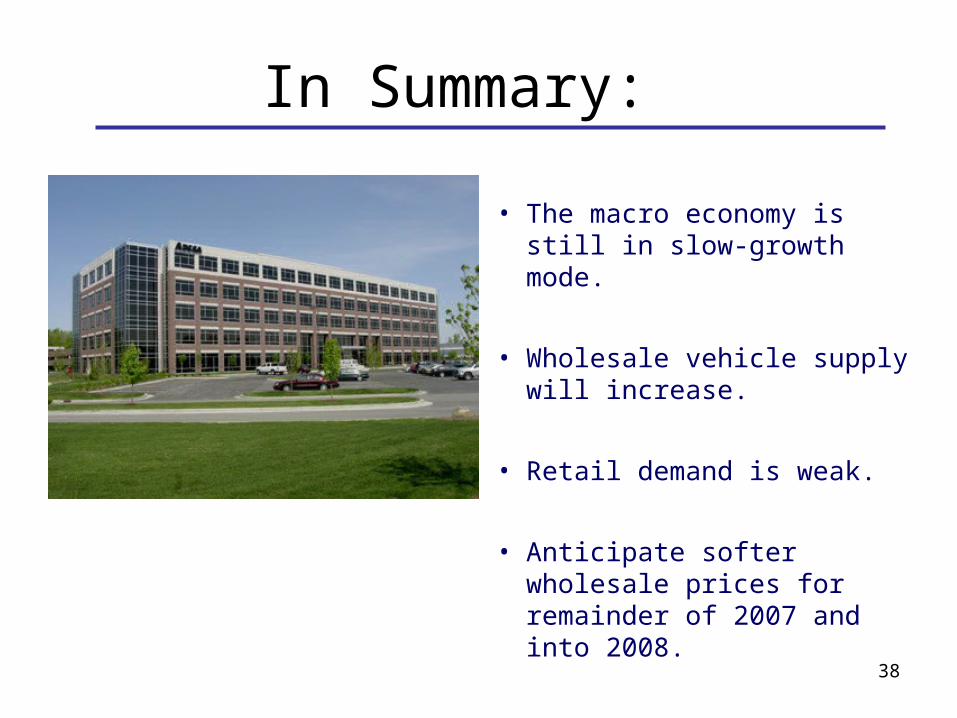
In Summary:
• The macro economy is still in slow-growth mode.
• Wholesale vehicle supply will increase.
• Retail demand is weak.
• Anticipate softer wholesale prices for remainder of 2007 and into 2008.

39
AGENDA
• Industry Update - Tom Kontos
• Corporate Update - Eric Loughmiller
• Q&A
40
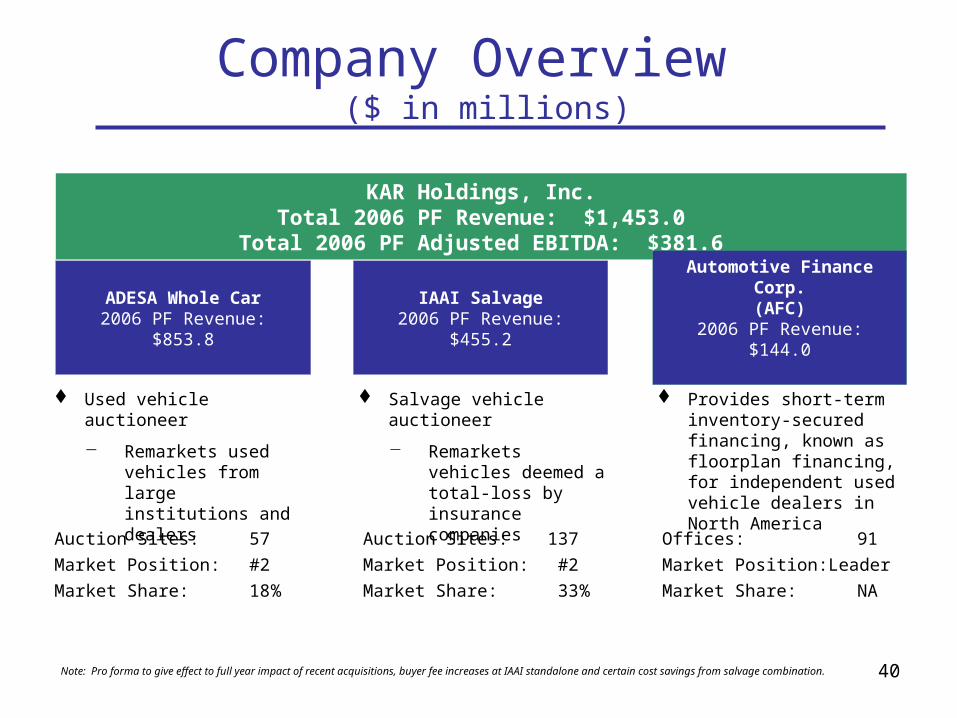
KAR Holdings, Inc.Total 2006 PF Revenue: $1,453.0
Total 2006 PF Adjusted EBITDA: $381.6
ADESA Whole Car2006 PF Revenue: $853.8
IAAI Salvage2006 PF Revenue: $455.2
Used vehicle auctioneer
Remarkets used vehicles from large institutions and dealers
Salvage vehicle auctioneer
Remarkets vehicles deemed a total-loss by insurance companies
Provides short-term inventory-secured financing, known as floorplan financing, for independent used vehicle dealers in North America
Auction Sites: 57
Market Position: #2
Market Share: 18%
Auction Sites: 137
Market Position: #2
Market Share: 33%
Offices: 91
Market Position: Leader
Market Share: NA
Automotive Finance Corp.(AFC)
2006 PF Revenue: $144.0
Note: Pro forma to give effect to full year impact of recent acquisitions, buyer fee increases at IAAI standalone and certain cost savings from salvage combination.
Company Overview ($ in millions)
41
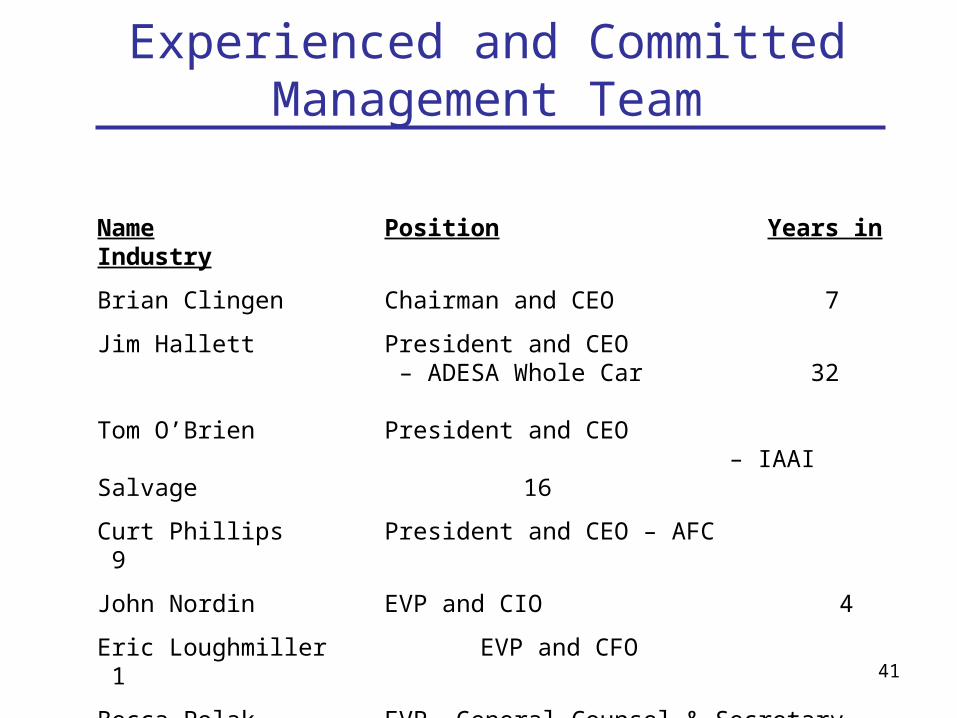
Experienced and CommittedManagement Team
Name Position Years in Industry
Brian Clingen Chairman and CEO 7
Jim Hallett President and CEO – ADESA Whole Car 32
Tom O’Brien President and CEO – IAAI Salvage 16
Curt Phillips President and CEO – AFC 9
John Nordin EVP and CIO 4
Eric Loughmiller EVP and CFO 1
Becca Polak EVP, General Counsel & Secretary 2
42
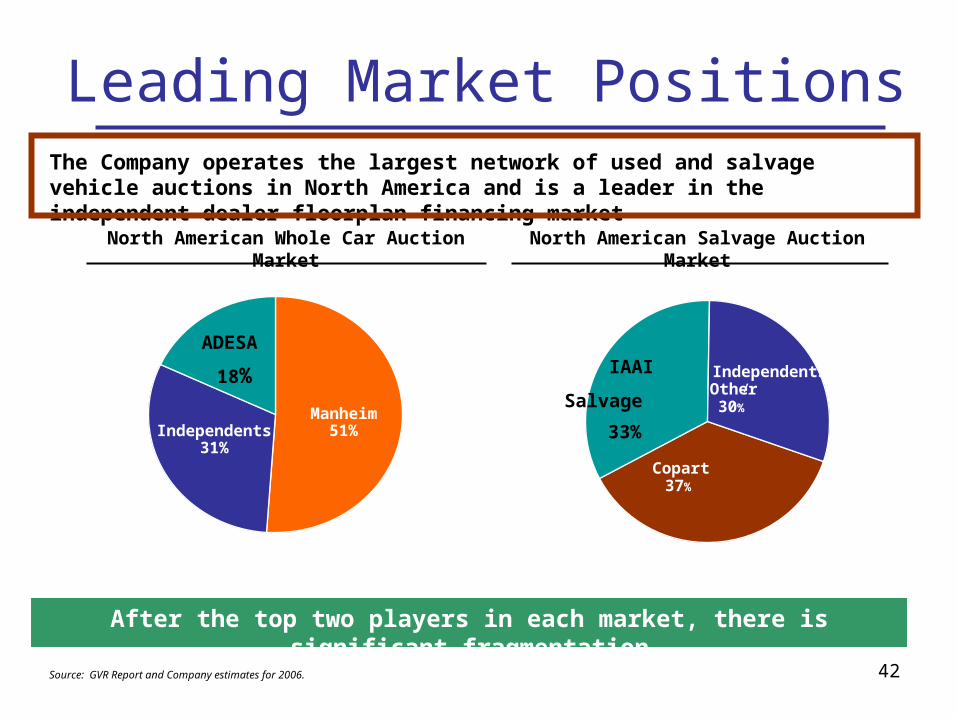
Leading Market PositionsThe Company operates the largest network of used and salvage vehicle auctions in North America and is a leader in the independent dealer floorplan financing market
North American Whole Car Auction MarketNorth American Salvage Auction
Market
Manheim51%Independents
31%
ADESA
18%
Copart37%
IAAI
Salvage
Independents /
Other30%
After the top two players in each market, there is significant fragmentation
Source: GVR Report and Company estimates for 2006.
33%
43
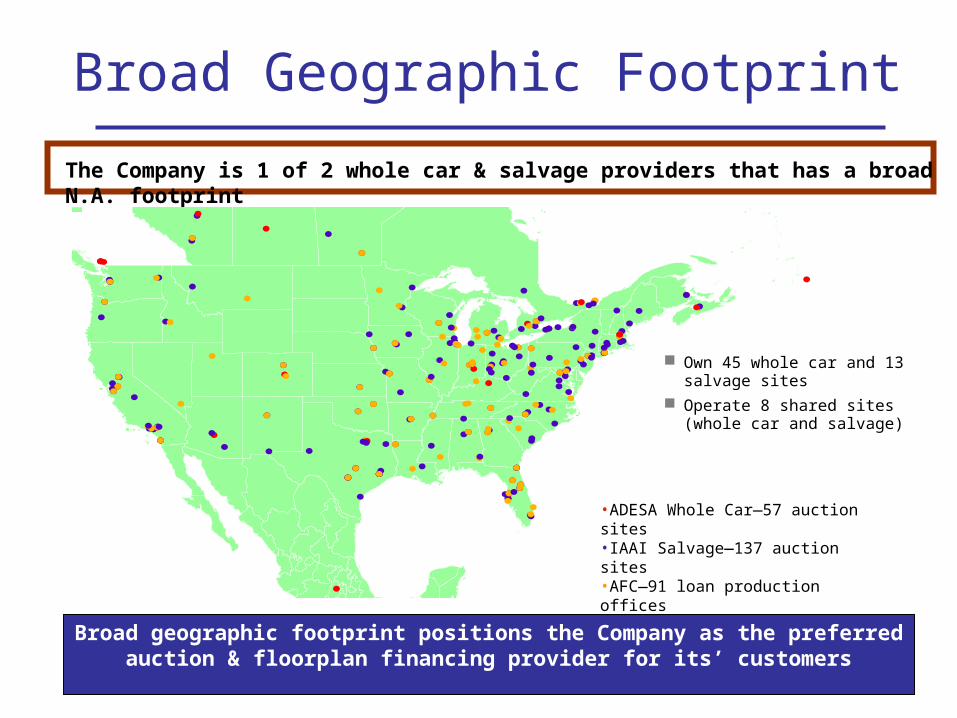
Broad Geographic Footprint
Broad geographic footprint positions the Company as the preferred auction & floorplan financing provider for its’ customers
The Company is 1 of 2 whole car & salvage providers that has a broad N.A. footprint
•ADESA Whole Car—57 auction sites•IAAI Salvage—137 auction sites•AFC—91 loan production offices
Own 45 whole car and 13 salvage sites
Operate 8 shared sites (whole car and salvage)
44
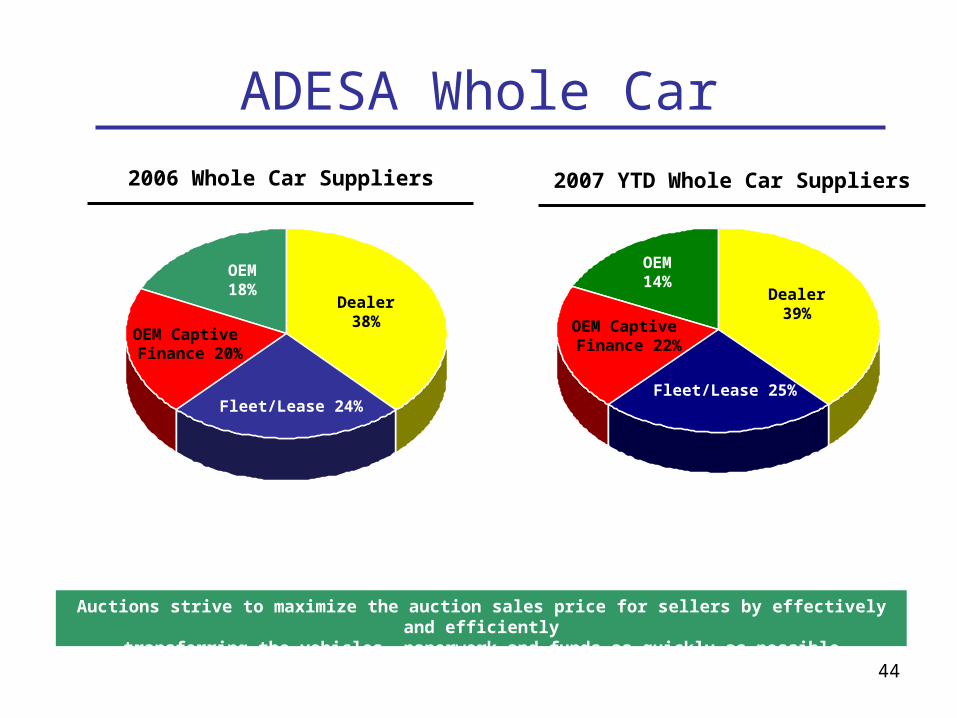
ADESA Whole Car
Auctions strive to maximize the auction sales price for sellers by effectively and efficientlytransferring the vehicles, paperwork and funds as quickly as possible
2006 Whole Car Suppliers
OEM Captive Finance 22%
OEM14%
Dealer39%
Fleet/Lease 25%
2007 YTD Whole Car Suppliers
OEM18%
Dealer38%
Fleet/Lease 24%
OEM Captive Finance 20%
45
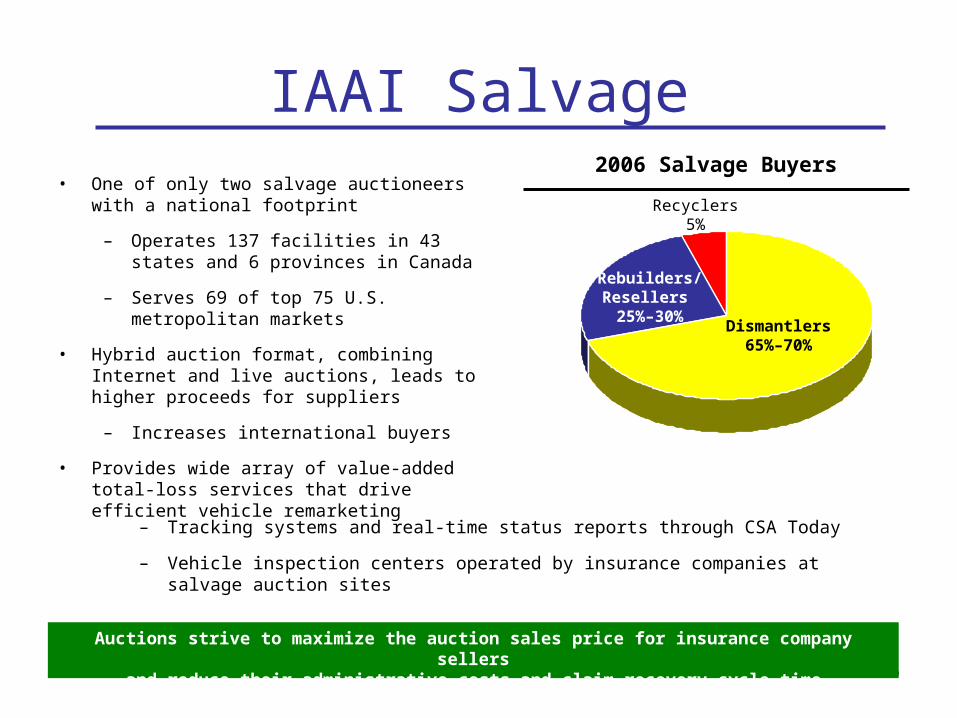
IAAI Salvage• One of only two salvage auctioneers with a
national footprint
– Operates 137 facilities in 43 states and 6 provinces in Canada
– Serves 69 of top 75 U.S. metropolitan markets
• Hybrid auction format, combining Internet and live auctions, leads to higher proceeds for suppliers
– Increases international buyers
• Provides wide array of value-added total-loss services that drive efficient vehicle remarketing
Auctions strive to maximize the auction sales price for insurance company sellersand reduce their administrative costs and claim recovery cycle time
– Tracking systems and real-time status reports through CSA Today
– Vehicle inspection centers operated by insurance companies at salvage auction sites
Dismantlers65%–70%
Rebuilders/Resellers 25%–30%
Recyclers5%
2006 Salvage Buyers
46
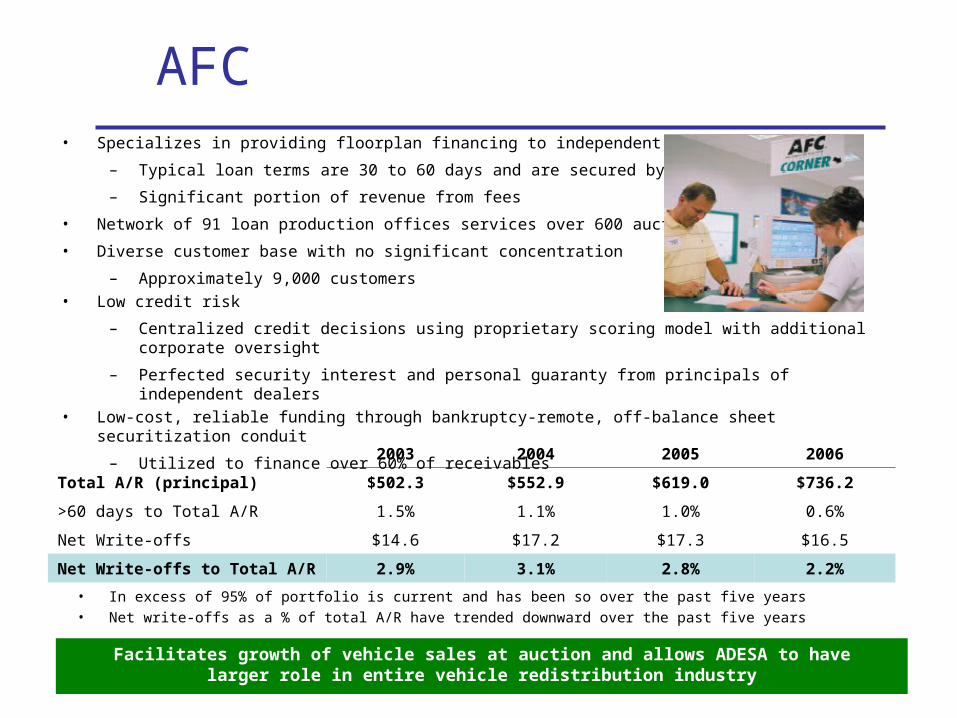
AFC• Specializes in providing floorplan financing to independent dealers
– Typical loan terms are 30 to 60 days and are secured by vehicle
– Significant portion of revenue from fees
• Network of 91 loan production offices services over 600 auctions
• Diverse customer base with no significant concentration
– Approximately 9,000 customers• Low credit risk
– Centralized credit decisions using proprietary scoring model with additional corporate oversight
– Perfected security interest and personal guaranty from principals of independent dealers• Low-cost, reliable funding through bankruptcy-remote, off-balance sheet securitization conduit
– Utilized to finance over 60% of receivables
Facilitates growth of vehicle sales at auction and allows ADESA to havelarger role in entire vehicle redistribution industry
2003 2004 2005 2006
Total A/R (principal) $502.3 $552.9 $619.0 $736.2
>60 days to Total A/R 1.5% 1.1% 1.0% 0.6%
Net Write-offs $14.6 $17.2 $17.3 $16.5
Net Write-offs to Total A/R 2.9% 3.1% 2.8% 2.2%
• In excess of 95% of portfolio is current and has been so over the past five years• Net write-offs as a % of total A/R have trended downward over the past five years
47
Major Initiatives
Project Pride Salvage Integration Revitalized Whole Car Sales &
Organizational Structure Acquisitions & Relocations Cash Flow & Asset Monetization
48
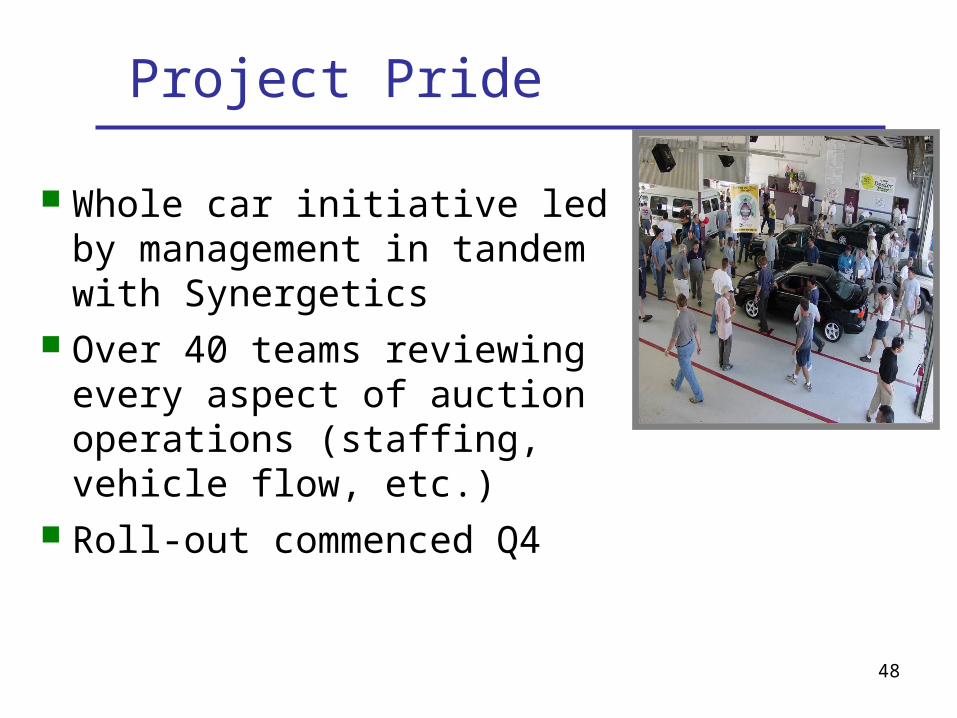
Project Pride
Whole car initiative led by management in tandem with Synergetics
Over 40 teams reviewing every aspect of auction operations (staffing, vehicle flow, etc.)
Roll-out commenced Q4
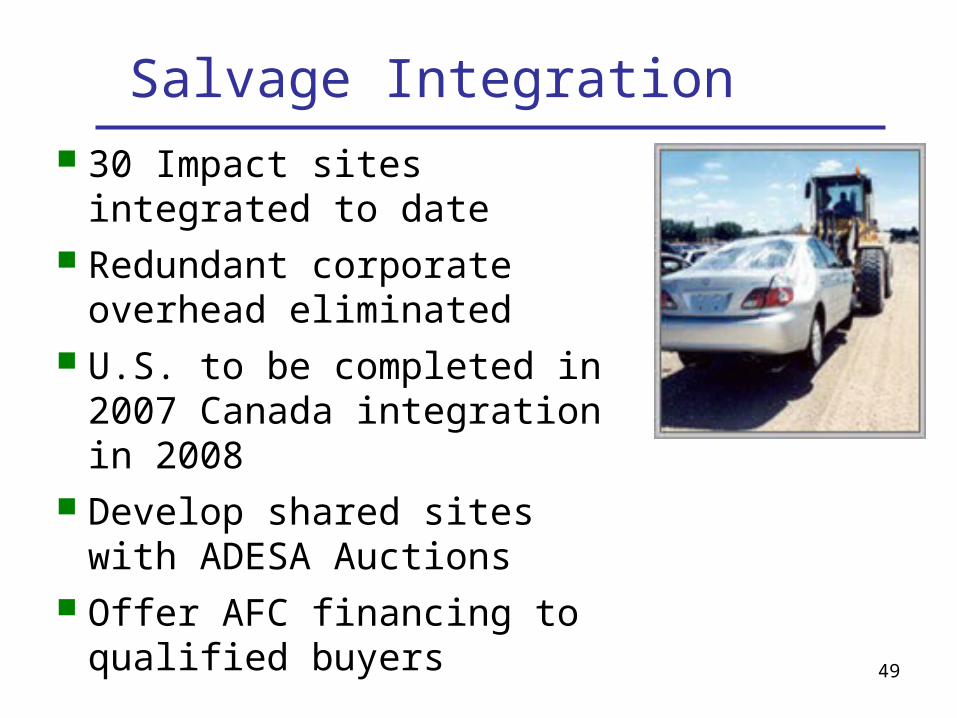
49
Salvage Integration 30 Impact sites integrated to
date Redundant corporate overhead
eliminated U.S. to be completed in 2007
Canada integration in 2008 Develop shared sites with
ADESA Auctions Offer AFC financing to qualified
buyers
50
Revitalized Whole Car Sales & Organizational Structure
Jim Hallett back at ADESA. Culture shift: Bureaucratic Entrepreneurial
Sales & operations revitalized with new talent additions
Team = Customer focused, with owner / operator mindset
Centralized E-business approach
Customers’ Response = Vehicles to ADESA
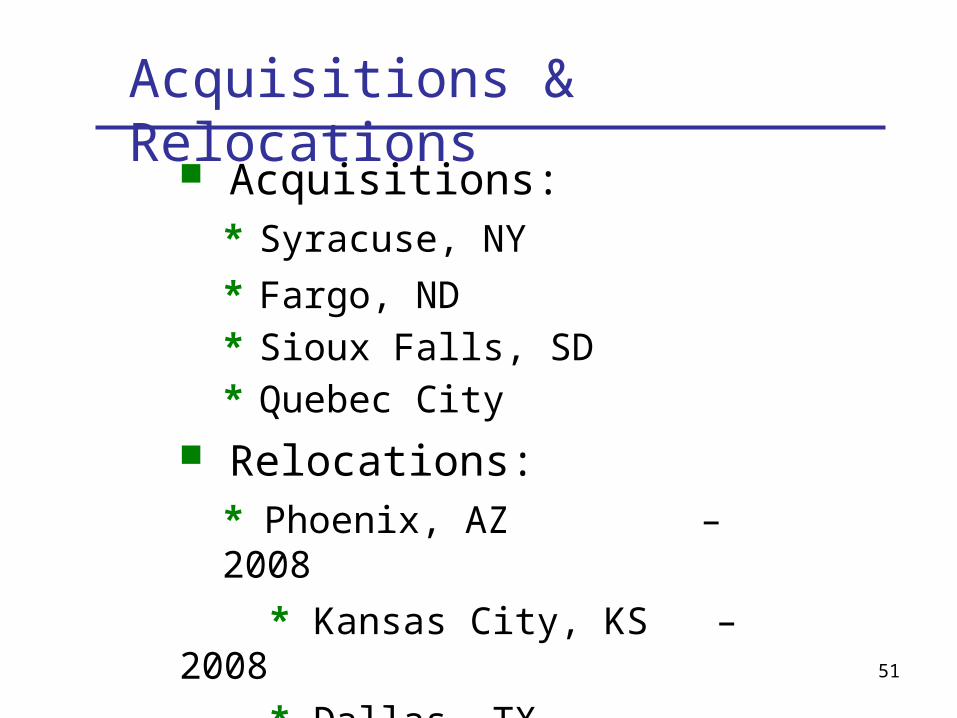
51
Acquisitions & Relocations
Acquisitions:* Syracuse, NY
* Fargo, ND
* Sioux Falls, SD
* Quebec City
Relocations:* Phoenix, AZ – 2008
* Kansas City, KS – 2008
* Dallas, TX – 2009
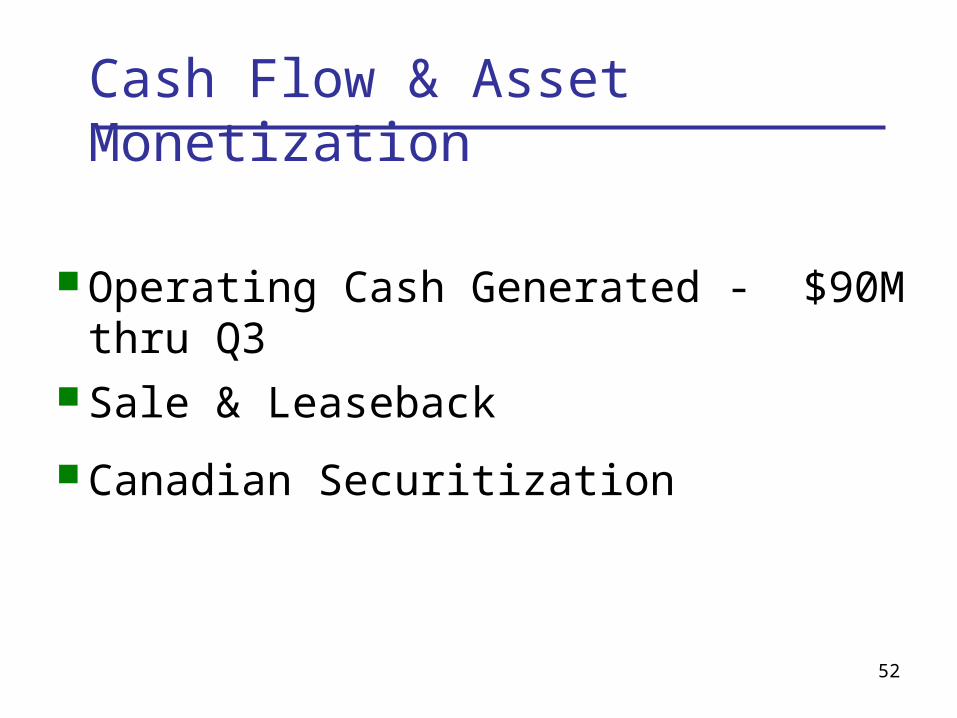
52
Cash Flow & Asset Monetization
Operating Cash Generated - $90M thru Q3 Sale & Leaseback
Canadian Securitization

53
Investor Update
Financial Review
54
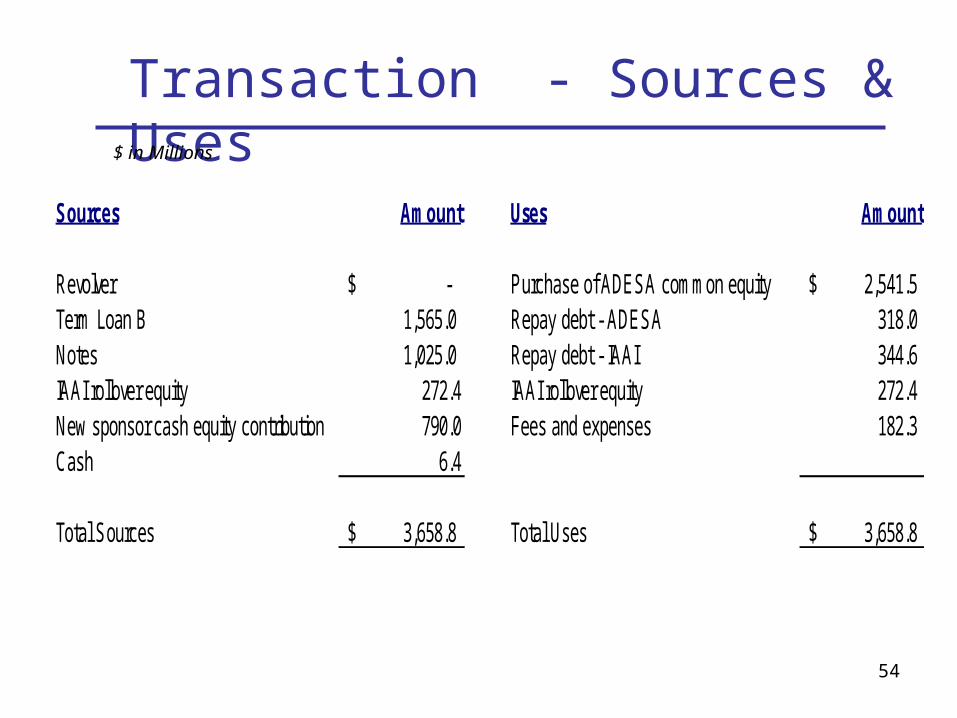
Transaction - Sources & Uses $ in Millions
Sources Amount Uses Amount
Revolver $ - Purchase of ADESA common equity 2,541.5$ Term Loan B 1,565.0 Repay debt - ADESA 318.0 Notes 1,025.0 Repay debt - IAAI 344.6 IAAI rollover equity 272.4 IAAI rollover equity 272.4 New sponsor cash equity contribution 790.0 Fees and expenses 182.3 Cash 6.4
Total Sources 3,658.8$ Total Uses 3,658.8$
55
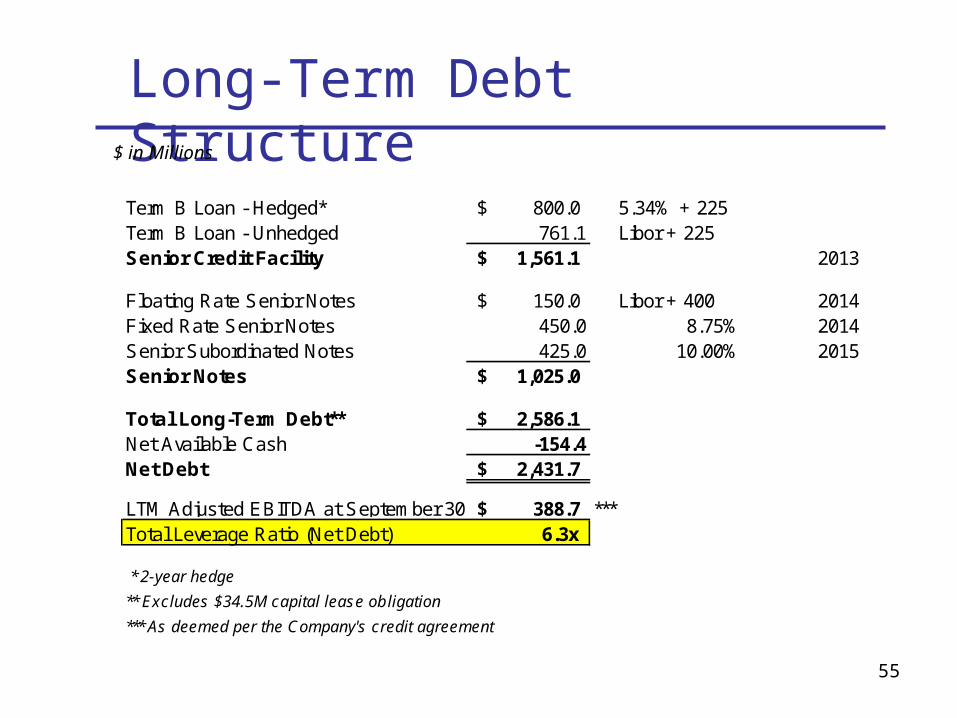
Long-Term Debt Structure
Term B Loan - Hedged* 800.0$ 5.34% + 225Term B Loan - Unhedged 761.1 Libor + 225Senior Credit Facility 1,561.1$ 2013
Floating Rate Senior Notes 150.0$ Libor + 400 2014Fixed Rate Senior Notes 450.0 8.75% 2014Senior Subordinated Notes 425.0 10.00% 2015Senior Notes 1,025.0$
Total Long-Term Debt** 2,586.1$ Net Available Cash -154.4Net Debt 2,431.7$
LTM Adjusted EBITDA at September 30, 2007 388.7$ ***Total Leverage Ratio (Net Debt) 6.3x
* 2-year hedge
** Excludes $34.5M capital lease obligation
*** As deemed per the Company's credit agreement
$ in Millions
56
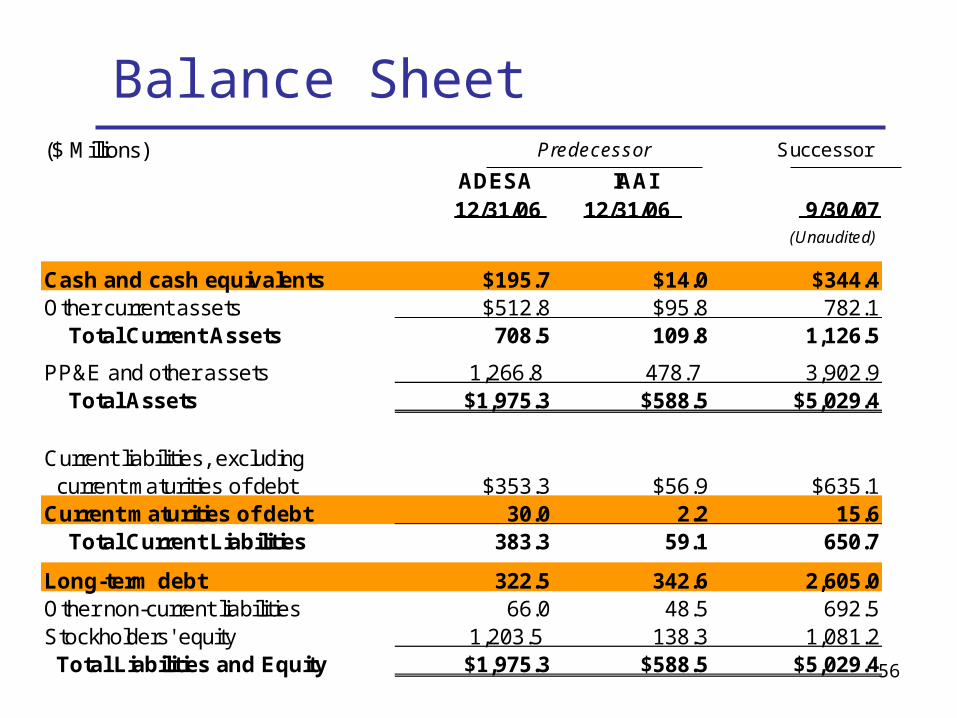
Balance Sheet($ Millions) Predecessor Successor
ADESA IAAI
(Unaudited)
Cash and cash equivalents $195.7 $14.0 $344.4Other current assets $512.8 $95.8 782.1 Total Current Assets 708.5 109.8 1,126.5
PP&E and other assets 1,266.8 478.7 3,902.9 Total Assets $1,975.3 $588.5 $5,029.4
Current liabilities, excluding current maturities of debt $353.3 $56.9 $635.1Current maturities of debt 30.0 2.2 15.6 Total Current Liabilities 383.3 59.1 650.7
Long-term debt 322.5 342.6 2,605.0Other non-current liabilities 66.0 48.5 692.5Stockholders' equity 1,203.5 138.3 1,081.2 Total Liabilities and Equity $1,975.3 $588.5 $5,029.4
12/31/06 12/31/06 9/30/07
57
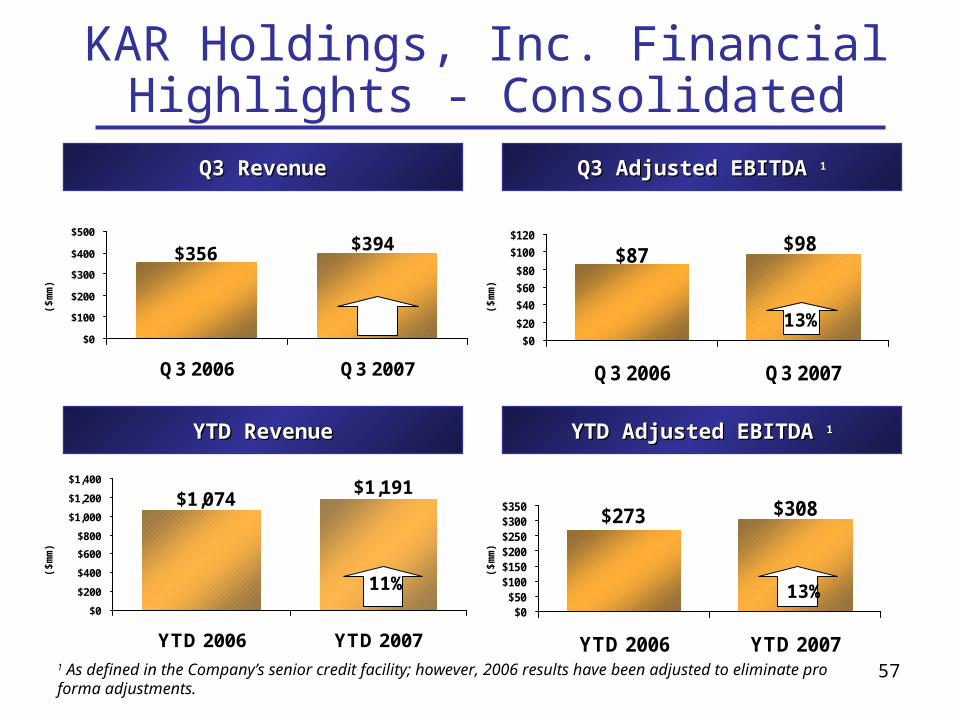
KAR Holdings, Inc. Financial Highlights - Consolidated
1 As defined in the Company’s senior credit facility; however, 2006 results have been adjusted to eliminate pro forma adjustments.
$356 $394
$0
$100
$200
$300
$400
$500
Q3 2006 Q3 2007
11%
Q3 RevenueQ3 Revenue Q3 Adjusted EBITDA Q3 Adjusted EBITDA 11
($m
m)
($m
m)
$87$98
$0
$20
$40
$60
$80
$100
$120
Q3 2006 Q3 2007
$1,191$1,074
$0
$200
$400
$600
$800
$1,000
$1,200
$1,400
YTD 2006 YTD 2007
YTD RevenueYTD Revenue YTD Adjusted EBITDA YTD Adjusted EBITDA 11
($m
m)
($m
m)
$273 $308
$0$50
$100$150$200$250$300$350
YTD 2006 YTD 2007
13%
11% 13%
58
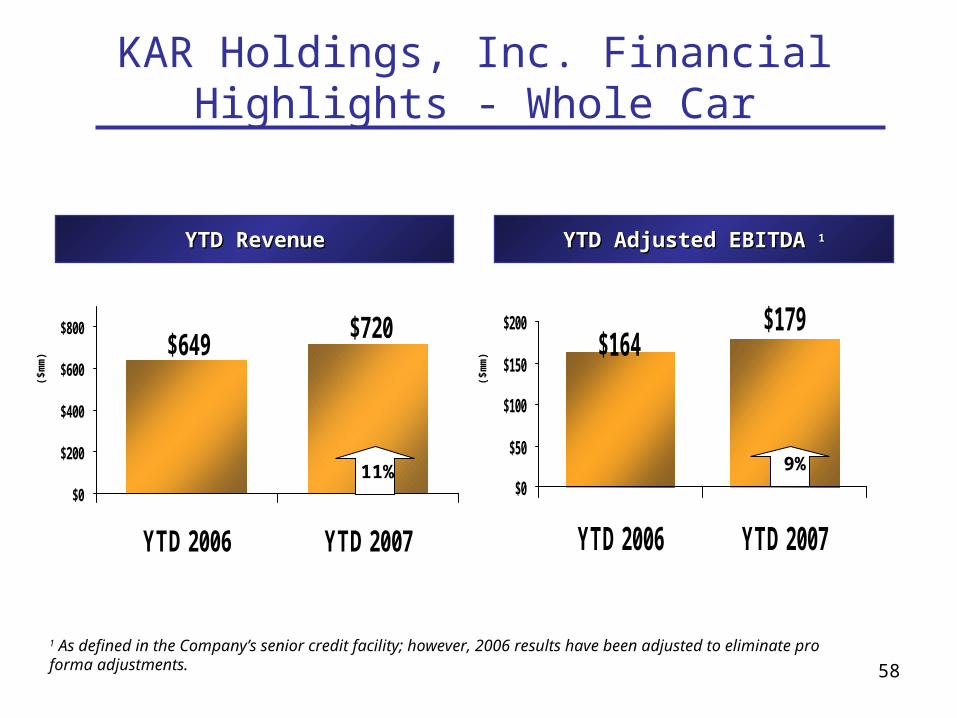
KAR Holdings, Inc. Financial Highlights - Whole Car
$720$649
$0
$200
$400
$600
$800
YTD 2006 YTD 2007
YTD RevenueYTD Revenue YTD Adjusted EBITDA YTD Adjusted EBITDA 11
($m
m)
($m
m) $164
$179
$0
$50
$100
$150
$200
YTD 2006 YTD 2007
9%11%
1 As defined in the Company’s senior credit facility; however, 2006 results have been adjusted to eliminate pro forma adjustments.
59
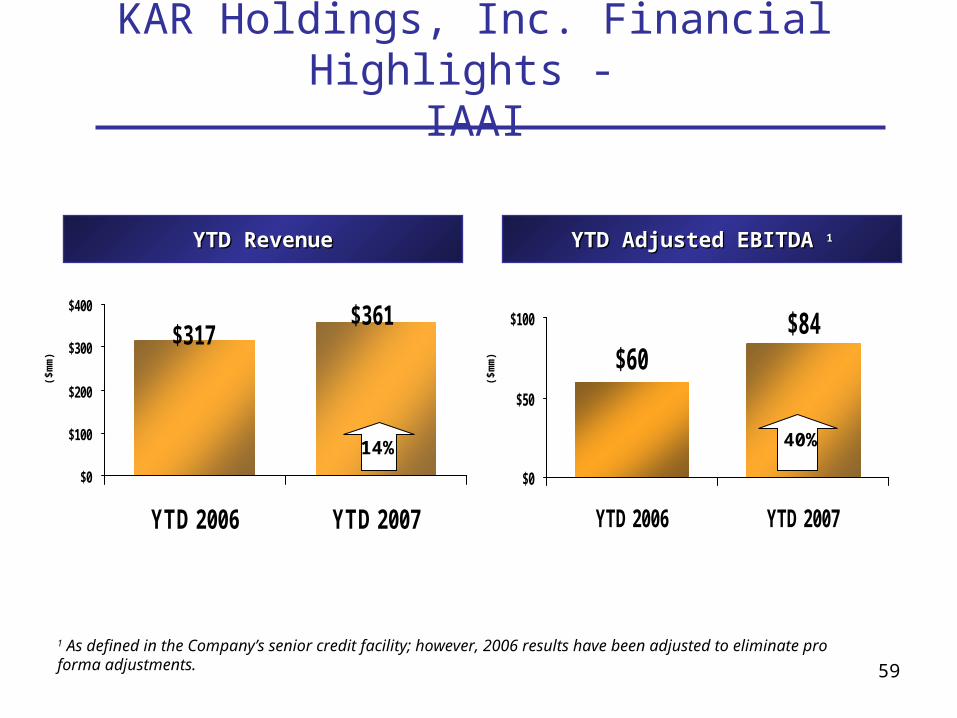
KAR Holdings, Inc. Financial Highlights - IAAI
$317$361
$0
$100
$200
$300
$400
YTD 2006 YTD 2007
YTD RevenueYTD Revenue YTD Adjusted EBITDA YTD Adjusted EBITDA 11
($m
m)
($m
m) $60
$84
$0
$50
$100
YTD 2006 YTD 2007
14% 40%
1 As defined in the Company’s senior credit facility; however, 2006 results have been adjusted to eliminate pro forma adjustments.
60
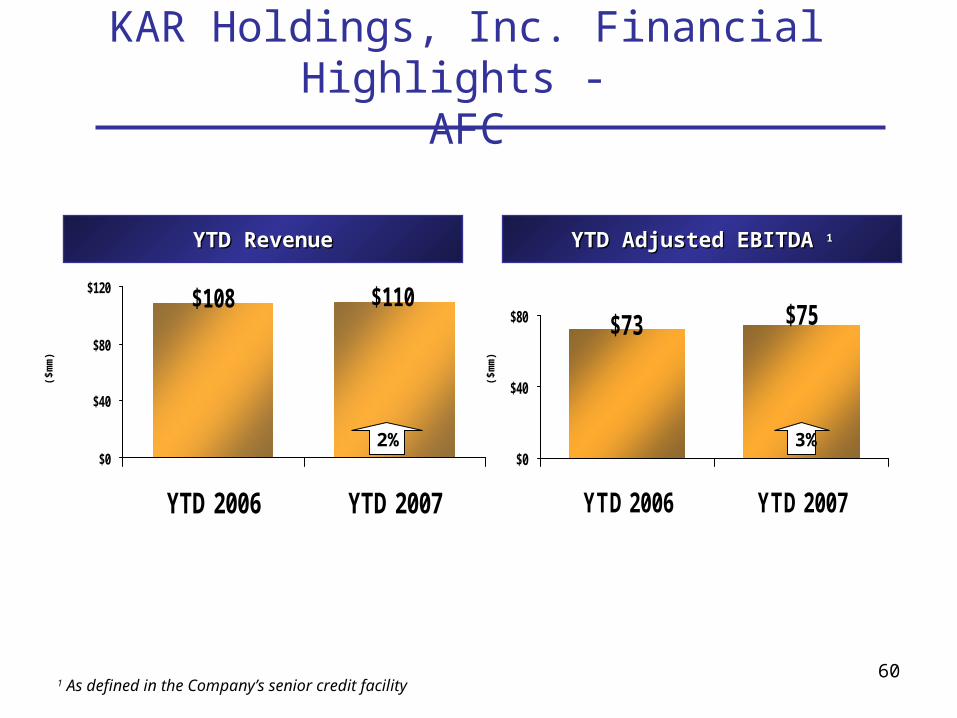
KAR Holdings, Inc. Financial Highlights - AFC
1 As defined in the Company’s senior credit facility
$108 $110
$0
$40
$80
$120
YTD 2006 YTD 2007
YTD RevenueYTD Revenue YTD Adjusted EBITDA YTD Adjusted EBITDA 11
($m
m)
($m
m)
$73 $75
$0
$40
$80
YTD 2006 YTD 2007
2% 3%
61
Investment Highlights
• Stable Industry Fundamentals
• Recurring Revenue Stream
• Leading Market Positions with Broad Geographic Footprint
• Strong Competitive Position
• Consistent Historical Financial Performance
• Established Relationships with Vehicle Suppliers & Buyers
• Experienced and Committed Management Team
• Strong Cash Flow Generation

62
AGENDA
• Industry Update - Tom Kontos
• Corporate Update - Eric Loughmiller
• Q&A


