42
ANALYST MEETING PT Bank Tabungan Negara (Persero) Tbk. Business & Financial Performances as of March 31, 2018 Jakarta, April 19 th 2018
| Date post: | 29-Jul-2018 |
| Category: |
Documents |
| Upload: | nguyenkhanh |
| View: | 213 times |
| Download: | 0 times |

ANALYST MEETING
PT Bank Tabungan Negara (Persero) Tbk.
Business & Financial Performances
as of March 31, 2018
Jakarta, April 19th 2018

2
DisclaimerIMPORTANT: The following forms part of, and should be read in conjunction with, the other material in this presentation
This presentation contains privileged information and has been prepared solely for the recipient(s). By accepting a copy (or the contents) of this presentation, you
are deemed to have acknowledged and agreed to the provisions appearing hereinafter. The existence of this presentation and the contents thereof should not be
disclosed, reproduced, copied or otherwise disseminated to any other person or published, in whole or in part, without prior consent of PT Bank Tabungan Negara
(Persero) Tbk. (“BTN” or the “Company”).
This presentation does not constitute or form part of any offer for sale or invitation, or solicitation of an offer, to subscribe for or purchase any securities and neither
this document nor anything contained herein shall form the basis of or be relied on in connection with any contract or commitment whatsoever. Any decision to
purchase or subscribe for securities should be made only on the basis of the information contained in a prospectus or offering circular issued by the Company in
connection with any such offering.
Information and opinions contained in this presentation are provided for reference of the recipients only and are not to be relied upon as authoritative or without the
recipient’s own independent verification or taken in substitution for the exercise of the recipient’s own judgment. Any reference to past performance should not be
taken as an indication of future performance. In furnishing the presentation, the Company has not undertaken to provide the recipient(s) with access to any
additional information or updates. None of the Company warrant or guarantee whatsoever that this presentation will lead to the successful completion, or
consummation, of any transactions whether or not under contemplation.
Accordingly the Company disclaims any liability whatsoever in connection therewith and with any decisions that might be taken upon the basis of this presentation,
directly or indirectly. In particular, the Company owe no duty to the recipient (except as required by applicable laws) to exercise any judgment on its behalf as to
the merits or suitability of any transaction. The recipient agrees that the merits or suitability of any such transaction to its particular situation will be independently
determined by the recipient including consideration of the legal, tax, accounting, regulatory, financial and other related aspects thereof.

3
Macro Economy 4
Outline
Page
Performance Overview 11
Sharia Business 36
Appendices 39
1Q18 Summary 8

4
Macroeconomy1.

5
• Inflation was controlled at 3.40% (yoy) in March
2018, still within BI’s target of 3.5±1%.
• In March 2018, Bank Indonesia maintained the BI
7-Day RR Rate at 4.25% as an effort to sustain
macro economy and financial system stability.
Macroeconomy:Controlled Inflation
• Following 2017 GDP growth of 5.07% (yoy),
Indonesia has experienced higher growth from
investment and exports amid stable
consumption.
• Bank Indonesia projects economic growth at
5.1%-5.5% (yoy) in 2018.
Stable Inflation & Interest Rate Robust Economic Growth
5

6
Robust Loan Growth
Strong Deposits Growth
In Mar 2018, BBTN Loan grew by 19.34%
(yoy), far above industry growth at 8.3% (yoy)
in Feb 2018. Its acceleration was sustained by
Subsidized Mortgages.
Total Deposits of BBTN increased strongly by
23.54% (yoy) in Mar 2018. Meanwhile industry
growth was recorded at 8.44% (yoy) in Feb
2018.
BBTN Loan & Deposit:Above Industry’s Growth
6

7
• Residential Property Price Index in 4Q17
increased quarterly from 0.50% (qtq) to
0.55% (qtq) and grew annually at 3.50%
(yoy), up from 3.32 % (yoy).
• The rising prices affected all property types,
especially medium houses.
Housing Industry:Residential Property Prices and Sales Start to Increase
Source: Bank Indonesia – Residential Property Survey for Primary House
Residential Property Price Index Growth of Property Sales (% qtq)
• Residential property sales in 4Q2017
showed a pick up from the previous quarter.
Sales was up 3.05% (qtq), higher than
2.58% (qtq) in 3Q2017.
7

8
1Q 2018 Summary2.
8

912
Bank BTN’s Achievement on 1 Million Houses Program
9
Unit IDR Bn Unit IDR Bn Unit IDR Bn Unit IDR Bn Unit IDR Bn
Subsidized Mortgage 600,000 44,407 5,358 102,749 2,629 29,052 1,035 131,801 3,664 176,208 9,022 29.37%
Non Subsidized Mortgage 150,000 12,811 4,269 85,768 9,617 3,476 1,338 89,244 10,955 102,055 15,224 68.04%
TOTAL 750,000 57,218 9,627 188,517 12,246 32,528 2,373 221,045 14,619 278,263 24,246 37.10%
Loan TypeTarget
(Unit)
Progress as of Mar 31, 2018
ProgressMortgage
Disbursed 2018
Construction Loans Support in Progress
TotalApproved
prior to 2018
Approved
in 2018Total

10
1Q 2018 Key Takeaways
• Deposits rose aggressively by 23.54% (yoy)• LCR was strong at 166.29%• Deposit growth was driven by CASA
Sufficient Liquidity
Improved Asset
Quality
• NPL gradually improved to 2.78%, lower than 3.34% in Mar 2017• Special-Mentioned Loans also improved from 11.68% to 10.43% in Mar 2018• NPL on commercial loans significantly lowered
Solid Profitability
• Net profit increased by 15.13% (yoy)• Net interest income raised by 16.20% (yoy)
• Loan growth was 19.34% (yoy) in support of the 1 Million Houses Program,• Subsidized mortgage demand remained strong with 32.96% (yoy) growth• Sustaining the leadership of mortgage in Indonesia by 37.3%
Sustained Robust
Loan Growth
10

11
Performance
Overview
3.
1411

12
Financial Highlight(IDR Billion)
12
FY 2013 FY 2014 FY 2015 FY 2016 FY 2017 31-Mar-17 31-Mar-18 y.o.y INDUSTRY
(Feb 2018)
BTN
TARGET
2018
Total Asset 131,170 144,582 171,808 214,168 261,365 214,312 258,739 20.73% 9.25% 17% - 20%
Total Loan & Financing 100,467 115,916 138,956 164,446 198,991 169,687 202,503 19.34% 8.32% 22% - 24%
Total Deposits 96,213 106,479 127,746 160,192 192,949 157,419 194,481 23.54% 8.44% 19% - 22%
Equity 11,557 12,253 13,860 19,131 21,663 19,196 21,717 13.13% 11.67% 13% - 15%
Net Profit 1,562 1,146 1,851 2,619 3,027 594 684 15.13% 9.69% > 25%
Earning per Share (IDR) 148 108 175 247 286 56 65 15.13%
CAR (Tier 1) 14.91% 14.07% 14.87% 16.54% 15.99% 15.40% 15.24% 21.58%
CAR (BI) 15.62% 14.64% 16.97% 20.34% 18.87% 18.90% 17.92% 23.24% 16% - 18%
NPL (Gross) 4.05% 4.01% 3.42% 2.84% 2.66% 3.34% 2.78% 2.9% (Jan18) 2.3% - 2.5%
NPL (Nett) 3.04% 2.76% 2.11% 1.85% 1.66% 2.35% 1.78% 1.3% (Jan18) 1.2% - 1.4%
N I M 5.44% 4.47% 4.87% 4.98% 4.76% 4.32% 4.21% 5.00% 4.5% - 5%
C I R 50.86% 57.21% 50.08% 48.41% 50.19% 56.90% 56.97%
COVERAGE RATIO 27.97% 33.77% 43.14% 45.25% 45.33% 38.28% 42.29%
ROE 16.05% 10.95% 16.84% 18.35% 18.11% 14.60% 14.69% 18% - 20%
ROA 1.79% 1.14% 1.61% 1.76% 1.71% 1.48% 1.37% 2.36% 1.7% - 1.9%
LDR 104.42% 108.86% 108.78% 102.66% 103.13% 107.79% 104.12% 89.21% 105% - 107%
LCR 165.98% 162.25% 144.95% 156.20% 166.29%

13
Balance Sheet(IDR Billion)
13
FY 2013 FY 2014 FY 2015 FY 2016 FY 2017 31-Mar-17 31-Mar-18 y.o.y
Total Assets 131,170 144,582 171,808 214,168 261,365 214,312 258,739 20.73%
Total Earning Assets 118,305 132,192 157,049 195,780 234,161 194,949 235,413 20.76%
- Term Deposit with BI 4,834 1,496 7,529 17,581 18,693 4,028 4,306 6.91%
- Loans and Financing 100,467 115,916 138,956 164,446 198,991 169,687 202,503 19.34%
- Securities 12,595 13,684 10,001 12,785 15,252 19,418 27,530 41.77%
- Other Earning Assets 408 1,095 562 968 1,225 1,817 1,074 -40.87%
Provision on Earning Asset (1,148) (1,581) (2,064) (2,132) (2,373) (2,182) (2,397) 9.86%
Others 14,013 13,972 16,823 20,520 29,577 21,545 25,723 19.39%
Deposits 96,213 106,479 127,746 160,192 192,949 157,419 194,481 23.54%
Securities Issued 8,837 7,939 10,937 12,935 17,932 12,936 17,933 38.63%
Deposits from Other Banks 285 1,770 3,255 5,459 8,035 6,190 2,030 -67.20%
Repurchase Agreements 2,653 3,818 2,135 1,385 1,401 1,402 1,397 -0.29%
Borrowings 7,070 6,996 7,725 7,999 10,990 9,298 11,466 23.31%
Others 4,556 5,329 6,151 7,068 8,395 7,871 9,713 23.41%
Equity 11,557 12,253 13,860 19,131 21,663 19,196 21,717 13.13%

14
Asset Composition
Total Assets
(IDR Trillion)
Assets Composition
(%)
14

15
Earning Asset Composition
Total Earning Asset
(IDR Trillion)
Earning Asset Composition
(%)
15

16
Loans Composition: Focused on Housing Loans
Gross Loan
(IDR Trillion)
Housing and Non-Housing Loans
(%)
Note : Figures on all graphs Include Sharia financing16
IDR Bn Shares IDR Bn Shares IDR Bn Shares IDR Bn Shares IDR Bn Shares IDR Bn Shares IDR Bn Shares
Housing Loans 87,005 86.60% 102,614 88.52% 124,927 89.90% 147,948 89.97% 179,228 90.07% 153,316 90.35% 184,468 91.09% 20.32%
Subsidized Mortgages 28,429 28.30% 34,347 29.63% 43,527 31.32% 56,835 34.56% 75,278 37.83% 59,529 35.08% 79,148 39.09% 32.96%
Non-Subsidized Mortgages 39,548 39.36% 45,601 39.34% 53,567 38.55% 60,469 36.77% 69,309 34.83% 62,189 36.65% 69,804 34.47% 12.24%
Other Housing Loans 7,198 7.16% 8,179 7.06% 8,934 6.43% 8,723 5.30% 8,561 4.30% 8,660 5.10% 8,483 4.19% -2.05%
Construction Loan 11,829 11.77% 14,486 12.50% 18,900 13.60% 21,921 13.33% 26,081 13.11% 22,938 13.52% 27,033 13.35% 17.85%
Non-Housing Loans 13,463 13.40% 13,302 11.48% 14,029 10.10% 16,498 10.03% 19,763 9.93% 16,371 9.65% 18,035 8.91% 10.17%
Consumer Loan 2,597 2.59% 2,916 2.52% 3,839 2.76% 4,738 2.88% 4,813 2.42% 4,182 2.46% 3,961 1.96% -5.28%
Commercial Loan 10,865 10.81% 10,386 8.96% 10,190 7.33% 11,761 7.15% 14,950 7.51% 12,189 7.18% 14,074 6.95% 15.47%
Total Loans 100,467 100.00% 115,916 100.00% 138,956 100.00% 164,446 100.00% 198,991 100.00% 169,687 100.00% 202,503 100.00% 19.34%
31-Dec-15
Loans Type
31-Dec-13 31-Dec-14 31-Dec-1731-Dec-16 31-Mar-18
y.o.y
31-Mar-17

17
Mortgages: Growth Remained Strong
Subsidized Mortgages
(IDR Billion)
Non Subsidized Mortgages
(IDR Billion)
Note : Figures on all graphs Include Sharia financing
Mortgage Composition
(%)
Total Mortgages
(IDR Billion)
17

18
Loan Disbursement: Mortgages & Construction Loans were the DriversIDR Trillion
Note : Figures on graph and table Include Sharia financing
IDR Billion
18
2017 2018
IDR Bio
Housing Loans 33,955 34,029 41,812 47,216 57,888 11,294 13,939 23.42%
Subsidized Mortgages 6,506 7,960 12,771 17,527 23,499 3,834 5,358 39.73%
Non-Subsidized Mortgages 14,286 12,629 13,404 14,315 16,803 3,403 4,270 25.50%
Other Housing 2,500 2,416 2,418 1,823 1,825 421 356 -15.44%
Construction Loan 10,663 11,023 13,219 13,551 15,761 3,636 3,955 8.78%
Non-Housing Loans 10,338 7,569 9,434 12,043 17,087 3,038 3,343 10.06%
Consumer Loan 2,389 2,564 4,268 4,779 6,578 1,160 853 -26.46%
Commercial Loan 7,949 5,005 5,166 7,264 10,508 1,878 2,490 32.62%
Total Loans 44,293 41,598 51,246 59,259 74,975 14,332 17,282 20.59%
y.o.yLoans Type FY 2014FY 2013 FY 2015 FY 20163 Months of
FY 2017

19
Loan Quality: Manageable NPL
Note : Figures on all graphs Include Sharia financing
Gross NPL
(%)
Net NPL
(%)
19
20
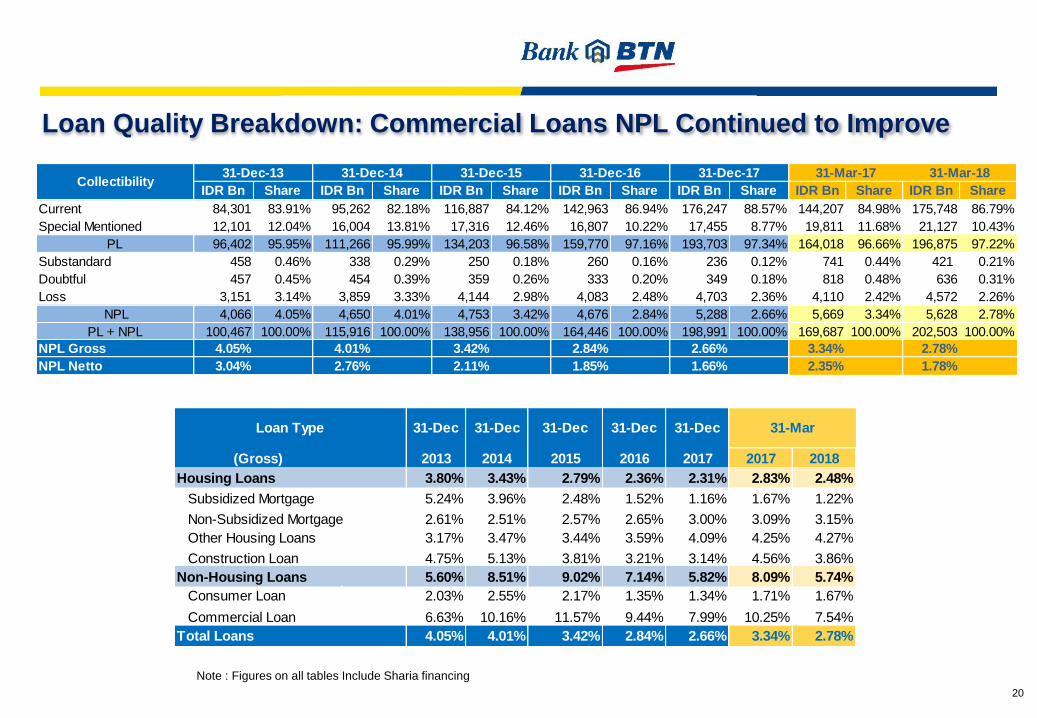
Note : Figures on all tables Include Sharia financing
Loan Quality Breakdown: Commercial Loans NPL Continued to Improve
20
IDR Bn Share IDR Bn Share IDR Bn Share IDR Bn Share IDR Bn Share IDR Bn Share IDR Bn Share
Current 84,301 83.91% 95,262 82.18% 116,887 84.12% 142,963 86.94% 176,247 88.57% 144,207 84.98% 175,748 86.79%
Special Mentioned 12,101 12.04% 16,004 13.81% 17,316 12.46% 16,807 10.22% 17,455 8.77% 19,811 11.68% 21,127 10.43%
PL 96,402 95.95% 111,266 95.99% 134,203 96.58% 159,770 97.16% 193,703 97.34% 164,018 96.66% 196,875 97.22%
Substandard 458 0.46% 338 0.29% 250 0.18% 260 0.16% 236 0.12% 741 0.44% 421 0.21%
Doubtful 457 0.45% 454 0.39% 359 0.26% 333 0.20% 349 0.18% 818 0.48% 636 0.31%
Loss 3,151 3.14% 3,859 3.33% 4,144 2.98% 4,083 2.48% 4,703 2.36% 4,110 2.42% 4,572 2.26%
NPL 4,066 4.05% 4,650 4.01% 4,753 3.42% 4,676 2.84% 5,288 2.66% 5,669 3.34% 5,628 2.78%
PL + NPL 100,467 100.00% 115,916 100.00% 138,956 100.00% 164,446 100.00% 198,991 100.00% 169,687 100.00% 202,503 100.00%
NPL Gross 4.05% 4.01% 3.42% 2.84% 2.66% 3.34% 2.78%
NPL Netto 3.04% 2.76% 2.11% 1.85% 1.66% 2.35% 1.78%
31-Dec-16 31-Dec-1731-Dec-13Collectibility
31-Mar-17 31-Mar-1831-Dec-14 31-Dec-15
31-Dec 31-Dec 31-Dec 31-Dec 31-Dec
(Gross) 2013 2014 2015 2016 2017 2017 2018
3.80% 3.43% 2.79% 2.36% 2.31% 2.83% 2.48%
5.24% 3.96% 2.48% 1.52% 1.16% 1.67% 1.22%
2.61% 2.51% 2.57% 2.65% 3.00% 3.09% 3.15%
Other Housing Loans 3.17% 3.47% 3.44% 3.59% 4.09% 4.25% 4.27%
4.75% 5.13% 3.81% 3.21% 3.14% 4.56% 3.86%
5.60% 8.51% 9.02% 7.14% 5.82% 8.09% 5.74%
Consumer Loan 2.03% 2.55% 2.17% 1.35% 1.34% 1.71% 1.67%
Commercial Loan 6.63% 10.16% 11.57% 9.44% 7.99% 10.25% 7.54%
4.05% 4.01% 3.42% 2.84% 2.66% 3.34% 2.78%
31-Mar
Total Loans
Housing Loans
Subsidized Mortgage
Non-Subsidized Mortgage
Construction Loan
Non-Housing Loans
Loan Type

21
Note : Figures Include Sharia financing
Special-Mentioned Loan
Special-Mentioned by Loan Type
(%)
Total Special-Mentioned Loan
(%)
21

22Note : Figures Include Sharia financing
Restructured Loan
Restructured Loan in 1Q18
(IDR Billion)
Restructured Loan Outstanding
(IDR Billion)
22
Restructured Loan by Quality in 1Q18
(%)

23
Liabilities: Sufficient to Support Loan Growth
Total Liabilities
(IDR Trillion)
Funding Composition
(IDR Trillion)
Funding Composition
(%)
23

24
Deposits: Solid Growth & Liquidity
Total Deposits Mix
(IDR Trillion)
CASA Composition
(%)
24
Deposits FY 2013 FY 2014 FY 2015 FY 2016 FY 2017 1Q2017 1Q2018 y.o.y
Current Account 19.12 23.23 31.37 45.85 54.66 41.73 51.14 22.55%
Savings Account 24.24 25.55 30.76 34.83 40.95 30.74 44.06 43.35%
Time Deposits 52.86 57.70 65.62 79.52 97.35 84.95 99.28 16.87%
Total 96.21 106.48 127.75 160.19 192.95 157.42 194.48 23.54%

25
Total Equity
(IDR Trillion)
CAR - BI
(%)
Equity (1/2)
25

26
Equity (2/2)
26
2013 2014 2015 2016 2016 Mar-17 Mar-18
Tier - 1 Capital 9,879 10,736 12,172 16,443 18,728 16,111 18,324
Tier - 2 Capital 722 797 1,721 3,776 3,368 3,660 3,218
Capital on B/S 11,557 12,253 13,860 19,131 21,663 19,196 21,717
RWA - Credit Risk 57,749 66,251 70,474 86,189 101,494 88,898 101,485
RWA - Market Risk 284 226 223 344 664 792 1,090
RWA - Operational Risk 8,229 9,856 11,185 12,899 14,934 14,934 17,623
RWA - Total 66,262 76,333 81,882 99,432 117,092 104,624 120,199
CAR Tier – 1/(Total RWA) 14.91% 14.07% 14.87% 16.54% 15.99% 15.40% 15.24%
CAR B/S/(Total RWA) 17.44% 16.05% 16.93% 19.24% 18.50% 18.35% 18.07%
CAR BI ((Tier 1+2)/(Total RWA)) 15.62% 14.64% 16.97% 20.34% 18.87% 18.90% 17.92%
CAR Tier – 2 2.10% 3.80% 2.88% 3.50% 2.68%
Capital Conservation Buffer 0.63% 1.25% 1.25% 1.88%
Countercyclical Buffer 0.00% 0.00% 0.00% 0.00%
Capital Surcharge (D-SIB) 0.25% 0.50% 0.50% 0.75%

27
Income Statement(IDR Billion)
27
FY 2013 FY 2014 FY 2015 FY 2016 FY 2017 1Q2017 1Q2018 y.o.y
Interest Income 11,197 13,374 15,567 17,852 20,081 4,559 5,276 15.71%
Interest Expense (5,558) (7,893) (8,700) (9,600) (10,637) (2,523) (2,909) 15.32%
Net Interest Income 5,639 5,482 6,867 8,252 9,444 2,037 2,367 16.20%
Other Operating Income 798 923 1,132 1,285 1,612 384 414 7.82%
Other Operating Expense (4,301) (4,828) (5,465) (6,184) (7,164) (1,636) (1,913) 16.92%
Profit From Operating 2,136 1,577 2,534 3,352 3,892 784 867 10.60%
Non Operating Income (Expense) 5 2 8 (22) (30) 0 7 5319.38%
Profit Before Tax 2,141 1,579 2,542 3,330 3,862 784 874 11.42%
Net Profit 1,562 1,146 1,851 2,619 3,027 594 684 15.13%

28
Interest Income Composition(IDR Billion)
28
FY2013 FY2014 FY2015 FY2016 FY2016 FY2017 1Q2017 1Q2018 Y.o.Y
Placement with Bank Indonesia 74 81 107 111 111 154 24 44 80.07%
Placement with other bank 63 40 37 56 56 15 6 5 -4.20%
Securities 726 982 858 971 971 971 248 230 -7.31%
Loan 9,605 11,353 13,523 15,458 15,458 17,387 3,952 4,583 15.98%
Income from Syariah 729 919 1,042 1,256 1,256 1,553 330 413 25.46%
Total 11,197 13,374 15,567 17,852 17,852 20,081 4,559 5,276 15.71%

29
Interest Expense Composition(IDR Billion)
29
FY2013 FY2014 FY2015 FY2016 FY2016 FY2017 1Q2017 1Q2018 Y.o.Y
Bank Indonesia 5 2 1.06 - - - - - -
Deposits from other Banks 39 84 328 285 285 394 86 57 -33.09%
Deposits from Non Banks 4,082 6,290 6,750 7,363 7,363 7,946 1,942 2,217 14.18%
Securities Issued 826 787 883 1,088 1,088 1,368 292 399 36.93%
Fund Borrowings 450 529 516 718 718 837 181 218 20.21%
Others 157 201 222 147 147 92 23 18 -21.51%
Total 5,558 7,893 8,700 9,600 9,600 10,637 2,523 2,909 15.32%

30
Other Operating Income Composition(IDR Billion)
*) Reclassified
30
FY2013 FY2014 FY2015 FY2016 FY2016 FY2017 1Q2017 1Q2018 Y.o.Y
Marked to market 17 7 - 10 10 7 59 86 45.69%
Gain 32 112 170 273 273 396 70 26 -63.56%
Reversal on Provisions 8 5 7.51 0.10 0.10 0.02 3.71 11.72 215.80%
Commissions, Services & Admin Fee *)31 496 596 656 656 893 177 224 25.99%
Others *) 709 303 358 347 347 315 74 67 -8.41%
Total 798 923 1,132 1,285 1,285 1,612 384 414 7.82%

31
Other Operating Expense Composition(IDR Billion)
31
FY2013 FY2014 FY2015 FY2016 FY2016 FY2017 1Q2017 1Q2018 Y.o.Y
Provisions 441 777 901 708 708 884 138 207 49.88%
Salaries & Employee Benefit 1,161 1,260 1,459 1,619 1,619 1,907 541 579 6.99%
Electricity, Telp, Office Supp. 365 494 591 660 660 853 168 211 25.63%
Others 337 227 422 452 452 592 152 138 -9.43%
Rent, Service & Maintenance 482 542 563 703 703 799 164 190 15.94%
Depreciation 279 226 196 219 219 216 46 57 23.06%
Promotion 411 509 417 402 402 523 103 172 66.60%
Collector Fees & Consultant 386 451 544 684 684 814 199 216 8.18%
Insurance Premium 175 217 245 303 303 366 95 108 13.83%
Training 110 107 106 136 136 165 23 24 5.35%
Research & Development 4 6 7 14 14 13 3 2 -9.88%
Other Taxes 6 8 8 9 9 10 4 2 -57.88%
Gain 1 3 4 2 2 0.42 - 8.04 -
Marked to Market 144 0.00 0.19 0.00 0.00 1.00 0.03 - -
Allowance related to Operational Risk- - - 274 274 19 - - -
Total 4,301 4,828 5,465 6,184 6,184 7,164 1,636 1,913 16.92%

32
Key Financial Ratios (1/4)
Net Income
(IDR Billion)
Net Interest Margin Cost Income Ratio
32

33
Key Financial Ratios (2/4)
ROA1– before tax
1Calculated based on income before income tax (include tax benefit and extraordinary item)/ average total assets based on Bank Indonesia regulation2Calculated based on net profit/average total assets
ROA2– after tax
33

34
Key Financial Ratios (3/4)
ROE3 – tier 1 capital
ROE4 – balance sheet
3Calculated based on net profit/average Tier 1 capital based on Bank Indonesia regulation 4Calculated based on net profit/total stakeholder’s equity
15.28%13.52%
34

35
Key Financial Ratios (4/4)
Loan-to-Deposit Ratio
Liquidity Coverage Ratio
35

36
Sharia Business4.
36

37
Sharia Business
Sharia Assets
(IDR Billion)
Sharia Net Profit
(IDR Billion)
Sharia Deposits
(IDR Billion)
37

38
Sharia Financings & NPF
Sharia Disbursement
(IDR Billion)
Sharia NPF (Gross)
(%)
Sharia NPF (Net)
(%)
Sharia Financings
(IDR Billion)
38

39
Appendices5.
39

40
Share Ownerships Composition as of Mar 31, 2018
• IPO by listed on IDX on 17 December 2009 at IDR800 per
share
• Rights issue successfully done in November 2012 by
issuing additional 1.512.857.500 new shares
• Market cap as of Mar 31, 2018 was IDR 40.24 Trillion
Shares Information
40
Ownership # of Shares %
G O I 6,354,000,000 60.00%
Public 4,236,000,000 40.00%
- Domestic 1,008,073,085 9.52%
- Foreign 3,227,926,915 30.48%
Total 10,590,000,000 100.00%
Period Opening Lowest Highest ClosingAverage Volume
(Lots)PBV (x) BVPS
Market Cap
(IDR Mio)
1Q 2018 2,080 2,080 3,840 3,800 19,852,656 1.85 2,051 40,242,000
1Q 2017 1,745 1,695 2,360 2,270 18,602,925 1.25 1,813 24,039,300
%(yoy) 19.20% 22.71% 62.71% 67.40% 6.72% 47.97% 13.13% 67.40%

41
Outlets
I N D O N E S I A
41
Regional Offices 3
Branch Offices 45
Sub Branch Offices 189
Cash Outlets 368
Sharia Outlets 54
Priority Outlet 27
Post Offices 1,627
ATMs 1,474
Jawa
Regional Offices 1
Branch Offices 12
Sub Branch Offices 44
Cash Outlets 62
Sharia Outlets 11
Priority Outlet 6
Post Offices 700
ATMs 274
Sumatera
Regional Offices -
Branch Offices 3
Sub Branch Offices 9
Cash Outlets 10
Sharia Outlets 1
Priority Outlet 2
Post Offices 141
ATMs 57
Bali & Nusa Tenggara
Regional Offices -
Branch Offices 6
Sub Branch Offices 18
Cash Outlets 20
Sharia Outlets 4
Priority Outlet 5
Post Offices 299
ATMs 104
Kalimantan
Regional Offices 1
Branch Offices 6
Sub Branch Offices 17
Cash Outlets 21
Sharia Outlets 4
Priority Outlet 2
Post Offices 126
ATMs 112
Sulawesi
Regional Offices -
Branch Offices 3
Sub Branch Offices 3
Cash Outlets 4
Sharia Outlets -
Priority Outlet -
Post Offices 61
ATMs 26
Papua & Maluku
2013 2014 2015 2016 2017 31-Mar-17 31-Mar-18
Regional Offices 3 3 4 4 5 4 5
Branch Offices 65 65 65 65 75 71 75
Sub Branch Offices 223 223 223 243 275 241 280
Cash Outlets 479 479 479 477 484 477 485
Sharia Outlets 50 50 50 65 72 65 74
Priority Outlet 23 34 39 40 41 39 42
Total Outlets 843 854 860 894 952 897 961
Post Offices 2,922 2,951 2,951 2,951 2,954 2,951 2,954
ATMs 1,504 1,830 1,830 1,900 1,964 1,951 2,047
Employees 8,011 8,582 9,042 9,380 10,360 9,708 10,941

42
THANK YOU
________________
Investor Relations
PT Bank Tabungan Negara (Persero) Tbk
Menara BTN Lt. 20 - Jl Gajah Mada No. 1
Jakarta Pusat 10130
Telp : +62 21 63870142 / +62 21 63870107
Facs: +62 21 63870104
Email : investor_ [email protected]
Website : www.btn.co.id


