50
Analyst Presentation – Q2 FY 16 November 2,2015

Analyst Presentation – Q2 FY 16
November 2,2015

Confidential
Index
Points Slide No.
Business Overview 3-4
Financial Performance Summary for Q2’16 5-7
Geometric Consolidated Financial Performance for Q2’16 8-17
Revenue & Client Data Geometric Consolidated for Q2’16 18-24
Business Highlights for Q2’16 25
Key Financial Data 26
Operations and HR Data 27-30
Geometric Excl. 3DPLM Financial Performance for Q2’16 31-35
Revenue & Client Data Geometric Excl. 3DPLM for Q2 16 36-39
Business Analysis Geometric Excl. 3DPLM for Q2’16 40
Key Financial Data GL excl 3D 41
General Information 42-50
2

Confidential
• Move in engagement models from transactional and performance based to total solutions, thus increasing the ‘value’ delivered to customer
• Use of Agile methodology - defining and evolution of project specifications on-the-go; thus demanding stronger onshore presence while at the same time managing offshoring
• Move from project management to program management
• Solutions with synergy in design, analysis, manufacturing, and engineering
• Increase in alliances and technology partnerships to deliver end-to-end solutions
• Need for building IP along specialized areas or demonstrate maturity in process to build scale to stay relevant
• Shift in product features will lead to surplus of conventional skills, resulting in a need for multi-skilling, up-skilling, retraining and the ability to do something ‘extra’
Market Forces Driving Our Company
3

Confidential
To combine our expertise across software, engineering and embedded to offer combined or blended solutions to support the move towards systems engineering, connected cars, smart factories, mobility, etc.
Geometric: Strategy 2020
1984
1992
2003
2013
Software Product Dev.
Software Services
Engineering Services
Embedded Solutions
2020
Blended Solutions
I n v e s t i n
More onsite presence
Multiskillingemployees
Program
management
4

Confidential
FINANCIALS
5

Confidential
Summary Q2 FY16
46.45 46.26
44.40 44.29
44.96
46.12
46.60
42.92
46.80
47.46
40.00
41.00
42.00
43.00
44.00
45.00
46.00
47.00
48.00
Q1 FY14 Q2 FY14 Q3 FY14 Q4 FY14 Q1 FY15 Q2 FY15 Q3 FY15 Q4 FY15 Q1 FY16 Q2 FY16
Revenue USD
Revenue USD
*figures in millions
Revenues INR
INR 3,083.52 MnQ-o-Q 3.6%
CQGR
0.22%10 quarter
Net Income
INR 230.24 Mn
EPS
INR 3.57
EBITDA
INR 534.83 Mn
6

Confidential
• Consolidated operating revenue in USD terms increased by 1.4% in current quarter, over previous quarter. In INR
terms, consolidated revenues increased by 3.6% over previous quarter . It increased by 3.6 % Y-o-Y, in terms of
USD & increased by 10.3% in INR terms.
• Q1 FY 16 consolidated (excluding 3D PLM) operating revenues for the quarter increased by 1.7% in USD terms and
increased by 3.9% in INR terms. It increased by 1.8% Y-o-Y, in terms of USD & increased by 9.2% in INR terms.
• Effective tax rate for the quarter including the prior period adjustment is 34.6%.
• EPS after adjusting for extraordinary items is INR 3.57 as against INR 2.97 in Q1 16 and INR 2.56 in Q2 15.
• New contracts amounting to USD 12.14 Mn won during the quarter.
• Total headcount optimized from 4866 in Q1 16 to 4773 in Q2 16.
Summary
7

Confidential
GEOMETRIC CONSOLIDATED PERFORMANCE FOR Q2 FY16
8

Confidential
Income Statement Q-o-Q (figures in INR millions)
9
Income Statement Q2 16 Q1 16 Q2 15 Var (QoQ) Var (YoY)
Operating Revenue (in USD millions) 47.46 46.80 46.12 1.4% 2.9%Exchange Rate 64.98 63.58 60.63 Operating Revenue 3,083.52 2,975.55 2,796.67 3.6% 10.3%Cost Of Revenue (COR) 2,025.53 2,071.79 1,854.81 -2.2% 9.2%Contribution 1,058.00 903.76 941.86 17.1% 12.3%Contribution as % of Operating Revenue 34.3% 30.4% 33.7%Sales & Marketing (S&M) Expense 161.34 171.52 164.42 -5.9% -1.9%General & Administrative (G&A) Expense 472.46 448.66 370.08 5.3% 27.7%Interest and bank charges 10.14 8.71 7.75 16.4% 30.9%Depreciation and Lease Rental 102.51 84.93 92.76 20.7% 10.5%Operating Profit 311.54 189.95 306.86 64.0% 1.5%Operating Profit as % of Operating Revenue 10.1% 6.4% 11.0%Other Income 129.15 142.85 19.55 -9.6% 560.5%Profit Before Tax 440.69 332.79 326.41 32.4% 35.0%PBT as % of Operating Revenue 14.3% 11.2% 11.7%
EBITDA* 553.34 426.43 432.38 29.8% 28.0%EBITDA as % of Operating Revenue* 17.9% 14.33% 15.5%Tax 153.40 83.60 109.36 83.5% 40.3%Minority Interest 59.79 57.92 54.15 3.2% 10.4%Profit After Tax (for the period) 227.51 191.27 162.90 18.9% 39.7%PAT as % of Operating Revenue 7.4% 6.4% 5.8%
Prior Period Adjustments 2.73 0.00 0.00 Adjusted Profit After Tax 230.24 191.27 162.90 20.4% 41.3%PAT as % of Operating Revenue 7.47% 6.43% 5.82%
EPS 3.57 2.97 2.56 20.3% 39.6%Non-recurring items 0.00 Add : Prior period reconciliation (2.73) 0.00 0.00 Add : Consultant Fees 63.00 40.14 0.00 EPS (adjusted for non-recurring items) 4.50 3.59 2.56 25.4% 76.1%
*There was an error in the earlier version – EBITDA reported was 17.14 % as against the correct EBITDA of 17.9% for Q2; Q1 was reported as 13.98% as against the correct EBITDA of 14.33%

Confidential
Balance Sheet Summary
Balance sheet position as on period end
(figures in INR millions)
Sources of Funds Q2 16 Q1 16 Q2 15
Shareholder’s Funds
Share Capital 129.34 129.07 127.95
Share Application Money - 3.85 1.44
Reserves & Surplus 4,211.55 4,017.47 3,787.06
Non-Current Liabilities 99.48 101.36 72.29
Current Liabilities 2,289.06 2,601.89 2,148.41
Minority Interest 765.06 913.70 736.70
Total 7,494.49 7,767.33 6,873.85
Applications of Funds Q2 16 Q1 16 Q2 15
Non-Current Assets
Fixed Assets 1,321.85 1,349.50 1,234.18
Goodwill on Conslidation 538.66 519.30 752.90
Other Non-Current Assets 505.97 639.26 385.14
Current Assets
Current Investments 1,204.54 1,209.47 655.74
Trade Receivables 1,646.45 1,705.79 1,406.22
Cash and Cash Equivalents 759.76 684.77 674.77
Other Current Assets 1,517.26 1,659.24 1,764.89
Total 7,494.49 7,767.33 6,873.85
10

Confidential
Reconciliation of Consolidated Income statement with Clause 41(figures in INR millions)
As per Clause 41 (Printed in the news papers)
Dif
fere
nce3,084 2,095 82 575 121 10 444 154 - 60 230
Re
ven
ue
fr
om
o
per
atio
ns
Emp
loye
e
ben
efit
s e
xpen
se
De
pre
ciat
ion
an
d
amo
rtis
atio
ne
xpen
se
Oth
er
Exp
ense
s
Oth
er
Inco
me
Fin
ance
co
sts
Pro
fit/
(Lo
ss)
fro
m
Ord
inar
y A
ctiv
itie
s b
efo
re t
ax
Tax
Exp
ense
Tax
Exp
ense
in
re
spe
ct o
f e
arlie
r ye
ars
Min
ori
ty
Inte
rest
in
Ne
t P
rofi
t o
f th
e
Sub
sid
iary
C
om
pan
y
Ne
t P
rofi
t/(L
oss
) af
ter
taxe
s an
d m
ino
rity
in
tere
st
As
pe
r In
vest
ors
pre
sen
tati
on
As per Investor Presentation
3,084 Operating Revenue 3,084
-
2,026 Cost Of Revenue (COR) 1,881 7 137 -
161 Sales & Marketing (S&M) Expense 133 28 -
472 General & Administrative (G&A) Expense 115 358 -
10 Interest and bank charges 10 -
100 Depreciation and Lease Rental 74 26 -
314 Operating Profit -
129 Other Income 129 -
443 Profit Before Tax 443 -
535 EBITDA -
153 Tax 153 -
60 Minority Interest 60 -
230 Profit After Tax (for the period) 230 -
Difference(0)
(34) 0 25 (8) - - - - - - -
Expnses clubbed in Manpower Cost under COR in Investor Presentation, however grouped in other expenses in Clause 41 (Sub contracting charges)
41 (41) -
Training Expenses in clause 41 booked under Manpoer expenses, but in analyst PPT it is considered under other expenses
15 (15) -
Reimbursement of shared services distributed over manpower and other expenses in the ration of 70:30, which is not considered in Analyst PPT
(23) 23 -
Misc. incoeme considered in Other income in clause 41 , but it is netted off against miscexpenses in Analyst PPT
2 2 -
Provision for doubtful debts written back considered as income in Clause 41, whereas, netted off with expenses in Investor Presentation
6 6 -
Net Difference-
- - - - - - - - - - -
11

Confidential
Other Income : Details consolidated
(figures in INR millions)
Other Income Q2 16 Q1 16 Q4 15
Investment Income 17.63 14.39 12.87
Sundry balances w/back 0.40 0.74 1.57
Profit on Sale of Assets 0.39 0.31 0.74
Others 4.44 3.07 6.76
Total Income on Investment - (A) 22.87 18.51 21.94
Gain/(Loss) on Subsidiary Revaluation
MTM Gain/ (Loss) (11.56) (10.89) 39.04
Gain/ (Loss) on Realization of Debtors 142.34 163.25 13.89
Gain/ (Loss) on under/ over hedging (24.51) (28.02) (34.25)
Total Gain/(Loss) on Forex - (B) 106.28 124.34 18.68
Total Other Income (A+B) 129.15 142.85 40.62
12

Confidential
Tax Walk
25.1
1.5
6.8
1.1 34.6
15.00
20.00
25.00
30.00
35.00
40.00
Q1 16 One Time tax adjustments One time Deferred tax creditin Q1 on unamortized
goodwill of Teksoft
Increase in losses ofsubsidiaries in Q2
Q2 16
13

Confidential
Profit Trends
0%
2%
4%
6%
8%
10%
12%
14%
16%
18%
20%
Q1 FY14
Q2 FY14
Q3 FY14
Q4 FY14
Q1 FY15
Q2 FY15
Q3 FY15
Q4 FY15
Q1 FY16
Q2 FY16
EBITDA as % of Revenue
0.00
0.50
1.00
1.50
2.00
2.50
3.00
3.50
4.00
Q1FY14
Q2FY14
Q3FY14
Q4FY14
Q1FY15
Q2FY15
Q3FY15
Q4FY15
Q1FY16
Q2FY16
EPS (INR)
0%
5%
10%
15%
20%
25%
30%
35%
Q1FY14
Q2FY14
Q3FY14
Q4FY14
Q1FY15
Q2FY15
Q3FY15
Q4FY15
Q1FY16
Q2FY16
Return on Net Worth
0%
10%
20%
30%
40%
50%
60%
Q1FY14
Q2FY14
Q3FY14
Q4FY14
Q1FY15
Q2FY15
Q3FY15
Q4FY15
Q1FY16
Q2FY16
PAT as % of Revenue Tax as % of Profit
14

Confidential
Consolidated Revenue Analysis
*Onsite includes revenues in near shore centers in high cost countries.
Operating Revenues
(figures in INR millions)
59.25%
35.60%
5.15%
Q1 FY16
LCC HCC IP
59.81%
34.82%
5.37%
Q2 FY16
Other Income Q2 16 % of OPR Q1 16 % of OPR Q2 15 % of OPR
Investment Income 17.63 0.5% 14.40 0.5% 9.93 0.4%
Sale of Assets 0.39 0.0% 0.37 0.0% 3.71 0.1%
FX Gain/(Loss) 106.28 3.3% 124.34 4.0% 5.66 0.2%
Others 4.84 0.2% 3.74 0.1% 0.25 0.0%
Total 129.15 4.0% 142.85 4.6% 19.55 0.7%
15

Confidential
Consolidated Cost Analysis(figures in INR millions)
Cost Of Revenue Q2 16 % of OPR Q1 16 % of OPR Q2 15 % of OPR
Manpower 1,880.81 61.0% 1,910.68 64.2% 1,696.34 60.7%
Travel 44.07 1.4% 60.39 2.0% 60.02 2.1%
Software amortization 7.39 0.2% 8.64 0.3% 25.74 0.9%
Other Software 71.36 2.3% 72.24 2.4% 55.42 2.0%
Staff Welfare 14.25 0.5% 13.80 0.5% 12.56 0.4%
Data Communication 7.65 0.2% 6.04 0.2% 4.75 0.2%
Total 2,025.53 65.7% 2,071.79 69.6% 1,854.81 66.3%
S&M Expense Q2 16 % of OPR Q1 16 % of OPR Q2 15 % of OPR
Manpower 132.85 4.3% 139.21 4.7% 117.72 4.2%
Travel 13.66 0.4% 17.08 0.6% 17.85 0.6%
Other Business Expenses 14.83 0.5% 15.23 0.5% 28.85 1.0%
Total 161.34 5.2% 171.52 5.8% 164.42 5.9%
16

Confidential
Consolidated Cost Analysis contd….(figures in INR millions)
G&A Expense Q2 16 % of OPR Q1 16 % of OPR Q2 15 % of OPR
Manpower 114.76 3.7% 138.49 4.7% 123.96 4.4%
Travel 16.03 0.5% 10.67 0.4% 13.44 0.5%
Facility 106.11 3.4% 106.71 3.6% 91.64 3.3%
Recruitment 6.04 0.2% 9.37 0.3% 17.82 0.6%
Training 10.62 0.3% 10.17 0.3% 7.37 0.3%
Communication & Information System 10.62 0.3% 12.35 0.4% 11.43 0.4%
Insurance 1.25 0.0% 4.08 0.1% 3.19 0.1%
Legal & Professional 140.04 4.5% 85.14 2.9% 46.39 1.7%
Bad Debts 8.22 0.3% 6.97 0.2% 0.40 0.0%
Others 58.77 1.9% 64.72 2.2% 54.44 1.9%
Total 472.46 15.3% 448.66 15.1% 370.08 13.2%
Depreciation & Lease Rentals Q2 16 % of OPR Q1 16 % of OPR Q2 15 % of OPR
Facility Depreciation 23.92 0.8% 19.76 0.7% 21.78 0.8%
Non-facility Depreciation 52.69 1.7% 46.15 1.6% 50.70 1.8%
Lease Rentals 25.90 0.8% 19.01 0.6% 20.27 0.7%
Total 102.51 3.3% 84.93 2.9% 92.76 3.3%
17

Confidential
Offshore Leverage
84 84 85 85 86 86 86 85 85 86
16 16 15 15 14 14 14 15 15 14
-
20
40
60
80
100
Q1 FY 14 Q2 FY 14 Q3 FY 14 Q4 FY 14 Q1 FY 15 Q2 FY 15 Q3 FY 15 Q4 FY 15 Q1 FY 16 Q2 FY 16
LCC HCC
By Revenue
By Effort
Revenue Break up above excludes IP.
(in % terms)
61 60 61 58 61 62 60 60 62 63
39 40 39 42 39 38 40 40 38 37
0
10
20
30
40
50
60
70
Q1 FY 14 Q2 FY 14 Q3 FY 14 Q4 FY 14 Q1 FY 15 Q2 FY 15 Q3 FY 15 Q4 FY 15 Q1 FY 16 Q2 FY 16
18

Confidential
Service Lines – Revenue Distribution
Revenues shown as products in the previous quarters, are now being referred to as IP
(figures in USD millions)
26.76 27.40 27.17 25.80
26.53 27.21
26.38 25.58
28.28 29.01
14.38 13.44
12.06 13.19 13.59 14.09
15.12 13.59
14.90 14.63
2.79 2.80 2.32 2.29 2.07
1.38 1.38
1.16 1.25 1.25
2.512.61 2.84 3.02 2.77 3.45
3.712.59 2.36 2.55
-
5.00
10.00
15.00
20.00
25.00
30.00
35.00
Q1 FY14 Q2 FY14 Q3 FY14 Q4 FY14 Q1 FY15 Q2 FY15 Q3 FY15 Q4 FY15 Q1 FY16 Q2 FY16
Software Services Engineering Services Embedded IP
19
Confidential
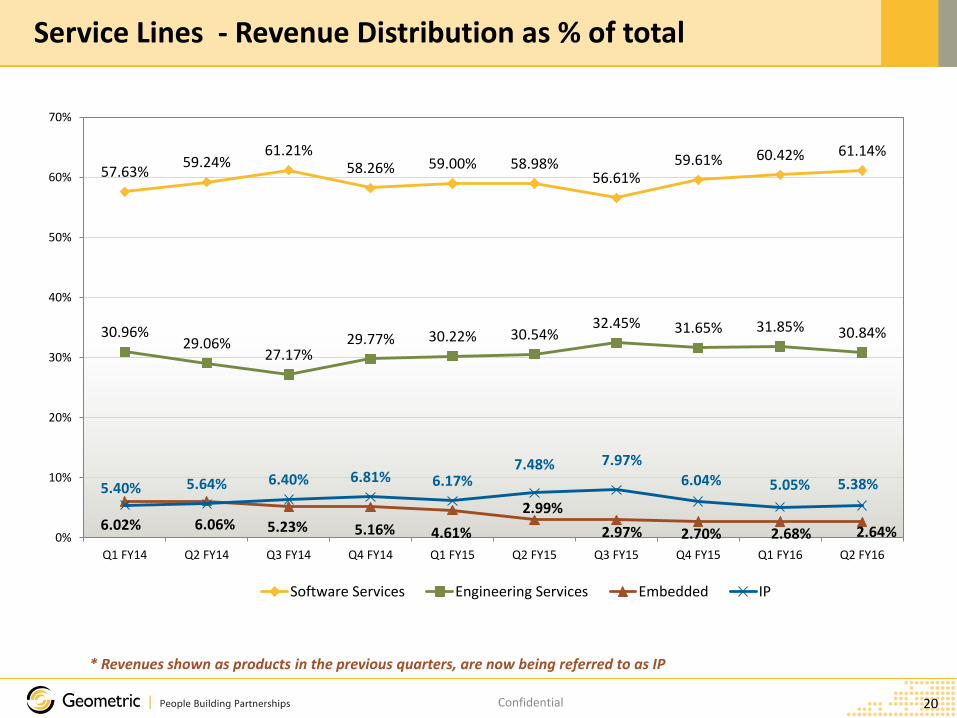
Service Lines - Revenue Distribution as % of total
57.63%59.24%
61.21%58.26% 59.00% 58.98%
56.61%59.61% 60.42% 61.14%
30.96%29.06%
27.17%29.77% 30.22% 30.54%
32.45% 31.65% 31.85% 30.84%
6.02% 6.06% 5.23% 5.16% 4.61%
2.99%
2.97% 2.70% 2.68% 2.64%
5.40% 5.64% 6.40% 6.81% 6.17%7.48% 7.97%
6.04% 5.05% 5.38%
0%
10%
20%
30%
40%
50%
60%
70%
Q1 FY14 Q2 FY14 Q3 FY14 Q4 FY14 Q1 FY15 Q2 FY15 Q3 FY15 Q4 FY15 Q1 FY16 Q2 FY16
Software Services Engineering Services Embedded IP
* Revenues shown as products in the previous quarters, are now being referred to as IP
20

Confidential
Regions
* previous period figures reinstated wherever classication changes to make it comparable
61.05%59.71%
56.80% 55.99%58.29% 57.10% 57.19%
58.42%
61.64%59.85%
31.05% 30.68%32.83% 33.16%
31.93% 33.11%31.26%
28.68%25.93%
28.57%
1.54%
3.42% 3.50% 3.89% 4.03% 4.84% 4.98%6.34% 5.80%
6.09%6.37% 6.19% 6.86% 6.96% 5.76% 4.95%6.57% 6.55% 6.63%
5.49%
0%
10%
20%
30%
40%
50%
60%
70%
Q4 FY13 Q1 FY14 Q2 FY14 Q3 FY14 Q4 FY14 Q1 FY15 Q2 FY15 Q3 FY15 Q4 FY15 Q1 FY16
USA Europe APAC India
21

Confidential
Customer Segments
62.79% 61.88% 61.70% 62.84% 63.28% 63.63% 64.68% 63.96% 62.86% 62.67%
3.23% 2.93% 2.28% 2.40% 2.12% 2.20% 2.08% 2.50% 2.47% 2.44%
33.98% 35.19% 36.02%34.76% 34.59% 34.17% 33.24% 34.24% 34.68% 34.89%
0%
10%
20%
30%
40%
50%
60%
70%
Q1 FY14 Q2 FY14 Q3 FY14 Q4 FY14 Q1 FY15 Q2 FY15 Q3 FY15 Q4 FY15 Q1 FY16 Q2 FY16
Direct Industrial Through Partners Software ISVs
22

Confidential
Customer Analysis
Clients Q2 16 Q1 16 Q2 15
Total number of active clients 56 60 74
Number of new clients added - 1 2
Revenue (%) Q2 16 Q1 16 Q2 15
Top 1 30% 29% 28%
Top 5 59% 58% 52%
Top 10 74% 73% 66%
Number of customers with more than 5% revenue contribution
3 5 4
Clients Q2 16 Q1 16 Q2 15
> $ 10 million 3 4 3
$5 - $10 million 6 4 3
$1 - $5 million 17 16 20
< $1 million 30 36 48
Total number of active Clients refers to number of clients against whom revenue recognition happened during the Quarter
23

Confidential
Deal Analysis
Order Book (USD million) Q2 16 Q1 16 Q2 15
New deals won 12.14 13.65 9.54
New Deal Analysis – Q2 16 (USD Million)
US Europe APAC India Total
Engineering Services 2.85 0.12 0.59 0.31 3.86
Software Services 4.56 2.34 0.78 0.17 7.85
Embedded - 0.36 - 0.08 0.43
Products 0.00 0.00 0.00 0.00 0.00
Total 7.41 2.81 1.36 0.55 12.14
24
Confidential
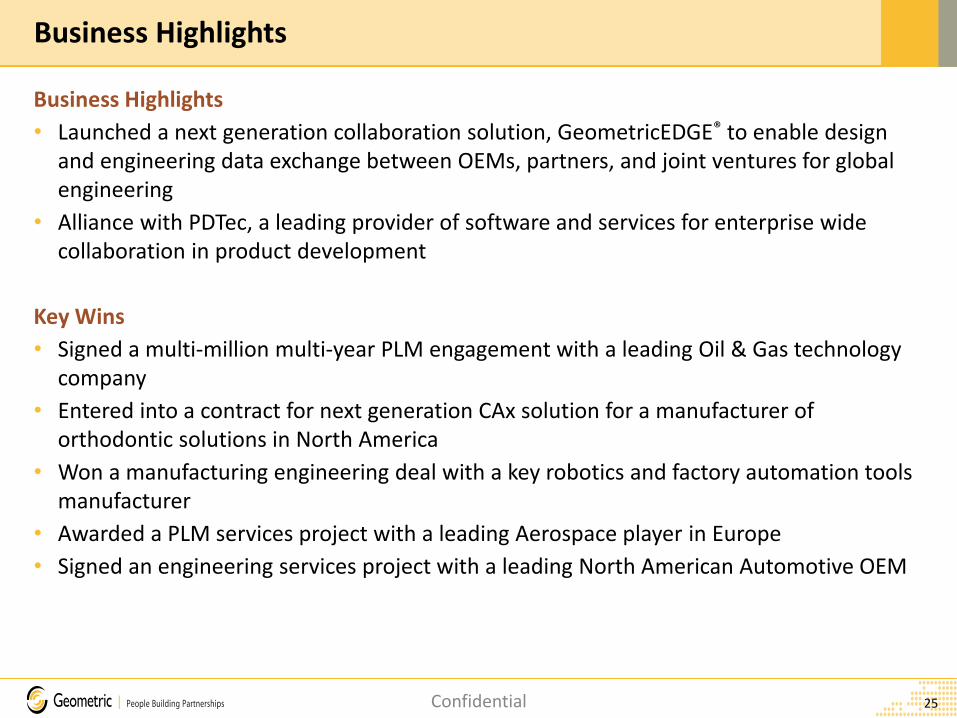
Business Highlights
• Launched a next generation collaboration solution, GeometricEDGE® to enable design and engineering data exchange between OEMs, partners, and joint ventures for global engineering
• Alliance with PDTec, a leading provider of software and services for enterprise wide collaboration in product development
Key Wins
• Signed a multi-million multi-year PLM engagement with a leading Oil & Gas technology company
• Entered into a contract for next generation CAx solution for a manufacturer of orthodontic solutions in North America
• Won a manufacturing engineering deal with a key robotics and factory automation tools manufacturer
• Awarded a PLM services project with a leading Aerospace player in Europe
• Signed an engineering services project with a leading North American Automotive OEM
Business Highlights
25

Confidential
Key Financial Data
Parameter Q2 16 Q1 16 Q2 15
CAPEX (INR million) 224.25 138.08 175.24
DSO 49 53 47
% Tax 34.6% 25.1% 33.50%
Outstanding Loans Q2 16 Q1 16 Q2 15
Working Capital Loan (USD million) 8.16 6.55 5.11
PCFC Loan (USD million) 3.00 3.00 3.00
26

Confidential
OPERATIONS & HR DATA Q2 FY16
27

Confidential
Operational Parameters
GL Consolidated excluding 3D PLM
GL Consolidated
Project Type (%)
Revenue (%) Q2 16 Q1 16 Q2 15
Time & Material 81.6% 81.6% 82.4%
Fixed Price 18.4% 18.4% 17.6%
Utilization (%)
Q2 16 Q1 16 Q2 15
Hourly Utilization 74.11% 72.70% 71.44%
Formula for utilization has changed as below to be in line with Industry Practices effective July 2015 and had been changed retrospectively for reporting purpose• Total billable hours to customer / Planned Hours• Planned Hours = Total available hours – Unpaid leaves and Company holidays
Project Type (%)
Revenue (%) Q2 16 Q1 16 Q2 15
Time & Material 86.6% 86.7% 86.5%
Fixed Price 13.4% 13.3% 13.5%
28

Confidential
Employee Base
40.0%
31.4%
18.6%
10.0% Experience Profile
< 3 years
3 - 6 years
6 - 8 years
> 8 yearsAll numbers as of end of period
-
800
1,600
2,400
3,200
4,000
4,800
Q3'14 Q4'14 Q1'15 Q2'15 Q3'15 Q4'15 Q1'16 Q2'16
2,583 2,588 2,678 2,781 2,913 2,908 2,851 2,691
1681 1706 17281797
1828 1899 2015 2,082
4,264 4,294 4,406 4,578
4,741 4,807 4,866 4,773
Other subsidiaries Parent + Completely owned subsidiaries
Headcount Q2 16 Q1 16 Q4 15
Delivery 4,377 4,463 4,392
Operations Support 52 59 68
Sales31 32 39
Corporate Functions 313 312 308
Total 4,773 4,866 4,807
29
Confidential
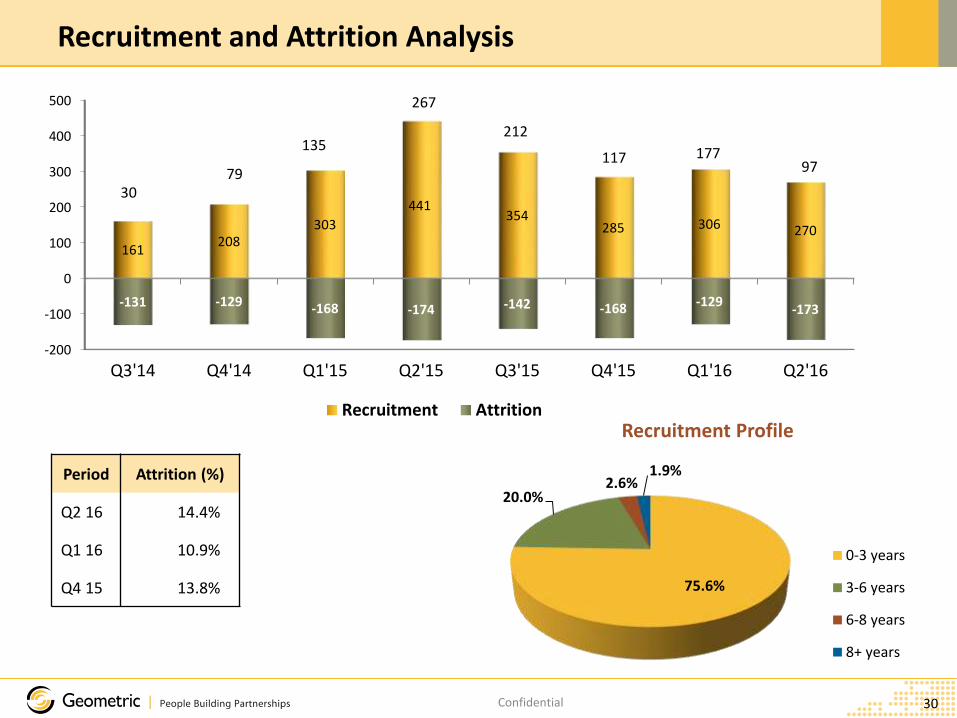
Recruitment and Attrition Analysis
Period Attrition (%)
Q2 16 14.4%
Q1 16 10.9%
Q4 15 13.8% 75.6%
20.0%2.6%
1.9%
Recruitment Profile
0-3 years
3-6 years
6-8 years
8+ years
-200
-100
0
100
200
300
400
500
Q3'14 Q4'14 Q1'15 Q2'15 Q3'15 Q4'15 Q1'16 Q2'16
161208
303
441354
285 306 270
-131 -129 -168 -174 -142 -168 -129-173
Recruitment Attrition
3079
135
267
212
117 17797
30

Confidential
GEOMETRIC EXCL 3D PERFORMANCE FOR Q2 FY16
31

Confidential
Income Statement Q-o-Q(figures in INR millions)
32
Income Statement Q2 16 Q1 16 Q2 15 Var (QoQ) Var (YoY)
Operating Revenue (in USD millions) 34.55 33.99 33.94 1.7% 1.8%Exchange Rate 65.00 63.62 60.58 Operating Revenue 2,245.86 2,162.31 2,056.18 3.9% 9.2%Cost Of Revenue (COR) 1,501.46 1,561.91 1,423.18 -3.9% 5.5%Contribution 744.40 600.39 633.00 24.0% 17.6%Contribution as % of Operating Revenue 33.1% 27.8% 30.8%Sales & Marketing (S&M) Expense 161.34 171.23 164.42 -5.8% -1.9%General & Administrative (G&A) Expense 353.15 329.24 280.39 7.3% 25.9%Interest and bank charges 9.85 8.31 7.54 18.6% 30.7%Depreciation and Lease Rental 44.29 31.66 41.36 39.9% 7.1%Operating Profit 175.76 59.96 139.30 193.1% 26.2%Operating Profit as % of Operating Revenue 7.8% 2.8% 6.8%Other Income 51.39 58.21 (1.81) -11.7% -2947.2%Profit Before Tax 227.15 118.17 137.49 92.2% 65.2%PBT as % of Operating Revenue 10.1% 5.5% 6.7%
EBITDA * 281.30 158.14 190.88 77.9% 47.4%EBITDA as % of Operating Revenue* 12.5% 7.3% 9.3%Tax 82.21 9.10 49.37 803.8% 66.5%Profit After Tax (for the period) 144.94 109.08 88.12 32.9% 64.5%PAT as % of Operating Revenue 6.5% 5.0% 4.3%
Prior Period Adjustments 0.00 0.00 0.00 Adjusted Profit After Tax 144.94 109.08 88.12 32.9% 64.5%PAT as % of Operating Revenue 6.5% 5.0% 4.3%
EPS 2.24 1.69 1.38 32.7% 62.4%Non-recurring itemsAdd : Consultant Fee 63.00 40.14 0.00 EPS (adjusted for non-recurring items) 3.22 2.31 1.38 39.2% 133.0%*There was an error in the earlier version – EBITDA reported was 7.8 % as against the correct EBITDA of 12.5% for Q2; Q1 was reported as 6.8% as against the correct EBITDA of 7.3%

Confidential
Other Income : Details excluding 3D PLM
(figures in INR millions)
Other Income Q2’ 16 Q1’ 16 Q4‘ 16
Investment Income 10.90 6.32 5.99
Sundry balances w/back 0.40 0.74 0.00
Profit on Sale of Assets 0.04 0.06 -
Others 4.00 0.53 5.56
Total Income on Investment - (A) 15.34 7.65 11.55
MTM Gain/ (Loss) (10.80) (0.98) 15.90
Gain/ (Loss) on Realization of Debtors 58.01 57.02 (47.42)
Gain/ (Loss) on under/ over hedging (11.16) (5.45) (25.27)
Total Gain/(Loss) on Forex - (B) 36.05 50.59 (56.79)
Total Other Income (A+B) 51.39 58.24 (45.24)
33

Confidential
Operating Revenue Analysis
Operating Revenues
(figures in INR millions)
*Onsite includes revenues in near shore centers in high cost countries
43.90%49.01%
7.09%
Q1 FY16
LCC HCC IP
44.79%47.82%
7.39%
Q2 FY16
Other Income Q2 16 % of OPR Q1 16 % of OPR Q2 15 % of OPR
Investment Income 10.90 0.5% 6.32 0.3% 4.73 0.2%
Sale of Assets 0.04 0.0% 0.05 0.0% 0.22 0.0%
FX Gain/(Loss) 36.05 1.6% 50.59 2.3% -6.82 -0.3%
Others 4.40 0.2% 1.25 0.1% 0.06 0.0%
Dividend Income from 3D PLM 0.00 0.0% 0.00 0.0% 0.00 0.0%
Total 51.39 2.2% 58.21 2.6% (1.81) -0.1%
34

Confidential
Cost Analysis (figures in INR millions)
Cost Of Revenue Q2 16 % of OPR Q1 16 % of OPR Q2 15 % of OPR
Manpower 1,376.16 61.3% 1,413.36 65.4% 1,276.49 62.1%
Travel 41.80 1.9% 58.28 2.7% 57.26 2.8%
Software amortization 6.56 0.3% 8.11 0.4% 24.58 1.2%
Other Software 62.55 2.8% 70.38 3.3% 53.88 2.6%
Staff Welfare 6.77 0.3% 5.90 0.3% 6.22 0.3%
Data Communication 7.34 0.3% 5.88 0.3% 4.75 0.2%
Total 1,501.18 66.8% 1,561.91 72.2% 1,423.18 69.2%
G&A Expense Q2 16 % of OPR Q1 16 % of OPR Q2 15 % of OPR
Manpower 93.16 4.1% 118.24 5.5% 105.60 5.1%
Travel 9.16 0.4% 7.89 0.4% 9.77 0.5%
Facility 60.26 2.7% 60.53 2.8% 57.49 2.8%
Recruitment 4.96 0.2% 8.54 0.4% 16.89 0.8%
Training 7.04 0.3% 8.61 0.4% 5.48 0.3%
Communication & Information System 10.12 0.5% 11.32 0.5% 9.62 0.5%
Insurance 0.22 0.0% 3.20 0.1% 2.26 0.1%
Legal & Professional 133.93 6.0% 78.99 3.7% 43.54 2.1%
Bad Debts 8.22 0.4% 6.97 0.3% 0.40 0.0%
Others 26.08 1.2% 24.95 1.2% 29.35 1.4%
Total 353.15 15.7% 329.24 15.2% 280.39 13.6%
Depreciation & Lease Rentals Q2 16 % of OPR Q1 16 % of OPR Q2 15 % of OPR
Facility Depreciation 7.77 0.3% 7.64 0.4% 8.38 0.4%
Non-facility Depreciation 10.87 0.5% 5.00 0.2% 12.89 0.6%
Lease Rentals 25.64 1.1% 19.01 0.9% 20.09 1.0%
Total 44.29 2.0% 31.66 1.5% 41.36 2.0%
35

Confidential
Offshore Leverage
73 73 74 74 75 75 76 74 74 74
27 27 26 26 25 25 24 26 26 26
0
10
20
30
40
50
60
70
80
Q1 FY14 Q2 FY14 Q3 FY14 Q4 FY14 Q1 FY15 Q2 FY15 Q3 FY15 Q4 FY15 Q1 FY16 Q2 FY16
LCC HCC
By Revenue
By Effort
Revenue Break up above excludes IP.
(in % terms)
45 42 43 4146 46 45 45 47 48
55 58 57 5954 54 55 55 53 52
0
10
20
30
40
50
60
70
Q1 FY14 Q2 FY14 Q3 FY14 Q4 FY14 Q1 FY15 Q2 FY15 Q3 FY15 Q4 FY15 Q1 FY16 Q2 FY16
36

Confidential
Service Lines – Revenue Distribution
13.62
13.96
14.40
13.88 14.39
15.02
14.55
14.11
15.46 16.11
14.38
13.44
12.06
13.19 13.59 14.09
15.12
13.59
14.90 14.63
2.79 2.80 2.32 2.29 2.07
1.38 1.38 1.16 1.25
1.25
2.51 2.61 2.84 3.02 2.77
3.45 2.87
2.59 2.36 2.55
-
2.00
4.00
6.00
8.00
10.00
12.00
14.00
16.00
18.00
Q1 FY14 Q2 FY14 Q3 FY14 Q4 FY14 Q1 FY15 Q2 FY15 Q3 FY15 Q4 FY15 Q1 FY16 Q2 FY16
Software Services Engineering Services Embedded IP
* Revenues shown as products in the previous quarters, are now being referred to as IP
(figures in USD millions)
37

Confidential
Service Lines - Revenue Distribution as % of total
40.89%
42.54%45.53%
42.88%
43.83%
44.26%
41.84%
44.88% 45.50% 46.63%
43.18%
40.96%
38.15%
40.74%
41.39%
41.50%
43.50%
43.19% 43.85%42.35%
8.39%8.55%
7.34%7.07% 6.32%
4.06% 3.98%3.69% 3.69% 3.63%
7.53%7.95%
8.98% 9.31%8.45%
10.17%10.68%
8.24%6.95% 7.39%
0%
5%
10%
15%
20%
25%
30%
35%
40%
45%
50%
Q1 FY 14 Q2 FY 14 Q3 FY 14 Q4 FY 14 Q1 FY 15 Q2 FY 15 Q3 FY 15 Q4 FY 15 Q1 FY 16 Q2 FY 16
Software Services Engineering Services Embedded IP
** Revenues shown as products in the previous quarters, are now being referred to as IP
38

Confidential
46.3%
22.7%
9.5%
14.5%7.1%
Automotive Industrial Aerospace E & S IP
47.2%
22.2%
9.7%
14.0%6.9%
Revenue Breakup by Verticals
Q2 16Q1 16
Vertical break-up excludes 3D Revenue
Vertical (%) Q2 16 Q1 16
Automotive 47.2% 46.3%
Industrial 22.2% 22.7%
Aerospace 9.7% 9.5%
E & S 14.0% 14.5%
IP 6.9% 7.1%
39

Confidential
Business Analysis Q2 FY 16
• Analysis has been done assuming a constant currency & manpower cost has been taken at standard cost• Software Services includes IP
VerticalsSoftwareServices
Engineering Services
Embedded
Revenue ($ Mn) 17.72 14.76 1.21
CM % 44.2% 20.6% -2.8%
OP % 16.9% -7.2% -32.2%
PBT % 20.4% -3.3% -28.0%
Verticals Automotive Industrial Aerospace E&S IP
Revenue ($ Mn) 15.92 7.57 3.21 4.68 2.45
CM % 28.5% 22.6% 33.2% 48.4% 50.4%
OP % 2.1% -4.9% 0.5% 27.0% 11.5%
PBT % 5.9% -1.3% 4.1% 30.5% 15.2%
40

Confidential
Key Financial Data
Forward Contracts Q2 16 Q1 16 Q4 15
Forward Cover > 90 Days(USD Mn) 22.73 21.49 20.70
Forward cover < 90 Days(USD Mn) 6.18 6.99 5.02
Total (USD Mn) 28.90 28.48 25.72
Forward Cover > 90 Days(EUR Mn) 5.56 2.91 2.64
Forward Cover < 90 Days(EUR Mn) 1.63 1.39 1.26
Total (EUR Mn) 7.19 4.30 3.90
USD
Average Rate 69.37 68.75 68.21
> 90 Days(USD Mn) 22.73 21.49 20.70
Average Rate 67.19 66.13 63.99
< 90 Days(USD Mn) 6.18 6.99 5.02
EUR
Average Rate 76.67 76.51 79.14
> 90 Days(EUR Mn) 5.56 2.91 2.64
Average Rate 77.58 79.07 83.61
< 90 Days(EUR Mn) 1.63 1.39 1.26
MTM on Forward Cover > 90 Days (INR Mn) (2.84) 21.53 31.25
MTM on Forward covers < 90 Days (INR Mn) 5.93 12.49 3.80
Total (INR Mn USD-INR)* 3.08 34.02 35.04
MTM on Forward Cover > 90 Days (INR Mn) (10.74) 5.45 22.04
MTM on Forward covers < 90 Days (INR Mn) 5.38 9.60 19.43
Total (INR Mn EUR-INR)* (5.35) 15.05 41.47
*Closing spot rate for calculating MTM USD-INR 65.73 63.73 62.38
*Closing spot rate for calculating MTM EUR-INR 74.00 71.34 67.39
41

Confidential
GENERAL INFORMATIONQ2 FY16
42

Confidential
• Q2 FY16 Results Conference Call is scheduled on Tuesday, November 3rd, 2016 at 10:30 hrs IST
• Geometric will be represented by
• Mr. Manu Parpia, MD & CEO
• Mr. Shashank Patkar, CFO
• Mr. Rajiv Salkar, Global Head Sales
• Dial-in details
Conference Call Details
Location Access Number
Primary Access Number + 91.22.39600622
Secondary Access Number + 91.22. 67465822
Non-India Toll Free Numbers
USA + 1.866.7462133
UK 0.808.1011573
Singapore 800.1012045
Hong Kong 800.964448
43

Confidential
About Geometric
Geometric is a specialist in the domain of engineering solutions, services and technologies. Its portfolio of GlobalEngineering services, Product Lifecycle Management (PLM) solutions, Embedded System solutions, and DigitalTechnology solutions enables companies to formulate, implement, and execute global engineering andmanufacturing strategies aimed at achieving greater efficiencies in the product realization lifecycle.
Listed on the Bombay and National stock exchanges in India, the company recorded consolidated revenues of Rupees11.05 billion (US Dollars 180.61 million) for the year ended March 2015. It employs over 4800 people across 13 globaldelivery locations in the US, France, Germany, Romania, India, and China. Geometric has been assessed at MaturityLevel 3 for CMMI 1.3- Development and CMMI 1.3-Services for its Software and Engineering Services business unitsand is ISO 9001:2008 certified for engineering operations. The company’s operations are also ISO 27001:2005certified.
The copyright/ trademarks of all products referenced herein are held by their respective companies.
For more information, please contact: [email protected]
About Geometric
44

Confidential
END OF PRESENTATION
45

Confidential
INTERPRETATION GUIDE FOR REPORTED DATA
46

Confidential
Guide 1
Slide # Item Explanation
10,33 Income Statement Income statement provided is in the MIS format.MIS format is different from the income statement published as part of financial results in terms of grouping of cost elements.Key differences to be noted are as follows:1. MIS format breaks-up operating costs as COR, S&M and G&A2. Depreciation line item in MIS format also includes the lease rentals for computing
hardware (CAPEX equivalent) and excludes software depreciation which is clubbed under software expenses in COR
3. FX gain/(loss) is grouped under Other Income in MIS format as against operating cost in financials.
For EBITDA calculation, amortization software has been added and lease rentalshave been reduced in depreciation
19,37 HCC & LCC HCC: Delivery from high cost countryLCC: Delivery from low cost country
13,34 Investment Income Investment income includes dividend from mutual funds, interest earned on bank deposits and profit on sale of mutual fund investments.
17,18,36 Manpower Manpower costs in MIS exclude staff welfare, but include mediclaim and group insurance cost and Subcontracting vis-à-vis personnel costs in financials
47

Confidential
Guide 2
Slide # Item Explanation
17,18,36 Travel Reimbursement of travel expenses are grouped under travel expenses while the same has been grouped under other expenses in financial result advertisement
18,36 Facility Facility costs include rent and service charges, electricity charges, repairs and maintenance excluding that of EPABX and UPS
18,36 Facility Depreciation Includes depreciation on leasehold land, building, electrical installations, office equipmentsand furniture and fixtures
18,36 Non-facility Depreciation
Primarily consists of depreciation on computing hardware
18,36 Lease Rentals Includes lease rent paid for computing hardware
20,21,22,23,24,38,39,40
Revenue Analysis Analysis reported is for USD operating revenue
48

Confidential
Guide 3
Slide # Item Explanation
23 Customer Segments Software ISV segment consists of S/W product companies giving us OPD business. Strategic Partner segment consists of S/W product and consulting companies engaging in PLM Solutions and Engineering Services business. Direct Industrial segment consists of industrial companies sourcing all types of services from Geometric.
24 Customer Revenue Analysis
Analysis reported is for USD operating revenue. Distribution is on the basis of annualized figures (i.e. quarterly revenue x 4).
25 Order Book New deals won refers to new business wins with existing or new customers. This excludes ramp-up in or extension of existing contracts.
29 Project Type Revenue Analysis
Analysis reported is for USD operating revenue excluding Products and H/W reimbursement revenue.
49

Confidential
Guide 4
Slide # Item Explanation
30 Employee Base Employee headcount reported includes all permanent employees and non-permanent employees working on billed positions.
30 Experience Profile Distribution reported is for all employees including sales and corporate support functions
31 Attrition Only undesired attrition data is reported. Difference in the net addition reported on slide 34 and difference in headcount reported in slide 33 is on account of desired attrition.% Attrition reported is on an annualized basis.
27 DSO DSO reported is on a quarterly basis
27 % Tax Includes impact of FBT and deferred tax
27 CAPEX Includes normal CAPEX and purchase value of leased computing hardware
27 Outstanding Loans All FX loans are revalued at the end of the quarter based on the closing exchange rate
50


