67
1 Analyst/Investor Day June 2006

1
Analyst/Investor Day
June 2006

2
These materials do not constitute an offer to sell or the solicitation of an offer to purchase any security. These materials contain "forward-looking statements" as defined in the U.S. Private Securities Litigation Reform Act of 1995. These statements are based on current Company expectations and are subject to risks and uncertainties, which could cause actual results to differ materially. Such risks and uncertainties include, but are not limited to: fluctuations in interest rates and foreign currency exchange rates; market acceptance of new trading technologies; global and regional economic conditions and legislative, regulatory and political developments; and domestic and international competition in the Company's global markets. Additional information regarding these and other factors is available in the Company's reports available on request from the Company.
This document may not be distributed where to do so would be unlawful. This document may not be distributed in the UK except to persons falling within article 19 of the Financial Services and Markets Act 2000 (Financial Promotion) Order 2001.

3
ICAP Americas
Ron Purpora - COODoug Rhoten - CEO

4
Securities Division – Voice and Hybrid
• Core Divisions– Treasury Products– Mortgage Securities– Federal Agency Issues– Repurchase Agreements– Corporate Products including
• Corporate Bonds• CDS• Emerging Markets• Equity and Related

5
Treasuries – Off-the-Run Products
12%
59%20%
6%
ICAPTullett-PrebonHill FarberBGC/Cantor
Estimated Market Share – North AmericaEstimated Market Share – North AmericaHighlightsHighlights
• Market Share – 59%– Rank #1
• Hybrid Brokerage Service– 50% conducted electronically
with Brokertec– Enhanced group margins
• ICAP accounts for all electronic trading in this product group
• Dominant market shares in Bills, Short Coupons, TIP’s

6
Mortgage Securities
32%
31%
5%
3% 5%
24% ICAPTullett-PrebonHill FarberTraditionChapdelaineBGC
Estimated Market Share – North AmericaEstimated Market Share – North AmericaHighlightsHighlights
• Market Share – 32%– Rank: Co-Leader
• Technology Deployed– Voice Service with proprietary
screens– Separate liquidity pools for e-
trading• ICAP accounts for all
electronic trading in this product group
• 36 brokers, 29% margin on Net Brokerage
• Developing products– Derivatives – CMBS, ABS

7
Agency Issues
75%
4%
20%
1%
ICAPTullett-PrebonBGCTradition
Estimated Market Share – North AmericaEstimated Market Share – North AmericaHighlightsHighlights
• Market Share – 75%– Rank #1
• Technology Deployed– Voice service with proprietary
market screens– Separate liquidity pools for e-
trading• ICAP accounts for all
electronic trading in this product group

8
Repurchase Agreements
59%
6%3%3%
29%
ICAPTullett-PrebonBGCTraditionHill Farber
Estimated Market Share – North AmericaEstimated Market Share – North AmericaHighlightsHighlights
• Market Share – 59%– Rank #1
• Franchise approach– Scale
• Technology Deployed– Separate liquidity pools for
exclusive e-trading– Hybrid capabilities among
franchises
9
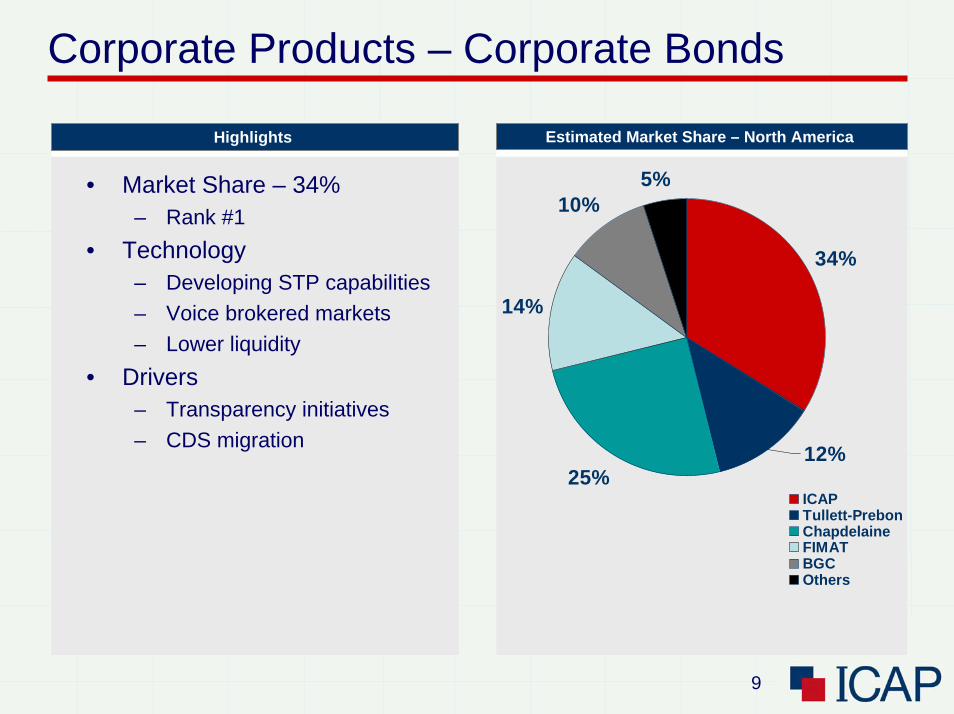
Corporate Products – Corporate Bonds
34%
25%
14%
10%5%
12%
ICAPTullett-PrebonChapdelaineFIMATBGCOthers
Estimated Market Share – North AmericaEstimated Market Share – North AmericaHighlightsHighlights
• Market Share – 34%– Rank #1
• Technology– Developing STP capabilities– Voice brokered markets– Lower liquidity
• Drivers– Transparency initiatives– CDS migration

10
Corporate Products – CDS
17%
8%10%
16%
12%
26%
11%
ICAPGFITullett-PrebonCreditExCreditTradeChapdelaineOthers
Estimated Market Share – North AmericaEstimated Market Share – North AmericaHighlightsHighlights
• Market Share – 17%– Rank #2
• Established Single Name, EMK, Hi-Yield Index
• Growth in Structured, CMBS• Technology
– AffirmXpress• Automated confirmation
process offering significant efficiencies
• One of 3 participating brokers
– Hybrid Market development • Drivers
• Market take-up at expense of cash credit
• Consolidation

11
Capital Markets Introduction
• Divisions covered – Emerging Products– Structured Products– Equity Derivatives– Emerging Markets– Energy– Interest Rate Derivatives– Money Market– Foreign Exchange

12
Product sectorsCommoditized – low margin, slow growthAREA PROFIT MARGIN MARKET GROWTH
Repo Low LowCash Medium LowForward FX Medium LowEmerging Spot FX Low Low
• Hybrid model• i-Depo• e-trading needed for higher margins• STP
High Margin VoiceAREA PROFIT MARGIN MARKET GROWTH
$ IR Derivatives High MediumIR Options High MediumNDF’s High MediumEnergy High HighFX Options High High
• Specialization• Consolidation• Volbroker e-trading
Emerging ProductsAREA PROFIT MARGIN MARKET GROWTH
All Products High High

13
Build Verbal Liquidity
• Market Share Goal: 35%• Production Specialization• Displace Customer Sales force• Invest in Emerging Products• Customers Help Drive Process

14
Creating Indices
• 19900 Telerate• CMM on Telerate 19944• ISDA Swapfix• Fed Funds (Telerate page 5)• SwapPX• GovPX• LatAm markets through Bloomberg• Mexico markets through Bloomberg• ICAP Markets Blog

15
Foreign Exchange – Voice market
65%
35%
ICAPTullett-Prebon
SpotSpot
ForwardsForwards
45%
15%
10%
30%
ICAPTullett-PrebonGFIOther
NDF’sNDF’s
40%15%
10%
35%
ICAPTullett-PrebonTraditionOther

16
Money Market
38%
17%
17%
28%
ICAPTullett-PrebonEurobrokersTradition
Estimated Market Share – North AmericaEstimated Market Share – North AmericaHighlightsHighlights
• Market Share – 38%– Rank #1
• Technology– iFeds– Financial Oxygen STP
• Benchmark Index– Telerate Page 5
• Partnership– Financial Oxygen– (JP Morgan & BOA)
• Future Drivers– iFeds– Whole Loans– GSE’s

17
ICAP Voted Top Broker in…
• …22 Interest Rate and 11 Currency Derivatives groupings.
• Summary of 2005 Risk Survey Rankings:ICAP #1 in:– Interest Rate Swaps – Interest Rate Options – OIS – Cross Currency Swaps – FX Forwards– Credit Derivatives

18
$ Interest Rate Derivatives
40%13%
12%5%
30%
ICAPTullett-PrebonOtherGFITradition
Estimated Market Share – North AmericaEstimated Market Share – North AmericaHighlightsHighlights
• Market Share – 40%– Rank #1
• Technology– FRACross– Swapswire STP– iSwap & Datatec
• Benchmark Index– Telerate 19900 & SwapPX– ISDA Swapfix
• Partnership– Swapswire– ISDA
• Drivers– FRACross– Short Swap push– Hybrid trading– Structured Products

19
Emerging Market Derivatives
50%12%
18%
20%
ICAPTullett-PrebonLocal BrokersGFI
Estimated Market Share – North AmericaEstimated Market Share – North AmericaHighlightsHighlights
• Market Share – 50%– Rank #1
• Technology– Datatec– Sipo
• Benchmark Index– 12 Bloomberg pages– LatAm PX
• Partnership– LatAm Stock Exchanges
• Drivers– FRACross– Chilean IRS– Colombian IRS– Asian IRS– Mexican CPI

20
Non-Securities GrowthHighlightsHighlights
01/02 02/03 03/04 04/05 05/06
Operating Profit
– Operating Profit Increased by 265%– Net Revenue Increases by 130% – Profit Margin Increased from 15% to 24%
01/02 02/03 03/04 04/05 05/06
Net Revenue

21
Macro Market TrendsKey Environmental Factors Impact on ICAP
Macroeconomic imbalances in commodities and credit
Price volatility. Growth in CDS, FX, Energy, Derivatives, Futures.
Search for Yield …………………….
Growth in structured credit, equity, commodity and interest rate products.
Commoditisation of “flow” markets…..
Higher volumes, polarized risk, e-trading opportunities and expanded customer base.
Agency to principle model equity markets …..
Supplement reduction in dealer sales forces.
Liberalization of emerging markets
Growth in local currency derivatives, fixed income and credit markets.

22
ICAP’s biggest opportunity
• Structured products • Equity derivatives• Emerging markets
Growth Products
Consolidation Opportunities
• Energy• Equity Derivatives• Equities

23
ICAP Voted ‘Best of the Best’…
• …within energy commodity markets
• The highest honor within the brokerage category … 2nd year running

24
Energy PositioningOpportunity - ConsolidationOpportunity - Consolidation
– Operating Profit Increased by 290%– Net Revenue Increases by 270%
01/02 02/03 03/04 04/05 05/06
Operating ProfitNet Revenue

25
LatAm StrategyOpportunity – Grow footprintOpportunity – Grow footprint
Drivers for Growth in the Market
• Continued liberalization of local LatAmmarkets
• NDF sectorization• Derivative sectorization• International distribution of local products
• SIF/Garban Mexico• Technology
– Datatec & Sipo• LatAm Expansion
– 5 Stock Exchange Joint Ventures– Purchase and merge 2 largest Colombian voice
brokers– Open Brazil branch
Our Positioning

26
Structured Products DivisionProducts Status
• Hired 10 broker Structured CDS team in 2005
• Hired 5 broker Index team
• #1 broker in FX Options
• Restructuring to combine with derivatives
• Structured CDS
• Structured Interest Rate
• FX Options
• Structured Notes
• Commodities
• Equity Derivatives/Exotics

27
Equity Derivatives
• Hyper growth in index products• Dealer move from agency to principle
model• Reduction of dealer sales forces• Expansion of customer base• Need for bilateral block trade negotiation• Sectorization of single names• Structured and exotic desk• Expand variance and correlation desk

28
Structured Interest Rate ProductsOpportunity – Pursue emerging sectorsOpportunity – Pursue emerging sectors
• Libor digital caps/floors• CMS spread caps/floors• Callable range accrual swaps• Capped callable floaters• Constant Maturity Mortgage• US CPI swaps/options• Other structured swaps

29
OpportunitiesEmerging Products Growth
• Energy Consolidation (Oil)
• Equity Derivatives
• Whole Loan Brokering
• Logistic Derivatives
• Electronic Trading
• Exotic Derivatives
• Structured CDS
• Structured Equities
• Real Estate Derivatives

30
Product evolution
Build Market Share
Commoditization
FosterBank
Interest
DevelopingProducts
Migration toelectronic

31
A Global E-broking Business
Jack JefferyCEO of ICAP Electronic Broking
32
A strategy for growth“ICAP’s e-strategy will create the largest global electronic
broker in liquid, commoditised OTC markets”

33
Foreign Exchange

34
Spot FX volumesGlobal FX Average Daily Volume - Single Count
0
20
40
60
80
100
120
140
160
180
200
Jan-9
6Ju
l-96
Jan-9
7Ju
l-97
Jan-9
8Ju
l-98
Jan-9
9Ju
l-99
Jan-0
0Ju
l-00
Jan-0
1Ju
l-01
Jan-0
2Ju
l-02
Jan-0
3Ju
l-03
Jan-0
4Ju
l-04
Jan-0
5Ju
l-05
Jan-0
6
US$
Bill
ions
Jun-0
6

35
Foreign Exchange• EBS Spot
– Average daily volumes - USD 145 billion– Record trading of USD 259 billion on 17 May 06– Top five trading days all recorded in 2006– >2,000 traders on >820 dealing floors across the globe

36
EBS Prime volumesEBS Prime Average Daily Volume (US$bn)
0
5
10
15
20
25
30
35
40
45
50
Jan-2
004
Mar-20
04May
-2004
Jul-2
004
Sep-20
04Nov
-2004
Jan-2
005
Mar-20
05May
-2005
Jul-2
005
Sep-20
05Nov
-2005
Jan-2
006
Mar-20
06May
-2006
US$
Bill
ions

37
Foreign Exchange• EBS Spot
– Average daily volumes - USD 145 billion– Record trading of USD 259 billion on 17 May 06– Top five trading days all recorded in 2006– >2,000 traders on >820 dealing floors across the globe
• EBS Prime– 149 users now live
• 37 non-bank customers including hedge funds• 112 bank customers

38
EBS Spot Ai - algorithmic trading volumes
EBS Ai Volume Trend Analysis
0
5
10
15
20
25
30
35
40
45
May-20
03Sep
-2003
Jan-2
004
May-20
04Sep
-2004
Jan-2
005
May-20
05Sep
-2005
Jan-2
006
May-20
06
0 %
5 %
10 %
15 %
20 %
25 %Ai Average Daily Volume ($ bil) Ai Market Share %
June
-2006

39
Foreign Exchange• EBS Spot
– Average daily volumes - USD 145 billion– Record trading of USD 259 billion on 17 May 06– Top five trading days all recorded in 2006– >2,000 traders on >820 dealing floors across the globe
• EBS Prime– 149 users now live
• 37 non-bank customers including hedge funds• 112 bank customers
• EBS Spot Ai– API or ‘black-box’ FX trading– Average daily volumes - USD 30 billion– Record day – 24 May 06 – USD 59.3 billion– 20% of EBS volumes from API-based trading
• EBS Market Data– The source of global spot FX pricing– Premium live feed and historical data commercialised

40
Fixed Income

41
Fixed income volumesAverage Daily Volume - Single Count
0
1
2
3
4
5
Apr-03
Jul-0
3Oct-
03Ja
n-04
Apr-04
Jul-0
4Oct-
04Ja
n-05
Apr-05
Jul-0
5Oct-
05Ja
n-06
Apr-06
US$
Bill
ions
Agency Mortgages Canadian Govt Euro GB Eurobonds

42
Fixed incomeAverage Daily Volume - Single Count
0
50
100
150
200
250
Apr-03
Jul-0
3Oct-
03Ja
n-04
Apr-04
Jul-0
4Oct-
04Ja
n-05
Apr-05
Jul-0
5Oct-
05Ja
n-06
Apr-06
US$
Bill
ions
UST US Repo EU Repo

43
Fixed income:US treasuries• Asia – US treasuries
– 65% market share for the past year
• London EU US Treasury Actives – Volume totalled a record $365 billion in May ‘06– Volumes continue to break records month over month– Volumes increasing each month in 06– 65% increase in volume from May 05– London market share ~ 60%
• US treasury volumes– volumes consistently above forecast in 06

44
Fixed Income US - Repo and Mortgages• US Repo
– Volumes remain healthy in face of new competition– Customer benefits
• Total Anonymity• STP• Significant cost saving benefits
• Mortgages– ICAP offers the only e-broking platform for Mortgage-Backed
Securities (MBS)• Continued growth in e-traded volumes• Customers seeing cost and STP benefits of e-broking • New functionality added

45
Fixed income: Eurobonds
• Launched in Feb 2006 across:– Bank capital– Industrials– Autos and Telecoms
• First electronic trading in CDS and Euro Credit bonds on the same front end
• Eurobonds– Volume of €959m in May 06 - up from €373m in April 06– June 06 volume so far €737m– 8% of business electronically traded (4.5% in April)– 11% so far in June
• Averaging 25 trades per day• 18 firms have so far traded Eurobonds with two further firms
enabled.• 38 traders have so far executed e-trades

46
EU Repo
• Repo daily volumes - €159 billion nominal single count daily
• 24% increase on June 05 (ICMA Repo survey saw 15-18% increase in outstanding Repo)
• Record volume day of €200 billion on 7 March 06
• Daily average Repo transactions is now at 5,000

47
Global trends in spot FX• Increasing cross-border trading activity
• Increasing proprietary risk taking at banks
• Growth of single and multi-dealer bank portals
• Growth of leveraged investors/hedge funds
• Growth of prime broking
• Continued development of algorithmic trading engines
• Liberalisation of emerging markets

48
Global trends in Fixed Income• Emerging markets offer opportunities for growth
• Algorithmic trading will force differentiation in trading models
• Integration of third party front, middle, and back office systems into trading platforms
• Increased competition among prime broking firms
• Migration towards e-execution for less liquid products

49
Foreign Exchange: New products
• Non–Deliverable Forwards– Estimated USD 1 trillion market (BIS 2003)– Provisional launch in Q4 2006
• Enhanced EBS Spot dealing screens– Offering up to 22 currency panels on one screen– Designed to facilitate:
• trading in multiple currencies• high frequency trading• placing more orders into the EBS market

50
Fixed income: New products
• North America– Canadian Government bonds – launched Q4 05– Credit Default Swaps – Q1 06– Yield Curve Swaps – In pilot– RP Cross
• Europe– Euro Eurobond sector– Euro-Sterling - roll-out Q4 06– Euro-Financials – in pilot phase
• Eurobonds issued by a financial corporate

51
Key drivers for success
Superior customer relationships1 Customer satisfaction2
A trusted global brand3 Focus on customer needs and market competition4
Maintaining and building the liquidity pool5 Unique product
selling points6
Solid and scaleable business model8Leading technology7
Talented and dedicated people9 Robust analysis10

52
ICAP Technology BriefingBusiness value creation through technology
Jay SpencerGlobal Chief Information Officer

53
ICAP IT Profile
TOTAL STAFF = 341
PRODUCT MANAGEMENT & DESIGN
PRODUCT DEVELOPMENT
CORE IT
DER
IVA
TIVE
S
FIN
AN
CIN
G
Application Development & Architecture
Infrastructure & Architecture
Market Data & Analytics Development
Production Support & Quality Assurance
Networks
OperationsSupport
Internal Systems
REP
OG
OVE
RN
MEN
TS
AG
ENC
IES
JGB
sM
OR
TGA
GES
CO
RPO
RA
TES
Equities Commodities Market Information /
Analytics
Fixed Income
SPO
T
FOR
WA
RD
S
CR
EDIT
DER
IVA
TIVE
SIR
S / I
-SW
AP
EXC
HA
NG
E TR
AD
ED
CLE
AR
ING
STR
UC
TUR
ED P
RO
DU
CTS
Emerging Markets
Derivatives FXFutures

54
EBS IT Profile
DER
IVA
TIVE
S
FIN
AN
CIN
G
REP
OG
OVE
RN
MEN
TS
AG
ENC
IES
JGB
sM
OR
TGA
GES
CO
RPO
RA
TES
SPO
T
FOR
WA
RD
S
CR
EDIT
DER
IVA
TIVE
SIR
S / I
-SW
AP
EXC
HA
NG
E TR
AD
ED
CLE
AR
ING
STR
UC
TUR
ED P
RO
DU
CTS

55
Key Management Drivers
• Ensure delivery commitments are met to support:– organic growth– balanced voice and electronic needs– product opportunities defined in corporate strategy
• Operation efficiency– execution on defined plans– cost savings and cost leverage
• IT business control
• “Legacy” synergies
• EBS integration

56
Keys to successful EBS Integration
• Minimize distraction to existing ICAP and EBS delivery schedules
• Retain critical players
• Get to steady state organization over next 12 months
• Apply “insourcing” options and flexibility built into EDS agreement

57
We know how to manage it; we’ve been here before
• Project funding
• Product plans; business-as-usual
• Most experienced players assigned to EBS Integration steering and delivery teams
• Protection key players with agreements
• Timely organisational changes

58
Leverage from the EBS acquisition
• Product knowledge
• Development resources and capacity with similar skills
• IT Infrastructure expertise
• Globally based solutions team and operations support
• Major conversion to new infrastructure completed by EBS

59
Primary Synergy Opportunities
• Redundant capex spend• Overlapping networks and costs to support • Consolidated System Command Center and operations
staff• Consolidated IT facilities and centers• Duplicated Telecoms• EDS contract savings• Overlapping organisation functions

60
Future Opportunities
• New revenue opportunity – leverage trading architectures
• Front end consolidation – “application container” architecture
• Diverse matching technology

61
Summary Slide
• We have the resources
• We have the capability
• We make efficient use of capital
• Above all, we have a unique blend, range and distinct
combination of product and technical skill

62
Steve McDermott Executive Director, ICAP
Integration of EBS and ICAP

63
Introduction
• Maintaining momentum in the business
• Clarity of overall business objectives
• A dedicated project management office to oversee the process of integration
• Impressive people and the technology
• Prioritising the immediate decisions

64
Transaction synergies (21 April 2006)
IT Network: $9m
IT Infrastructure: $10m
Other IT: $2m
Property and other: $11m
0
5
10
15
20
25
30
35
2006/7 2007/8 2008/9 Full Impact
Projected Transaction SynergiesUS$ millionsProjected Transaction SynergiesUS$ millions
Sources of SynergiesUS$ millionsSources of SynergiesUS$ millions
TechnologyNon-Technology$m
$24m
Cost toAchieve
Note: The costs to achieve the synergies of $24 million will be treated as an “exceptional” item in the income statement in 2006/7 and 2007/8
$32m

65
Integration
• IT- People, Network and Hardware
• ICAP Electronic Broking - Sales, Product, Marketing
• Support - Property, HR, Finance, Legal and Compliance
• Combining the cultures

66
Challenges
• e-broking now substantial business
• Recognition of the power of e-broking and greater understanding in voice business of benefits
• Committed to investing to building the e-business further
• Potential revenue synergies
• Staying ahead of the curve

67
Investor Relations queries to :
Mike SheardDirector of Corporate AffairsICAP plc2 BroadgateLondon EC2M 7UR(44) 207 050 [email protected]


