jo u rn al hom epa ge: www.elsev ier .com/ locate /aca
eview
eview of analytical methods for the quantification of iodine in complex matrices
. Phillip Shelor, Purnendu K. Dasgupta ∗
epartment of Chemistry and Biochemistry, The University of Texas at Arlington, Arlington, TX 76019-0065, United States
r t i c l e i n f o
rticle history:eceived 29 January 2011eceived in revised form 25 May 2011ccepted 25 May 2011vailable online 23 June 2011
eywords:odinerine
a b s t r a c t
Iodine is an essential element of human nutrition. Nearly a third of the global population has insufficientiodine intake and is at risk of developing Iodine Deficiency Disorders (IDD). Most countries have iodinesupplementation and monitoring programs. Urinary iodide (UI) is the biomarker used for epidemiologi-cal studies; only a few methods are currently used routinely for analysis. These methods either requireexpensive instrumentation with qualified personnel (inductively coupled plasma-mass spectrometry,instrumental nuclear activation analysis) or oxidative sample digestion to remove potential interfer-ences prior to analysis by a kinetic colorimetric method originally introduced by Sandell and Kolthoff∼75 years ago. The Sandell–Kolthoff (S–K) method is based on the catalytic effect of iodide on the reac-
4+ 3+
ilk
andellolthoff
CP-MS
tion between Ce and As . No available technique fully fits the needs of developing countries; researchinto inexpensive reliable methods and instrumentation are needed. There have been multiple reviews ofmethods used for epidemiological studies and specific techniques. However, a general review of iodinedetermination on a wide-ranging set of complex matrices is not available. While this review is not com-prehensive, we cover the principal developments since the original development of the S–K method.
Purnendu K. Dasgupta is Jenkins Garett Professor ofChemistry at the University of Texas at Arlington. Inrecent years he has been particularly interested iniodine nutrition especially after his discovery that per-chlorate, a potent iodide transport inhibitor, is to befound in all human and bovine milk in the US and inother countries. In 2006, this prompted him to edit aspecial issue of Analytica Chimica Acta in 2006 on per-chlorate. Since that time he has been keenly interestedin better and simpler methods of measuring iodineand perchlorate in biological samples.
C. Phillip Shelor graduated with his B.S. in Chem-istry in 2007 from the University of Texas in Arlingtonand worked for 2 years in a quality control lab fora generic brand beverage company. He reenrolled inUTA’s PhD program in 2009 and has been working inthe Dasgupta Research Group since January 2010. Cur-rent projects include cold plasma discharge atomicemission spectroscopy for trace iodine detection andanalysis of urine and milk samples for iodine and per-chlorate.
. Introduction
It is estimated that more than two billion people have insuffi-ient iodine intake and are at risk of developing Iodine Deficiency
isorders (IDD) [1]. Symptoms of iodine deficiency include goiter,ypothyroidism, and cretinism. In 1917, Marine and Kimball [2]rst showed that iodine supplementation could reduce goiter, androphylactic iodization of salt started in Switzerland in 1922 [3]; in
1924, the U.S. followed suit [4,5]. In this review we refer to the USpopulation most frequently as we are most familiar with the rel-evant literature. However, the status of most countries regardingiodine nutrition is not better than that of the US.
The U.S. Institute of Medicine (IOM) recommended dailyallowance (RDA) or adequate intake (AI) of iodine for differ-ent population groups are as follows (in �g d−1), 0–6 mo.: 110(AI); 7–12 mo: 130 (AI), 1–8 yr: 90 (RDA), 9–13 yr: 120 (RDA);
≥14 yr: 150 (RDA); pregnant women: 220 (RDA); lactating women:290 (RDA) [6]. There are calls for further increasing the sug-gested iodine intake, especially for pregnant and lactating women[7]. Currently 91% of the global population, totaling some 130
ountries, is regularly surveyed for their iodine nutrition status;odization of salt and other measures of iodine supplementationre taken. In 1993, iodine deficiency was a recognized pub-ic health problem in 123 countries; by 2006 this number hasecreased to 47. Some 63 countries still do not have regularcreening procedures. The WHO recommends iodization of notust household salt but also livestock feed. Urinary iodine (UI) ishe epidemiological indicator used for iodine nutrition status in
population [8]. Median UI levels are used to categorize a pop-lation as severely deficient (<20 �g L−1), moderately deficient20–49 �g L−1), mildly deficient (50–99 �g L−1), adequate nutri-ion (100–199 �g L−1), above requirements (200–299 �g L−1), andxcessive intake (>300 �g L−1). The risks of excessive Iodine intakenclude hyperthyroidism and thyroid autoimmune diseases; how-ver whether this occurs at a UI level of 300 �g L−1is debatable.
mean urinary iodine volume of 1.5 L d−1 can be used to relatentake values to UI values. Backer and Hollowell [9] surveyed thextensive extant literature and concluded that the strongest datauggests that iodine intakes of 1000–5000 �g d−1 are safe for mosteople for years.
. Iodine deficiency and a particular perspective for thenited States
Iodine deficiency is the most common cause of cognitive impair-ent [8]. The brain is extremely sensitive to the effects of low
odine intake with the degree of impairment dependent on theiming and severity of the deficit [10]. Even a mild iodine defi-iency may seriously affect the intelligence and function of children11,12]. In the US, iodine nutrition status is monitored throughhe National Health and Nutrition Examination Surveys (NHANES).valuations of iodine nutrition made through NHANES I and III havendicated that iodine intake has decreased over the last decades,otentially leaving more infants at risk of iodine deficiency [13].he decrease in intake may be due to changing practices amongairies and cereal manufacturers [14], removal of iodate-based con-itioners from store-bought bread [15] and increased reliance onre-prepared, prepackaged and fast foods, which may contain a
ot of salt but not iodized salt [16]. There is also decreasing usef salt at home because of potential adverse health concerns ofxcessive sodium consumption [17]; ironically, the bulk of thealt consumed outside the home is not iodized. Salt, the primaryource of iodine for many within the US, is now widely perceiveds unhealthy, because it increases hypertension risks. The Amer-can Medical Association has taken the extraordinary step to askhe US Food and Drug Administration to take salt off the “Generallyecognized As Safe” (GRAS) list. As households seek to reduce theirodium consumption, the likely end result is that iodine intake willurther decrease. Salt content will be reduced at home, the onlylace most individuals encounter iodized salt, as the populationypically does not go to restaurants and ask that less salt be used inooking or ask fast food/prepackaged food vendors to reduce saltn their products. Recently, however, some US vendors of prepack-ged food now have voluntarily pledged gradual reduction of saltontent. Pregnant and lactating women, many of whom attempto “eat healthy” while pregnant or in early motherhood, may thusecome the most susceptible when salt consumption at home isut back.
Actual infant iodine nutritional status in the US is not directlynown: infants are not a part of the NHANES cohort. Breastfednfants, who rely on their mothers’ milk for iodine, will be particu-arly vulnerable if their mothers fall short on iodine nutrition. The
ecent decrease in iodine intake has been associated with increas-ng rates of congenital hypothyroidism [18], a serious conditionnown to have permanent effects on neurological function [19].he most recently available NHANES data indicate that the median
himica Acta 702 (2011) 16– 36 17
UI value for lactating white women is 106 �g L−1 (and even then6%, 22% and 11% of the population are, respectively, in the severely,moderately and mildly iodine deficient categories). The median UIvalue for lactating Hispanic women in the US is a dismal 50 �g L−1.[20]
Even mild iodine deficiency is associated with behavioral andcognitive dysfunction. Children with UI ≤ 100 �g L−1 have lower IQand higher prevalence of behavioral disorders than their higher UIpeers [21]. Mild iodine deficiencies in women correlate with atten-tion deficit hyperactivity disorders (ADHD) in their children [22].The present scenario on iodine nutrition is complicated by the factthat the relationship between iodine assimilation and intake maybe affected by the ubiquitous environmental presence of iodidetransport inhibitors. Perchlorate is the most potent of iodide trans-port inhibitors. For a discussion of this issue see a special issue ofthis journal [23] and other recent commentaries [24]. Whether ornot perchlorate plays a role, presently there is real concern aboutthe iodine nutritional status of US mothers [25].
3. Analytical methods for iodine in biological samples
To properly assess iodine nutrition, methods are required toaffordably and accurately quantify iodine in soil, plants, variousfoods and in physiological samples, notably milk, serum, and urine.Presently, iodine measurement in biological samples is carried outalmost exclusively by one of two methods: One is an age-old kineticspectrophotometric method called the Sandell–Kolthoff reaction[26]. The reduction of yellow Ce(IV) by As(III) to colorless Ce(III) isnormally very slow. This reaction is catalyzed by trace amounts ofiodide. The reaction follows the following scheme:
2Ce4+ + 2I− → 2Ce3+ + I2
As3+ + I2 → As5+ + 2I−
It is also catalyzed to a much smaller extent by iodate, which inany case, is readily converted to iodide in the presence of arsenitein an acidic medium. Organoiodine compounds do not react with-out decomposition. The rate of disappearance of the yellow colorin a Ce(IV)–As(III) mixture is measured as a measure of iodine con-tent. Ce(III) is fluorescent (�ex 254 nm, �em 350 nm) [27] and inprinciple the reaction can be fluorometrically followed as well. Inpractice because of the variable amounts of UV-absorbing speciesthat may be present, the reaction is rarely used in this fashion. Asmay be intuitive, many organic substances can potentially interfere[26,28] by chelating Ce(IV) or Ce(III) or otherwise directly affect-ing the reaction rate. Complete mineralization of the sample todigest the organics is thus a necessity. This digestion step typicallyinvolves perchloric acid. This requires special hoods and precau-tions because of explosion hazards. The other method used is atthe opposite end of sophistication; inductively coupled mass spec-trometry (ICP-MS) permits superb sensitivity, and as such, in somecases (e.g., urine) will permit direct sample analysis after dilution.Nevertheless, it is still necessary to have an internal standard toaccount for matrix effects [29].
In this review, we critically evaluate all methods, including vari-ants of the above, actually used for the measurement of trace iodinein biological samples. We have deliberately avoided extensive dis-cussion of methods that have been used only with simple matrices,e.g., salt, as such applications do not provide the analytical chal-lenges posed by biological matrices. The references cited here arerepresentative rather than comprehensive. Far too many applica-
tions of iodine measurements in biological samples are in the extantliterature but few contain analytical innovations. The heart of thisreview is a summary table of the methods presented with key ana-lytical figures of merit (Table 1 ).
18C.P.
Shelor, P.K
. D
asgupta /
Analytica
Chimica
Acta
702 (2011) 16– 36
Table 1Summary of iodine measurement methods.
Reference Method Application LOD Linear range linear r2 RSD (%) Spike recovery(%)
Analysistime
Interferences/comments
[30] Sandell–Kolthoff(S–K)
Serum – 0.04–1 �g L−1 – 6 – – Measured at 310 nm,interferences fromcopper and chromium,Ni(II), Co(II), Fe(III),Hg(II), Ag(I)
[31] S–K Serum – – – – 99.2–100.2 I−
99.4–100.4 T4
– Measured at 317 nm,uses alkalineincineration, onlyrequires 50 �L ofserum; total andprotein Bound iodine
[36] S–K: Autoanalyzer Plants – 100–800 �g kg−1 – 3–5, N = 10 93.4 – Digested using alkalineashing
– 20–120 �g L−1 – – – – T4 and T3 are separatedfrom serum by columnchromatography andthe iodine exchangedwith bromine;non-incinerativetechnique
[57] S–K SerumThyroxine
– 15–150 �g L−1 T4 – 8.5 98 1.2 min T4 and T3 are separatedon an anion exchangecolumn and bromineadded before beingmeasured in anautoanalyzer.Interferences for 19contrast media weremeasured
[58] S–K ThyroidHormones
10 pmol 10–1000 pmol – Between days 2.8–8.2day to day: 2.8–10.1
– <30 min Iodine containingproteins are treatedwith bromine in acidicmedia and measuredcolorimetrically
[60] S–K: microplate Iodo-aminoacids
1 pmol T1
0.5 pmolT2, T3, T4
0–40 pmol T2, T3, T4
0–100 pmol T1
>0.97 intra-assay: 4.2–7.3inter-assay: 6.5–9.2
96–99 <2 hper plate
Iodo-amino acids wereeluted using HPLC andmeasured using a 96well microtiter plate
Urine – 70–250 �g L−1 – – – – The S–K reaction isterminated by theaddition of Fe(II)followed by addition ofthiocyanate and theresultantferrithiocynatecomplex absorbance ismeasured at 460 nm
[76] ICP-MS Urine 0.01 �g L−1 – – 0.55 – – Magnetic sectorICP-MS is used toachieve very low LOD’scoupled with IC
[78] ICP-MS Urine 0.08–0.22 �g L−1
iodophenols<1000 �g L−1 0.999 2.3–2.9 97.8–101 7 min Anion exchange and
reverse phasechromatography areused to determineiodophenols in urine
[80] ICP-MS Milk <2 �g L−1 4–200 �g L−1 – 1–1.9 – – Speciation of iodinecompounds in milkusing ion exchangechromatography
[82] ICP-MS Biologicalfluids
0.08 �g L−1 I−
0.3 �g L−1 IO3−
3.5 �g L−1 T4
2.5 �g L−1 T3
– 0.9989 2.8–3.9 – 15 min Capillaryelectrophoresis usedfor the separation anddetection of iodide,iodate, T4 and T3
[86] ICP-MS Foods and solidsamples
0.01 �g L−1
50 �g kg−10.01–100 �g L−1 – – – – Schöninger
combustion is used todigest solid samplesand iodine is absorbedin 0.1 M NaOH
[87] ICP-MS Food 30 �g kg−1 – 0.999 3.4 n = 8 – – Wet ashing used insteel bombs and asmall amount ofmethanol is used toenhance signal
[88] ICP-MS Food 2 �g kg−1 – – – >99 25 min Samples are combustedin a pressurizedoxygen bomb withNH4NO3 as a flux usingmicrowaves as thesource of ignition andto assist digestion.Iodine is absorbed intoalkaline solution andmeasured
[90] ICP-OES Water 0.4 �g L−1 2–10,000 �g L−1 0.9991 – – – I− is volatilized beforebeing measured at178.276 nm and CRM’sare measured afterseparation using IC
[92] Total reflection X-rayfluorescence
Kelp, water,dietarysupplements
180 �g L−1 – – <4 – >15 min Samples were digestedwith 25% NH4OHbefore being irradiatedand measured for1000s
[95] ICP-OES Food 40 mg kg−1 – – 2 n = 5 85–95 – Microwave digestionwith HNO3 and H2O2;I− is precipitated withAg+ and redissolved inNH4OH
[97] ICP-OES Ground water 4.5 �g L−1 – – – – 5 min Iodine is volatilizedand removed fromsolution using agas–liquid separator;requires large samplevolume
[98] ICP-OES Milk 20 �g L−1 0–1000 �g L−1 – 0.5–3.5 n = 3 68–71 – Alkaline ashing of milk,Iodine is thenvolatilized and passedthrough a phaseseparator
20 �g kg−1 – – – – 28 min Samples are irradiatedwith EpithermalNeutrons andmeasured usinganticoincidencecounting
[104] INAA Salt 500 �g kg−1 10–210 mg kg−1 – – – 15 min Samples are irradiatedwith epithermalneutrons filtered byflexible boron–carbidetubes and measureddirectly
[108] INAA Seawater,urine, and milk
10 ng – – – 94.4–98.3 – I− and IO3− are
separated ondisposable ionexchange columns andirradiated. Only minorCl interference
22C.P.
Shelor, P.K
. D
asgupta /
Analytica
Chimica
Acta
702 (2011) 16– 36Table 1 (Continued)
Reference Method Application LOD Linear range linear r2 RSD (%) Spike recovery(%)
Analysistime
Interferences/comments
[111] INAA Protein boundiodine
2 �g L−1 12–14 × 105 �g L−1 – – >98 – After irradiation, silveriodide is precipitatedand separated from thesolution beforecounting
[114] AAS Milk 2.75 �g L−1 11–350 �g L−1 0.998 1.3–6.8 95.3–100.7 ∼3 min Iodine is determinedindirectly afterprecipitation withsilver. No noticeableinterferences due tohalides were found upto 50 times theconcentration of iodide
[115] AAS 3.6 �g L−1 0–100 �g L−1 0.995 1.2–1.3 – – A cold vapor mercuryanalyzer is used for theindirect determinationof iodine
[116] ISE Beverages – 25–130000 �g L−1 – 1–4 90–120 5–10 min The electrode developsa layer after 10–15 h ofcontinuous use;susceptible to changesin temperature andinterferences fromchloride
[118] ISE Milk – 100–100,000 �g L−1 >0.95 – 87–114 – Ni(NO3)2 is used as amatrix modifier andthe method is validatedagainst IC-HPLC withelectrochemicaldetection. ISE hadconsistently higherresults
[120] ISE Urine andserum
1.47 �g L−1 5–400 �g L−1 0.9994 2.2 91.4–106 7 min A crystalline tubularmembrane is used asthe detector followingIC
[122] ElectrochemicalDetection (ED)
Urine 5 �g L−1 25–200 �g L−1 0.98 <5 n = 10 94 7.5 min IC used with a silverelectrode; compared toTechniconAutoanalyzer method
[123,126] ED Urine, milk,salt, seawater
0.5 �g L−1 0.5–6000 �g L−1 0.999 – – – A comparison between3 electrodes followingIC is made with amodified platinumelectrode providing thebest results and thelowest signaldeterioration
[124] ED Surface water 0.02 �g L−1 0–50 �g L−1 0.998 6.2 – – Pulsed amperometricdetection is used witha silver electrode. Aconstant decline insignal occurs butdip-tailing issues areresolved
C.P. Shelor,
P.K.
Dasgupta
/ A
nalytica Chim
ica A
cta 702 (2011) 16– 36
23
[127] ED Nuclearemergencytablets andmultivitamins
1.3 �g L−1 100–25,000 �g L−1 0.999 2.2 – <1 min Amperometricdetection combinedwith flow injectionanalysis using a borondoped diamondthin-film electrode
[128] ED Salt, seawater,drugs, milk
0.47 �g L−1 0.635–63.5 �g L−1 – <3 – – A silver paste carbonelectrode as detector inIC; chloride interferesat high concentrations;dip-tailing occursabove 25 �g L−1
[129] ED Salt, opthalmicdrugs
40 �g L−1 – – 2 – – Gold nano ensemblesare compared to macroelectrodes and haveenhanced limit ofdetection. Experiencesinterference at lowconcentrations likelydue to anti-cakingagents
[130] SuppressedConductivity
Biologicalsamples
20 �g L−1 IO3− 100–10,000 �g L−1IO3
− – 1.5 86–98 – Uses anelectrochemicaloxidationneutralization deviceto neutralize samplesafter ashing to be usedwith IC and suppressedconductivity detection
[131] FIA I2 in seawaterand salt
40 �g L−1 – – 0.4–9.4 96.8–101 <30 s Amylose andAmylopectin are usedto form a clathratewith elemental iodineand the absorbance ismeasured
[132] FIA seawater, salt 60 �g L−1 – – – – <30 s polyvinyl alcohol isused to form aclathrate with iodinewhose absorbance canbe measured;Absorbance maximumis dependent upondegree of hydrolysisand a non-linearcalibration plot isformed
[133] Sequential injectionanalysis
Pharmaceuticals 0.05 �g L−1 0.1–6.0 �g L−1 0.996 2 – <1 min the catalytic effectiodide has on thereaction betweentetrabase andchloramine-T ismeasured;interferences due toFe(II) minimized byincreasing temperature
24C.P.
Shelor, P.K
. D
asgupta /
Analytica
Chimica
Acta
702 (2011) 16– 36
Table 1 (Continued)
Reference Method Application LOD Linear range linear r2 RSD (%) Spike recovery(%)
Analysistime
Interferences/comments
[134] FIA Salts and phar-maceuticals
0.13 �g L−1 1.3–63 �g L−1 0.999 1–2.5 n = 4 – 1 min Utilizes thechemiluminescencereaction betweenRu(bpy)3
3+ and NADH;the reaction is mostsensitive tointerferences fromsulfite and ascorbic andoxalic acids
[135] FIA Salt 13 �g L−1 130–1500 �g L−1 0.9955 1–3.5 n = 4 – 30 s Chemiluminescencedetection with acidicpotassiumpermanganate;interferences wereremoved with achelating resin
[136] FIA Urine 10 �g L−1 <5 mg L−1 – 1.8 n = 10 101–103 <20 min Iodine is volatilizedand carried into asolution of potassiumiodide and reactedwith luminol andcobalt solution
[137] FIA Pharmaceuticals – 100–1000 �g L−1 0.999 – – – Iodine is volatilizedand passes through agas diffusionmembrane into asolution of potassiumiodide and thenmeasured bychemiluminescence;Iodine adsorbs stronglyon the membrane andthus it is conditioned;strong interferencesare present fromascorbic acid
[138] FIA Multivitamintablets
500 �g L−1 1–10 mg L−1 0.999 5.2 81.3–117 n = 8 2 min Like [137] but Contactwith the gas diffusionmembrane by thesample solution iseliminated with apervaporationtechnique. Ascorbicacid interferes withdetection and must beremoved
0.63 �g L−1 63–1.3 × 10⁴ �g L−1 – 1.68–3.03 n = 6 – – Iodide catalyzes thereaction betweenMn(III) and As(III) inacid and amperometricdetection is used at a Ptelectrode
C.P. Shelor,
P.K.
Dasgupta
/ A
nalytica Chim
ica A
cta 702 (2011) 16– 36
25
[140] GC-ECD Food 50 �g kg−1 – – – 91.4–99.6 – Samples are ashed andI2 is liberated, thenreacted with3-pentanone to form2-iodo-3-pentanoneand extracted inhexane
– 40–360 �g L−1 – 1.5 n = 7 – – I− is converted to IO3−
with bromine waterand then I2 is liberatedwith I− and theabsorbance measuredat 591 nm with leucocrystal violet; nointerferences from Cl− ,Br− , SO4
2− , PO43− and
NO3− , Hg(II) and Mn(II)
positively catalyzedthe reaction
[148] UV–vis spectrometry Urine, drinkingwater
2.3 �g L−1 <250 �g L−1 0.9998 3 n = 10 95–100 n = 4 – Urine is ashed andbromine water andpotassium iodide areadded to formelemental iodine whichis bound by starch andthe absorbancemeasured at 590 nm.Creatinine interferesheavily
26C.P.
Shelor, P.K
. D
asgupta /
Analytica
Chimica
Acta
702 (2011) 16– 36
Table 1 (Continued)
Reference Method Application LOD Linear range linear r2 RSD (%) Spike recovery(%)
Analysistime
Interferences/comments
[151] Molecular absorptionspectrometry
Iodide andthyroidhormonesupplements
60 �g L−1 60–25,000 �g L−1 0.998 <2 – – BaI2 is generated in agraphite furnace andthe molecularabsorption spectrameasured at538.308 nm.Interferences arosefrom samples withhigh chloride content,oxidants, Na, K
[152] Intracavity laserabsorbance
Water, urine 15 �g L−1 – – 10 – – I− in urine is convertedto I2 using H2O2 andH2SO4. The laser pathlies just above thesurface of solution andthe gaseous I2 absorbsstrongly at 585 nm
[153] Kinetic colorimetry Iodine labeledAntibody
– 25–1000 �g L−1
Human IgG0.988 – – – I− catalyzes the
reaction betweenSb(III) and Ce(IV) and isnon-carcinogeniccompared to As(III).Compares with S–Kand ELISA. Larger rangethan ELISA but LOD ishigher than S–K
then reacted withchlorpromazine andH2O2; the reactionreaches a maximumabsorbance based on I−
concentration beforegradually decreasing;Interferences occurfrom both Fe(III) andHg(II) but Fe(III) an becorrected for
[155] Rapid test kit Urine – >100�g L−1 – – – 1 min Interfering substancesremoved by a charcoalcolumn then I−
catalyzes oxidation of3,3′ ,5,5′-tetramethylbenzidineby peracetic acid andH2O2. Colors arematched to a chart andI− concentrationestimated. Only workson fresh urine
C.P. Shelor, P.K. Dasgupta / Analytica C
[157
]
Isot
ope
dil
uti
on
Uri
ne,
wat
er
1
�g
L−17–
7500
�g
L−1–
<14
n
=
3
–
–13
1I−
is
add
ed
toso
luti
on
then
asu
bsto
ich
iom
etri
cam
oun
t of
AgN
O3
isad
ded
to
pre
cip
itat
eA
gI
wh
ich
is
sep
arat
edon
elec
trop
hor
esis
pap
er
and
cou
nte
d[1
58]
Qu
artz
crys
tal
mic
roba
lan
ceFo
od
0.5
�g
L−110
–500
�g
L−1–
1.1–
4.1
93.2
–101
.1
–
Sam
ple
s
are
com
bust
edin
an
oxyg
en
flas
k
oras
hed
wit
h
KO
H
and
ZnSO
4an
d
then
I 2is
libe
rate
d
and
adso
rbed
onto
the
gold
elec
trod
eof
the
mic
roba
lan
cew
her
e
the
freq
uen
cysh
ift
is
mon
itor
ed. O
nly
Br−
con
trib
ute
sap
pre
ciab
lein
terf
eren
ce
himica Acta 702 (2011) 16– 36 27
4. The Sandell–Kolthoff reaction
The Sandell–Kolthoff reaction [26] is likely the most widely usedtechnique for quantifying iodine. The reduction of absorbance dueto Ce(IV) is typically measured at 405–420 nm; although the max-imum sensitivity can be achieved at 310–317 nm [30,31]; this isnot often used because of the same reasons that the more sen-sitive method of Ce(III) fluorescence measurement is not used.Aside from uncharacterized organics, the reaction is interferedwith by higher concentrations of thiocyanate (both milk andurine typically contain much larger amounts of thiocyanate thaniodide [32,33]); thiocyanate levels are especially high for smok-ers [34]). Traces of metal ions such as silver or mercury that bindiodide also interfere. Substances that readily undergo oxidation,notably nitrite, ascorbic acid, and ferrous iron [26,28] also inter-fere.
Determination of iodide using the S–K method can be carried outtwo different ways: (a) record the complete absorbance profile withtime (b) measure the sample absorbance after some preset timeinterval following mixing of all components. Most often b is usedfor higher throughput. The iodine concentration can be determineddirectly from the difference in absorbance between a blank and thesample at any time following mixing [30].
4.1. Digestion procedures used prior to Sandell–Kolthoffmeasurement
Barker et al. [35] reported an alkaline digestion procedure tomeasure protein bound iodine (PBI, synonymously used for thy-roglobulin (TG), etc.); cited some 322 times, this approach hasbeen much used. The method involves precipitation of the pro-tein as the zinc conjugate (ZnSO4 solution is typically added [36]),addition of excess alkali, slow evaporation to dryness overnightat 85–95 ◦C, ashing for 2.5 h at 600 ◦C followed by extraction ofthe ash with dilute HCl. However, latter work has indicated thatmuch loss can occur in the procedure at pre-ashing tempera-tures; this can be minimized by choosing a vessel that minimizescirculation of gases and using KOH instead of NaOH [37]. Glass ves-sels used for ashing cannot be reused; the etched surface tendsto strongly adsorb iodine [37]. Acid digestion procedures do nothave this problem. However acid digestion conditions can lead tolosses as elemental I2; iodide in acid solution is readily oxidizedby air. Traditional perchloric acid digestion (sulfuric, nitric per-chloric acids [38] or nitric and perchloric acids [39]) does workand radiotracer studies show that iodine loss is consistent and istypically below 20% [39]. Traditional perchloric acid digestion asoutlined in [38] (see [40] for an update that involves overnightdigestion with HNO3 followed by digestion with conc. H2SO4 and70% HClO4) is still the method of choice for sample preparation foriodine determination by the US Food and Drug Administration [41].Perchloric acid digestion does require special hoods and specialprecautions.
Zak et al. [42] had earlier developed a procedure that useschloric acid (HClO3) as the active oxidant to oxidize iodide morerapidly and effectively to nonvolatile iodate. Chloric acid is notcommercially available as such; this was prepared by adding a sto-ichiometric amount of 70% HClO4 to a concentrated solution ofKClO3. The resulting KClO4 was allowed to precipitate while themixture was refrigerated overnight. It is not known how much freeHClO4 remains but based on the residual potassium in solution,the amount is likely small. The chloric acid digestion procedurewas adopted by Benotti et al. [43] for urine, feces, tissues and food;
this work has been much cited. Some other chloric acid proceduresactually use significant amount of other oxidizing acids includ-ing perchloric and chromic acids; again, appropriate precautionsmust be taken [44]. A mixture of sodium chlorate and perchloric
2 ytica C
apwaui
tniadiHhim[
ohytP
1ic
pmtltah[ctabrb(udaac
lme
4
swbepttap
8 C.P. Shelor, P.K. Dasgupta / Anal
cid has also been used for digestion [45]. It is not clear to theresent authors why chloric acid must be prepared with HClO4ith removal of the counterion as KClO4 and cannot be used e.g.,
s a stoichiometric mixture of KClO3 and H2SO4. It is possible butnlikely that the presence of excess potassium sulfate results in
nterferences.Pino et al. [46] has advocated ammonium persulfate (AP) diges-
ion of urine samples that is completed in 30 min. This avoids theeeds for a specialized fume hood. In our experience, this method
s indeed effective for digesting urine samples but is not necessarilypplicable to other sample types, e.g., human milk. For UI, the APigestion method was validated against automated acid digestion
n a Technicon Autoanalyzer [47,48] and reversed phase ion-pairPLC [47]. Results obtained by the S–K method after AP digestionas also been compared with parallel ICP-MS analysis [49]. For UI,
n-line digestion at 38 ◦C with acidic permanganate and dichro-ate in a flow-injection format has also been shown to be viable
50].Rollman et al. combusted the sample in a closed flask in an
xygen atmosphere and converted the iodine formed to iodate byypochlorite. Any chlorine formed was purged by N2 prior to anal-sis [51]. Oxygen flask combustion followed by oxidation of iodineo iodate by a chloric acid absorber was used by Zaroda to measureBI [52].
Pyrohydrolysis, a process where the sample is heated to200–1300 ◦C while water vapor/steam and O2/air is passed over
t, has been used with geological samples [53,54]. The apparatus isomplex.
The S–K method is an effective way to measure iodine in com-lex samples but it will be apparent that the sample preparationethods listed above are onerous, do not lend themselves well
o automation and will constitute the major bottleneck when aarge number of samples are to be analyzed. In some of the diges-ion methods, if digestion is conducted with multiple samples in
closed system, some iodine escapes into the gas phase fromigh concentration samples and is reabsorbed by other samples55]. In specific cases, iodine can be liberated from organoiodineompounds. If the sample is already chromatographically purified,hyroxine (T4) can be thus determined by adding bromine (gener-ted in situ by bromide, bromate and acid) prior to measurementy the S–K method [56]. Autoanalyzer adaptations of this have beeneported [57]. The bromine addition procedure is broadly applica-le to 3-iodotyrosine (monoiodotyrosine, MIT), 3,5-diiodotyrosineDIT), 3,3′,5-triiodotironine (T3), T4 and TG [58]. Chlorine can besed in the same manner as bromine [59]. Even without priorecomposition MIT, DIT, T3 and T4 respond to the S–K reaction butt rates lower than an equivalent amount of mineralized iodidend response of each compound must therefore be individuallyalibrated for [60].
Other efforts at bypassing digestion have later been shown toead to errors. On-line dialysis instead of digestion was adapted to
easure UI [61] but thiocyanate is also transported and producesrroneously high values for UI [28].
.2. Chemical modifications of the Sandell–Kolthoff (S–K) method
Modifications to the S–K method that result in different mea-urands have been proposed. The reaction can be quenchedith brucine sulfate [50] and the absorbance of the resulting
rucine–cerium complex measured at 428 nm [62]. Addition ofxcess Fe(II) can also stop the reaction by reacting with Ce(IV) toroduce Fe(III); the latter can then be determined by adding excess
hiocyanate to form the well-known red ferrithiocyanate complexhat can be measured at 460 nm [63]. These methods only allow
single point measurement, obtaining reaction rate profile is notossible and they have not been much used.
himica Acta 702 (2011) 16– 36
4.3. Measurement platforms used with the Sandell–Kolthoffmethod
The early years of strictly manual assays was rapidly replaced byadaptation on the Technicon Autoanalyzer [36,38,40,46,52,56,64]which also provided for in-line digestion. Equivalent segmentedflow analyzers are still in use in many laboratories and stillconstitute the typical comparison benchmark for new methods[65,66,67]. A very effective current adaptation of the S–K method ison microtiter plates with corresponding multichannel plate read-ers. These can provide high sample throughput and reduce theamount of waste per sample [65,66,67]. Both acid and AP digestionhave been performed on the plates. Ohashi et al. [68] pioneeredthe adaptation of the microplates. Using a specially designed seal-ing cassette to prevent loss of vapor and cross-contaminationamong wells, AP digestion was performed in a microplate in anoven at 110 ◦C for 60 min. Afterwards, the digestion mixture wastransferred to a transparent microplate and the S–K reaction wasperformed at 25 ◦C for 30 min and absorbance measured at 405 nm.An advantage of the microplate method is the ability to load multi-ple blanks and standards and monitor for cross contamination. Theflow-injection format [50] also allows for rapid assays. However,it does this in a sequential manner and cannot provide a kineticprofile. A rate profile can in principle be obtained by adoptingan intermittent stopped flow arrangement but at the expense ofthroughput.
4.4. Representative applications of the Sandell–Kolthoff method
The S–K reaction has successfully been applied to theanalysis of protein bound and total inorganic serum iodine[30,55,56,58,59,60,62,65,66,69,70], UI [43,47,48,50,61,67,68], plantmaterial [36], food [38,40,43], tissue [43,45], feces [43], amnioticfluid [64,69] and coal [53,54]. Serum PBI per se is no longer mea-sured as T3 and T4 can be measured by immunoassay techniques[65]. Serum T3 and T4have also been measured by anion exchangeseparation and iodine liberation by bromine treatment prior to theS–K reaction [56,57,58,59].
The sensitivity of the S–K assay is excellent. In an interestingtwist, iodine, instead of radionuclides, was used to tag antibod-ies so that the iodine labeled antibodies could be detected by theS–K method [71]. The response in a human IgG was linear below40 ng/well compared to that of horseradish peroxidase that waslinear up to 25 ng/well.
5. Inductively coupled plasma mass spectrometry (ICP-MS)
In a typical inductively coupled plasma-mass spectrometer,microwave or radio frequency power is applied through an induc-tion coil to generate high temperature argon plasmas, 4500–8000 K,with an electron temperature of 8000–10,000 K. The plasma atom-izes the sample and strips the atoms of one or more valenceelectrons. The resulting positive ions then typically enter a sin-gle quadrupole mass analyzer for sorting out ions of different m/zand are then detected [72]. Iodine has a relatively high first ioniza-tion potential (IP, to form I+) of 10 eV [73]; thus the iodine presentis only partially ionized (∼25%). While this admittedly does notmake iodine the most sensitive among elements to be measuredby ICP-MS, despite partial ionization, the sensitivity for iodine inICP-MS is superior compared to other techniques for iodine mea-surement. In addition, a very large linear dynamic range can be
attained. Urine cannot be introduced into the instrument directly;some dilution is needed to minimize the very high salt/dissolvedsolids content. In addition, the extent of ionization in the plasma issusceptible to other ionizable material being present; salt content
ytica C
wfuwfivaogwtttbiM0aao[rwttuna
1
XacmadsaA
baLiIIraitat
(sad9
ietesdm
C.P. Shelor, P.K. Dasgupta / Anal
ill notably vary from sample to sample. It is essential to corrector such matrix effects. Matrix effects are best compensated for bysing isotope dilution mass spectrometry,with 129I as an isotopicith tracer [29,73]. 129I has negligible natural abundance. It is assion product of uranium and plutonium and is also produced inery small quantities in the upper atmosphere by cosmic radiationcting on xenon. In the absence of fallouts from nuclear explosionsr reactor accidents, the amount of naturally occurring129I is negli-ible in urine or other biological samples. Although it is radioactive,ith a half life of 16 million years, the amounts used as an analytical
racer do not pose a radiological hazard. If all the 129I typically usedo spike 20,000 samples was ingested, not totaling much over 2 mg,he radiation dosage would be of the same order as that experiencedy the average person yearly (∼2 mSv yr−1) [73].129I is also spiked
nto biological samples in our laboratory prior to processing for ICP-S analysis. At our spiking level, 20,000 samples would consume
.6 mg 129I. One report has explored the use of 115In (IP 5.78 eV)nd 103Rh (IP 7.46 eV) as internal standards for UI measurementsnd report acceptable results with both [74]. A detailed discussionf the superiority of 129I for iodine analysis by ICP-MS appears in29]; these authors conclude that 129I provides reproducible resultsegardless of sample type, while other internal standards may workith one matrix but may not work with another. In the rare case
hat the amount of 129I needed for isotope dilution exceeds permit-ed local radiological standards, double isotope dilution [75] can besed. This involves adding a dilute amount of standard at the begin-ing of the experiment during treatment and dilution processes and
second aliquot of standard is added just before ICP-MS analysis.The 127I content of the 129I tracer can be measured a priori; the
27I added in the tracer addition process can thus be corrected for.enon occurs as an impurity in the argon plasma gas, the naturalbundance of 129Xe is 26.4%. The 129Xe content of the plasma gasan interfere with the measurement of 129I. A correction can beade by measuring 131Xe (natural abundance 21.2%) at m/z 131
nd thus correcting for129Xe based on the respective natural abun-ances. The correction can also be made in a simpler manner byubtracting the m/z 129 count in a reagent blank without any 129Idded. It is not generally necessary to use ultra-high purity grader as plasma gas to reduce the 129Xe background [73].
The limit of detection (LOD) for UI ranges from 2.5 �g L−1 [73] (oretter for present generation instruments) for a quadrupole massnalyzer to 10 ng L−1 for a magnetic sector instrument [76]. EitherOD is sufficient for measuring UI even in populations with severeodine deficiency (<20 �g L−1). Care must be exercised when usingCP-MS to ensure that adequate rinse out occurs between samples.odide is easily oxidized to iodine in acidic solutions and can alsoeact with iodate to form iodine. In acidic media, long rinse outsre required [73]. Thus, any sample preparation procedure thatnvolves oxidation of iodide to iodate must be carefully monitoredo prevent carryover contamination. Alkaline solutions, preferablymmonia or some other suitable amine that will not deposit addi-ional solids on the cones, often provide the best results.
Of the National Health and Nutritional Examination SurveysNHANES), the 2000 survey was the first to use ICP-MS to mea-ure UI [77]; to assure continuity, the technique was fully validatedgainst the S–K method used until then [49]. Urine samples wereiluted with a dilute aqueous solution of NMe4OH and 130Te (IP.01 eV) was used as an internal standard in this work.
An ICP-MS can be used as an element specific detector; althought cannot itself distinguish between different species of a particularlement, it is invaluable as a detector when used in conjunc-ion with liquid or ion chromatography [76,78–81] or capillary
lectrophoresis [82] for speciation studies. Other types of masspectrometry, e.g., electrospray ionization-MS may be preferred ififferent iodine species cannot be completely resolved by chro-atography but ICP-MS generally provides better detection limits.
himica Acta 702 (2011) 16– 36 29
Tandem MS should also be of particular value in speciation andprovide much better sensitivity than single quadrupole MS but hasnot been used for iodine speciation to our knowledge. The mostprevalent method used is anion exchange ion chromatography (IC)[76,78,79]. In normal urine, essentially all the iodine is in the formof iodide [79] and chromatographic separation does not provideadded value. However, speciation is of interest for subjects giveniodine containing drugs/contrast agents. IC-ICP-MS has been usedto study metabolites from subjects given 2,4,6-triiodophenol, ananti-inflammatory drug [78]; both 2- and 4-iodophenol metabo-lites as well as the unaltered drug were detectable in urine. Starket al. [79] looked at various iodide species formed under differentsample pretreatment/digestion conditions with a view to identifypotential loss as elemental iodine. For milk powder, microwavedigestion with an oxidizing acid was satisfactory. In contrast, forseaweed neither acidic nor basic digestion conditions providedgood recovery. When samples of untreated urine were immedi-ately analyzed, only iodide was observed in the chromatogram.When the same sample was stored overnight at room temperatureand re-measured, the iodide signal decreased and an iodate signalappeared, presumably due to air oxidation. If the urine was acidifiedwith HNO3, the oxidation rate to iodate clearly accelerated. By addi-tion of H2O2, the iodide signal disappeared almost completely: theiodate signal increased and a number of additional peaks appeared,likely from the iodination of organic compounds present.
Leiterer et al. [80] report that when speciation analysis was donefor cow’s milk using IC-ICP-MS, most of the iodine was in the formof iodide with some iodate and traces of organoiodine compounds.Iodide to total iodine ratio exceeded 85% for 38 of 52 samples ana-lyzed. Compared to direct analysis by ICP, the total iodine specieseluted from the column amounted to 89%; suggesting that ∼10% isprotein bound and never elutes from the column. It is also possiblethat there were quantitation errors with individual peaks due toionization suppression.
Sanchez et al. used size exclusion chromatography-ICP-MS formilk speciation [81]. A variety of milk samples (cow, goat, human)from several European countries, as well as milk powder and infantformulae, were studied. Whey obtained after centrifugation of thefresh milk or reconstituted milk powder contained 95% of the iodinepresent in the samples. With infant formulae, however, 50–85% ofthe iodine was not in the whey. Addition of sodium dodecyl sul-fate (SDS) improved the release of this iodine into the whey. Themajority of the iodine in formulae was shown to be present in alarge molecular weight (>1000 kDa) fraction.
Capillary electrophoresis coupled to ICP-MS has been used forthe separation and quantification of T3, T4, iodide, and iodate[82]. The separation method used a buffer sandwich of phosphate(pH 2.3), SDS, and borate for stacking. The intended separationwas complete in 15 min and then the separated bands werepressure driven into the ICP-MS. The serum from a healthy indi-vidual showed iodide (13 �g I L−1), T4–TG (61 �g I L−1) and T3–TG(7.5 �g I L−1) peaks while that from a patient with the thyroidremoved showed no T3–TG peak. Addition of free T4 or T3 wasshown to bind to TG immediately. This technique is obviously capa-ble of providing complete information on the iodine nutrition statusof an individual.
Although reversed phase high performance liquid chromatog-raphy (RP-HPLC) is the most commonly used HPLC mode; it is notas commonly used with ICP-MS. Organic solvents used in RP-HPLCtend to modify the characteristics of the plasma, cooling it down[78,83] causing instability and can even extinguish it. Gradient elu-tion typically involves a continuous change in the hydroorganic
composition and results in a continuous change in the background.Diluting the column eluent with water before introduction to theICP is possible [78] but deteriorates detection limits and can-not solve the gradient elution problem. A commercially available
3 ytica C
PdSastr
uI4neAospwsdw
ct(taMNu(pb
6s
tati
mtuilel1slnshb[fIwtfap
0 C.P. Shelor, P.K. Dasgupta / Anal
TFE-membrane based desolvating nebulizer was explored for theetermination of iodine and other halogen containing drugs [83].ome analytes were partially lost in the desolvating unit, but theuthors conclude that gradient elution (0–100% methanol) is pos-ible. A different solvent removal device where anionic species areransmitted without loss has been described [84]; this should beeadily applicable for iodinated species.
A direct injection high efficiency nebulizer was investigated forse with micro high performance liquid chromatography (�HPLC)-
CP-MS using 300 �m bore columns with an eluent flow rate of �L min−1 [85]. The authors minimized the volume within theebulizer by inserting a 20 �m bore capillary to carry the columnffluent to the nebulizer tip to make it compatible with �-HPLC.lthough the modified nebulizer was slightly less sensitive, it notnly provided superior chromatographic performance, but spraytability was better and it exhibited less sensitivity to solvent com-osition. In this case, maximum iodine response was observed notith pure water but with 60% acetonitrile in the eluent. The authors
uccessfully separated and measured T3 and T4, reaching a 10 fmoletection limit for T4. The T4 to T3 ratio observed in their sampleas further confirmed by nano HPLC–ESI-MS.
For solid samples, digestion is obligatory before the samplesan be analyzed by ICP-MS. Commonly microwave assisted diges-ion [79], combustion in an oxygen flask [52,86], or wet ashingnitric/perchloric acids) in a closed vessel [87] are used. Detec-ion limits in such analyses tend to be blank limited [86,87]nd result in LODs in the 30–50 ng I g−1 range. In a novel twist,esko et al. [88] ignited sample masses of up to 500 mg usingH4NO3 as a flux/oxidizer in a closed vessel containing 15 bar O2,sing microwave energy to initiate the combustion. Water, H2O2,NH4)2CO3 and NMe4OH were explored as absorbers; the latter tworovided better results. Applicability to diverse samples, includingovine liver, corn starch, milk powder, and wheat flour, was shown.
ICP-OES [89] predates ICP-MS. It is also commonly referredo as ICP-atomic emission spectrometry (ICP-AES). Both ICP-OESnd ICP-MS make use of the plasmas for atomization and excita-ion/ionization. In ICP-OES the light emission from the excited atoms measured at a specific wavelength characteristic of that element.
Relative to ICP-MS, fewer studies have been done on iodineeasurement because the sensitivities are not as good. Further,
he most useful emission lines for iodine are located in the vac-um UV range [90]. Iodine has three prominent emission lines
n vacuum UV at 142.549, 178.276, and 183.038 nm. (The exactocations of the lines differ from one publication to another; a refer-nce compendium [91] for example lists the most intense emissionine being at 178.218 nm and the ∼183 nm line being located at82.980 nm). The major problem with using the most intense emis-ion line for the measurement for iodine is a neighboring emissionine of phosphorus, which is located only 0.007 [92] or 0.011 [93]m apart (depending on authors). With a good monochromator,ome resolution is possible but if the phosphorus to iodine ratio isigh, as will be true in most biological samples, large errors wille unavoidable unless the iodine content is high. Braselton et al.93] separately measured the P emission at 214.914 nm to corrector its contribution to the 178 nm emission line. They measuredohexol, an iodinated contrast agent in serum; the linear range
as 15–600 mg L−1, the precision decreased below an I concen-
ration of 15 mg L−1. Although less sensitive, the 183 nm line is freerom P interference. In green algae Chlorella enriched with iodine,fter sample solubilization with NMe4OH, an LOD of 3 �g g−1 wasossible by measurement at 183 nm [94].
himica Acta 702 (2011) 16– 36
Another alternative is to isolate the iodine from the matrix.Naozuka et al. [95] digested milk or egg powder samples in closedor open vessels in a microwave oven and then isolated the iodineby precipitation as AgI. Followed by dissolution in 20% NH4OH, theiodine could be directly measured with the respective LODs being280 and 40 �g g−1 for closed and open vessel digestions.
Iodine can be also isolated as the elemental vapor. Nakahara andWasa [96] pioneered this technique, using HClO4 or H2O2 for oxida-tion. They did not use the 178 nm emission line but were still ableto reach a 2 �g L−1 LOD. Cave and Green [97] used a silicone rubbermembrane for gas liquid separation and also obtained low �g L−1
LODs for groundwater samples. Niedobova et al. [98] used ethano-lic KOH and Ca(NO3)2 as an ashing aid for the digestion of milk ormilk powder. Sample ash was then treated with HCl and Na2SO3to acidify without iodine loss and eliminate CO2. I2 vapor was thengenerated by adding 1 M acidic H2O2. LODs were down to 20 �g L−1.Vtorushina et al. [90] optimized the vapor generation techniquewith different oxidants, found in situ generated HONO as the mostsuitable oxidant and were able to reach an LOD of 0.4 �g L−1 foraqueous samples using the 178 nm line (whereas the 183 nm linegave an order of magnitude poorer LOD); in comparison, with neb-ulization the LOD was 38 �g L−1 with the same 178 nm line. Dolanet al. [99] preconcentrated 10 mL of sample on an anion exchangemembrane disk, then eluted it with HNO3 and added H2O2 prior toentry into a He-plasma, attaining an LOD of 0.75 �g L−1.
Specific details of sample preparation (digestion) can often bethe most critical step in any trace analysis task. Souza et al. [100]describe combustion in an O2-pressurized (25 bar) commercialbomb for milk samples. Recovery of spiked iodide showed a greatdependence on whether the bomb was allowed to cool for anextended period prior to pressure release. Even under the favoredconditions of incorporating a cool down period, recovery of addediodide ranged from 75% to 105%, depending on the amount added.
7. Neutron activation analysis
Despite the fact that it is readily accessible to few, instrumen-tal neutron activation analysis (INAA) is often considered the goldor benchmark standard. In his review [91] on iodine determina-tion in foodstuff, Kucera, an expert on INAA, states that neutronactivation analysis is the second most widely reported techniquefor the analysis of iodine in foods and biological materials. Eventhough he does not document this statement, his review is excellentin summarizing the neutron activation techniques used for iodineanalysis.
In INAA, the sample is irradiated with neutrons and the charac-teristic emission from a radioactive isotope formed is monitored.One great advantage is that sample preparation is not needed aslong as self-shielding can be avoided. Iodine is a monoisotopic ele-ment (all isotopes other than 127I are radioactive). Upon neutronabsorption, 128I is formed from 127I. 128I decays to 128Xe by �-emission with energies of 2.1 and 1.7 MeV [101] and to 128Te byelectron capture with a half-life of 25 min [102]. Following �-decay,gamma radiation is emitted with energies of 442.9 and 526.6 keV.The 442.9 keV �-emission is most often used because the absoluteintensity is 10 times greater than that at 526.6 keV. Thermal neu-tron (energy 0.025 eV) activation is most commonly used in INAAbut in the case of measuring iodine, interferences from sodium,potassium, bromine, and chlorine can cause problems [102]. Thebackground from these ubiquitous elements can be vastly reducedby the use of epithermal neutrons (energy 1–10 keV) rather than
thermal neutrons [103–105]. Reactors with high epithermal tothermal neutron ratios are especially suited for epithermal INAA(EINAA) [103,104] but any reactor can be used and the thermalneutron flux filtered with a cadmium or boron filter thus reducing
ytica C
ticfbaiuebodbtah
appsfiatT
tpahd[ovttd
mirhInsmistp
8
adaUHs[pflfc
C.P. Shelor, P.K. Dasgupta / Anal
he thermal neutron count [106]. Normal EINAA detection is lim-ted by the effect of Compton scattering. Using an anti-coincidenceounting system, Compton scattering errors can be compensatedor [103]. An NaI(Tl) detector can be set up to itself act as a shield toackground radiation but the arrangement is not simple. An LODs low as 20 ng g−1 can be reached for the determination of iodinen foodstuffs. A ∼100 ng g−1 LOD was achieved [104] in sea-lettucesing flexible boron filters without anticoincidence counting. Hout al. [106] reported LODs of 10–95 ng g−1 for environmental andiological standard reference materials (SRMs) using EINAA with-ut Compton suppression. One caveat in comparing LODs forifferent NAA techniques is that the LOD is most often calculatedased on the sample counts vs. background and counts from poten-ially interfering radiation [107]. Samples of similar compositionre thus likely to exhibit similar LOD’s, but dissimilar samples willave different LOD’s even by the same technique.
Hou et al. [108] described a procedure for measuring iodatend iodide in milk, seawater or urine. The sample (10 mL) wasassed through an anion exchange resin column (housed in a dis-osable pipette) to capture both iodate and iodide. Using a lowtrength eluent, iodate only was eluted, reduced to iodide by bisul-te and captured on another column again. After thorough washing,
suitably cut portion of the column bearing the resin material wasransferred to a polyethylene vials and subjected to thermal INAA.he LOD was 10 ng I.
Under conditions that iodine can be captured without simul-aneous presence of the interfering elements, excellent LODs areossible without much ado. Parry [109] reports an LOD of 0.1 ng 127Ibsorbed on 1 g activated charcoal. It is interesting that based onis experiments involving radiochemical separations, Bowen pre-icted the same LOD for 127I by Radiochemical NAA (RNAA) in 1959110]. In general, neutron activation followed by a fast separationf the 128I formed from the potential interfering nuclides providesery good LODs and reliability; this has been practiced for a longime [110,111]. Precipitation as AgI is common in RNAA; precipi-ation as PdI2, which avoids coprecipitation of chloride, is useful inetermining iodine in chloride containing samples.
INAA has long had the moniker “gold standard.” However, Heck-an [112] performed a round robin study in 1979 to determine the
odine content in food. The general correlation among the differentesults were poor, including the results of the two INAA labs. INAAas greatly matured since then, and is widely used. However, while
NAA provides the luxury of direct sample measurement, it doesot derive its premier status on this principle alone but on properpectrum analysis, sample handling, and the judicious develop-ent of proper treatment of the sample following irradiation. This
ncludes, for example, exercising care in RNAA [110,111] or whenample pretreatment is performed [108], appropriate compensa-ion of interferences as done in EINAA, and cross validation of theroposed technique with an SRM.
. Atomic absorption spectrometry (AAS)
Bermejo-Barrera et al. [113] reviewed in detail the use of atomicbsorption spectrometry for iodine measurement until 1998. Directetermination of Iodine is difficult because no commercial lamp isvailable and the best iodine absorption bands lie in the vacuumV region where inert gas purging of the optical path is needed.owever, good limits of detection are achievable by indirect analy-
is, e.g., AgI can be precipitated, redissolved and measured as silver114]. Iodide in solutions obtained from alkaline ashing of sam-
les was precipitated with silver ion in a precipitation–dissolutionow manifold that allowed the retention of the AgI precipitate
ormed on a filter. The precipitate is washed with dilute (not con-entrated) ammonia that washes off other silver salts and then
himica Acta 702 (2011) 16– 36 31
dissolved in dilute thiosulfate followed by on-line determinationof silver. The determination range was 11–350 �g I L−1 with athroughput rate of 17 samples an hour and a relative precisionof 1.3–6.8%.
A similar indirect determination procedure relies on mercurydetermination by standard cold vapor AAS; a fixed amount of mer-curic ion is added in a flow manifold to the sample where Hg(II) isin excess relative to iodide. Iodide causes precipitation of HgI2; theresidual Hg(II) is measured after SnCl2 reduction [115]. The LODwas 2 �g I L−1.
9. Electrochemical and potentiometric probes
Ion selective electrodes (ISE) are commercially available foriodide and have been applied to the determination of iodide in milkfrom early on [116,117]. One study [116] compared direct mea-surement of iodine in milk and similar beverages by ISE and INAA(which compared well) with the S–K method (after ashing). TheS–K method produced lower results which the authors attributedto losses during digestion. The response of the ISE was found to benonlinear below 20 �M but was linear up to 1 mM. It takes 5–10 minto stabilize and a residue builds up after 10–15 h of use.
A recent study [118] compared established iodide-selectiveelectrode results for milk (obtained directly in the milk with someNi(NO3)2 added as a matrix modifier) with those obtained by ionchromatography coupled to amperometric detection. The lattertechnique involved significant sample preparation, initial heatingfor homogenization of fat, curdling by addition of acid and filtra-tion, centrifugal ultrafiltration of the filtrate and final processingthrough a C-18 cartridge prior to chromatography. The ISE methodshowed 87–114% recovery compared to 91–100% recovery for IC.The results for the samples exhibited a coefficient of determination(r2) of 0.84–0.85 but interestingly the ISE results were biased high.One would have thought that if major sample preparation steps (asinvolved in the IC measurement) can release some of the proteinbound iodine as iodide, the ISE results would be lower than the ICresults but this was not the case. Thiocyanate may be responsiblefor the higher ISE results.
The iodide ISE has also been used for measuring iodine inplants and feeds [119]. Almeida et al. [120] have described atubular custom made AgI/Ag2S based ISE as a detector in IC forthe analysis of urine and serum samples. A background level ofiodide was required in the column effluent to optimize perfor-mance. The detection limit was 1.47 �g L−1 and the linear rangewas 5–400 �g L−1.
Commercial iodide ISEs are similarly based on insoluble silversalt membranes and do respond to high levels of other anions thatform insoluble silver salts, notably other halides and pseudohalides.In recent years much effort has been devoted to synthesizing iodideselective ionophores that should have greater selectivity than silversalt based ISEs; these efforts were covered in a 2005 review [121].LODs as low as 10 nM were reported. However, such ISEs have notbeen significantly used yet.
Electrochemical detection in general and amperometric detec-tion in particular are popular for iodide determination because ofthe fast response time, sensitivity, and selectivity for the analyteof interest. A silver working electrode is most commonly used. Asiodide contacts an appropriately anodically poised Ag electrode, acurrent flows with the concomitant precipitation of silver iodideon the electrode surface [74,122–124]. An LOD of 40 nM and a lin-
ear range of 0.2–1.6 �M was found in anion-pair reverse phaseHPLC [122] assay of urine samples – good correlation (r = 0.96)with autoanalyzer-based S–K assay incorporating digestion wasobserved.
3 ytica C
sgsieiim
s(htevaswa
atcea
iwtertstiwtig
cctfio[a
1a
emf
1
kbat
2 C.P. Shelor, P.K. Dasgupta / Anal
Comparison of HPLC-amperometric detection with ICP-MShows good agreement although ICP-MS provides better LOD,reater linear range and greater sample throughput rate [74]. Ailver electrode can only be used a certain number of times beforet must be replaced because of the AgI deposits. Disposable printedlectrodes on polymer substrates have recently been commerciallyntroduced [125]. A negative dip in the signal after analyte elutions observed when using silver electrode amperometry [123]; this
akes quantification difficult.To overcome this dip-tailing issue and the progressive loss in
ensitivity from AgI deposition, pulsed amperometric detectionPAD) [124] and the use of other electrode types [123,126–129]ave been studied. In PAD, a multistep waveform is used suchhat the signal is measured under anodic conditions and then thelectrode is cleansed under cathodic conditions. Compared to con-entional DC amperometric detection, PAD shows no dip tailingnd an improved LOD of 20 ng L−1 [124]. The electrode, however,till must be replaced after ∼2 days of continuous use. The methodas used for the measurement of iodide in surface waters and
bsorbable organic iodide.Cataldi et al. [123,126] compared the performance of silver, gold,
nd modified platinum electrodes. The gold electrode had no dipailing but rapidly lost sensitivity. The modified platinum electrodeonsisted of platinum with an iodide coating continuously regen-rated by injection of potassium iodide [126]. An LOD of 0.5 �g L−1
nd a linear range up to 6 mg L−1 were attained.Other electrodes have been used. Boron-doped diamond (BDD)
n thin film form [127] exhibited a limit of detection of 10 nM andas linear up to 200 �M. Silver-containing carbon paste [128] elec-
rodes were used in IC and allowed an LOD of 0.47 �g L−1. Thislectrode was usable for 14 days of continuous use before needingegeneration. Dip-tailing was, however, observed above concentra-ions of 25 �g L−1. It was applied to the determination of iodide inkim milk, table salts, and distillate of seaweeds. A gold nanoelec-rode ensemble [129] exhibited reduced background compared tots macro scale counterparts and reduced adsorption of iodine. It
as applied to the direct determination of iodide in pharmaceu-ical ophthalmic solutions and table salt. An order of magnitudemprovement in the LOD, down to 300 nM compared to macroscaleold electrodes, was observed.
Large amounts of hydroxide left after alkaline ashing is notonducive to IC analysis. Iodide also elutes late as a broad peakompared to iodate which elutes early as a sharp peak. An elec-rochemical oxidation–neutralization device was developed toacilitate suppressed conductometric IC analysis; after alkaline ash-ng, the samples are run through this device in which iodide isxidized to iodate and hydroxide is oxidized to water and oxygen130]. Iodate could be determined in the range 0.1–10 mg L−1 with
limit of detection of 20 �g L−1
0. A platform for experimenting with novel detectionpproaches: flow injection analysis (FIA)
Flow injection and related approaches represent versatilexperimental platforms. It is not surprising that much iodineeasurement experimentation have been conducted on such plat-
orms.
0.1. Elemental iodine
Reaction of iodine with starch to form a blue color is well
nown. Amylose and amylopectin [131] are good forms of solu-le starch to use in this reaction. The complex with amylase has
�max at 560 nm and that with amylopectin at 630 nm. Elemen-al iodine can be measured, respectively, with throughput rates
himica Acta 702 (2011) 16– 36
of 140 and 220 samples h−1. The reaction with amylose was moresensitive, an LOD as low as 40 �g L−1could be reached. The reac-tion is catalyzed by the presence of iodide. The described systemused relatively high sample volumes and flow rates comparedto current practice; elemental iodine in sea water and salt wasdetermined.
The same authors had earlier looked at the use of polyvinyl alco-hol as a reagent for elemental iodine [132]. The color of the productvaries depending on how completely polyvinyl acetate has beenhydrolyzed to the alcohol. With the fully hydrolyzed polymer, ablue product is formed. As in the case of amylase/amylopectin, I3−
rather than I2, is likely involved. The response is nonlinear as a func-tion of concentration; an LOD of 60 �g L−1 and a throughput rate of140 samples h−1 were reported.
10.2. Sandell–Kolthoff assay with on-line digestion
A FIA method incorporating on-line digestion and the S–K reac-tion terminated with brucine and followed by absorbance detectionwas reportedly capable of a throughput of 70 samples h−1at a costof $0.01/sample and a capital investment of $2000 [50]. There wasminimal interference from thiocyanate and mercury. Although theauthors reported good comparability with results obtained withsamples that underwent alkaline ashing prior to injection, val-idation with another independent established method was notreported. The LOD was 39 nM with a determination range up to7.88 �M.
10.3. Another catalytic assay in a sequential injection format
Tetrabase (4,4′-methylenebis (N,N-dimethylaniline) is oxidizedby Chloramine-T to form a blue product that can be monitoredat 600 nm. The uncatalyzed reaction rate is very slow and iodideexerts a remarkable catalytic effect on this reaction. Using asequential injection setup, adjacent zones of sample, tetrabaseand Chloramine-T are stacked and then propelled through a reac-tion coil into a detector. An LOD of 50 ng L−1, a linear rangeof 0.1–6.0 �g L−1and a throughput rate of 80 samples h−1werereported. A 100-fold presence of Fe(II) interfered but operation at30 ◦C reduced this interference such that intended samples (phar-maceutical preparations/supplements/multivitamin tablets) couldbe successfully analyzed [133].
10.4. Chemiluminescence (CL)-based assays
Tris(bipyridyl)Ru3+ exhibits orange CL when reduced by a num-ber of reducing agents, the divalent tris(bipyridyl)Ru2+ ion isinitially formed in an excited state. The tris(bipyridyl)Ru3+ is gen-erated in situ by passage through a PbO2 packed column and thenmerged with a stream containing the reduced form of nicotinamideadenine dinucleotide (NADH). The light emission is greatly affectedby the presence of iodide; on this basis, an LOD of 1 nM with a linearrange of 10–500 nM, and a throughput rate of 60 samples h−1wereattained [134]. Applications to simple pharmaceuticals and saltwere demonstrated. Reducing/chelating agents, e.g., ascorbic acid,oxalic acid, and sulfite interfere.
The same group had earlier looked at the iodide catalysis of theCL reaction between formaldehyde and acidic KMnO4 [135]. TheLOD was 1 �M. Nitrite and Fe(II) seriously interfere and must beremoved prior to analysis. Only iodized salt samples were mea-sured with a throughput of 120 samples h−1.
Luminol is by far the most common reagent used in CL reactionsand iodine can be used as an oxidant to elicit luminol CL. CL-basedassays based on such reactions are described in the following sec-tion.
ytica C
1
sipbirlIb(sdiai
au[bssad[fdwwaI0
1
iNtAtaos
1
bt
btew
ifwZil
C.P. Shelor, P.K. Dasgupta / Anal
0.5. Vapor transfer, head space, pervaporation and gas diffusion
All these techniques result in isolation of the analyte from theample matrix that in turn provide for elimination/reduction ofnterferences. Burguera et al. [136] described a headspace sam-ling procedure where iodine is liberated from an acidic solutiony dichromate and the headspace vapor at an elevated temperature
s transferred to a trapping vial containing KI. The trapped iodineeacts with simultaneously introduced luminol and Co(II) as cata-yst while the CL signal is monitored. Luminol reacts with molecular2 but not I3−, as such I− concentration in the trapping solution muste kept minimal. The LOD was 10 �g L−1 with good spike recoveries101–103%). Presence of extraneous salt in the sample increases theignal because iodine is more easily transferred to the head spaceue to salting out effects. Salts present normally in urine thus help
ncrease the signal. Standards were prepared to contain a similarmount of salt. Urine samples were measured and the results weren good agreement with those from the S–K method.
Iodine can be liberated by oxidants and then made to diffusecross a porous PTFE “gas-diffusion” membrane. A KI solution issed to capture the iodine; this is then measured by luminol CL137]. This configuration suffers, however, from memory effectsecause of strong sorption of I2 on PTFE. While the authors did findome ways to ameliorate the problem, overall a more satisfactoryolution was not found until 2 years later when they were able todapt the method to a pervaporation system where there was noirect contact between the sample steam and the PTFE membrane138]. Emergency KI pills (large doses of KI designed to flush any 131Irom the body in the event of a major nuclear fallout) were analyzedirectly. In multivitamins, ascorbic acid had to be first removed; thisas accomplished with an anion-exchange resin column. Iodideas used in the carrier stream to reduce negative effects due to I2
dsorption. The calibration curve was nonlinear presumably due to2 adsorption. Recoveries ranged from 81.3% to 117%; the LOD was.5 mg L−1 with a short linear range of 1–10 mg L−1.
0.6. Electrochemical detection
The BDD thin film electrode mentioned previously has been usedn a FIA configuration with a linear range of 0.8–200 �M [127].ikolic et al. [139] have provided a new iodide catalyzed reac-
ion between Mn(III) (produced by mixing Mn(II) and MnO4−) and
s(III), the response was followed amperometrically at a Pt elec-rode. An LOD of 5 nM and a linear range of 0.5–100 �M werettained. They successfully analyzed samples of waters, salt, fodder,rganic substances, blood sera; results compared favorably withtandard procedures.
1. Gas and liquid chromatographic methods
After appropriate derivatization, iodine-bearing derivatives cane separated by gas chromatography (GC) and detected using elec-ron capture detection (ECD) [140–142].
Following alkaline ashing of foods, iodide was oxidized to iodiney acidic dichromate. 3-pentanone is added to the same mix-ure whence it forms 2-iodo-3-pentanone [140]. This was thenxtracted into hexane and subjected to GC-ECD analysis. The LODas 50 ng g−1.
The use of iodine containing disinfectants is common. Bloododine levels of burn patients treated with iodine containing disin-ectants were determined by taking a blood sample, dilution with
ater, heating to boiling, allowing to cool before the addition of
nSO4 and Ba(OH)2, and centrifugation. The supernatant was acid-fied, methyl isobutyl ketone (MIBK) and nitrite are added. Theiberated iodine was reacted with MIBK to form both the 1-iodo
himica Acta 702 (2011) 16– 36 33
and the 3-iodo derivative which was then extracted with hexanebefore GC-ECD analysis [141].
For the determination of iodide in milk, the sample was acidifiedstrongly with sulfuric acid, allowed to stand and filtered. The filtratewas treated with iodate and acetone when iodine was liberatedand formed iodoacetone. Determination of iodine already presentas elemental iodine (the author referred to this as inorganic iodine)required no addition of iodate. A hexane extract was analyzed byGC-ECD [142]. More aggressive initial sample treatment was con-ducted to determine total iodine. Reported LODs were 0.03, 1, and4 �g L−1 for inorganic iodine, iodide, and total iodine, respectively.
Among liquid phase separation techniques several ion chro-matographic and ion pair revered phase HPLC techniques havealready been mentioned [47,76,78–80,120,122,123,126,128,130].In another interesting and unusual technique based on size exclu-sion chromatography [143], iodide was converted to iodine, thensequestered with starch, and the resulting adduct was sepa-rated from the matrix using size exclusion chromatography withabsorbance detection at 224 nm. The linear range was 1–100 �g L−1
(r2 = 0.9992) with an LOD of 0.2 �g L−1. The method was success-fully applied to the determination of iodide in seawater and urinewith recoveries of 92–103% with 1.5–3.7% RSD.
Pantuckova and Krivankova [144] explored several capillaryelectrophoretic approaches for the separation of iodide from othermacro- and microcomponents in real sample matrices. The bestresults were obtained by adding �-cyclodextrin or polyethylen-imine. Comparable resolution and sensitivity were observed in bothcases. Cost considerations led to a focus on polyethylenimine. Asimple procedure to determine iodide in untreated human urine,serum, cooking salt, and seawater was developed. Polyacrylamidecoated capillaries, with negligible electroosmotic flow were usedwith the optimized background electrolyte composed of 20 mMKH2PO4 and 0.7% (w/v) polyethylenimine and UV detection at200 nm or 230 nm. For samples injected for 20 s at 0.5 psi, LODsattained were 0.14 �M for human urine, 0.17 �M for human serum,0.17 �M for seawater, and 89 nM for salt. Relative standard devia-tions of iodide peak area and height in the different matrices rangedfrom 0.93% to 4.19%.
12. UV–visible spectrometry
Iodine is an oxidant. There are many chromogenic substratesthat can be oxidized to intensely colored products. The trick ofcourse is to retain the iodine in a form where the iodine-derivedspecies is the only oxidant. The unique chemistry involving theformation of iodate and its behavior as a pH-sensitive oxidant aswell as the inherent 6-fold redox equivalent amplification when aniodide ion is converted into an iodate ion (the iodate can be used togenerate iodine, extracted from the matrix, reduced back to iodide,and subjected again to 6-fold amplification, see e.g., [145]) makesthis particularly possible.
The 6-fold amplication process proceeds as illustrated in thescheme below. All iodide is oxidized to iodate, iodide may be addedto generate iodine which can then be oxidized to iodate by a suitableoxidant such as bromine water and further amplification continuedas necessary:
I− + 3Br2 + 3H2O → IO3− + 6H+ + 6Br−
or
I2 + 5Br2 + 6H2O → 2IO3− + 12H+ + 10Br−
IO3− + 5I− + 6H+ → 3I2 + 3H2O
Both Ahmad [146] and two decades later, Kesari et al. [147]chose leuco crystal violet (LCV) as the chromogenic substrate
3 ytica C
tiiHaitrK
tocoa
aldmimicp
aed
tUgssTabwTostduos
msvp1Tsbmmf
1
att
4 C.P. Shelor, P.K. Dasgupta / Anal
hat forms intensely colored crystal violet (CV) upon oxidation byodine. Ahmad wet-ashed milk to form iodate and then liberatedodine and distilled the iodine collecting it as ammonium iodide.e oxidized the iodide to hypoiodous acid by N-chlorosuccinimidend used the HOI to oxidize LCV. Kesari et al. [147] oxidized iodiden pharmaceuticals, table salt, sea water, tap water, and soil sampleso iodate by bromine water (0.04–36 mg I L−1). Excess bromine wasemoved by adding formic acid. The iodate was then reacted withI to form I2 which then oxidizes LCV to CV, measured at 591 nm.
Starch has long seen practical use as both as a reversible indica-or for iodine and as a direct measure of iodine concentration basedn absorbance. Divrikliet al. [148] ashed urine samples, ensuredonversion of iodine to iodate and liberated iodine before additionf starch and measurement at 590 nm. The LOD was 2.3 �g L−1 with
linear range up to 250 �g L−1.In their review of methods for determination of iodine in urine
nd salt (with a view to determining iodine nutrition of a popu-ation), Jooste and Styrdom [149] list starch indicator based iodineetermination of salt by titration with thiosulfate ahead of all otherethods. Over much of the world, where the iodine vector in salt
s iodate, it is sufficient to acidify iodate-containing salt to generateolecular iodine for analysis. For countries where iodine is added
n the form of iodine, as in the U.S. and Canada, the iodide is firstonverted to iodate by bromine water and excess bromine removedrior to iodine generation and titration.
Instead of titration, iodine can be liberated as above and starchdded to form a color, the color intensity can then be read by a lightmitting diode based colorimeter. Such an instrument providesata that compare well with titrimetric results [150].
Atomic absorption of iodine, as stated before, is not widely prac-iced because the most useful absorption lines are in the vacuumV. However, certain molecular iodine species derived from inor-anic salts and generated using graphite furnace atomic absorptionpectrometers absorb intensely in the visible. Huang et al. [151]tudied the absorption spectra of the diatomic species AlI, GaI, InI,lI, MgI, CaI, SrI and BaI, generated in a graphite furnace using
high-resolution spectrometer. BaI exhibited intense absorptionands around 538 and 560 nm, each of them consisting of a series ofell-resolved rotational lines with half-widths of about 40–50 pm.
he strongest BaI line at 538.308 nm was used for the determinationf iodine. Aside from high levels of chloride, fluoride, iron, potas-ium and sodium, all of which significantly reduce the BaI signal,here were no interferences. Different chemical forms of iodine pro-uce identical response with an LOD of 600 pg, and a linear rangep to 250 ng I. Good agreement was observed with standard meth-ds for pills containing iodide and thyroxine. The RSD for 60 �g L−1
amples was 2%.Burakov et al. [152] proposed an intracavity laser spectroscopy
ethod where the iodine vapor over the headspace of a heatedample was measured. The sample was chemically treated to con-ert all forms of iodine into elemental I2. A pulsed dye laser (5 �sulse width) was used as the probe; the equivalent pathlength was
km. With urine samples, a LOD of 15 �g L−1 could be achieved.he basic process is similar to continuum source atomic absorptionpectrometry but because of the increased pathlength providedy the intracavity spectroscopy, it is several orders of magnitudeore sensitive. This method requires the use of a high resolutiononochromator based spectrometer. No components in urine were
ound to have an interfering effect on the measurement of iodine.
2.1. Other colorimetric catalytic reaction methods
Besides the S–K reaction, several other methods utilize the cat-lytic effect of iodide. Arsenic (III) has been replaced with Sb(III) forhe reduction of cerium(IV) [153]. This was applied to the detec-ion of IgG using iodine labeled antibodies and compared to the
himica Acta 702 (2011) 16– 36
S–K method as well as enzyme linked immunoassay methods. Allthree methods agreed well. While the immunoassay provided thelowest LOD, both the S–K and the analogous Sb(III) based methodprovided a greater useful assay range.
Iodide also catalyzes the oxidation of chlorpromazine by H2O2[154]. In this case the system reaches a maximum absorbance thatdirectly depends on the concentration of iodide present then decaysslowly. Urine or foods were digested with perchloric and sulfuricacids. The digest was mixed with chlorpromazine and hydrogenperoxide and the maximum absorbance (reached within 20–30 s)was measured at 525 nm. Negative and positive interferences werereported for Hg(II) and Fe(III), respectively. Iron can be corrected forby (a) measuring total response and (b) making a subsequent mea-surement after removing the iodide with Hg(II) and (c) subtractingb from a. The LOD was 1.6 ng I.
12.2. Visual colorimetric comparison
A rapid iodine test kit for the determination of UI that relies onthe iodide catalyzed oxidation of 3,3′,5,5′-tetramethylbenzidine byperacetic acid and H2O2 has been developed and is available fromMerck [155]. Urine samples were run through charcoal columnsto remove interfering substances. After adding the reagents to thesample in a test cup (part of the kit), the color is compared after30–60 s to a provided color chart that has 3 ranges: <100, 100–300,and >300 �g L−1. An HPLC based method was used for compari-son. It was found that the median iodine level can be estimatedwith sufficient accuracy. A single technician can process up to60 samples h−1 at a cost of $.50–1.00/sample. Possibly because ofurea to ammonia conversion in urine as it ages, and likely inter-ference from ammonia, the test can only be used with fresh urinesamples. It was also found that only iodide responds in this reaction.
13. X-ray fluorescence
X-ray fluorescence and X-ray absorption has been exploredfor iodine determination but the LOD is not adequate for tracedeterminations [92,156]. Using total reflection X-ray fluorescence(TXRF) a detection limit of 0.18 mg L−1 was achieved (data collec-tion time1000s, samples digested in 25% NH4OH). The chemistry ofiodine in soils was monitored using K-edge X-ray absorption near-edge structure (XANES). Naturally occurring levels of iodine couldnot be seen by the method, significant levels of iodide or iodate hadto be added to follow their fate.
14. Radiotracer analysis by scintillation counting
131I is widely used in clinical medicine and for laboratories mea-suring 131I routinely, this method of I determination in urine andwater may be convenient [157]. 131I, including any carrier iodide isadded to the sample and a substoichiometric amount of silver ion isadded as AgNO3. AgI is precipitated. The131I to 127I ratio in the AgI isidentical to that in the original sample. Precipitated AgI is separatedfrom the rest of the solution which bears excess 131I; the authorsused paper electrophoresis but other methods should be feasible.The isolated AgI is removed and the 131I therein is counted witha scintillation counter using standard procedures. The responsecurve obtained has a negative slope because as the sample containsmore nonradioactive iodide, less 131I is precipitated as AgI. The LODwas 1 �g L−1 and the linear range extended from 7 to 7500 �g L−1.
15. Quartz crystal oscillator
A method based on a quartz crystal microbalance (QCMM) hasbeen proposed for the determination of iodine in foods [158]. Fol-
ytica C
laanab
1
dascmmtm
tmtsfsahcwtp
A
bt
R
C.P. Shelor, P.K. Dasgupta / Anal
owing oxygen flask combustion, the iodine is trapped in an alkalinebsorbing solution. After free molecular iodine is liberated, the I2dsorbs on the gold electrode of the QCMM. The decrease in reso-ant frequency of the crystal is directly dependent on the mass of I2dsorbed. The LOD is 0.5 �g L−1and only interference seen is fromromine. The response is linear from 10 to 500 �g L−1.
6. Conclusion
Many of the methods here meet the criteria to be effective for theetermination of iodine in urine including low cost, rapid analysis,ccurate, free of interference and capable of being able to mea-ure even severe iodine deficiency (UI < 20 �g L−1). Few, however,an be carried out without involved sample pretreatment. Low costethods that can reliably measure UI without little or no pretreat-ent would be a boon. Extensive application would likely require
he endorsement of the WHO or similar other bodies before suchethods are adopted.In virtually all other sample matrices, extensive sample pre-
reatment, if not complete digestion, is needed for virtually allethods other than INAA; XRF can also do this in principle but
ypically is not sufficiently sensitive. Sample preparation thus con-titutes the bottleneck and few laboratories are actually equippedor perchloric acid digestion. Simple procedures to reliably mea-ure iodine in milk will be a major advance. The cost effectivenessnd simplicity of such techniques will be critical in determiningow well they are used in determining regional nutrition espe-ially in developing countries where the average diet may vary evenithin relatively short distances. Thus there remain opportunities
o greatly contribute to this arena, especially towards facile samplereparation.
cknowledgments
This work was supported principally by a grant from the Ger-er Foundation and in part by the US National Science Foundationhrough CHE-0821969.
eferences
[1] M.B. Zimmermann, Endocr. Rev. 30 (2009) 376.[2] D. Marine, O.P. Kimball, J. Lab. Clin. Med. 3 (1917) 40.[3] UNICEF Regional Office CEE/CIS, March 2006, The use of iodized salt in food
processing industry in Switzerland, p. 22. http://www.iodinenetwork.net/documents/2006 IS Study Tour pdf.
[4] H. Markel, Am. J. Public Health 77 (1987) 219.[5] Q.T. Ngyuen, Iodized Salt and U.S. Development. http://econweb.umd.edu/
(nguyen-q/job%20market/Quynh%20Nguyen%20-%20Job%20market%20paper%20-%2030%20oct%202009.pdf (accessed November 27, 2010).
[6] Food and Nutrition Board, Institute of Medicine, Dietary Reference Intakes ,National Academy Press, Washington, DC, 2001, p. 258 (accessed January 11,2011) http://www.nap.edu/openbook.php?record id=10026.
[7] R.D. Utiger, N. Engl, J. Med. 354 (2006) 2819.[8] World Health Organization, Assessment of Iodine Deficiency Disorders
and Monitoring Their Elimination. A Guide for Programme Managers,3rd ed., 2008. http://www.who.int/nutrition/publications/micronutrients/iodine deficiency/9789241595827/en/index.html (accessed January 12,2011.).
[9] H. Backer, J. Hollowell, Environ. Health Perspect. 108 (2000) 679.[10] R.T. Zoeller, J. Rovet, J. Neuroendocrinol. 16 (2004) 809.[11] F. Delange, Postgrad. Med. J. 77 (2001) 217.[12] P. Santiago-Fernandez, R. Torres-Barahona, J.A. Muela-Martinez, G. Rojo-
Martinez, E. Garcia-Fuentes, M.J. Garriga, A.G. Leon, F. Soriguer, J. Clin.Endocrinol. Metab. 89 (2004) 3851.
[14] J.A.T. Pennington, S.A. Schoen, Int. J. Vitam. Nutr. Res. 66 (1996) 342.[15] E.N. Pearce, S. Pino, X. He, H.R. Bazrafshan, S.L. Lee, L.E. Braverman, J. Clin.
Endocrinol. Metab. 89 (2004) 3421.[16] P.K. Dasgupta, Y. Liu, J.V. Dyke, Environ. Sci. Technol. 42 (2008) 1315.[17] S. Havas, Cereal Foods World 53 (2008) 17.[18] K.B. Harris, K.A. Pass, Mol. Genet. Metab. 91 (2007) 268.[19] J. Rovet, D. Daneman, Paediatr. Drugs 5 (2003) 141.
himica Acta 702 (2011) 16– 36 35
[20] Centers for Disease Control and Prevention (CDC), National Center forHealth Statistics (NCHS), National Health and Nutrition Examination Sur-vey Data, U.S. Department of Health and Human Services, Centers forDisease Control and Prevention, Hyattsville, MD, 2007–2008. http://www.cdc.gov/nchs/nhanes/nhanes2007-2008/nhanes07 08.htm.
[22] F. Vermiglio, V.P. Lo Presti, M. Moleti, M. Sidoti, G. Tortorella, G. Scaffidi, M.G.Castagna, F. Mattina, M.A. Violi, A. Crisa, A. Artemisia, F. Trimarchi, J. Clin.Endocrinol. Metab. 89 (2004) 6054.
[23] P.K. Dasgupta, Anal. Chim. Acta 567 (2006) 1.[24] P.K. Dasgupta, Environ. Chem. 6 (2009) 7.[25] R. Renner, Environ. Health Perspect. 118 (2010) A439.[26] E.B. Sandell, I.M. Kolthoff, Mikrochim. Acta 1 (1937) 9.[27] H. Shintani, P.K. Dasgupta, Anal. Chem. 59 (1987) 1963.[28] W. May, D. Wu, C. Eastman, P. Bourdoux, G. Maberly, Clin. Chem. 36 (1990)
9419.[34] J.G. Dorea, J. Am. Coll. Nutr. 23 (2004) 97.[35] S.B. Barker, M.J. Humphrey, M.H. Soley, J. Clin. Invest. 30 (1951) 55.[36] J.R. Bellanger, J.C. Tressol, H.P. Piel, Ann. Rech. Vet. 10 (1979) 113.[37] O.P. Foss, L. Hankes, D.D. Van Slyke, Clin. Chim. Acta 5 (1960) 301.[38] P.W.F. Fischer, M.R. Labbe, J. Assoc. Off. Anal. Chem. 64 (1981) 71.[39] N. Patzeltova, Chem. Pap. -Chem. Zvesti. 47 (1993) 237.[40] P.W.F. Fischer, M.R. Labbe, A. Giroux, J. Assoc. Off. Anal. Chem. 69 (1986)
687.[41] US Food And Drug Administrtion. Kansas City Laboratory, Determination of
Iodine in Foods, KAN-LAB-MET.95 Ver. 3.2, Updated August 2007, TammySmith, USFDA, Personal communication, November 2010.
[42] B. Zak, H.H. Willard, G.B. Myers, A.J. Boyle, Anal. Chem. 24 (1952) 1345.[43] J. Benotti, N. Benotti, S. Pino, H. Gardyna, Clin. Chem. 11 (1965) 932.[44] H. Hoch, C.G. Lewallen, Clin. Chem. 15 (1969) 204.[45] B. Tiran, O. Wawschinek, O. Eber, A. Beham, S. Lax, M. Dermelj, Exp. Clin.
2021.[51] B. Rollmann, C. Regaert, J.P. Herveg, Arch. Int. Physiol. Biochim. 93 (1985) B51.[52] R.A. Zaroda, Clin. Chem. 15 (1969) 555.[53] J.E. Rae, S.A. Malik, Chemosphere 33 (1996) 2121.[54] D.S. Wu, H.W. Deng, W.Y. Wang, H.Y. Xiao, Anal. Chim. Acta 601 (2007) 183.[55] A. Grossmann, G.F. Grossmann, Clin. Chem. 4 (1958) 296.[56] S. Passen, R. von Saelski, Am. J. Clin. Pathol. 51 (1969) 166.[57] G. Kessler, V.J. Pileggi, Clin. Chem. 16 (1970) 382.[58] G. Palumbo, M.F. Tecce, G. Ambrosio, Anal. Biochem. 123 (1982) 183.[59] V.J. Pileggi, G. Kessler, Clin. Chem. 14 (1968) 339.[60] N. Baudry, B. Mallet, P.J. Lejeune, L. Vinet, J.L. Franc, J. Endocrinol. 153 (1997)
99.[61] P.J. Garry, D.W. Lashley, G.M. Owen, Clin. Chem. 19 (1973) 950.[62] D. Jungst, L. Strauch, Z. lin, Chem. Klin. Biochem. 7 (1969) 636.[63] M. Mantel, Clin. Chim. Acta 33 (1971) 39.[64] W.F. Rayburn, A. Robinson, L.E. Braverman, X.M. He, S. Pino, M.L. Gargas, J.H.
Kinzell, Reprod. Toxicol. 25 (2008) 129.[65] C. Wuethrich, S.E. Jaeggi-Groisman, H. Gerber, Clin. Chem. Lab. Med. 38 (2000)
1027.[66] P. Houze, M. Corvisier, M.E. Toubert, B. Gourmel, B. Bousquet, Ann. Biol. Clin.
– Paris 62 (2004) 222.[67] H. Hussain, W. Nazaimoon, W. Mohamud, Trop. Biomed. 23 (2006) 109.[68] T. Ohashi, M. Yamaki, C.S. Pandav, M.G. Karmarkar, M. Irie, Clin. Chem. 46
(2000) 529.[69] S. Kaufman, J. Pediatr. 68 (1966) 990.[70] J. Benotti, N. Benotti, Clin. Chem. 12 (1963) 408.[71] R. Okennedy, P. Keating, J. Immunol. Methods 163 (1993) 225.[72] R. Thomas, Practical Guide to ICP-MS , Marcel-Dekker, New York, 2004.[73] M. Haldimann, B. Zimmerli, C. Als, H. Gerber, Clin. Chem. 44 (1998) 817.[74] V. Poluzzi, B. Cavalchi, A. Mazzoli, G. Alberini, A. Lutman, P. Coan, I. Ciani, P.
Trentini, M. Ascanelli, V. Davoli, J. Anal. At. Spectrom. 11 (1996) 731.[75] R. Santamaria-Fernandez, P. Evans, C.S.J. Wolff-Briche, R. Hearn, J. Anal. At.
Spectrom. 21 (2006) 413.[76] W. Buchberger, B. Czizsek, S. Hann, G. Stingeder, J. Anal. At. Spectrom. 18
(2003) 512.[77] Centers for Disease Control and Prevention, Division of Laboratory Science,
Iodine in Urine, DLS method code: 2001/04-OD, Revised August 22, 2001, CLIA
methods, Centers for Disease Control and Prevention, Atlanta, GA, 2001, pp.1–20.
[78] R.G. Wuilloud, N. Selar, S.S. Kannamkumarath, J.A. Caruso, J. Anal. At. Spec-trom. 19 (2004) 1442.
[79] H.J. Stark, J. Mattusch, R. Wennrich, A. Mroczek, Fresenius J. Anal. Chem. 359(1997) 371.
[80] M. Leiterer, D. Truckenbrodt, K. Franke, Eur. Food Res. Technol. 213 (2001)150.
[81] L.F. Sanchez, J. Szpunar, J. Anal. At. Spectrom. 14 (1999) 1697.[82] B. Michalke, P. Schramel, Electrophoresis 20 (1999) 2547.[83] B.P. Jensen, B. Gammelgaard, S.H. Hansen, J.V. Andersen, J. Anal. At. Spectrom.
18 (2003) 891.[84] M. Takeuchi, P.K. Dasgupta, J.V. Dyke, K. Srinivasan, Anal. Chem. 79 (2007)
5690.[85] M. Wind, A. Eisenmenger, W.D. Lehmann, J. Anal. At. Spectrom. 17 (2002) 21.[86] P. Schramel, S. Hasse, Mikrochim. Acta 116 (1994) 205.[87] E.H. Larsen, M.B. Ludwigsen, J. Anal. At. Spectrom. 12 (1997) 435.[88] M.F. Mesko, P.A. Mello, C.A. Bizzi, V.L. Dressler, G. Knapp, E.M.M. Flores, Anal.
Encyclopedia of Analytical Chemistry , Wiley On-line library, Wiley, New York,2008.
[90] E.A. Vtorushina, A.I. Saprykin, G. Knapp, J. Anal. Chem. 63 (2008) 643.[91] J. Kucera, in: V.R. Preedy, G.N. Burrow, R.R. Watson (Eds.), Comprehensive
Handbook of Iodine, Academic Press, Massachusetts, 2009, pp. 15–27.[92] I. Varga, Microchem. J. 85 (2007) 127.[93] W.E. Braselton, K.J. Stuart, J.M. Kruger, Clin. Chem. 43 (1997) 1429.[94] E. Niedobova, J. Machat, V. Kanicky, V. Otruba, Microchim. Acta 150 (2005)
103.[95] J. Naozuka, M. da Veiga, P.V. Oliveira, E. de Oliveira, J. Anal. At. Spectrom. 18
(2003) 917.[96] T. Nakahara, T. Wasa, Appl. Spectrosc. 41 (1987) 1238.[97] M.R. Cave, K.A. Green, J. Anal. At. Spectrom. 4 (1989) 223.[98] E. Niedobova, J. Machat, V. Otruba, V. Kanicky, J. Anal. At. Spectrom. 20 (2005)
(1991) 2539.100] G.B. Souza, E. Carrilho, C.V. Oliveira, A.R.A. Nogueira, J.A. Nobrega, Spec-
trochim. Acta Part B-At. Spectrosc. 57 (2002) 2195.101] M. Kahn, J. Kleinberg, Radiochemistry of Iodine, Nuclear Science Series,
National Academy of Sciences – National Research Council, NAS-NS-3062,(1977).
102] J. Kucera, Z. Randa, L. Soukal, J. Radioanal. Nucl. Chem. 249 (2001) 61.103] Y. Serfor-Armah, B.J.B. Nyarko, J. Holzbecher, E.H.K. Akaho, E.K. Osae, A. Chatt,
J. Radioanal. Nucl. Chem. 256 (2003) 259.104] B.J.B. Nyarko, Y. Serfor-Armah, S. Osae, E.H.K. Akaho, S. Anim-Sampong, B.T.
[116] P. Miles, J. Assoc. Off. Anal. Chem. 61 (1978) 1366.[117] C.A. Gushurst, J.A. Mueller, J.A. Green, F. Sedor, Pediatrics 73 (1984) 354.[118] J. Melichercik, L. Szijarto, A.R. Hill, J. Dairy Sci. 89 (2006) 934.[119] W.L. Hoover, J.R. Melton, P.A. Howard, J. Assoc. Off. Anal. Chem. 54 (1971) 760.[120] A.A. Almeida, X. Jun, J. Lima, Mikrochim. Acta 127 (1997) 55.[121] W. Zhang, A. Mnatsakanov, R. Hower, H. Cantor, Y.Z. Wang, Front. Biosci. 10
(2005) 88.[122] J. Rendl, S. Seybold, W. Borner, Clin. Chem. 40 (1994) 908.[123] T.R.I. Cataldi, A. Rubino, M.C. Laviola, R. Ciriello, J. Chromatogr. B-Anal. Tech-
nol. Biomed. Life Sci. 827 (2005) 224.[124] C. Bruggink, W.J.M. van Rossum, E. Spijkerman, E.S.E. van Beelen, J. Chro-
matogr. A 1144 (2007) 170.[125] Dionex Corporation, Disposable electrodes for electrochemical detection.
http://www.dionex.com/en-us/webdocs/42552-Disposable%20ElectrodesDataSheet V30 released102706.pdf (accessed December 4, 2010).
[126] T.R.I. Cataldi, A. Rubino, R. Ciriello, Anal. Bioanal. Chem. 382 (2005) 134.[127] O. Chailapakul, M. Amatatongchai, P. Wilairat, K. Grudpan, D. Nacapricha,
Talanta 64 (2004) 1253.[128] T.K. Malongo, S. Patris, P. Macours, F. Cotton, J. Nsangu, B.M. Kauffmann,
Talanta 76 (2008) 540.[129] F.C. Pereira, L.M. Moretto, M. De Leo, M.V.B. Zanoni, P. Ugo, Anal. Chim. Acta
575 (2006) 16.[130] K.K. Hu, W.X. Huang, Y.H. Su, R.Z. Hu, Chin. Chem. Lett. 20 (2009) 1483.[131] V.V. Kuznetsov, Y.V. Ermolenko, L. Seffar, J. Anal. Chem. 62 (2007) 479.[132] V.V. Kuznetsov, Y.V. Ermolenko, L. Seffar, J. Anal. Chem. 59 (2004) 688.[133] Z.O. Tesfaldet, J.F. van Staden, R.I. Stefan, Talanta 64 (2004) 1213.[134] A. Waseem, M. Yaqoob, A. Nabi, Luminescence 23 (2008) 316.[135] M. Yaqoob, R. Atiq ur, A. Waseem, A. Nabi, Luminescence 21 (2006) 221.[136] J.L. Burguera, M.R. Brunetto, Y. Contreras, M. Burguera, M. Gallignani, P. Car-
rero, Talanta 43 (1996) 839.[137] N. Ratanawimarnwong, N. Amomthammarong, N. Choengchan, P. Chaisuwan,
M. Amatatongchai, P. Wilairat, I.D. McKelvie, D. Nacapricha, Talanta 65 (2005)756.
[138] D. Nacapricha, P. Sangkarn, C. Karuwan, T. Mantim, W. Waiyawat, P.Wilairat, I. Cardwell, I.D. McKelvie, N. Ratanawimarnwong, Talanta 72 (2007)626.
[139] S.D. Nikolic, J.J. Mutic, A.D. Lolic, D.D. Manojlovic, Anal. Sci. 21 (2005).[140] T. Mitsuhashi, Y. Kaneda, J. Assoc. Off. Anal. Chem. 73 (1990) 790.[141] D.J. Doedens, J. Anal. Toxicol. 9 (1985) 109.[142] S. Grys, J. Chromatogr. 100 (1974) 43.[143] H.B. Li, F. Chen, X.R. Xu, J. Chromatogr. A 918 (2001) 335.[144] P. Pantuckova, L. Krivankova, Electrophoresis 25 (2004) 1102.[145] V. Maheswari, N. Balasubramanian, Analusis 25 (1997) 2.[146] N. Ahmad, Aust. J. Dairy Technol. 32 (1977) 103.[147] R. Kesari, R. Rastogi, V.K. Gupta, Chem. Anal. (Warsaw) 43 (1998) 201.[148] U. Divrikli, M. Soylak, M. Dogan, Chem. Anal. (Warsaw) 45 (2000) 257.[149] P.L. Jooste, E. Strydom, Best Pract. Res. Clin. Endocrinol. Metab. 24 (2010)
77.[150] T. Dearth-Wesley, A. Makhmudov, C.M. Pfeiffer, K. Caldwell, Food Nutr. Bull.
25 (2004) 130.[151] M.D. Huang, H. Becker-Ross, S. Florek, M. Okruss, B. Welz, S. Mores, Spec-
trochim. Acta Part B-At. Spectrosc. 64 (2009) 697.[152] V.S. Burakov, A.V. Isaevich, P.Y. Misakov, P.A. Naumenkov, S.N. Raikov, J. Anal.
At. Spectrom. 9 (1994) 307.[153] M. Butler, R. Okennedy, Anal. Lett. 27 (1994) 681.[154] T. Tomiyasu, M. Nonaka, M. Uchikado, K. Anazawa, H. Sakamoto, Anal. Sci. 20
(2004) 391.[155] J. Rendl, D. Bier, T. Groh, C. Reiners, Exp. Clin. Endocrinol. Diabetes 106 (1998)
S12.
[156] N. Yamaguchi, M. Nakano, R. Takamatsu, H. Tanida, J. Environ. Radioact. 101
(2010) 451.[157] P. Unak, S. Darcan, F. Yurt, Z. Biber, M. Coker, Biol. Trace Elem. Res. 71–2 (1999)

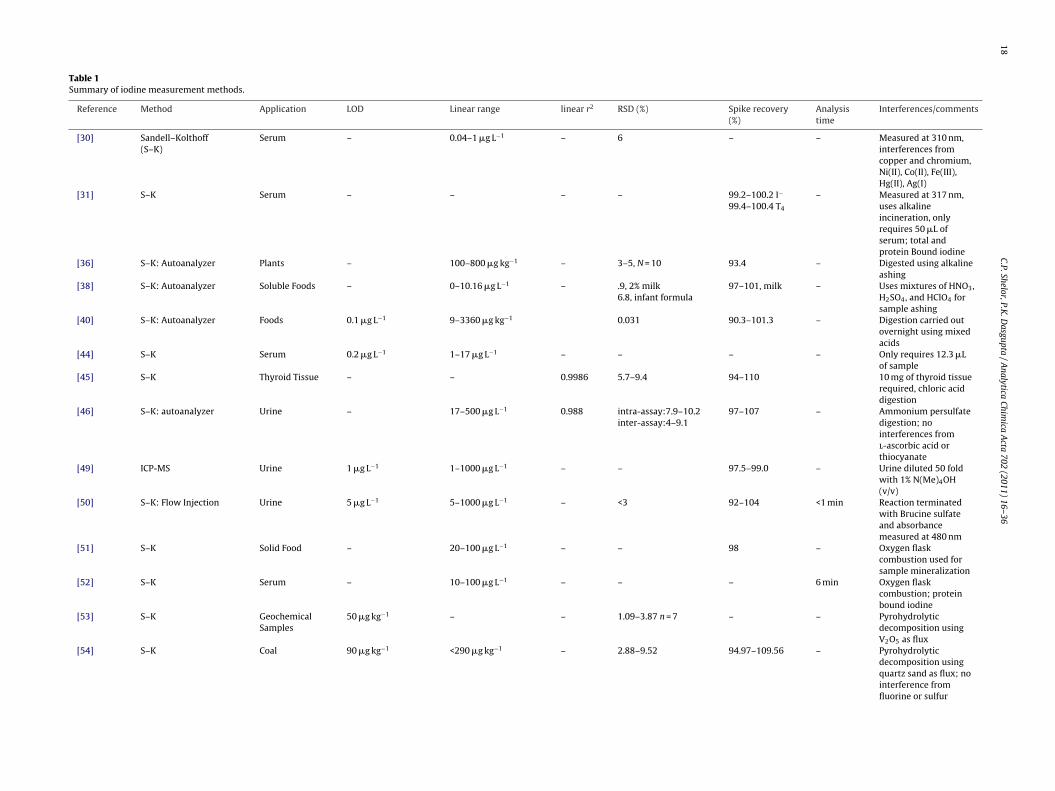

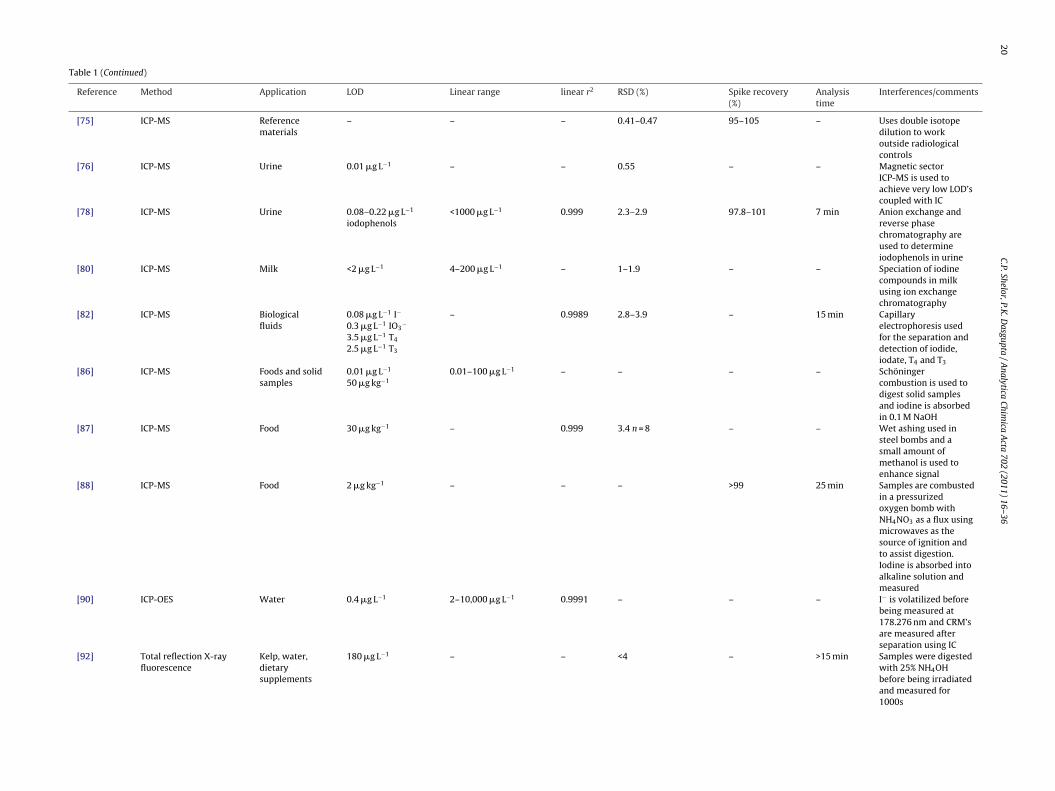
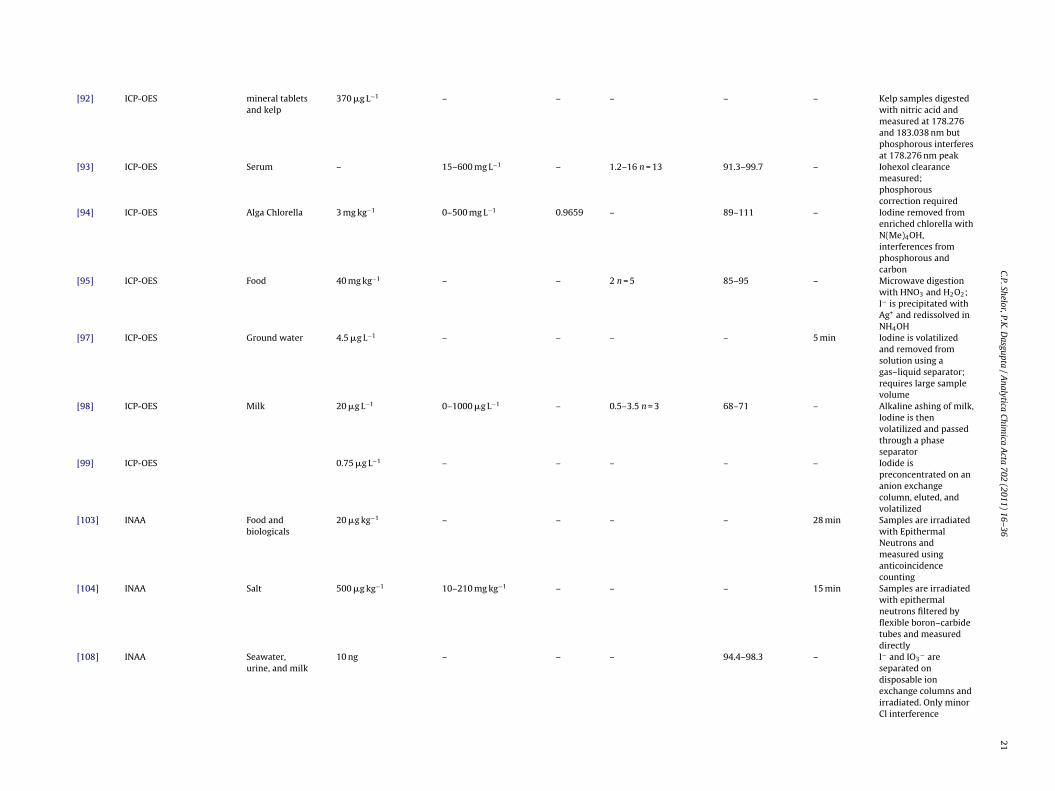
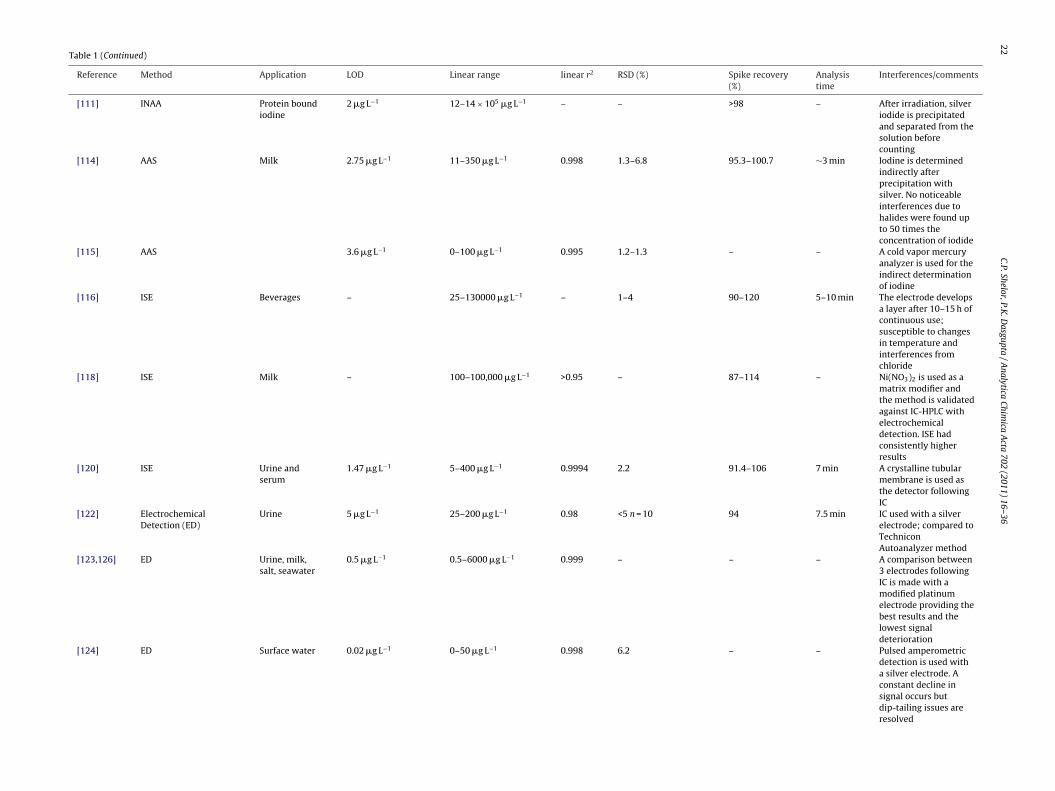
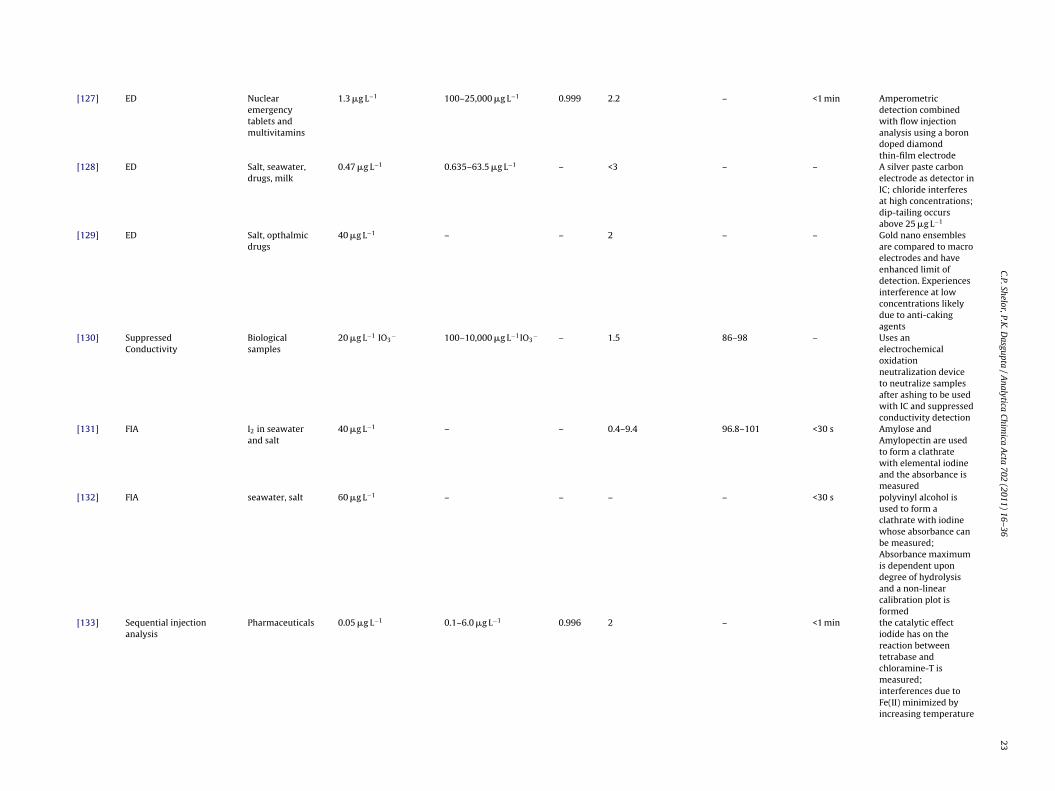
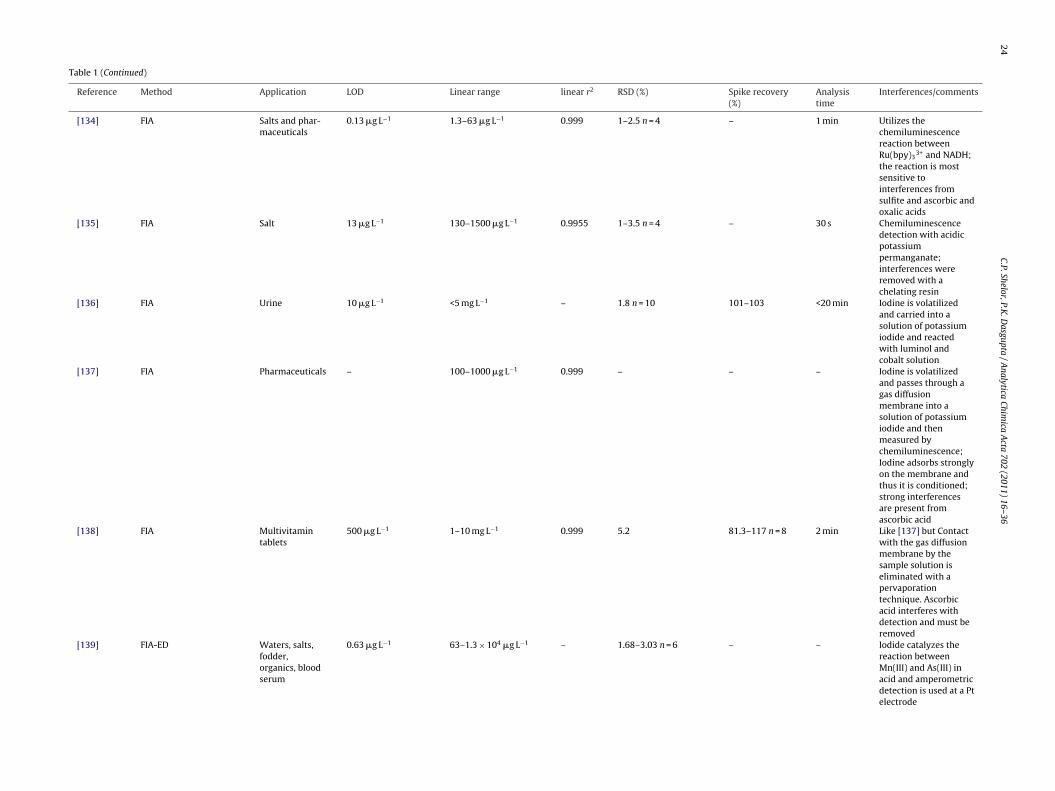
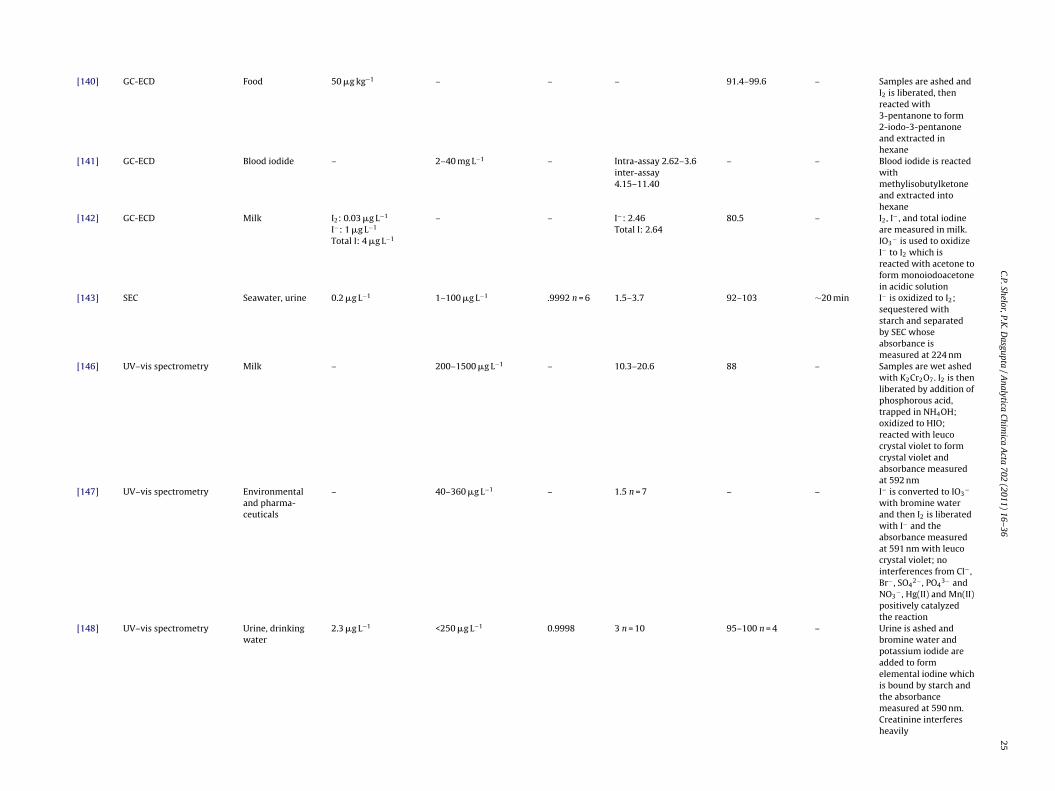
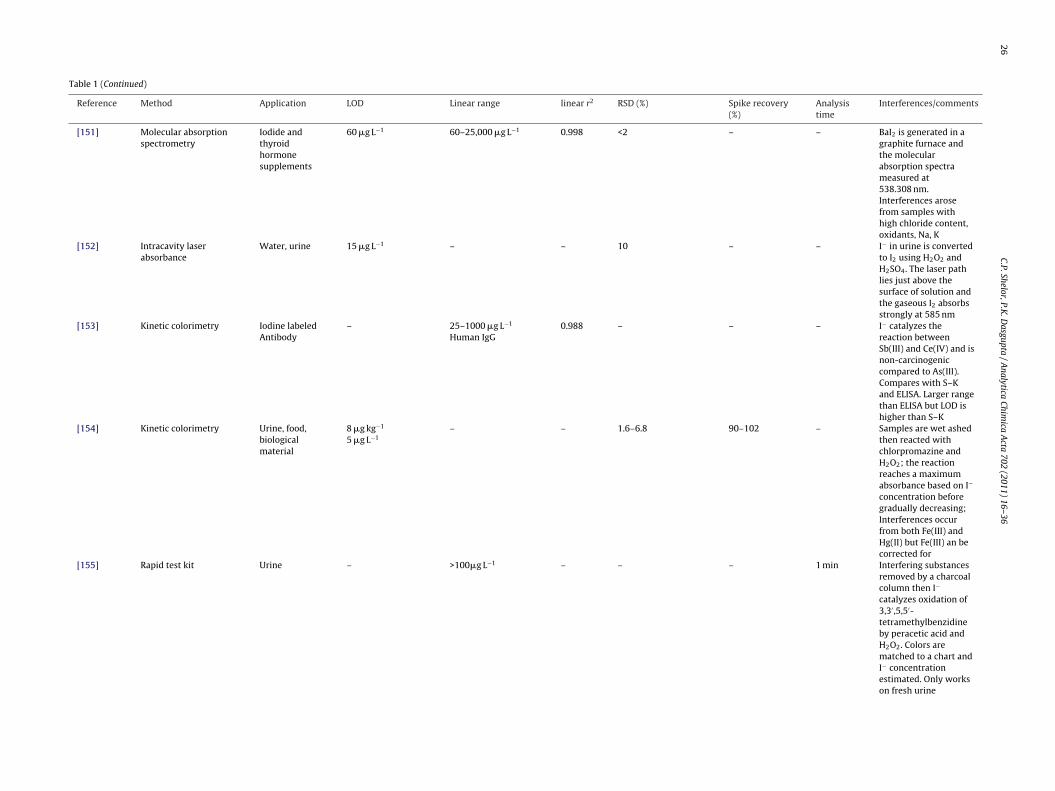
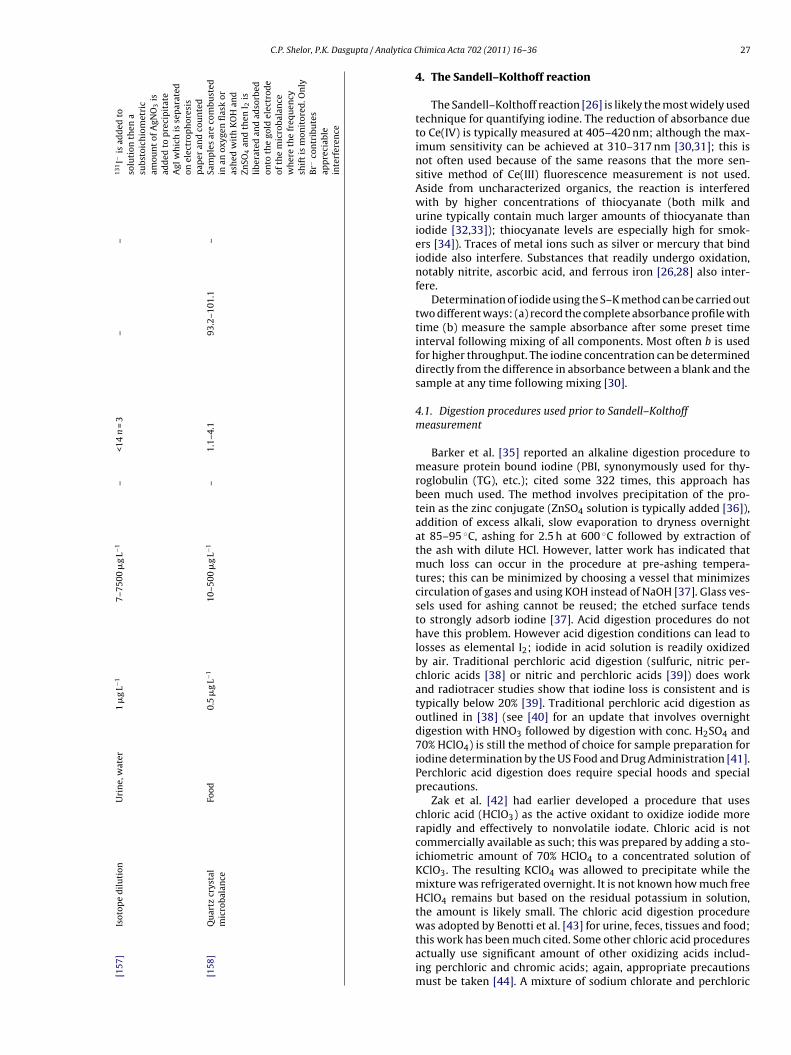


![Inorganica Chimica Acta - iris.unina.it · Inorganica Chimica Acta 453 (2016) 330–338 Contents lists available at ScienceDirect Inorganica Chimica Acta ... [10,11]. In addition,](https://static.documents.pub/doc/80x56/5c65ec8509d3f230488b5a47/inorganica-chimica-acta-irisuninait-inorganica-chimica-acta-453-2016-330338.jpg)
![Analytica Chimica Acta - UT Arlington – UTA · 104 K.A. Schug et al. / Analytica Chimica Acta 713 (2012) 103–110 large pharmaceuticalcompanies[8,9].Infact,onlytwonewclasses of](https://static.documents.pub/doc/80x56/5c67dd2009d3f226588c984a/analytica-chimica-acta-ut-arlington-104-ka-schug-et-al-analytica.jpg)


![Analytica Chimica Acta - download.xuebalib.comdownload.xuebalib.com/1dc8WMowcDlH.pdf · vices [10], promising organic thermoelectric materials [20], dye- sensitized solar cells [21],](https://static.documents.pub/doc/80x56/5b90021d09d3f28c298d53ca/analytica-chimica-acta-vices-10-promising-organic-thermoelectric-materials.jpg)


![Analytica Chimica Acta - University of California, Santa CruzAnalytica Chimica Acta 1105 (2020) 82e86 about cancer status and progression [5,6]. miR-1290 is a highly sensitive and](https://static.documents.pub/doc/80x56/60af0ef23cf3d07be8654c9c/analytica-chimica-acta-university-of-california-santa-cruz-analytica-chimica.jpg)

