Analytical Characterization of an Orally-Delivered PeptidePharmaceutical Product
Wayne P Kelle ydagger Shujun ChenDagger Philip D Floyd∥ Ping Hudagger Shiva G Kapsisect Alireza S KordDagger
Mingjiang SunDagger and Frederick G Vogt Dagger
daggerBiopharmaceutical RampD GlaxoSmithKline llc 709 Swedeland Road King of Prussia Pennsylvania 19406 United StatesDaggerProduct Development GlaxoSmithKline plc 709 Swedeland Road King of Prussia Pennsylvania 19406 United StatessectProduct Development GlaxoSmithKline plc 1250 South Collegeville Road Collegeville Pennsylvania 19426 United States∥Product Development GlaxoSmithKline plc 5 Moore Drive Research Triangle Park North Carolina 27709 United States
S Supporting Information
ABSTRACT The characterization of orally-delivered peptide pharmaceuticals presents several challenges to analytical methodsin comparison to characterization of conventional small-molecule drugs These challenges include the analysis andcharacterization of difficult-to-separate impurities secondary structure the amorphous solid-state form and the integrity of
enteric-coated drug delivery systems This work presents the multidisciplinary analytical characterization of a parathyroidhormone (PTH) peptide active pharmaceutical ingredient (API) and an oral formulation of this API within enteric-coatedsucrose spheres The analysis of impurities and degradation products in API and formulated drug product was facilitated by thedevelopment of an ultrahigh-performance liquid chromatography (UHPLC) method for analysis by high-resolution massspectrometry (MS) The use of UHPLC allowed for additional resolution needed to detect impurities and degradationproducts of interest The secondary structure was probed using a combination of solution-state NMR infrared and circulardichroism spectroscopic methods Solid-state NMR is used to detect amorphous API in a nondestructive manner directly within the coated sucrose sphere formulation Fluorescence and Raman microscopy were used in conjunction with Ramanmapping to show enteric coating integrity and observe the distribution of API beneath the enteric-coating on the sucrosespheres The methods are combined in a multidisciplinary approach to characterize the quality of the enteric-coated peptideproduct
Peptides and modi1047297ed peptides represent an important class
of pharmacologically active molecules
1minus4
Despite promis-ing interactions between peptides and their targets and goodin vitro activity many peptides undergo metabolic degradationand are ineff ective as drugs This problem is exacerbated whenthe peptide is administered orally5 Proteolytic enzymes in thegut often degrade these peptides through recognition of aparticular amino acid in their sequence leading to hydrolysis inthe digestive system and subsequent loss of activity As a resultthe number of peptide-related drugs in clinical studies andon the commercial market is limited However recent eff ortsto chemically modify peptides in an eff ort to improve theirstability in physiologically relevant media have yielded a variety of promising peptide therapies6
The development of synthetic and recombinant peptide-
based drugs can also be a complex and diffi
cult process Onemajor challenge is the development of capable analytical methodsfor adequate characterization of the 1047297nal drug product Asregulatory guidance on peptide therapeutic products is not yetstandardized regulatory agencies often expect that a peptideactive pharmaceutical ingredient (API) is structurally charac-terized in the detailed manner expected for a small-molecule API prepared by chemical synthesis7 However peptides can
Received December 28 2011 Accepted April 12 2012Published April 12 2012
Article
pubsacsorgac
copy 2012 American Chemical Society 4357 dxdoiorg101021ac203478r | Anal Chem 2012 84 4357minus4372
7212019 Analytical Characterization of an Orally-Delivered Peptide Pharmaceutical Product
exhibit some of the complex structural eff ects more typically associated with biopharmaceutical drugs such as secondary structure and complex impurity pro1047297les Furthermore unlikeother biopharmaceuticals such as monoclonal antibodiesrecombinant proteins and recombinant DNA productspeptides are often developed as oral or other nonintravenousdosage forms Peptides thus present several unique challenges
for pharmaceutical analysis First analytical methods are neededfor the characterization of the impurities and degradation prod-ucts in both the API and dosage form Additionally peptide biopharmaceuticals are often manufactured by living organisms which can result in a complex initial analyte mixture with many components Furthermore analytical separation method devel-opment is complicated because peptides can also vary widely intheir hydrophobicity and charge state The polarity of thepeptides is in1047298uenced by their side chains which are classi1047297edas hydrophilic or hydrophobic Hydrophilic side chains can beuncharged polar groups basic side chains can be positively charged and potentially negatively charged acidic side chainscan be present In all three cases there are considerable poten-tial variations to the side chain size shape and chemical prop-erties Peptides can thus be challenging analytes for traditionalreversed-phase separation methods8 Identi1047297cation of chemicalimpurities and analysis of secondary structure can also be acomplex undertaking requiring the use of orthogonal analyticaltechniques Finally the desire to develop specialized oral dosageforms for peptide drugs to prevent excessive degradation leads tonew challenges in characterizing the solid dosage form whileensuring product performance
In the present work an oral parathyroid hormone (PTH)peptide and an enteric-coated oral formulation of this peptideare characterized using several analytical approaches Develop-ment of an oral form of PTH is desired to overcome severalissues with current medicines Currently a recombinant form of PTH consisting of the 1047297rst 34 amino acids known as teri-paratide is approved in the US for the treatment of osteo-porosis but requires subcutaneous injection9minus11 The peptide API studied here is a recom binant fragment of the 84 aminoacid native human PTH1112 consisting of the 1047297rst 31 aminoacids13 The sequence of this peptide is
This single-chain peptide abbreviated rPTH(1-31)NH2 hasa molecular mass of 37184 Da and an isoelectric point of approximately 99 The peptide is not glycosylated does notcontain any disul1047297de bridges and is amidated at its carboxylterminus to prevent cleavage prior to absorption Analysis of an
enteric- and API-coated sucrose sphere formulation developedfor rPTH(1-31)NH2 which allows the peptide to be protectedfrom gastric degradation is the focus of the present work Thisformulation is designed to release the product in the smallintestine as discrete microspheres in an attempt to exposeenough surface area to yield maximum potential permeation of rPTH(1-31)NH2 through the intestinal wall Spray-coating therecombinant peptide onto the sphere provides a scaff old sub-strate to anchor the API An outer coating consisting of anenteric polymer is then added to protect the peptide from gastricdegradation The spheres can be dosed inside an ordinary capsule that ruptures in the stomach Increases in the local pH(typically gt55) as the spheres are dumped to the small
intestine causes the dissolution of the enteric coating andrapid dispersal of the sucrose sphere and highly soluble API
The goal of the present work is to address in a holisticmanner the analytical challenges faced in the pharmaceuticaldevelopment of rPTH(1-31)NH2 as an enteric- and API-sucrose sphere dosage form In order to ensure chemical purity of the formulation after manufacturing and adequate chem-ical stability during storage an ultrahigh-performance liquidchromatography (UHPLC) method is introduced to separatenumerous chemical impurities of interest for analysis by massspectrometry (MS) The secondary structure of humanhPTH(1-31)NH2 has been previously determined by nuclearmagnetic resonance (NMR) spectroscopy13 here the secon-dary structure of recombinant rPTH(1-31)NH2 API is analyzed both directly in the solid amorphous state within the enteric-coated sucrose sphere formulation and after dissolution of thespheres This is achieved using a combination of methodsincluding solution-state NMR solid-state NMR infrared (IR)spectroscopy and electronic circular dichroism (ECD) Thegoal of the solid-state analyses presented in this work is 3-fold1047297rst to verify that the drug is an amorphous solid second toprovide some indication of secondary structure in the solid
state and third to show if any changes in this structure or tothe amorphous state occur upon formulation into the drugproduct Finally the integrity of the polymeric enteric coatingof the sphere is addressed using Raman microscopic mappingand 1047298uorescence imaging allowing for assessment of the layerthickness and coverage as well as examination of the interfaces between rPTH(1-31)NH2 API the enteric coating and thesucrose substrate
EXPERIMENTAL METHODS
Preparation The API used in this study was supplied by Unigene Laboratories (Fair1047297eld NJ) Brie1047298 y the API is pre-pared via the following process The glycine-extended precursorpeptide is manufactured via a bacterial fermentation process by using a genetically engineered Escherichia coli strain derivedfrom BL21 known as BLM6 The E coli strain has beenmodi1047297ed to aid in the secretion of the glycine-extended pre-cursor peptide using a direct expression technology This tech-nology uses an expression vector containing two copies of thegene coding for the peptide with a signal sequence targetingthe peptide for secretion along with genes coding for chaperoneproteins The chaperone proteins bind noncovalently to therecombinant peptide and induce its direct secretion into theculture medium This precursor peptide is then harvested andpuri1047297ed from the medium using cation exchange and reversedphase chromatography steps Amidation of the glycine-extendedprecursor peptide occurs by the action of α -amidating enzyme(PAM peptidylglycine α -amidating monooxygenase) the PAM
enzyme is manufactured in a Chinese hamster ovary cell line Amidation of the precursor peptide results in rPTH(1-31)NH2During puri1047297cation by cation-exchange and reversed-phase LCthe peptide is converted to a partial acetate salt and lyophilized toprovide the API
After preparation rPTH(1-31)NH2 API is formulated intothe drug product Excipients are 1047297rst added to the API includ-ing an organic acid (citric acid) to cause a transient localreduction of intestinal pH such that gut proteases are inacti- vated and a natural surfactant (L-lauroyl carnitine) to facili-tate peptide transport across mucous and cell membrane barriers Sucrose spheres with an initial diameter of approxi-mately 09 mm were coated 1047297rst with API and then with
Eudragit L30-D55 a polymethylmethacrylate-based entericcoating polymer (BASF Inc Ludwigshafen Germany) usinga stepwise manufacturing process A suspension of rPTH-(1-31)NH2 and Opadry clear hydroxypropylmethylcellulose(HPMC) coating mixture (Colorcon Inc West Point PA) ismade by dissolving rPTH(1-31)NH2 API and the excipientsin water followed by dispersing Opadry powder under slow mixing conditions This API-containing suspension is thenspray-layered onto the sucrose spheres contained in a 1047298uid-bedcoater The enteric coating layer is then added to the spheres by spraying a 1047297ltered Eudragit L30-D55 system onto the API-layered sucrose spheres contained in a 1047298uid-bed coater anddrying the spheres This enteric coating system is prepared by adding talc to the water followed by triethyl citrate andEudragit L30-D55 under constant stirring
Chromatography and Mass Spectrometry UHPLCminus
MS analysis of intact rPTH(1-31)NH2 peptide was performedon an Acquity UPLC system equipped with a diode array UV minus visible detector (Waters Milford MA) UV absorbance was monitored from 190 to 400 nm with a resolution of 12 nmresulting in an acquisition rate of 40 points per second MSanalysis was performed after UV detection using an Orbitrap XL mass spectrometer operating in data-dependent acquisitionmode with 1 MS scan and 2 MSMS scans (Thermo Electron West Palm Beach FL) Both the UV and MS data acquisition was performed using Thermo Xcalibur software (version 207)Electrospray ionization (ESI) was employed at the source andthe following parameters were used the ESI spray voltage wasset to 45 kV the sheath gas 1047298ow rate was 40 (arbitrary units)the auxiliary gas 1047298ow rate was 5 (arbitrary units) the capillary voltage was 124 V the capillary temperature was 230 degC andthe tube lens was 180 V For all experiments the scan range wasfrom m z 250 to 2000
The UHPLC method developed for API and drug productanalysis employed an Acquity BEH300 C18 column (21 mm times
150 mm 17 μm particle size) (Waters Inc Milford MA)
Mobile phase A consisted of 010 vv TFA in water andmobile phase B contained 009 vv TFA in acetonitrile A 1047298ow rate of 02 mLmin was used Gradient elution consistedof an increase in mobile phase B from 20 to 25 for 1 min andthen from 25 B to 35 B over the next 20 min The columntemperature was maintained at 30 degC The column was rinsed with 100 B and a return to the initial condition of 20 B wasperformed in the remaining 30 min run time over which datacontinued to be collected Both API and enteric- and API-coated spheres were dissolved in tris(hydroxymethyl)-aminomethane (Tris) buff er (pH 80) to 4 mgmL concentra-tion Enteric- and API-coated spheres were additionally soni-cated for 1 min until all spheres were dissolved and 1047297lteredthrough Nalgene 045 μm 4 mm syringe 1047297lters (Fisher Scienti1047297c
Pittsburgh PA) Samples were acidi1047297ed with 10 (vv) HClprior to UHPLCminusUV-MS analysis Injection volumes of 1 and10 μL were used for API and drug product samples respectively
Peptide mapping was performed by dissolving the rPTH(1-31)NH2 API in 50 mM TrisHCl 1 mM CaCl2 buff er (pH 81)to obtain a solution concentration of about 25 mgmL Threeseparate portions of this solution were digested with trypsinendoproteinase Lys-C and endoproteinase Glu-C at 37 degC for60 min The reactions were quenched by adding 10 M HClEach digest was then analyzed by reversed-phase HPLC using a20 min gradient method with an Agilent 1100 series HPLC with a single-quadrupole ESI mass spectrometer (Agilent SantaClara CA)
NMR Spectroscopy Solution-state NMR spectra wereobtained using a Bruker DRX700 NMR spectrometer operatingat a 1H frequency of 70013 MHz (Bruker Biospin BillericaMA) A 3 mm Bruker double-resonance probe was used for 1H13C and 15N experiments Samples were dissolved in eitherpure D2O or in 90 H2O10 D2O solutions Water suppres-sion was performed using a modi1047297ed double pulsed 1047297eld
gradient spin echo (DPFGSE) technique that applies the WATERGATE 3-9-19 solvent suppression sequence twice14minus16
These experiments achieved similar results as those applied in aprevious natural-a bundance NMR study of the conformation of hPTH(1-31)NH213 NMR spectra were externally referenced toaqueous dilute 44-dimethyl-4-silapentane-1-sulfonic acid (DSS)
Solid-state NMR spectra were obtained using a Bruker Avance400 spectrometer operating at a 1H frequency of 40013 MHz(Bruker Biospin Billerica MA) Experiments were performedat 273 K using a BCU-05 chiller to minimize frictional heating13C SSNMR spectra were obtained with a 4 mm triple reso-nance magic-angle spinning (MAS) probe tuned to 1H 19Fand 13C frequencies Cross-polarization (CP) transfers wereperformed at power levels of 40minus80 kHz the power level wasramped linearly during the contact time on the 1H channel toenhance CP efficiency17 13C CP spectra were obtained at anMAS rate (νr) of 8 kHz with a 1047297 ve-pulse total sideband suppres-sion (CP-TOSS) sequence18 1H heteronuclear decoupling wasperformed at an rf power of 105 kHz using the SPINAL-64pulse sequence19 1Hminus
13C heteronuclear correlation (HET-COR) spectra were performed with νr set to 125 kHz usingfrequency-switched LeeminusGoldburg decoupling20 13C spectra were referenced to tetramethylsilane (TMS) using an externalreference sample of hexamethylbenzene21 1H spectra wereobtained using a 25 mm triple resonance MAS probe withνr set to 35 kHz using direct polarization (single pulse)experiments and were internally referenced to TMS
Infrared Spectroscopy Transmission IR spectra inaqueous solution were recorded using a Vertex 70 Fouriertransform-IR (FT-IR) spectrometer (Bruker Optics BillericaMA) equipped with an Aquaspec transmission cell with a 1047297 xed7 μm path length and a 5 mm aperture (Micro-BiolyticsFreiburg Germany) The cell was temperature-controlledusing a Haake DC30K20 recirculated water bath (Thermo-Fisher Scienti1047297c Karlsruhe Germany) For each transmissionIR spectrum 512 sample and background (water) scans wereacquired with 4 cmminus1 resolution A mercury cadmium telluride(MCT) detector was used Samples were prepared at aconcentration of 10 mgmL in H2O Spectral subtraction wasperformed for each data set using background spectra of pureH2O collected in an identical manner and at the sametemperature Multivariate partial least-squares (PLS) analysisof the 1047297nal IR spectra was performed to analyze a secondary
structure using the OPUS QUANT package with a proteinlibrary (Bruker Optics Billerica MA)
Attenuated total re1047298ectance (ATR) IR spectra of samplesused in this work were obtained using a Spectrum One FT-IR spectrometer equipped with a deuterated triglycine sulfate(DTGS) detector (Perkin-Elmer Waltham MA) A single-bounce ATR accessory with a diamond window was used to acquire thespectra A resolution of 2 cmminus1 was used and a total of 16 scans were acquired for each spectrum of powder Up to 256 scans wereacquired for coated spheres
Electronic Circular Dichroism ECD spectra wererecorded using a Jasco J-715 spectrometer equipped with aPeltier-controlled variable temperature cell (Jasco Easton MD)
A 1 cm quartz cuvette was used for analysis Samples wereprepared in water at a concentration of 003936 mgmL A scanrange of 200minus700 nm was used with a scan rate of 100 nmminand a resolution of 1 nm Each spectrum was the result of 8coadded accumulations Spectra of water were collected underidentical conditions and used as a blank for spectral subtractionto account for any birefringence from the cell or cuvette Spectra were analyzed using the SOMCD online software package asdiscussed below22
Raman and Fluorescence Microscopy and RamanSpectroscopy Dispersive Raman microscopy and mapping were performed using a Horiba Jobin Yvon LabRAM Aramisspectrometer (Horiba Jobin Yvon Edison NJ) An OlympusBX41 confocal optical microscope is integrated with this system with an Olympus U-LH 100 W Hg lamp and U-RFL-T powersource for 1047298uorescence excitation and bright1047297eld illumination(Olympus America Inc Chester Valley PA) Objectives in therange of 4times to 50times were used with 5minus25 neutral density 1047297ltersFluorescence excitation in the range of 330minus385 nm was used with emission 1047297ltered using a 425 nm cutoff Optical and1047298uorescence images were captured using an In1047297nity 3 cooledcharge-coupled device camera (Lumenera Corp Ottawa
Ontario Canada) For Raman microscopy experiments theconfocal hole was set to 300minus400 μm the laser wavelength was 785 nm detector exposure times were 1minus2 s and thegrating was set to 600minus950 groovesmm Raman mappingexperiments recorded 32 to 128 dispersive scans per map pointand generally required several hours to a day to completePrincipal components analysis (PCA) of Raman mapping data was performed using Solo version 60 with multivariate imageanalysis (eigenvector Research Inc Wenatchee WA)
Additional FT-Raman experiments were performed using aNicolet FT-Raman 960 spectrometer equipped with InGaAsand Ge detectors (ThermoFisher Scienti1047297c Madison WI) Thesample was analyzed using a horizontal video-controlled stage
with a 50 μm spot size The spectra are the result of 128coadded scans collected at 4 cmminus1 resolution A 1064 μm laser was used with a power setting of 06 W
RESULTS AND DISCUSSION
Primary Structure of API The amino acid sequence of rPTH(1-31)NH2 API was con1047297rmed using digestion experi-
ments in conjunction with HPLCminusMS The chromatogramsand MS data obtained after digestion are shown in theSupporting Information The peptide contains 1047297 ve unique sitescleavable by trypsin (denoted by ldquoardquo) three sites cleavable by Lys-C (denoted by ldquo brdquo) and three sites cleavable by Glu-C(denoted by ldquocrdquo) as shown below
With the assumption of complete digestion these cleavagesites result in four possible peptides and two lysine amino acidsfor the tryptic digest three possible peptides and one lysineamino acid for the Lys-C digest and four possible peptides for
the Glu-C digest The peptide maps obtained from these threedigestions showed most of the expected cleavage sites for thestructure of rPTH(1-31)NH2 (see the Supporting Informa-tion) The masses expected for all the peptides and the peptidesidenti1047297ed by mass assignment are also given in the SupportingInformation for tryptic peptides Lys-C peptides and Glu-Cpeptides Agreement between the predicted and observed masses(lt15 Da) for all the peptides was interpreted as con1047297rmation of the presence of those peptides Some of the other minor peaks inthe peptide maps were also identi1047297ed by their respectivemolecular masses and are also listed The masses of peaks fromthe respective peptide maps are in agreement with the sequenceFor identi1047297cation testing of batches of API it is not necessary to
Figure 1 UHPLC separation of rPTH(1-31)NH2 API (bottom trace black color) and enteric- and API-coated sucrose spheres (top trace browncolor) obtained using the UHPLC method described in the text Impurities and degradation products of interest are denoted 1minus12 and 14minus24 whilethe API (rPTH(1-31)NH2) peak is denoted 13 The structural analysis of these peaks by MS is summarized in Table 1
perform the digestion and peptide mapping analysis Solution-state NMR is a suitable substitute once the sequence is knownand is also highly sensitive to secondary structure7
UHPLCminusUV-MS Separation and Impurity and Degra-dation Product Characterization Eff ective separationmethods are necessary for the characterization of the impuritiesin both the API and drug product Because of the structuralsimilarity between many peptides and their impurities anddegradation products and because of the number of ionizablegroups and range of p K a values in each of these moleculespeptides can present a special challenge for HPLC methoddevelopment UHPLC off ers improved performance that canhelp address these issues which derives from its use of smallparticles (lt2 μm) and pressures of up to 15 000 psi23minus25
UHPLC potentially provides higher resolution speed andhigher sensitivity than HPLC23minus25 Because of its advantagesUHPLC has been increasingly applied to peptide separationchallenges26minus28 The use of UHPLC also allows for signi1047297cantly reduced solvent consumption which can enhance thesustainability of pharmaceutical analysis methods because of the need to perform these methods routinely throughout thedevelopment and commercial production of a product29
In the present work a reversed-phase gradient elutionUHPLC method was developed to address challenges inpeak resolution The method was developed using low pH(009 vv TFA) and was optimized based on the impuritiesand degradation products observed and identi1047297ed using MSThe UHPLC chromatograms for representative samples of APIand enteric- and API-coated spheres are shown in Figure 1 andthe MS identi1047297cation results are listed in Table 1 The oxidationproducts (peaks 1 2 and 4) were due to oxidation at Met-8 orMet-18 (or possibly at Trp-23) and tentative assignments have been made based on peptide mapping analysis of tryptic digestfractions A small molecule (m z 2761198) was observed witha retention time of 81 min (peak 3) and was not identi1047297edPeak 5 was observed to be a mass change of minus5323 Da and
identi1047297ed as a cleavage at Ile-5 forming pyroglutamic acidPeaks 6 and 7 were resolved and identi1047297ed as peptide cleavagefragments as 4-31 cleavage after Ser-3 (minus2731 Da) and 3-31cleavage after Val-2 (minus1861 Da) respectively In the enteric-and API-coated sucrose spheres two adducts that likely resultfrom degradation reactions involving rPTH(1-31)NH2 andsucrose were observed as diglycated (peak 11 +3240 Da) andmonoglycated API (peak 12 +1620 Da) These adducts may be related to the degree of contact between the API and thesucrose as observed by the 1047298uorescence microscopy experi-ments discussed below Five acetylation adducts were observedand are listed in Table 1 indicating exposure of rPTH(1-31)NH2 to acetic acid during the lyophilization process andsubsequent storage and stability resulted in small levels of the
modi1047297cation to the Lys residues in the sequence One impurity was partially resolved from an acetylation adduct (peak 18+260 Da) and remains unidenti1047297ed Asn and Gln deamidationproducts were resolved and identi1047297ed as peaks 10 15 16 and17 Hydrolysis of an amide bond of Asn or Gln would beexpected at higher pH and could occur more readily when theproduct is exposed to the conditions necessary to dissolve theenteric coating Several trace peaks observed by their UV absorbance signals were resolved by the UHPLC separation butcould not be positively identi1047297ed by MS These include peaks 89 14 20 and 22 with mass shifts of +4 +486 +12 +28 andminus15 Da respectively and may represent cleavages of thepeptide combined with complex interactions with sucrose
The high performance of the UHPLC method was a criticalaid to the impurity and degradation product identi1047297cationprocess as seen in Figure 1 because it supplied sufficientresolution to separate many of the peaks of interest that wouldhave coeluted under conventional HPLC conditions Thesensitivity of UHPLC was particularly useful for analysis of theenteric and drug-coated spheres because it allows for smallerinjection volumes which in turn allows for better tolerance tothe injection of the basic sample diluent needed to dissolve
the enteric coating on the spheres for practical applications Although TFA was used in the mobile phase instead of alternatives such as formic acid any loss in ionization efficiency caused by ion suppression eff ects was accepted because of countervailing improvements in the separation that mostlikely resulted from the weak ion-pairing properties of TFA As demonstrated by the number of trace peaks and resolvedand identi1047297ed impurities the UHPLCminusUV-MS results pro- vide insight into the product stabil ity and interactions withsucrose which is essential for successful drug formulationdevelopment
Analysis of API Secondary Structure in Solution andin the Solid State A critical analytical challenge faced in the
Table 1 List of Impurities and Degradation ProductsIdenti1047297ed Using UHPLCminus MS in rPTH(1-31)NH2 API andEnteric- and API-Coated Sucrose Spheresa
peak no
Rt(min)
mass obsd(Da)
mass calcd(Da)
mass diff (ppm) assignment
1 78 37319685 3731 9715 minus1 oxidation at Met-8b
(+160 Da)
2 79 37319637 3731 9715 minus2 oxidation at Met-8b
(+160 Da)
3 81 2761198 unknown
4 93 37319646 3731 9715 minus2 oxidation at Met-18b
aObserved molecular masses and structure assignments are given forpeaks shown in Figure 1 Peptide peaks were observed in the 3+charge state b Assignment of oxidation sites were based on trypticpeptide mapping analysis of collected fractions
present work is the analysis of the secondary structure of the
rPTH(1-31)NH2 API and subsequently in the 1047297nal enteric- and API-coated spheres as this can aff ect properties such aschemical stability and in vivo exposure The secondary structureof hPTH(1-31)NH2 has been previously determined usingNMR and was reported to adopt a structure consisting of twohelical portions joined by an intervening 1047298exible turn region where the N-terminal helix is shorter than that of the C-terminal helix13 A number of analogues of rPTH(1-31)NH2 such as the 34-residue form of parathyroid hormone have also been found to adopt similar conformations in studies usingNMR and ECD30minus33 To assess the secondary structure of rPTH(1-31)NH2 transmission IR spectroscopy in aqueous solu-tion was performed and yielded the results shown in Figure 2a
Multivariate analysis of the IR spectrum at 20 degC in Figure 2a
against a protein-based library yielded 12 α -helix and 8 β -sheet with the remainder random In the original NMR study approxi-mately 75 of the residues were present in α -helical regions Theresults of the IR analysis are aff ected by the presence of the acetatesignal in the same region as the amide I band and by the un-availability of a library designed for secondary structure analysis of small peptides of this type Upon heating to 50 degC the maximumtemperature possible with the IR cell the spectrum showed theeff ects seen in Figure 2a Multivariate analysis of this data yielded1 α -helix and 0 β -sheet although not quantitative this result isindicative of a loss of secondary structure After cooling to 20 degCthe IR spectrum returned to its original appearance indicating thatthe conformational change is reversible
Figure 2 (a) Transmission IR spectra of a 10 mgmL solution of rPTH(1-31)NH2 API at 20 and 50 degC obtained in H2O solution after backgroundsubtraction (b) ECD spectra of a 0039 mgmL solution of rPTH(1-31)NH 2 API in H2O recorded between 20 and 80 degC The changes in both IR and ECD spectra were fully reversible upon cooling
The secondary structure can also be examined using theECD spectra in Figure 2 b The spectra obtained agree qualita-tively with previousl y reported spectra of hPTH(1-31)NH2 andrelated peptides30minus33 The feature at 204 nm is more pro-nounced than in other reported work which suggests more
random character This may be caused by the presence of acetate in the samples of interest here The SOMCD program(based on the k2D algorithm) was used to estimate thesecondar y structure at 20 degC for comparison with the IR results22 The results indicated 14 α -helix 33 β -sheet 12turn and 41 random character The low level of α -helicity isconsistent with the IR results The rPTH(1-31)NH2 API usedhere thus shows less α -helicity than the material used in theoriginal NMR study and in previously reported ECD studies Although helicity could be improved by adding tri1047298uoroethanol(TFE) to the solution as in prior work on hPTH(1-31)NH2
31
the purpose of the present study was to characterize actualrecombinant API Like the IR results quantitative analysis by
ECD is of limited reliability because of the use of a modeldeveloped for proteins and the sensitivity of ECD to tertiary structural eff ects in those systems The overall conformationalchange occurring as temperature is increased can be evaluatedfrom the changes seen in the ECD spectra in Figure 2 b Thefeature at 222 nm is reduced (signifying a loss of both α -helix and β -sheet character) while the feature at about 205 nm alsodecreases (signifying a loss of α -helix character) both of whichare consistent with a loss of helicity Upon cooling to 20 degC theECD spectra returned to their initial form This is consistent with the IR analysis and con1047297rms a fully reversible loss of secondary structure with increasing temperature which ishelpful in interpretation of the NMR results that follow and
ultimately to show whether the API in the coated spheres hasretained its secondary structure
Further information about the structure was gained by solution-state NMR studies The 1H spectrum of rPTH(1-31)NH2 has been previously assigned using a series of 2D 1H
and 13C experiments at high 1047297eld performed on a natural-abundance sample13 The deshielded region containing aro-matic and amide proton environments is depicted in Figure 3The changes in hydrogen bonding upon the loss of secondary structure at higher temperatures were not studied previously 13
but are clearly seen in the 1H WATERGATE DPFGSE NMR spectra in H2OD2O solution in Figure 3 The chemicalshift range compresses as temperature increases indicatingan increase in randomization Examination of the 1H NMR spectra over a wide range of concentrations of rPTH(1-31)-NH2 including the sample used for the acquisi tion of ECD spectra shows no evidence of potential aggregationor other intermolecular interactions (see the SupportingInformation)
The secondary structure of rPTH(1-31)NH2 in the solid-state has not been previously examined in the literature Ingeneral analysis of the secondary structure in an amorphouspeptide is a challenging task The ECD and IR methods used tocharacterize peptides and proteins in solution have not beenparametrized based on solid-state reference materials andcannot be readily applied to a solid peptide Neverthelesseff orts to characterize and control the solid form of an API arenecessary for oral dosage f orms because of potential eff ects onstability and exposure34 First the solid rPTH(1-31)NH2
peptide used here was determined to be amorphous by X-ray powder diff raction (XRPD) analysis (see the SupportingInformation) No evidence of crystalline peptide or acetate
Figure 3 1H WATERGATE DPFGSE NMR spectra rPTH(1-31)NH2 API in H2OD2O solution at a concentration of 25 mgmL showing anexpansion of the amidearomatic proton region and the spectral changes observed over a temperature range of 293 (20 degC) to 353 K (80 degC)
was observed in the XRPD patterns of lyophilized rPTH(1-31)NH2 either initially or after storage at diff erent temperature andhumidity conditions The 13C CP-TOSS spectra of multiple batches of rPTH(1-31)NH2 also showed broad peaks consistent with amorphous material and showed no detectable batch-to- batch variation (see the Supporting Information)
To investigate the secondary structure of the peptide in thesolid state a 2D SSNMR method capable of detecting short-range interactions between speci1047297c functional groups inamorphous materials can be used Isotopic labeling is normally needed to elucidate detailed structural information how-ever this approach is not amenable to use with API batches
Figure 4 (a) 1Hminus13C CP-HETCOR spectrum of rPTH(1-31)NH2 API obtained using a 400 μs contact time at νr = 125 kHz The 13C CP-TOSS
spectrum (νr = 8 kHz) is plotted along the F 2 axis (top) and the 1H MAS spectrum (νr = 35 kHz) is plotted along the F 1 axis (left) (b) A view of one of the ensemble of hPTH(1-31)NH2 structures determined by solution-state NMR (see ref 13) showing interactions assigned the HETCOR correlations (see text)
produced at large scale as in the present case A sample of API
was examined using a 2D 1
Hminus
13
C CP-HETCOR experimentand interpreted in relation to the reported ensemble of 20solution-state structures for hPTH(1-31)NH2 to determine if any features of these secondary structures can be observed atleast to some e xtent in rPTH(1-31)NH2 API in the amorphoussolid state1335 The 2D 1Hminus
13C CP-HETCOR experimentshows interactions between 1H and 13C nuclei that are close inspace typically within 3 Aring20 Although the resolution is limited by the amorphous nature of the sample the only residues inrPTH(1-31)NH2 that contain aromatic functional groups areHis9 His14 and Trp23 leading to simpli1047297ed 13C spectral inter-pretation and the possibil ity of detection of 1Hminus
13Ccorrelations between aliphatic and aromatic functional groupsof interest Trp23 is particularly useful as it sits in the inter-
helical ldquopocketrdquo in the ensemble of structures and off ers accessto longer-range interactions indicative of secondary structure
His9 and His are less useful as they are located on the outsideof the structure
The results of a 2D 1Hminus13C CP-HETCOR experiment
obtained with a 400 μs contact time suitable for detection of interactions within 3 Aring are shown in Figure 4a In the amor-phous sample of rPTH(1-31)NH2 the 2D 1Hminus
13C CP-HETCOR experiment detects correlations between aromatic carbons arisingfrom a broad 13C peak centered at 120 ppm and aliphaticprotons with a 1H chemical shift of about 0minus2 ppm The broad13C resonance at 120 ppm can be assigned to either C8 C9 orC10 in tryptophan based on known chemical shift trends (using
the carbon numbering scheme shown in Figure 4 b)36 The
assignment of the resonance at sim120 ppm to C8 C9 and C10positions was further con1047297rmed by a dipolar dephasingexperiment (see the Supporting Information) which showsthat all positions in the vicinity of 120 ppm are protonatedcarbons in agreement with direct correlations observed in the2D 1Hminus
13C CP-HETCOR spectrum in Figure 4a The aliphaticproton resonances involved in this correlation can be partially assigned to individual amino acids via the interactionshighlighted in Figure 4 b which depicts 1 of the 20 structuresfrom the solution-state NMR study13 35 First many of thestructures show an interaction between the methyl protons onLeu24 and the aforementioned aromatic carbons (C8 to C10)on Trp23 the protonminuscarbon distance ranges from 28 to 68 Aring in the ensemble of structures with 7 of the 20 structures showing
a distance of less than 3 Aring35
A more interesting interaction between Trp23 and Leu11 would be of more importance for thesecondary structure of rPTH(1-31)NH2 and may also contributesigni1047297cantly to this 2D correlation although it may be overlapped with the interaction between Leu24 and Trp23 The interaction between Trp23 and Leu11 is an interhelical contact detected vianuclear Overhauser eff ects in the solution-state NMR structurereported for rPTH(1-31)NH2
13 However this interaction is likely less of a contributor to the 2D correlation than the Trp23minusLeu24interaction although protonminuscarbon distances range from 28 to64 Aring only 3 of the 20 structures have a distance of less than 3 Aring
The broad correlation with a 13C shift of 120 ppm also has ahighly shielded 1H component trending toward 0 ppm this is
Figure 5 FT-Raman spectra of solid rPTH(1-31)NH2 API (top) the enteric coating used in the formulation after drying (middle) and an uncoatedraw sucrose sphere used in the formulation (bottom) obtained using a microstage with a 1064 μm laser excitation frequency and a 50 μm beam spotsize The vertical axis is in arbitrary units The Raman scattering from sucrose was strongest followed by the enteric coating with the API yieldingthe weakest scattering
suggestive of shielding from aromatic π -stacking interactions Inthe ensemble of structures close contacts are also observed
between Trp23 and protons attached to C2 and C3 on Lys27as shown in Figure 4 b These protons already have highly shielded chemical shifts and their position above the aromaticring of Trp23 would provide an additional shielding eff ectconsistent with the CP-HETCOR correlation The protonminuscarbon interaction between C2 and the centroid of the six-membered ring on Trp23 ranges from 27 to 39 Aring in theensemble of solution-state NMR structures with 6 structuresshowing distances below 3 Aring Likewise the protonminuscarboninteraction between C3 and the centroid of the six-memberedring on Trp23 ranges from 27 to 36 Aring in the ensembleof solution-state NMR structures with 7 structures show-ing distances below 3 Aring An interaction between Trp23 and
Lys27 explains both the presence of the correlation in theCP-HETCOR spectrum and its highly shielded 1H shift
Figure 6 (a) Dispersive Raman spectra of an enteric- and API-coatedsphere obtained with a 785 nm laser and with the confocal microscopeset to diff erent z-axis points ( z = 0 μm represents the point of opticalfocus) using a 20times objective Arrowheads represent bands of interestfor each component (see text) (b) Map of a 200 μm-diameter circularregion on the outside of an enteric- and API-coated spheresuperimposed on a bright1047297eld optical microscopy image (with z =minus50 μm) Greater intensity of green represents greater spectral area inthe range of 1745minus1700 cmminus1 which originates from the entericcoating
Figure 7 (a) Optical image of an area of a cross-sectioned enteric- and API-coated sphere obtained with a 10times objective The brighter upper leftregion is due to mounting putty (b) Results from a 64 times 64 squareRaman map with a 785 nm laser superimposed on the optical micrographgreater intensity of bluepurple represents greater spectral area in the1745minus1700 cmminus1 region (enteric coating) green represents greaterspectral area in the range of 1670minus1635 cmminus1 region (API) and redrepresents greater spectral area in the 855minus840 cmminus1 region (sucrose) (c)PCA of the Raman 64 times 64 map showing three major PCs identi1047297ed
which correspond to the enteric coating API and sucrose
The observation of this interaction provides evidence that Trp23remains in the central ldquopocketrdquo and thus some aspects of thesecondary structure of rPTH(1-31)NH2 are maintained in theamorphous solid
Other correlations were observed in the 2D 1Hminus13C CP-
HETCOR spectrum in Figure 4a including a correlation tenta-tively assigned to more deshielded Trp23 aromatic carbonsinteracting with protons on Gly12 at sim4 ppm However thiscorrelation may also arise from interactions between the
aromatic carbons on His9 or His14 and the proton attached toCα of the same residue The other correlations observed in the2D 1Hminus
13C CP-HETCOR spectrum were not found to beuseful for assessing the secondary structure of the API in thesolid state
Raman and Fluorescence Microscopy of Drug-CoatedSpheres With a detailed assessment of the API in handseveral analytical challenges related to the coated sucrosespheres can be addressed First methods were needed to verify the integrity of the enteric coating which is a critical factorin the ultimate performance of the dosage form because of the propensity of rPTH(1-31)NH2 toward gastric chemicaldegradation Product integrity in an acidic media (01 N HCl)
for 2 h was evaluated using standard dissolution or dis-integration tests which were performed as an in-processcontrol (IPC) during the manufacturing and as an end-productassessment However this is a bulk enteric coat performancetest and does not provide details of enteric coat distributioncoat thickness and 1047297lm coat quality Analytical methods areneeded to characterize such formulations to determine entericcoating distribution and thickness as well as examine the APIlayer and its penetration into the sucrose substrate Raman
microscopy and mapping often combined with multivariateanalysis is an excellent tool for performing this task formicrosphere-based drug products37 as was recently demon-strated for sim300 μm diameter microspheres fabricated fromthree polymers poly(DL-lactide-co-glycolide) poly(L-lactide)(PLLA) and poly(caprolactone)38 In the present work Ramanmicroscopy is combined with optical and 1047298uorescence micros-copy using a single instrument to provide chemical images of intact and cross-sectioned microspheres containing rPTH-(1-31)NH2 Raman spectroscopy provides good speci1047297city foreach of the three major components of the drug product asshown in the FT-Raman spectra in Figure 5 These spectra were obtained from bulk samples of each component using a
Figure 8 Fluorescence microscopy images of a cross-sectioned enteric- and API-coated sucrose sphere The images were obtained using a 10 times
objective The images at the top are composite images constructed from 36 individual images while the images at the bottom are single images Thehighly 1047298uorescent rPTH(1-31)NH2 API in the interior layer can be seen in contrast to the less 1047298uorescent enteric coating and sucrose sphere
1064 μm laser wavelength and exhibit characteristic bands thatcan be of use in spatially resolved studies using Raman micros-copy In particular the amide I band is observed in the 1670minus1635 cmminus1 region for rPTH(1-31)NH2 methacrylate carbonyl bands are observed in the 1745minus1700 cmminus1 region for theEudragit L30-D55 enteric coating and a number of strong bands
are observed for the sucrose sphere including a particularly strong band in the 855minus840 cmminus1 region
Confocal Raman microscopy was 1047297rst used to perform depthpro1047297ling of an enteric- and API-coated to yield the dispersiveRaman spectra shown in Figure 6a Use of a 785 nm laser wavelength was required to avoid strong 1047298uorescence Startingfrom the outside of the sphere a band at 1730 cmminus1 is observedthat is diagnostic for the enteric coating polymer (green arrow)The polymer also exhibits a band at 1650 cmminus1 overlapping theregion in which the amide signals from rPTH(1-31)NH 2 occur As the confocal stage is focused into the sphere the amidesignals of rPTH(1-31)NH2 appear (red arrow) As the focalpoint travels further into the sample the amide signals diminish
as signals from sucrose gain in strength (blue arrows) A circular Raman map of the enteric coating was made using5 μm steps as shown in Figure 6 b The map has a diameter of 200 μm and was performed with z = minus50 μm based on the resultsin Figure 6a The map was limited to a small diameter to avoiddeviations from the focal point caused by changes in sample
elevation The color scale used in Figure 6 b was chosen tohighlight subtle diff erences in band intensity (within 10) sothat areas without color still contain signi1047297cant enteric coat-ing bands The results in Figure 6 b show the relatively evencoverage of the surface by the enteric coating only a few areasare observed with reduced intensity which could be the resultof reduced Raman scattering across diff ering surface morphol-ogy or potentially from minor reductions in enteric coatingthickness
Cross-sectioned enteric- and API-coated spheres were alsomapped using Raman microscopy to determine the distributionof rPTH(1-31)NH2 and the enteric coating Raman microscopy is capable of spatially assessing the coverage of the enteric
Figure 9 13C CP-TOSS SSNMR spectra of amorphous rPTH(1-31)NH2 API dried enteric coating enteric- and API-coated sucrose spheres andsucrose spheres coated with API only In the top spectrum the enteric- and API-coated sucrose spheres show small peaks (denoted witharrowheads) indicative of the amorphous rPTH(1-31)NH2 present in the formulation All spectra were obtained with ν r set to 8 kHz and 273 K
coating and is frequently used to probe the closely relatedquestion of the interaction of a thin (50minus100 μm) 1047297 lm coatingand solid compressed tablet cores39 A bright1047297eld opticalmicrograph of a portion of an enteric- and API-coated sucrosesphere obtained with a 20times objective is shown in Figure 7aThe transition from the largely crystalline sucrose sphere to theamorphous coating is visible but no evidence of the interface between rPTH(1-31)NH
2 and the enteric coating can be seen
with this method Figure 7 b shows the results of Ramanmapping using a square 60 times 60 array of points and covering a250 times 250 μm area with false-color band area resultssuperimposed over the optical micrograph The thickness andcoverage of the enteric coating can be examined in this mannerfor individual spheres as preparation conditions are varied PCA of the Raman spectral map with the results shown in Figure 7crevealed similar results to the band intensity analysis butprovided for better speci1047297city via the principal components(PCs) and did not identify any unexpected components A fourth PC assigned to a polymeric binder used within thesucrose spheres was also detected by PCA within the sucroseregion in several cross-sectioned spheres but is not seen in theregion chosen for Figure 7
Although Raman mapping is highly speci1047297c the use of the785 nm laser (required to avoid 1047298uorescence from the API)reduces sensitivity and renders the technique too slow for use when many spheres must be analyzed to adjust critical processparameters The use of 1047298uorescence microscopy allows forfurther detail regarding the interface between the API andpolymer and the API and sucrose sphere to be gained frommultiple rapid experiments with higher spatial resolution This isimportant because the interface between the polymer drug andsucrose core can critically impact performance For example inthe formulation of interest here the sucrose adduct of rPTH(1-31)NH2 observed by UHPLC in batches of enteric- and API-coated spheres may be related to the degree of interaction between sucrose and the API In Figure 8 1047298uorescence images
of two typical spheres are shown after cross-sectioning Thecoating layer and the sucrose core can be easily seen as the APIhas much stronger 1047298uorescence under these excitationconditions Raman mapping as previously shown in Figure 7 helps con1047297rm that the 1047298uorescence eff ects are assignedcorrectly to a given spatial region Minimal penetration of the API into the sucrose is observed at the magni1047297cation used inFigure 8 Fluorescence images obtained with a 50times objectiveshow some degree of penetration on the order of a few micrometers between the API and both the polymer andthe sucrose sphere (see the Supporting Information) Thisinformation is useful in process development for example thedrug layering process conditions can be varied to limit APIpenetration into the sucrose sphere and limit formation of the
aforementioned sucrose adduct degradation product Howeverthe limited degree of penetration of API into the sucrose sphereobserved in Figure 8 and in other data obtained on thesesamples is a desirable outcome The combination of confocalRaman microscopy and 1047298uorescence microscopy thus off ersdetailed understanding of the microstructure of this type of product which is highly useful to help understand the results of bulk physical and dissolution testing In particular 1047298uorescencemicroscopy off ers a fast method to assess coating and API layerthickness during process development
Analysis of API Form and Secondary Structure withinDrug-Coated Spheres As with the rPTH(1-31)NH2 APIthe solid-state form of the peptide present in the enteric- and
API-coated sucrose spheres is particularly crucial 13C SSNMR experiments were used to show that the API remains in theamorphous state in enteric- and API-coated spheres XRPD isunsuitable for this analysis because of the presence of crystallinesucrose and the lack of sensitivity and speci1047297city of thistechnique for amorphous substances Figure 9 shows the 13CSSNMR spectra obtained using the CP-TOSS sequence for bulk spheres coated with API alone and with API and theenteric coating polymer as compared to other components of the formulation The peptide is easily detected in the spherescoated with Eudragit L30-D55 as evidenced by resonancesin the 20minus70 ppm region Although overlap is signi1047297cant the
Figure 10 (a) ATR IR spectra of rPTH(1-31)NH2 API (purplespectrum) formulation components and the coated sphere for-mulation after the API coating step (green spectrum) andsubsequently after the enteric coating step (red spectrum) Changesin the amide bands particularly the amide II band can be seen uponformulation prior to enteric coating (comparing the purple and greenspectra) (b) Raman spectra for API and the API layer in a cross-sectioned enteric-coated sphere obtained via microscopy with a785 nm laser and a 50times objective
spectra show no evidence of recrystallization or a form changein either the spheres coated with API only or with the 1047297nalenteric-coated spheres Quantitative analysis of drug level in theformulation if desired is also possible using the 13C SSNMR data and could be a useful method for process development but was not pursued in the present study
The diff erence in secondary structure between the
amorphous API and the spray-coated spheres can be assessedin a qualitative manner by comparison of the ATR IR spectraobtained from the API and from the surface of spheres coatedonly with API Like transmission IR ATR IR is capableof measuring protein and peptide secondary structure in thesolution phase40 41 However it has not been extensively explored for peptides in solid phases and here is used only as aqualitative measure of similarity To perform the analysisindividual API-coated spheres were pressed against thediamond ATR window with sufficient force to make contact but without using enough force to cause them to break apartPrior to analysis the spheres were extensively dried under vacuum to remove water which overlaps with the frequency of the amide I band and causes it to have a greater apparent
intensity42
The number of scans was increased to make up forthe limited surface area of the single-sphere samples ATR IR spectra from the drug product are compared to the formulationcomponents in Figure 10a The spectra show subtle diff erencesin the amide I and II bands between the bulk API and the API-coated spheres Extraction of secondary structure from ATR spectra cannot be performed in the same manner as fortransmission IR spectra The subtle spectral diff erences could be caused by secondary structure diff erences but also could becaused by hydration state eff ects or particle size diff erences which are known to aff ect ATR IR spectra and other forms of IR sampling that might be applied to the analysis at hand43 44
As shown in Figure 10a addition of the enteric coating makes it
difficult to observe the API amide bands as the evanescent wave depth of ATR techniques is frequency-dependent but istypically on the order of several micrometers and is less thanthe thickness observed for the enteric-coating layer45
To minimize the impact of water and particle size on theanalysis Raman spectra of the amorphous API and the APIcontained within a cross-sectioned enteric- and API-coated
sphere were compared Particle size eff ects on Raman spectraare generally less signi1047297cant than with ATR IR spectra46 InFigure 10 b spectra obtained with Raman microscopy using a50times objective show a number of diff erences The diff erentfeatures of the Raman spectra for both API and the API layer inenteric- and API-coated spheres were consistently obtainedacross a number of samples analyzed in this work The resultssuggest that a change does occur in the secondary structure of rPTH(1-31)NH2 upon formulation through signi1047297cant inten-sity changes in bands at 1360 and 1080 cmminus1 however morespeci1047297c information about the type of change occurring is notavailable from this analysis
Both ATR IR and Raman spectroscopy suggest changes insecondary structure within the amorphous API layer coated on
the spheres relative to the bulk amorphous API These might becaused by heating and drying operations during the coatingprocesses However upon dissolution the API is likely to revert back to the same conformation To prove this additionalanalysis is needed Of the three techniques examined to thispoint that could potentially be used for secondary structureanalysis of redissolved enteric- and API-coated spheres 1Hsolution-state NMR is the least susceptible to interference fromthe sucrose and Eudragit L30-D55 excipients used in the 1047297naldrug product and thus is likely to be the best suited forcon1047297rming the secondary structure of rPTH(1-31)NH2 upondissolution of the drug The ECD spectrum is deleteriously aff ected by the presence of large quantities of sucrose and the
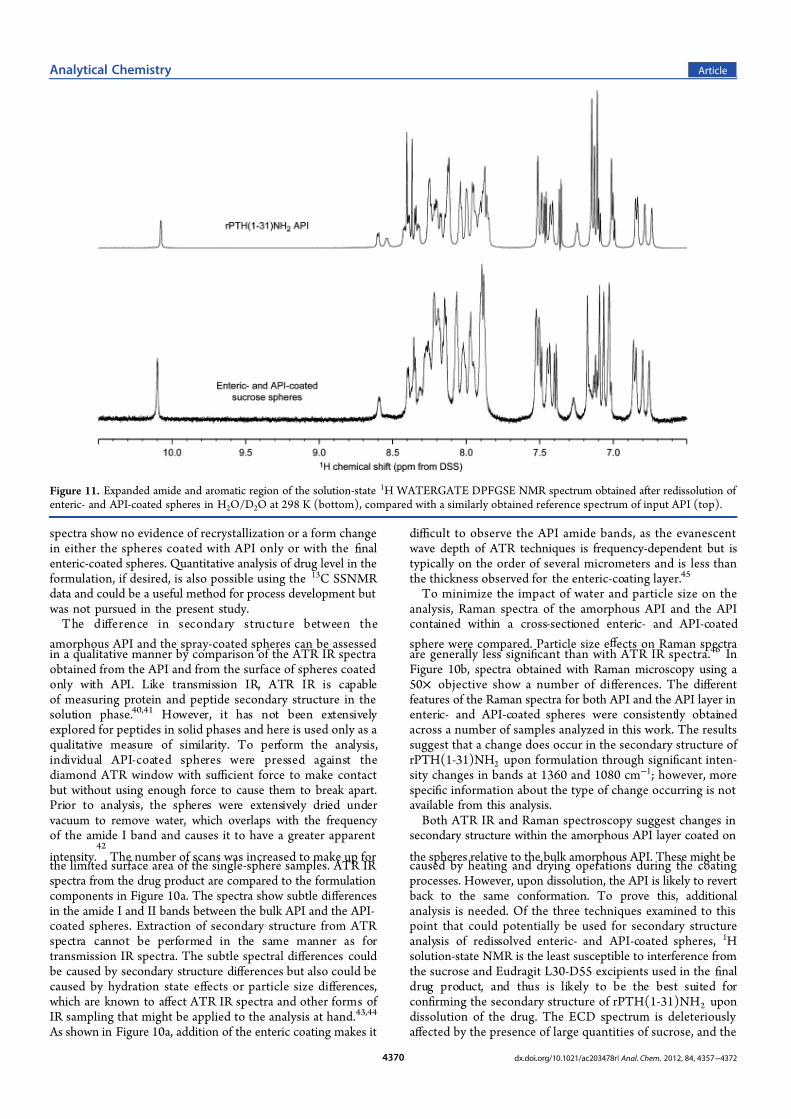
Figure 11 Expanded amide and aromatic region of the solution-state 1H WATERGATE DPFGSE NMR spectrum obtained after redissolution of enteric- and API-coated spheres in H2OD2O at 298 K (bottom) compared with a similarly obtained reference spectrum of input API (top)
IR spectrum is similarly aff ected by vibrations in the region of interest from the Eudragit L30-D55 polymer and acetatecounterion In Figure 11 the expanded deshielded region of the1H WATERGATE DPFGSE spectrum obtained upon redis-solution of enteric- and API-coated spheres is shown incomparison to the API spectrum at 25 degC Subtle changes areobserved but are not signi1047297cant relative to the expected changes
(seen in Figure 3) that would arise if a major change insecondary structure had occurred Instead the subtle spectralchanges are likely caused by matrix eff ects or possibly by non-covalent interactions between rPTH(1-31)NH2 and the polymerandor the sucrose Thus it can be seen that the API reesta- blishes its secondary structure upon dissolution despite changesobserved in the solid state
CONCLUSIONS
The eff ective characterization of peptide pharmaceuticalproducts requires a multidisciplinary approach using comple-mentary analytical methods In this work a 37 kDa PTHpeptide formulated for oral delivery by coating onto sucrosespheres and then coating with an enteric polymer was charac-
terized in order to determine a number of critical performance-related aspects of the product The major analytical challengesfaced during development of such a product were addressed aspart of a holistic analytical characterization eff ort UHPLC wasfound to provide superior results for the separation and iden-ti1047297cation of impurities and degradation products by MS Poten-tial changes in peptide secondary structure are also a criticalconsideration in the development of drug products containing amolecule of this size Orthogonal methods using solution-stateNMR IR and ECD were applied to show that the peptideretained its secondary structure after thermal denaturation insolution In addition SSNMR provided evidence that the APIretained its secondary structure in the amorphous state afterlyophilization Vibrational spectroscopy showed evidence that
the API underwent slight changes in the enteric- and API-coated product that could be caused by a secondary structurediff erence After dissolution of the coated spheres the API wasshown by solution-state NMR to reestablish its secondary structure Finally Raman and 1047298uorescence microscopy wereused to perform chemical imaging of both the outer surface andcross-sectioned areas of the enteric- and API-coated sphereseven though both the peptide and the polymeric coating wereamorphous and contained signi1047297cant overlap in their Ramanspectra Florescence microscopy was found to be a rapid sen-sitive method for examination of cross-sectioned areas to assesscoating thickness
ASSOCIATED CONTENT
S Supporting Information
Additional analytical data obtained for the samples used in thisstudy including peptide mapping XPRD and optical and1047298uorescence images This material is available free of charge viathe Internet at httppubsacsorg
AUTHOR INFORMATION
Corresponding Author
E-mail FredGVogtgskcom
Notes
The authors declare no competing 1047297nancial interest
ACKNOWLEDGMENTS
Dr Eunah Lee (Horiba Jobin Yvon) and Dr Mark Strohmeier(GlaxoSmithKline) are thanked for assistance with multivariateanalysis and Raman microscopy This work is dedicated to thememory of Dr Mingjiang Sun our friend and colleague
REFERENCES
(1) Jenssen H Hamill P Hancock R E W Clin Microbiol Rev2006 19 491minus511
(2) Reddy S T Anantharamaiah G M Navab M Hama SHough G Grijalva V Garber D W Datta G Fogelman A M
Expert Opin Investig Drugs 2006 15 13minus21(3) Kieber-Emmons T Murali R Greene M I Curr Opin
Biotechnol 1997 8 435minus441(4) Pini A Falciani C Bracci L Curr Protein Pept Sci 2008 9
468minus477(5) Yoshioka S Stella V J Stability of peptide and protein
pharmaceuticals In Stability of Drugs and Dosage Forms Kluwer Academic New York 2000 pp 187minus204
(6) Kee K S Jois S D Curr Pharm Des 2003 9 1209minus1224(7) Vergote V Burvenich C Van deWiele C De Spiegeleer B
J Pept Sci 2009 15 697minus710
(8) Synder L R Kirkland J J Glajch J L Practical HPLC Method Development 2nd ed Wiley New York 1997
(9) Balan G Bauman J Bhattacharya S Castrodad M Healy DR Herr M Humphries P Jennings S Kalgutkar A S Kapinos BKhot V Lazarra K Li M Li Y Neagu C Oliver R PiotrowskiD W Price D Qi H Simmons H A Southers J Wei L Zhang
Y Paralkar V M Bioorg Med Chem Lett 2009 19 3328minus3332(10) Widler L Altmann E Beerli R Breitenstein W Bouhelal
R Buhl T Gamse R Gerspacher M Halleux C John M RLehmann H Kalb O Kneissel M Missbach M Mu
ller I RReidemeister S Renaud J Taillardat A Tommasi R Weiler S
Wolf R M Seuwen K J Med Chem 2010 53 2250minus2263(11) Kimmel D B Bozzato R P Kronis K A Coble T Sindrey
D Kwong P Recker R R Endocrinology 1993 132 1577minus1584(12) Gardella T J Luck M D Wilson A K Keutmann H T
Nussbaum S R Potts J T Kronenberg H M J Biol Chem 1995 270 6584minus6588(13) Chen Z Xu P Barbier J R Willick G Ni F Biochemistry
2000 39 12766minus12777(14) Hwang T L Shaka A J J Magn Reson A 1995 112 275minus
279(15) Piotto M Saudek V Sklenar V J Biomol NMR 1992 2
661minus666(16) Braun S Kalinowski H O Berger S 150 and More Basic
NMR Experiments 2nd ed Wiley-VCH New York 1998(17) Metz G Wu X Smith S O J Magn Reson A 1994 110
219minus227(18) Antzutkin O N Prog NMR Spectros 1999 35 203minus266(19) Fung B M Khitrin A K Ermolaev K J Magn Reson 2000
142 97minus101(20) van Rossum B J Fo rster H de Groot H J M J Magn Reson
1997 124 516minus519(21) Earl W L Vanderhart D L J Magn Reson 1982 48 35minus54(22) Unneberg P Merelo J J Chaco n P Mora n F Proteins
Struct Funct Genet 2001 42 460minus470(23) Swartz E J Liq Chromatogr Related Technol 2005 28 1253minus
1263(24) Guillarme D Ruta J Rudaz S Veuthey J-L Anal Bioanal
Chem 2010 397 1069minus1082(25) Nova kova a L Matysova a L Solich P Talanta 2006 68 908minus
918(26) Spoof L Neffling M-R Meriluoto J J Chromatogr B 2009
877 3822minus3830(27) Winter D Pipkorn R Lehmann W D J Sep Sci 2009 32
(28) Luna L G Williams T L Pirkle J L Barr J R Anal Chem2008 80 2688minus2693
(29) Chen S Kord A S J Chromatogr A 2009 1216 6204minus6209(30) Piserchio A Shimizu N Gardella T J Mierke D F
Biochemistry 2002 41 13217minus13223(31) Condon S M Morize I Darnbrough S Burns C J Miller
B E Uhl J Burke K Jariwala N Locke K Krolikowski P HKumar N V Labaudiniere R F J Am Chem Soc 2000 122 3007minus
3014(32) Marx U C Adermann K Bayer P Forssmann W G RoschP Biochem Biophys Res Commun 2000 267 213minus220
(33) Schievano E Mammi S Silvestri L Behar V RosenblattM Chorev M Peggion E Biopolymers 2000 54 429minus447
(34) Lee S L Raw A S Yu L Signi1047297cance of drug substancephysiochemical properties in regulatory quality by design In
Preformulation in Solid Dosage Form Development Drugs and thePharmaceutical Sciences Vol 178 Informa Healthcare USA New York2008 pp 571minus583
(35) The structures of I determined by solution-state NMR in ref 13 were obtained from the Protein Data Bank (httpwwwrcsborgpdbhomehomedo) under identi1047297er 1FVY
(36) Kalinowski H O Berger S Braun S Carbon-13 NMR Spectroscopy Wiley New York 1988 p 229
(37) Van Apeldoorn A A Van Manen H-J Bezemer J M de
Bruijn J D Van Blitterswijk C A Otto C J Am Chem Soc 2004 126 13226minus13227
(38) Widjaja E Lee W L Loo S C J Anal Chem 2010 82 1277minus1282
(39) Ruotsalainen M Heinamaki J Guo H Laitinen N Yliruusi J Eur J Pharm Biopharm 2003 56 381minus388
(40) Smith B M Franzen S Anal Chem 2002 74 4076minus4080(41) Smith B M Oswald L Franzen S Anal Chem 2002 74
3386minus3391(42) Goormaghtigh E Raussens V Ruysschaert J-M Biochim
Biophys Acta 1999 1422 105minus185(43) Yoshidome T Kusumoto H Kuroki O Kamata S Chem
Lett 1998 8 747minus748(44) Otsuka M Matsuda Y J Pharm Sci 1996 85 112minus116(45) Harrick N J Internal Re 1047298 ection Spectroscopy Wiley New York
1967(46) Hu Y Wikstrom H Byrn S R Taylor L S Appl Spectrosc
exhibit some of the complex structural eff ects more typically associated with biopharmaceutical drugs such as secondary structure and complex impurity pro1047297les Furthermore unlikeother biopharmaceuticals such as monoclonal antibodiesrecombinant proteins and recombinant DNA productspeptides are often developed as oral or other nonintravenousdosage forms Peptides thus present several unique challenges
for pharmaceutical analysis First analytical methods are neededfor the characterization of the impurities and degradation prod-ucts in both the API and dosage form Additionally peptide biopharmaceuticals are often manufactured by living organisms which can result in a complex initial analyte mixture with many components Furthermore analytical separation method devel-opment is complicated because peptides can also vary widely intheir hydrophobicity and charge state The polarity of thepeptides is in1047298uenced by their side chains which are classi1047297edas hydrophilic or hydrophobic Hydrophilic side chains can beuncharged polar groups basic side chains can be positively charged and potentially negatively charged acidic side chainscan be present In all three cases there are considerable poten-tial variations to the side chain size shape and chemical prop-erties Peptides can thus be challenging analytes for traditionalreversed-phase separation methods8 Identi1047297cation of chemicalimpurities and analysis of secondary structure can also be acomplex undertaking requiring the use of orthogonal analyticaltechniques Finally the desire to develop specialized oral dosageforms for peptide drugs to prevent excessive degradation leads tonew challenges in characterizing the solid dosage form whileensuring product performance
In the present work an oral parathyroid hormone (PTH)peptide and an enteric-coated oral formulation of this peptideare characterized using several analytical approaches Develop-ment of an oral form of PTH is desired to overcome severalissues with current medicines Currently a recombinant form of PTH consisting of the 1047297rst 34 amino acids known as teri-paratide is approved in the US for the treatment of osteo-porosis but requires subcutaneous injection9minus11 The peptide API studied here is a recom binant fragment of the 84 aminoacid native human PTH1112 consisting of the 1047297rst 31 aminoacids13 The sequence of this peptide is
This single-chain peptide abbreviated rPTH(1-31)NH2 hasa molecular mass of 37184 Da and an isoelectric point of approximately 99 The peptide is not glycosylated does notcontain any disul1047297de bridges and is amidated at its carboxylterminus to prevent cleavage prior to absorption Analysis of an
enteric- and API-coated sucrose sphere formulation developedfor rPTH(1-31)NH2 which allows the peptide to be protectedfrom gastric degradation is the focus of the present work Thisformulation is designed to release the product in the smallintestine as discrete microspheres in an attempt to exposeenough surface area to yield maximum potential permeation of rPTH(1-31)NH2 through the intestinal wall Spray-coating therecombinant peptide onto the sphere provides a scaff old sub-strate to anchor the API An outer coating consisting of anenteric polymer is then added to protect the peptide from gastricdegradation The spheres can be dosed inside an ordinary capsule that ruptures in the stomach Increases in the local pH(typically gt55) as the spheres are dumped to the small
intestine causes the dissolution of the enteric coating andrapid dispersal of the sucrose sphere and highly soluble API
The goal of the present work is to address in a holisticmanner the analytical challenges faced in the pharmaceuticaldevelopment of rPTH(1-31)NH2 as an enteric- and API-sucrose sphere dosage form In order to ensure chemical purity of the formulation after manufacturing and adequate chem-ical stability during storage an ultrahigh-performance liquidchromatography (UHPLC) method is introduced to separatenumerous chemical impurities of interest for analysis by massspectrometry (MS) The secondary structure of humanhPTH(1-31)NH2 has been previously determined by nuclearmagnetic resonance (NMR) spectroscopy13 here the secon-dary structure of recombinant rPTH(1-31)NH2 API is analyzed both directly in the solid amorphous state within the enteric-coated sucrose sphere formulation and after dissolution of thespheres This is achieved using a combination of methodsincluding solution-state NMR solid-state NMR infrared (IR)spectroscopy and electronic circular dichroism (ECD) Thegoal of the solid-state analyses presented in this work is 3-fold1047297rst to verify that the drug is an amorphous solid second toprovide some indication of secondary structure in the solid
state and third to show if any changes in this structure or tothe amorphous state occur upon formulation into the drugproduct Finally the integrity of the polymeric enteric coatingof the sphere is addressed using Raman microscopic mappingand 1047298uorescence imaging allowing for assessment of the layerthickness and coverage as well as examination of the interfaces between rPTH(1-31)NH2 API the enteric coating and thesucrose substrate
EXPERIMENTAL METHODS
Preparation The API used in this study was supplied by Unigene Laboratories (Fair1047297eld NJ) Brie1047298 y the API is pre-pared via the following process The glycine-extended precursorpeptide is manufactured via a bacterial fermentation process by using a genetically engineered Escherichia coli strain derivedfrom BL21 known as BLM6 The E coli strain has beenmodi1047297ed to aid in the secretion of the glycine-extended pre-cursor peptide using a direct expression technology This tech-nology uses an expression vector containing two copies of thegene coding for the peptide with a signal sequence targetingthe peptide for secretion along with genes coding for chaperoneproteins The chaperone proteins bind noncovalently to therecombinant peptide and induce its direct secretion into theculture medium This precursor peptide is then harvested andpuri1047297ed from the medium using cation exchange and reversedphase chromatography steps Amidation of the glycine-extendedprecursor peptide occurs by the action of α -amidating enzyme(PAM peptidylglycine α -amidating monooxygenase) the PAM
enzyme is manufactured in a Chinese hamster ovary cell line Amidation of the precursor peptide results in rPTH(1-31)NH2During puri1047297cation by cation-exchange and reversed-phase LCthe peptide is converted to a partial acetate salt and lyophilized toprovide the API
After preparation rPTH(1-31)NH2 API is formulated intothe drug product Excipients are 1047297rst added to the API includ-ing an organic acid (citric acid) to cause a transient localreduction of intestinal pH such that gut proteases are inacti- vated and a natural surfactant (L-lauroyl carnitine) to facili-tate peptide transport across mucous and cell membrane barriers Sucrose spheres with an initial diameter of approxi-mately 09 mm were coated 1047297rst with API and then with
Eudragit L30-D55 a polymethylmethacrylate-based entericcoating polymer (BASF Inc Ludwigshafen Germany) usinga stepwise manufacturing process A suspension of rPTH-(1-31)NH2 and Opadry clear hydroxypropylmethylcellulose(HPMC) coating mixture (Colorcon Inc West Point PA) ismade by dissolving rPTH(1-31)NH2 API and the excipientsin water followed by dispersing Opadry powder under slow mixing conditions This API-containing suspension is thenspray-layered onto the sucrose spheres contained in a 1047298uid-bedcoater The enteric coating layer is then added to the spheres by spraying a 1047297ltered Eudragit L30-D55 system onto the API-layered sucrose spheres contained in a 1047298uid-bed coater anddrying the spheres This enteric coating system is prepared by adding talc to the water followed by triethyl citrate andEudragit L30-D55 under constant stirring
Chromatography and Mass Spectrometry UHPLCminus
MS analysis of intact rPTH(1-31)NH2 peptide was performedon an Acquity UPLC system equipped with a diode array UV minus visible detector (Waters Milford MA) UV absorbance was monitored from 190 to 400 nm with a resolution of 12 nmresulting in an acquisition rate of 40 points per second MSanalysis was performed after UV detection using an Orbitrap XL mass spectrometer operating in data-dependent acquisitionmode with 1 MS scan and 2 MSMS scans (Thermo Electron West Palm Beach FL) Both the UV and MS data acquisition was performed using Thermo Xcalibur software (version 207)Electrospray ionization (ESI) was employed at the source andthe following parameters were used the ESI spray voltage wasset to 45 kV the sheath gas 1047298ow rate was 40 (arbitrary units)the auxiliary gas 1047298ow rate was 5 (arbitrary units) the capillary voltage was 124 V the capillary temperature was 230 degC andthe tube lens was 180 V For all experiments the scan range wasfrom m z 250 to 2000
The UHPLC method developed for API and drug productanalysis employed an Acquity BEH300 C18 column (21 mm times
150 mm 17 μm particle size) (Waters Inc Milford MA)
Mobile phase A consisted of 010 vv TFA in water andmobile phase B contained 009 vv TFA in acetonitrile A 1047298ow rate of 02 mLmin was used Gradient elution consistedof an increase in mobile phase B from 20 to 25 for 1 min andthen from 25 B to 35 B over the next 20 min The columntemperature was maintained at 30 degC The column was rinsed with 100 B and a return to the initial condition of 20 B wasperformed in the remaining 30 min run time over which datacontinued to be collected Both API and enteric- and API-coated spheres were dissolved in tris(hydroxymethyl)-aminomethane (Tris) buff er (pH 80) to 4 mgmL concentra-tion Enteric- and API-coated spheres were additionally soni-cated for 1 min until all spheres were dissolved and 1047297lteredthrough Nalgene 045 μm 4 mm syringe 1047297lters (Fisher Scienti1047297c
Pittsburgh PA) Samples were acidi1047297ed with 10 (vv) HClprior to UHPLCminusUV-MS analysis Injection volumes of 1 and10 μL were used for API and drug product samples respectively
Peptide mapping was performed by dissolving the rPTH(1-31)NH2 API in 50 mM TrisHCl 1 mM CaCl2 buff er (pH 81)to obtain a solution concentration of about 25 mgmL Threeseparate portions of this solution were digested with trypsinendoproteinase Lys-C and endoproteinase Glu-C at 37 degC for60 min The reactions were quenched by adding 10 M HClEach digest was then analyzed by reversed-phase HPLC using a20 min gradient method with an Agilent 1100 series HPLC with a single-quadrupole ESI mass spectrometer (Agilent SantaClara CA)
NMR Spectroscopy Solution-state NMR spectra wereobtained using a Bruker DRX700 NMR spectrometer operatingat a 1H frequency of 70013 MHz (Bruker Biospin BillericaMA) A 3 mm Bruker double-resonance probe was used for 1H13C and 15N experiments Samples were dissolved in eitherpure D2O or in 90 H2O10 D2O solutions Water suppres-sion was performed using a modi1047297ed double pulsed 1047297eld
gradient spin echo (DPFGSE) technique that applies the WATERGATE 3-9-19 solvent suppression sequence twice14minus16
These experiments achieved similar results as those applied in aprevious natural-a bundance NMR study of the conformation of hPTH(1-31)NH213 NMR spectra were externally referenced toaqueous dilute 44-dimethyl-4-silapentane-1-sulfonic acid (DSS)
Solid-state NMR spectra were obtained using a Bruker Avance400 spectrometer operating at a 1H frequency of 40013 MHz(Bruker Biospin Billerica MA) Experiments were performedat 273 K using a BCU-05 chiller to minimize frictional heating13C SSNMR spectra were obtained with a 4 mm triple reso-nance magic-angle spinning (MAS) probe tuned to 1H 19Fand 13C frequencies Cross-polarization (CP) transfers wereperformed at power levels of 40minus80 kHz the power level wasramped linearly during the contact time on the 1H channel toenhance CP efficiency17 13C CP spectra were obtained at anMAS rate (νr) of 8 kHz with a 1047297 ve-pulse total sideband suppres-sion (CP-TOSS) sequence18 1H heteronuclear decoupling wasperformed at an rf power of 105 kHz using the SPINAL-64pulse sequence19 1Hminus
13C heteronuclear correlation (HET-COR) spectra were performed with νr set to 125 kHz usingfrequency-switched LeeminusGoldburg decoupling20 13C spectra were referenced to tetramethylsilane (TMS) using an externalreference sample of hexamethylbenzene21 1H spectra wereobtained using a 25 mm triple resonance MAS probe withνr set to 35 kHz using direct polarization (single pulse)experiments and were internally referenced to TMS
Infrared Spectroscopy Transmission IR spectra inaqueous solution were recorded using a Vertex 70 Fouriertransform-IR (FT-IR) spectrometer (Bruker Optics BillericaMA) equipped with an Aquaspec transmission cell with a 1047297 xed7 μm path length and a 5 mm aperture (Micro-BiolyticsFreiburg Germany) The cell was temperature-controlledusing a Haake DC30K20 recirculated water bath (Thermo-Fisher Scienti1047297c Karlsruhe Germany) For each transmissionIR spectrum 512 sample and background (water) scans wereacquired with 4 cmminus1 resolution A mercury cadmium telluride(MCT) detector was used Samples were prepared at aconcentration of 10 mgmL in H2O Spectral subtraction wasperformed for each data set using background spectra of pureH2O collected in an identical manner and at the sametemperature Multivariate partial least-squares (PLS) analysisof the 1047297nal IR spectra was performed to analyze a secondary
structure using the OPUS QUANT package with a proteinlibrary (Bruker Optics Billerica MA)
Attenuated total re1047298ectance (ATR) IR spectra of samplesused in this work were obtained using a Spectrum One FT-IR spectrometer equipped with a deuterated triglycine sulfate(DTGS) detector (Perkin-Elmer Waltham MA) A single-bounce ATR accessory with a diamond window was used to acquire thespectra A resolution of 2 cmminus1 was used and a total of 16 scans were acquired for each spectrum of powder Up to 256 scans wereacquired for coated spheres
Electronic Circular Dichroism ECD spectra wererecorded using a Jasco J-715 spectrometer equipped with aPeltier-controlled variable temperature cell (Jasco Easton MD)
A 1 cm quartz cuvette was used for analysis Samples wereprepared in water at a concentration of 003936 mgmL A scanrange of 200minus700 nm was used with a scan rate of 100 nmminand a resolution of 1 nm Each spectrum was the result of 8coadded accumulations Spectra of water were collected underidentical conditions and used as a blank for spectral subtractionto account for any birefringence from the cell or cuvette Spectra were analyzed using the SOMCD online software package asdiscussed below22
Raman and Fluorescence Microscopy and RamanSpectroscopy Dispersive Raman microscopy and mapping were performed using a Horiba Jobin Yvon LabRAM Aramisspectrometer (Horiba Jobin Yvon Edison NJ) An OlympusBX41 confocal optical microscope is integrated with this system with an Olympus U-LH 100 W Hg lamp and U-RFL-T powersource for 1047298uorescence excitation and bright1047297eld illumination(Olympus America Inc Chester Valley PA) Objectives in therange of 4times to 50times were used with 5minus25 neutral density 1047297ltersFluorescence excitation in the range of 330minus385 nm was used with emission 1047297ltered using a 425 nm cutoff Optical and1047298uorescence images were captured using an In1047297nity 3 cooledcharge-coupled device camera (Lumenera Corp Ottawa
Ontario Canada) For Raman microscopy experiments theconfocal hole was set to 300minus400 μm the laser wavelength was 785 nm detector exposure times were 1minus2 s and thegrating was set to 600minus950 groovesmm Raman mappingexperiments recorded 32 to 128 dispersive scans per map pointand generally required several hours to a day to completePrincipal components analysis (PCA) of Raman mapping data was performed using Solo version 60 with multivariate imageanalysis (eigenvector Research Inc Wenatchee WA)
Additional FT-Raman experiments were performed using aNicolet FT-Raman 960 spectrometer equipped with InGaAsand Ge detectors (ThermoFisher Scienti1047297c Madison WI) Thesample was analyzed using a horizontal video-controlled stage
with a 50 μm spot size The spectra are the result of 128coadded scans collected at 4 cmminus1 resolution A 1064 μm laser was used with a power setting of 06 W
RESULTS AND DISCUSSION
Primary Structure of API The amino acid sequence of rPTH(1-31)NH2 API was con1047297rmed using digestion experi-
ments in conjunction with HPLCminusMS The chromatogramsand MS data obtained after digestion are shown in theSupporting Information The peptide contains 1047297 ve unique sitescleavable by trypsin (denoted by ldquoardquo) three sites cleavable by Lys-C (denoted by ldquo brdquo) and three sites cleavable by Glu-C(denoted by ldquocrdquo) as shown below
With the assumption of complete digestion these cleavagesites result in four possible peptides and two lysine amino acidsfor the tryptic digest three possible peptides and one lysineamino acid for the Lys-C digest and four possible peptides for
the Glu-C digest The peptide maps obtained from these threedigestions showed most of the expected cleavage sites for thestructure of rPTH(1-31)NH2 (see the Supporting Informa-tion) The masses expected for all the peptides and the peptidesidenti1047297ed by mass assignment are also given in the SupportingInformation for tryptic peptides Lys-C peptides and Glu-Cpeptides Agreement between the predicted and observed masses(lt15 Da) for all the peptides was interpreted as con1047297rmation of the presence of those peptides Some of the other minor peaks inthe peptide maps were also identi1047297ed by their respectivemolecular masses and are also listed The masses of peaks fromthe respective peptide maps are in agreement with the sequenceFor identi1047297cation testing of batches of API it is not necessary to
Figure 1 UHPLC separation of rPTH(1-31)NH2 API (bottom trace black color) and enteric- and API-coated sucrose spheres (top trace browncolor) obtained using the UHPLC method described in the text Impurities and degradation products of interest are denoted 1minus12 and 14minus24 whilethe API (rPTH(1-31)NH2) peak is denoted 13 The structural analysis of these peaks by MS is summarized in Table 1
perform the digestion and peptide mapping analysis Solution-state NMR is a suitable substitute once the sequence is knownand is also highly sensitive to secondary structure7
UHPLCminusUV-MS Separation and Impurity and Degra-dation Product Characterization Eff ective separationmethods are necessary for the characterization of the impuritiesin both the API and drug product Because of the structuralsimilarity between many peptides and their impurities anddegradation products and because of the number of ionizablegroups and range of p K a values in each of these moleculespeptides can present a special challenge for HPLC methoddevelopment UHPLC off ers improved performance that canhelp address these issues which derives from its use of smallparticles (lt2 μm) and pressures of up to 15 000 psi23minus25
UHPLC potentially provides higher resolution speed andhigher sensitivity than HPLC23minus25 Because of its advantagesUHPLC has been increasingly applied to peptide separationchallenges26minus28 The use of UHPLC also allows for signi1047297cantly reduced solvent consumption which can enhance thesustainability of pharmaceutical analysis methods because of the need to perform these methods routinely throughout thedevelopment and commercial production of a product29
In the present work a reversed-phase gradient elutionUHPLC method was developed to address challenges inpeak resolution The method was developed using low pH(009 vv TFA) and was optimized based on the impuritiesand degradation products observed and identi1047297ed using MSThe UHPLC chromatograms for representative samples of APIand enteric- and API-coated spheres are shown in Figure 1 andthe MS identi1047297cation results are listed in Table 1 The oxidationproducts (peaks 1 2 and 4) were due to oxidation at Met-8 orMet-18 (or possibly at Trp-23) and tentative assignments have been made based on peptide mapping analysis of tryptic digestfractions A small molecule (m z 2761198) was observed witha retention time of 81 min (peak 3) and was not identi1047297edPeak 5 was observed to be a mass change of minus5323 Da and
identi1047297ed as a cleavage at Ile-5 forming pyroglutamic acidPeaks 6 and 7 were resolved and identi1047297ed as peptide cleavagefragments as 4-31 cleavage after Ser-3 (minus2731 Da) and 3-31cleavage after Val-2 (minus1861 Da) respectively In the enteric-and API-coated sucrose spheres two adducts that likely resultfrom degradation reactions involving rPTH(1-31)NH2 andsucrose were observed as diglycated (peak 11 +3240 Da) andmonoglycated API (peak 12 +1620 Da) These adducts may be related to the degree of contact between the API and thesucrose as observed by the 1047298uorescence microscopy experi-ments discussed below Five acetylation adducts were observedand are listed in Table 1 indicating exposure of rPTH(1-31)NH2 to acetic acid during the lyophilization process andsubsequent storage and stability resulted in small levels of the
modi1047297cation to the Lys residues in the sequence One impurity was partially resolved from an acetylation adduct (peak 18+260 Da) and remains unidenti1047297ed Asn and Gln deamidationproducts were resolved and identi1047297ed as peaks 10 15 16 and17 Hydrolysis of an amide bond of Asn or Gln would beexpected at higher pH and could occur more readily when theproduct is exposed to the conditions necessary to dissolve theenteric coating Several trace peaks observed by their UV absorbance signals were resolved by the UHPLC separation butcould not be positively identi1047297ed by MS These include peaks 89 14 20 and 22 with mass shifts of +4 +486 +12 +28 andminus15 Da respectively and may represent cleavages of thepeptide combined with complex interactions with sucrose
The high performance of the UHPLC method was a criticalaid to the impurity and degradation product identi1047297cationprocess as seen in Figure 1 because it supplied sufficientresolution to separate many of the peaks of interest that wouldhave coeluted under conventional HPLC conditions Thesensitivity of UHPLC was particularly useful for analysis of theenteric and drug-coated spheres because it allows for smallerinjection volumes which in turn allows for better tolerance tothe injection of the basic sample diluent needed to dissolve
the enteric coating on the spheres for practical applications Although TFA was used in the mobile phase instead of alternatives such as formic acid any loss in ionization efficiency caused by ion suppression eff ects was accepted because of countervailing improvements in the separation that mostlikely resulted from the weak ion-pairing properties of TFA As demonstrated by the number of trace peaks and resolvedand identi1047297ed impurities the UHPLCminusUV-MS results pro- vide insight into the product stabil ity and interactions withsucrose which is essential for successful drug formulationdevelopment
Analysis of API Secondary Structure in Solution andin the Solid State A critical analytical challenge faced in the
Table 1 List of Impurities and Degradation ProductsIdenti1047297ed Using UHPLCminus MS in rPTH(1-31)NH2 API andEnteric- and API-Coated Sucrose Spheresa
peak no
Rt(min)
mass obsd(Da)
mass calcd(Da)
mass diff (ppm) assignment
1 78 37319685 3731 9715 minus1 oxidation at Met-8b
(+160 Da)
2 79 37319637 3731 9715 minus2 oxidation at Met-8b
(+160 Da)
3 81 2761198 unknown
4 93 37319646 3731 9715 minus2 oxidation at Met-18b
aObserved molecular masses and structure assignments are given forpeaks shown in Figure 1 Peptide peaks were observed in the 3+charge state b Assignment of oxidation sites were based on trypticpeptide mapping analysis of collected fractions
present work is the analysis of the secondary structure of the
rPTH(1-31)NH2 API and subsequently in the 1047297nal enteric- and API-coated spheres as this can aff ect properties such aschemical stability and in vivo exposure The secondary structureof hPTH(1-31)NH2 has been previously determined usingNMR and was reported to adopt a structure consisting of twohelical portions joined by an intervening 1047298exible turn region where the N-terminal helix is shorter than that of the C-terminal helix13 A number of analogues of rPTH(1-31)NH2 such as the 34-residue form of parathyroid hormone have also been found to adopt similar conformations in studies usingNMR and ECD30minus33 To assess the secondary structure of rPTH(1-31)NH2 transmission IR spectroscopy in aqueous solu-tion was performed and yielded the results shown in Figure 2a
Multivariate analysis of the IR spectrum at 20 degC in Figure 2a
against a protein-based library yielded 12 α -helix and 8 β -sheet with the remainder random In the original NMR study approxi-mately 75 of the residues were present in α -helical regions Theresults of the IR analysis are aff ected by the presence of the acetatesignal in the same region as the amide I band and by the un-availability of a library designed for secondary structure analysis of small peptides of this type Upon heating to 50 degC the maximumtemperature possible with the IR cell the spectrum showed theeff ects seen in Figure 2a Multivariate analysis of this data yielded1 α -helix and 0 β -sheet although not quantitative this result isindicative of a loss of secondary structure After cooling to 20 degCthe IR spectrum returned to its original appearance indicating thatthe conformational change is reversible
Figure 2 (a) Transmission IR spectra of a 10 mgmL solution of rPTH(1-31)NH2 API at 20 and 50 degC obtained in H2O solution after backgroundsubtraction (b) ECD spectra of a 0039 mgmL solution of rPTH(1-31)NH 2 API in H2O recorded between 20 and 80 degC The changes in both IR and ECD spectra were fully reversible upon cooling
The secondary structure can also be examined using theECD spectra in Figure 2 b The spectra obtained agree qualita-tively with previousl y reported spectra of hPTH(1-31)NH2 andrelated peptides30minus33 The feature at 204 nm is more pro-nounced than in other reported work which suggests more
random character This may be caused by the presence of acetate in the samples of interest here The SOMCD program(based on the k2D algorithm) was used to estimate thesecondar y structure at 20 degC for comparison with the IR results22 The results indicated 14 α -helix 33 β -sheet 12turn and 41 random character The low level of α -helicity isconsistent with the IR results The rPTH(1-31)NH2 API usedhere thus shows less α -helicity than the material used in theoriginal NMR study and in previously reported ECD studies Although helicity could be improved by adding tri1047298uoroethanol(TFE) to the solution as in prior work on hPTH(1-31)NH2
31
the purpose of the present study was to characterize actualrecombinant API Like the IR results quantitative analysis by
ECD is of limited reliability because of the use of a modeldeveloped for proteins and the sensitivity of ECD to tertiary structural eff ects in those systems The overall conformationalchange occurring as temperature is increased can be evaluatedfrom the changes seen in the ECD spectra in Figure 2 b Thefeature at 222 nm is reduced (signifying a loss of both α -helix and β -sheet character) while the feature at about 205 nm alsodecreases (signifying a loss of α -helix character) both of whichare consistent with a loss of helicity Upon cooling to 20 degC theECD spectra returned to their initial form This is consistent with the IR analysis and con1047297rms a fully reversible loss of secondary structure with increasing temperature which ishelpful in interpretation of the NMR results that follow and
ultimately to show whether the API in the coated spheres hasretained its secondary structure
Further information about the structure was gained by solution-state NMR studies The 1H spectrum of rPTH(1-31)NH2 has been previously assigned using a series of 2D 1H
and 13C experiments at high 1047297eld performed on a natural-abundance sample13 The deshielded region containing aro-matic and amide proton environments is depicted in Figure 3The changes in hydrogen bonding upon the loss of secondary structure at higher temperatures were not studied previously 13
but are clearly seen in the 1H WATERGATE DPFGSE NMR spectra in H2OD2O solution in Figure 3 The chemicalshift range compresses as temperature increases indicatingan increase in randomization Examination of the 1H NMR spectra over a wide range of concentrations of rPTH(1-31)-NH2 including the sample used for the acquisi tion of ECD spectra shows no evidence of potential aggregationor other intermolecular interactions (see the SupportingInformation)
The secondary structure of rPTH(1-31)NH2 in the solid-state has not been previously examined in the literature Ingeneral analysis of the secondary structure in an amorphouspeptide is a challenging task The ECD and IR methods used tocharacterize peptides and proteins in solution have not beenparametrized based on solid-state reference materials andcannot be readily applied to a solid peptide Neverthelesseff orts to characterize and control the solid form of an API arenecessary for oral dosage f orms because of potential eff ects onstability and exposure34 First the solid rPTH(1-31)NH2
peptide used here was determined to be amorphous by X-ray powder diff raction (XRPD) analysis (see the SupportingInformation) No evidence of crystalline peptide or acetate
Figure 3 1H WATERGATE DPFGSE NMR spectra rPTH(1-31)NH2 API in H2OD2O solution at a concentration of 25 mgmL showing anexpansion of the amidearomatic proton region and the spectral changes observed over a temperature range of 293 (20 degC) to 353 K (80 degC)
was observed in the XRPD patterns of lyophilized rPTH(1-31)NH2 either initially or after storage at diff erent temperature andhumidity conditions The 13C CP-TOSS spectra of multiple batches of rPTH(1-31)NH2 also showed broad peaks consistent with amorphous material and showed no detectable batch-to- batch variation (see the Supporting Information)
To investigate the secondary structure of the peptide in thesolid state a 2D SSNMR method capable of detecting short-range interactions between speci1047297c functional groups inamorphous materials can be used Isotopic labeling is normally needed to elucidate detailed structural information how-ever this approach is not amenable to use with API batches
Figure 4 (a) 1Hminus13C CP-HETCOR spectrum of rPTH(1-31)NH2 API obtained using a 400 μs contact time at νr = 125 kHz The 13C CP-TOSS
spectrum (νr = 8 kHz) is plotted along the F 2 axis (top) and the 1H MAS spectrum (νr = 35 kHz) is plotted along the F 1 axis (left) (b) A view of one of the ensemble of hPTH(1-31)NH2 structures determined by solution-state NMR (see ref 13) showing interactions assigned the HETCOR correlations (see text)
produced at large scale as in the present case A sample of API
was examined using a 2D 1
Hminus
13
C CP-HETCOR experimentand interpreted in relation to the reported ensemble of 20solution-state structures for hPTH(1-31)NH2 to determine if any features of these secondary structures can be observed atleast to some e xtent in rPTH(1-31)NH2 API in the amorphoussolid state1335 The 2D 1Hminus
13C CP-HETCOR experimentshows interactions between 1H and 13C nuclei that are close inspace typically within 3 Aring20 Although the resolution is limited by the amorphous nature of the sample the only residues inrPTH(1-31)NH2 that contain aromatic functional groups areHis9 His14 and Trp23 leading to simpli1047297ed 13C spectral inter-pretation and the possibil ity of detection of 1Hminus
13Ccorrelations between aliphatic and aromatic functional groupsof interest Trp23 is particularly useful as it sits in the inter-
helical ldquopocketrdquo in the ensemble of structures and off ers accessto longer-range interactions indicative of secondary structure
His9 and His are less useful as they are located on the outsideof the structure
The results of a 2D 1Hminus13C CP-HETCOR experiment
obtained with a 400 μs contact time suitable for detection of interactions within 3 Aring are shown in Figure 4a In the amor-phous sample of rPTH(1-31)NH2 the 2D 1Hminus
13C CP-HETCOR experiment detects correlations between aromatic carbons arisingfrom a broad 13C peak centered at 120 ppm and aliphaticprotons with a 1H chemical shift of about 0minus2 ppm The broad13C resonance at 120 ppm can be assigned to either C8 C9 orC10 in tryptophan based on known chemical shift trends (using
the carbon numbering scheme shown in Figure 4 b)36 The
assignment of the resonance at sim120 ppm to C8 C9 and C10positions was further con1047297rmed by a dipolar dephasingexperiment (see the Supporting Information) which showsthat all positions in the vicinity of 120 ppm are protonatedcarbons in agreement with direct correlations observed in the2D 1Hminus
13C CP-HETCOR spectrum in Figure 4a The aliphaticproton resonances involved in this correlation can be partially assigned to individual amino acids via the interactionshighlighted in Figure 4 b which depicts 1 of the 20 structuresfrom the solution-state NMR study13 35 First many of thestructures show an interaction between the methyl protons onLeu24 and the aforementioned aromatic carbons (C8 to C10)on Trp23 the protonminuscarbon distance ranges from 28 to 68 Aring in the ensemble of structures with 7 of the 20 structures showing
a distance of less than 3 Aring35
A more interesting interaction between Trp23 and Leu11 would be of more importance for thesecondary structure of rPTH(1-31)NH2 and may also contributesigni1047297cantly to this 2D correlation although it may be overlapped with the interaction between Leu24 and Trp23 The interaction between Trp23 and Leu11 is an interhelical contact detected vianuclear Overhauser eff ects in the solution-state NMR structurereported for rPTH(1-31)NH2
13 However this interaction is likely less of a contributor to the 2D correlation than the Trp23minusLeu24interaction although protonminuscarbon distances range from 28 to64 Aring only 3 of the 20 structures have a distance of less than 3 Aring
The broad correlation with a 13C shift of 120 ppm also has ahighly shielded 1H component trending toward 0 ppm this is
Figure 5 FT-Raman spectra of solid rPTH(1-31)NH2 API (top) the enteric coating used in the formulation after drying (middle) and an uncoatedraw sucrose sphere used in the formulation (bottom) obtained using a microstage with a 1064 μm laser excitation frequency and a 50 μm beam spotsize The vertical axis is in arbitrary units The Raman scattering from sucrose was strongest followed by the enteric coating with the API yieldingthe weakest scattering
suggestive of shielding from aromatic π -stacking interactions Inthe ensemble of structures close contacts are also observed
between Trp23 and protons attached to C2 and C3 on Lys27as shown in Figure 4 b These protons already have highly shielded chemical shifts and their position above the aromaticring of Trp23 would provide an additional shielding eff ectconsistent with the CP-HETCOR correlation The protonminuscarbon interaction between C2 and the centroid of the six-membered ring on Trp23 ranges from 27 to 39 Aring in theensemble of solution-state NMR structures with 6 structuresshowing distances below 3 Aring Likewise the protonminuscarboninteraction between C3 and the centroid of the six-memberedring on Trp23 ranges from 27 to 36 Aring in the ensembleof solution-state NMR structures with 7 structures show-ing distances below 3 Aring An interaction between Trp23 and
Lys27 explains both the presence of the correlation in theCP-HETCOR spectrum and its highly shielded 1H shift
Figure 6 (a) Dispersive Raman spectra of an enteric- and API-coatedsphere obtained with a 785 nm laser and with the confocal microscopeset to diff erent z-axis points ( z = 0 μm represents the point of opticalfocus) using a 20times objective Arrowheads represent bands of interestfor each component (see text) (b) Map of a 200 μm-diameter circularregion on the outside of an enteric- and API-coated spheresuperimposed on a bright1047297eld optical microscopy image (with z =minus50 μm) Greater intensity of green represents greater spectral area inthe range of 1745minus1700 cmminus1 which originates from the entericcoating
Figure 7 (a) Optical image of an area of a cross-sectioned enteric- and API-coated sphere obtained with a 10times objective The brighter upper leftregion is due to mounting putty (b) Results from a 64 times 64 squareRaman map with a 785 nm laser superimposed on the optical micrographgreater intensity of bluepurple represents greater spectral area in the1745minus1700 cmminus1 region (enteric coating) green represents greaterspectral area in the range of 1670minus1635 cmminus1 region (API) and redrepresents greater spectral area in the 855minus840 cmminus1 region (sucrose) (c)PCA of the Raman 64 times 64 map showing three major PCs identi1047297ed
which correspond to the enteric coating API and sucrose
The observation of this interaction provides evidence that Trp23remains in the central ldquopocketrdquo and thus some aspects of thesecondary structure of rPTH(1-31)NH2 are maintained in theamorphous solid
Other correlations were observed in the 2D 1Hminus13C CP-
HETCOR spectrum in Figure 4a including a correlation tenta-tively assigned to more deshielded Trp23 aromatic carbonsinteracting with protons on Gly12 at sim4 ppm However thiscorrelation may also arise from interactions between the
aromatic carbons on His9 or His14 and the proton attached toCα of the same residue The other correlations observed in the2D 1Hminus
13C CP-HETCOR spectrum were not found to beuseful for assessing the secondary structure of the API in thesolid state
Raman and Fluorescence Microscopy of Drug-CoatedSpheres With a detailed assessment of the API in handseveral analytical challenges related to the coated sucrosespheres can be addressed First methods were needed to verify the integrity of the enteric coating which is a critical factorin the ultimate performance of the dosage form because of the propensity of rPTH(1-31)NH2 toward gastric chemicaldegradation Product integrity in an acidic media (01 N HCl)
for 2 h was evaluated using standard dissolution or dis-integration tests which were performed as an in-processcontrol (IPC) during the manufacturing and as an end-productassessment However this is a bulk enteric coat performancetest and does not provide details of enteric coat distributioncoat thickness and 1047297lm coat quality Analytical methods areneeded to characterize such formulations to determine entericcoating distribution and thickness as well as examine the APIlayer and its penetration into the sucrose substrate Raman
microscopy and mapping often combined with multivariateanalysis is an excellent tool for performing this task formicrosphere-based drug products37 as was recently demon-strated for sim300 μm diameter microspheres fabricated fromthree polymers poly(DL-lactide-co-glycolide) poly(L-lactide)(PLLA) and poly(caprolactone)38 In the present work Ramanmicroscopy is combined with optical and 1047298uorescence micros-copy using a single instrument to provide chemical images of intact and cross-sectioned microspheres containing rPTH-(1-31)NH2 Raman spectroscopy provides good speci1047297city foreach of the three major components of the drug product asshown in the FT-Raman spectra in Figure 5 These spectra were obtained from bulk samples of each component using a
Figure 8 Fluorescence microscopy images of a cross-sectioned enteric- and API-coated sucrose sphere The images were obtained using a 10 times
objective The images at the top are composite images constructed from 36 individual images while the images at the bottom are single images Thehighly 1047298uorescent rPTH(1-31)NH2 API in the interior layer can be seen in contrast to the less 1047298uorescent enteric coating and sucrose sphere
1064 μm laser wavelength and exhibit characteristic bands thatcan be of use in spatially resolved studies using Raman micros-copy In particular the amide I band is observed in the 1670minus1635 cmminus1 region for rPTH(1-31)NH2 methacrylate carbonyl bands are observed in the 1745minus1700 cmminus1 region for theEudragit L30-D55 enteric coating and a number of strong bands
are observed for the sucrose sphere including a particularly strong band in the 855minus840 cmminus1 region
Confocal Raman microscopy was 1047297rst used to perform depthpro1047297ling of an enteric- and API-coated to yield the dispersiveRaman spectra shown in Figure 6a Use of a 785 nm laser wavelength was required to avoid strong 1047298uorescence Startingfrom the outside of the sphere a band at 1730 cmminus1 is observedthat is diagnostic for the enteric coating polymer (green arrow)The polymer also exhibits a band at 1650 cmminus1 overlapping theregion in which the amide signals from rPTH(1-31)NH 2 occur As the confocal stage is focused into the sphere the amidesignals of rPTH(1-31)NH2 appear (red arrow) As the focalpoint travels further into the sample the amide signals diminish
as signals from sucrose gain in strength (blue arrows) A circular Raman map of the enteric coating was made using5 μm steps as shown in Figure 6 b The map has a diameter of 200 μm and was performed with z = minus50 μm based on the resultsin Figure 6a The map was limited to a small diameter to avoiddeviations from the focal point caused by changes in sample
elevation The color scale used in Figure 6 b was chosen tohighlight subtle diff erences in band intensity (within 10) sothat areas without color still contain signi1047297cant enteric coat-ing bands The results in Figure 6 b show the relatively evencoverage of the surface by the enteric coating only a few areasare observed with reduced intensity which could be the resultof reduced Raman scattering across diff ering surface morphol-ogy or potentially from minor reductions in enteric coatingthickness
Cross-sectioned enteric- and API-coated spheres were alsomapped using Raman microscopy to determine the distributionof rPTH(1-31)NH2 and the enteric coating Raman microscopy is capable of spatially assessing the coverage of the enteric
Figure 9 13C CP-TOSS SSNMR spectra of amorphous rPTH(1-31)NH2 API dried enteric coating enteric- and API-coated sucrose spheres andsucrose spheres coated with API only In the top spectrum the enteric- and API-coated sucrose spheres show small peaks (denoted witharrowheads) indicative of the amorphous rPTH(1-31)NH2 present in the formulation All spectra were obtained with ν r set to 8 kHz and 273 K
coating and is frequently used to probe the closely relatedquestion of the interaction of a thin (50minus100 μm) 1047297 lm coatingand solid compressed tablet cores39 A bright1047297eld opticalmicrograph of a portion of an enteric- and API-coated sucrosesphere obtained with a 20times objective is shown in Figure 7aThe transition from the largely crystalline sucrose sphere to theamorphous coating is visible but no evidence of the interface between rPTH(1-31)NH
2 and the enteric coating can be seen
with this method Figure 7 b shows the results of Ramanmapping using a square 60 times 60 array of points and covering a250 times 250 μm area with false-color band area resultssuperimposed over the optical micrograph The thickness andcoverage of the enteric coating can be examined in this mannerfor individual spheres as preparation conditions are varied PCA of the Raman spectral map with the results shown in Figure 7crevealed similar results to the band intensity analysis butprovided for better speci1047297city via the principal components(PCs) and did not identify any unexpected components A fourth PC assigned to a polymeric binder used within thesucrose spheres was also detected by PCA within the sucroseregion in several cross-sectioned spheres but is not seen in theregion chosen for Figure 7
Although Raman mapping is highly speci1047297c the use of the785 nm laser (required to avoid 1047298uorescence from the API)reduces sensitivity and renders the technique too slow for use when many spheres must be analyzed to adjust critical processparameters The use of 1047298uorescence microscopy allows forfurther detail regarding the interface between the API andpolymer and the API and sucrose sphere to be gained frommultiple rapid experiments with higher spatial resolution This isimportant because the interface between the polymer drug andsucrose core can critically impact performance For example inthe formulation of interest here the sucrose adduct of rPTH(1-31)NH2 observed by UHPLC in batches of enteric- and API-coated spheres may be related to the degree of interaction between sucrose and the API In Figure 8 1047298uorescence images
of two typical spheres are shown after cross-sectioning Thecoating layer and the sucrose core can be easily seen as the APIhas much stronger 1047298uorescence under these excitationconditions Raman mapping as previously shown in Figure 7 helps con1047297rm that the 1047298uorescence eff ects are assignedcorrectly to a given spatial region Minimal penetration of the API into the sucrose is observed at the magni1047297cation used inFigure 8 Fluorescence images obtained with a 50times objectiveshow some degree of penetration on the order of a few micrometers between the API and both the polymer andthe sucrose sphere (see the Supporting Information) Thisinformation is useful in process development for example thedrug layering process conditions can be varied to limit APIpenetration into the sucrose sphere and limit formation of the
aforementioned sucrose adduct degradation product Howeverthe limited degree of penetration of API into the sucrose sphereobserved in Figure 8 and in other data obtained on thesesamples is a desirable outcome The combination of confocalRaman microscopy and 1047298uorescence microscopy thus off ersdetailed understanding of the microstructure of this type of product which is highly useful to help understand the results of bulk physical and dissolution testing In particular 1047298uorescencemicroscopy off ers a fast method to assess coating and API layerthickness during process development
Analysis of API Form and Secondary Structure withinDrug-Coated Spheres As with the rPTH(1-31)NH2 APIthe solid-state form of the peptide present in the enteric- and
API-coated sucrose spheres is particularly crucial 13C SSNMR experiments were used to show that the API remains in theamorphous state in enteric- and API-coated spheres XRPD isunsuitable for this analysis because of the presence of crystallinesucrose and the lack of sensitivity and speci1047297city of thistechnique for amorphous substances Figure 9 shows the 13CSSNMR spectra obtained using the CP-TOSS sequence for bulk spheres coated with API alone and with API and theenteric coating polymer as compared to other components of the formulation The peptide is easily detected in the spherescoated with Eudragit L30-D55 as evidenced by resonancesin the 20minus70 ppm region Although overlap is signi1047297cant the
Figure 10 (a) ATR IR spectra of rPTH(1-31)NH2 API (purplespectrum) formulation components and the coated sphere for-mulation after the API coating step (green spectrum) andsubsequently after the enteric coating step (red spectrum) Changesin the amide bands particularly the amide II band can be seen uponformulation prior to enteric coating (comparing the purple and greenspectra) (b) Raman spectra for API and the API layer in a cross-sectioned enteric-coated sphere obtained via microscopy with a785 nm laser and a 50times objective
spectra show no evidence of recrystallization or a form changein either the spheres coated with API only or with the 1047297nalenteric-coated spheres Quantitative analysis of drug level in theformulation if desired is also possible using the 13C SSNMR data and could be a useful method for process development but was not pursued in the present study
The diff erence in secondary structure between the
amorphous API and the spray-coated spheres can be assessedin a qualitative manner by comparison of the ATR IR spectraobtained from the API and from the surface of spheres coatedonly with API Like transmission IR ATR IR is capableof measuring protein and peptide secondary structure in thesolution phase40 41 However it has not been extensively explored for peptides in solid phases and here is used only as aqualitative measure of similarity To perform the analysisindividual API-coated spheres were pressed against thediamond ATR window with sufficient force to make contact but without using enough force to cause them to break apartPrior to analysis the spheres were extensively dried under vacuum to remove water which overlaps with the frequency of the amide I band and causes it to have a greater apparent
intensity42
The number of scans was increased to make up forthe limited surface area of the single-sphere samples ATR IR spectra from the drug product are compared to the formulationcomponents in Figure 10a The spectra show subtle diff erencesin the amide I and II bands between the bulk API and the API-coated spheres Extraction of secondary structure from ATR spectra cannot be performed in the same manner as fortransmission IR spectra The subtle spectral diff erences could be caused by secondary structure diff erences but also could becaused by hydration state eff ects or particle size diff erences which are known to aff ect ATR IR spectra and other forms of IR sampling that might be applied to the analysis at hand43 44
As shown in Figure 10a addition of the enteric coating makes it
difficult to observe the API amide bands as the evanescent wave depth of ATR techniques is frequency-dependent but istypically on the order of several micrometers and is less thanthe thickness observed for the enteric-coating layer45
To minimize the impact of water and particle size on theanalysis Raman spectra of the amorphous API and the APIcontained within a cross-sectioned enteric- and API-coated
sphere were compared Particle size eff ects on Raman spectraare generally less signi1047297cant than with ATR IR spectra46 InFigure 10 b spectra obtained with Raman microscopy using a50times objective show a number of diff erences The diff erentfeatures of the Raman spectra for both API and the API layer inenteric- and API-coated spheres were consistently obtainedacross a number of samples analyzed in this work The resultssuggest that a change does occur in the secondary structure of rPTH(1-31)NH2 upon formulation through signi1047297cant inten-sity changes in bands at 1360 and 1080 cmminus1 however morespeci1047297c information about the type of change occurring is notavailable from this analysis
Both ATR IR and Raman spectroscopy suggest changes insecondary structure within the amorphous API layer coated on
the spheres relative to the bulk amorphous API These might becaused by heating and drying operations during the coatingprocesses However upon dissolution the API is likely to revert back to the same conformation To prove this additionalanalysis is needed Of the three techniques examined to thispoint that could potentially be used for secondary structureanalysis of redissolved enteric- and API-coated spheres 1Hsolution-state NMR is the least susceptible to interference fromthe sucrose and Eudragit L30-D55 excipients used in the 1047297naldrug product and thus is likely to be the best suited forcon1047297rming the secondary structure of rPTH(1-31)NH2 upondissolution of the drug The ECD spectrum is deleteriously aff ected by the presence of large quantities of sucrose and the
Figure 11 Expanded amide and aromatic region of the solution-state 1H WATERGATE DPFGSE NMR spectrum obtained after redissolution of enteric- and API-coated spheres in H2OD2O at 298 K (bottom) compared with a similarly obtained reference spectrum of input API (top)
IR spectrum is similarly aff ected by vibrations in the region of interest from the Eudragit L30-D55 polymer and acetatecounterion In Figure 11 the expanded deshielded region of the1H WATERGATE DPFGSE spectrum obtained upon redis-solution of enteric- and API-coated spheres is shown incomparison to the API spectrum at 25 degC Subtle changes areobserved but are not signi1047297cant relative to the expected changes
(seen in Figure 3) that would arise if a major change insecondary structure had occurred Instead the subtle spectralchanges are likely caused by matrix eff ects or possibly by non-covalent interactions between rPTH(1-31)NH2 and the polymerandor the sucrose Thus it can be seen that the API reesta- blishes its secondary structure upon dissolution despite changesobserved in the solid state
CONCLUSIONS
The eff ective characterization of peptide pharmaceuticalproducts requires a multidisciplinary approach using comple-mentary analytical methods In this work a 37 kDa PTHpeptide formulated for oral delivery by coating onto sucrosespheres and then coating with an enteric polymer was charac-
terized in order to determine a number of critical performance-related aspects of the product The major analytical challengesfaced during development of such a product were addressed aspart of a holistic analytical characterization eff ort UHPLC wasfound to provide superior results for the separation and iden-ti1047297cation of impurities and degradation products by MS Poten-tial changes in peptide secondary structure are also a criticalconsideration in the development of drug products containing amolecule of this size Orthogonal methods using solution-stateNMR IR and ECD were applied to show that the peptideretained its secondary structure after thermal denaturation insolution In addition SSNMR provided evidence that the APIretained its secondary structure in the amorphous state afterlyophilization Vibrational spectroscopy showed evidence that
the API underwent slight changes in the enteric- and API-coated product that could be caused by a secondary structurediff erence After dissolution of the coated spheres the API wasshown by solution-state NMR to reestablish its secondary structure Finally Raman and 1047298uorescence microscopy wereused to perform chemical imaging of both the outer surface andcross-sectioned areas of the enteric- and API-coated sphereseven though both the peptide and the polymeric coating wereamorphous and contained signi1047297cant overlap in their Ramanspectra Florescence microscopy was found to be a rapid sen-sitive method for examination of cross-sectioned areas to assesscoating thickness
ASSOCIATED CONTENT
S Supporting Information
Additional analytical data obtained for the samples used in thisstudy including peptide mapping XPRD and optical and1047298uorescence images This material is available free of charge viathe Internet at httppubsacsorg
AUTHOR INFORMATION
Corresponding Author
E-mail FredGVogtgskcom
Notes
The authors declare no competing 1047297nancial interest
ACKNOWLEDGMENTS
Dr Eunah Lee (Horiba Jobin Yvon) and Dr Mark Strohmeier(GlaxoSmithKline) are thanked for assistance with multivariateanalysis and Raman microscopy This work is dedicated to thememory of Dr Mingjiang Sun our friend and colleague
REFERENCES
(1) Jenssen H Hamill P Hancock R E W Clin Microbiol Rev2006 19 491minus511
(2) Reddy S T Anantharamaiah G M Navab M Hama SHough G Grijalva V Garber D W Datta G Fogelman A M
Expert Opin Investig Drugs 2006 15 13minus21(3) Kieber-Emmons T Murali R Greene M I Curr Opin
Biotechnol 1997 8 435minus441(4) Pini A Falciani C Bracci L Curr Protein Pept Sci 2008 9
468minus477(5) Yoshioka S Stella V J Stability of peptide and protein
pharmaceuticals In Stability of Drugs and Dosage Forms Kluwer Academic New York 2000 pp 187minus204
(6) Kee K S Jois S D Curr Pharm Des 2003 9 1209minus1224(7) Vergote V Burvenich C Van deWiele C De Spiegeleer B
J Pept Sci 2009 15 697minus710
(8) Synder L R Kirkland J J Glajch J L Practical HPLC Method Development 2nd ed Wiley New York 1997
(9) Balan G Bauman J Bhattacharya S Castrodad M Healy DR Herr M Humphries P Jennings S Kalgutkar A S Kapinos BKhot V Lazarra K Li M Li Y Neagu C Oliver R PiotrowskiD W Price D Qi H Simmons H A Southers J Wei L Zhang
Y Paralkar V M Bioorg Med Chem Lett 2009 19 3328minus3332(10) Widler L Altmann E Beerli R Breitenstein W Bouhelal
R Buhl T Gamse R Gerspacher M Halleux C John M RLehmann H Kalb O Kneissel M Missbach M Mu
ller I RReidemeister S Renaud J Taillardat A Tommasi R Weiler S
Wolf R M Seuwen K J Med Chem 2010 53 2250minus2263(11) Kimmel D B Bozzato R P Kronis K A Coble T Sindrey
D Kwong P Recker R R Endocrinology 1993 132 1577minus1584(12) Gardella T J Luck M D Wilson A K Keutmann H T
Nussbaum S R Potts J T Kronenberg H M J Biol Chem 1995 270 6584minus6588(13) Chen Z Xu P Barbier J R Willick G Ni F Biochemistry
2000 39 12766minus12777(14) Hwang T L Shaka A J J Magn Reson A 1995 112 275minus
279(15) Piotto M Saudek V Sklenar V J Biomol NMR 1992 2
661minus666(16) Braun S Kalinowski H O Berger S 150 and More Basic
NMR Experiments 2nd ed Wiley-VCH New York 1998(17) Metz G Wu X Smith S O J Magn Reson A 1994 110
219minus227(18) Antzutkin O N Prog NMR Spectros 1999 35 203minus266(19) Fung B M Khitrin A K Ermolaev K J Magn Reson 2000
142 97minus101(20) van Rossum B J Fo rster H de Groot H J M J Magn Reson
1997 124 516minus519(21) Earl W L Vanderhart D L J Magn Reson 1982 48 35minus54(22) Unneberg P Merelo J J Chaco n P Mora n F Proteins
Struct Funct Genet 2001 42 460minus470(23) Swartz E J Liq Chromatogr Related Technol 2005 28 1253minus
1263(24) Guillarme D Ruta J Rudaz S Veuthey J-L Anal Bioanal
Chem 2010 397 1069minus1082(25) Nova kova a L Matysova a L Solich P Talanta 2006 68 908minus
918(26) Spoof L Neffling M-R Meriluoto J J Chromatogr B 2009
877 3822minus3830(27) Winter D Pipkorn R Lehmann W D J Sep Sci 2009 32
(28) Luna L G Williams T L Pirkle J L Barr J R Anal Chem2008 80 2688minus2693
(29) Chen S Kord A S J Chromatogr A 2009 1216 6204minus6209(30) Piserchio A Shimizu N Gardella T J Mierke D F
Biochemistry 2002 41 13217minus13223(31) Condon S M Morize I Darnbrough S Burns C J Miller
B E Uhl J Burke K Jariwala N Locke K Krolikowski P HKumar N V Labaudiniere R F J Am Chem Soc 2000 122 3007minus
3014(32) Marx U C Adermann K Bayer P Forssmann W G RoschP Biochem Biophys Res Commun 2000 267 213minus220
(33) Schievano E Mammi S Silvestri L Behar V RosenblattM Chorev M Peggion E Biopolymers 2000 54 429minus447
(34) Lee S L Raw A S Yu L Signi1047297cance of drug substancephysiochemical properties in regulatory quality by design In
Preformulation in Solid Dosage Form Development Drugs and thePharmaceutical Sciences Vol 178 Informa Healthcare USA New York2008 pp 571minus583
(35) The structures of I determined by solution-state NMR in ref 13 were obtained from the Protein Data Bank (httpwwwrcsborgpdbhomehomedo) under identi1047297er 1FVY
(36) Kalinowski H O Berger S Braun S Carbon-13 NMR Spectroscopy Wiley New York 1988 p 229
(37) Van Apeldoorn A A Van Manen H-J Bezemer J M de
Bruijn J D Van Blitterswijk C A Otto C J Am Chem Soc 2004 126 13226minus13227
(38) Widjaja E Lee W L Loo S C J Anal Chem 2010 82 1277minus1282
(39) Ruotsalainen M Heinamaki J Guo H Laitinen N Yliruusi J Eur J Pharm Biopharm 2003 56 381minus388
(40) Smith B M Franzen S Anal Chem 2002 74 4076minus4080(41) Smith B M Oswald L Franzen S Anal Chem 2002 74
3386minus3391(42) Goormaghtigh E Raussens V Ruysschaert J-M Biochim
Biophys Acta 1999 1422 105minus185(43) Yoshidome T Kusumoto H Kuroki O Kamata S Chem
Lett 1998 8 747minus748(44) Otsuka M Matsuda Y J Pharm Sci 1996 85 112minus116(45) Harrick N J Internal Re 1047298 ection Spectroscopy Wiley New York
1967(46) Hu Y Wikstrom H Byrn S R Taylor L S Appl Spectrosc