Page 1
ANALYTICAL METHOD DEVELOPMENT AND VALIDATION OF
TERIFLUNOMIDE BY RP- HPLC
A dissertation submitted to
THE TAMILNADU Dr.M.G.R MEDICAL UNIVERSITY
CHENNAI- 600 032.
In partial fulfillment of the requirements for the award of Degree of
MASTER OF PHARMACY
IN
PHARMACEUTICAL ANALYSIS
Submitted By
K.DINESH BABU
(Reg. No: 261530952)
Under the guidance of
Prof., Dr.D.Babu Ananth, M.Pharm.,Ph.D.,
DEPARTMENT OF PHARMACEUTICAL ANALYSIS
EDAYATHANGUDY.G.S PILLAY COLLEGE OF PHARMACY
NAGAPATTINAM- 611002
OCTOBER 2017
Page 2
Prof., Dr.D.Babu Ananth, M.Pharm.,Ph.D.,
Principal cum Professor,
Department of Pharmaceutical Analysis,
Edayathangudy.G.S.Pillay College of Pharmacy,
Nagapattinam – 611 002.
CERTIFICATE
This is to certify that the dissertation entitled “ANALYTICAL METHOD
DEVELOPMENT AND VALIDATION OF TERIFLUNOMIDE BY RP-HPLC” submitted by K.DINESH BABU(Reg. No: 261530952) in partial fulfillment for
the award of degree of Master of Pharmacy to the Tamilnadu Dr. M.G.R
Medical University, Chennai is an independent bonafide work of the candidate
carried out under my guidance in the Department of Pharmaceutical analysis,
Edayathangudy.G.S Pillay College of Pharmacy during the academic year
2016-2017.
Place: Nagapattinam (Prof., Dr.D.Babu Ananth,M.Pharm.,Ph.D.,)
Date:
Page 3
ACKNOWLEDGEMENT
I would like to express profound gratitude to Mrs.Jothimani G.S.Pillay,
Chairman, E.G.S.Pillay College of Pharmacy, and Thiru. S.Paramesvaran,
M.Com., FCCA., Secretary, E.G.S.Pillay College of Pharmacy.
I express my sincere and deep sense of gratitude to my Guide
Prof.Dr.D.Babu Ananth, M.Pharm., Ph.D., Principal, Head, Department of
Pharmaceutical Analysis E.G.S.Pillay College of Pharmacy, for his invaluable
and extreme support, encouragement, and co-operation throughout the
course of my work.
I express my sincere gratitude to Prof. Dr.M.Murugan,
M.Pharm., Ph.D., Director cum Professor, Head, Department of
Pharmaceutics. E.G.S.Pillay College of Pharmacy, for his encouragement
throughout the course of my work.
I express my sincere gratitude to Prof., K.Shahul Hameed Maraicar,
M.Pharm., (Ph.D)., Director cum Professor, Department of Pharmaceutics.
E.G.S.Pillay College of Pharmacy, for his encouragement throughout the
course of my work.
I would like to extend my thanks to all the Teaching Staff and Non
Teaching Staff, who are all supported me for the successful completion of my
project work.
Last but not least, I express my deep sense of gratitude to my parents,
family members and friends for their constant valuable blessings and
kindness.
Page 4
Chapter-1 Introduction
Dept of Pharmaceutical Analysis 1 EGS Pillay College of Pharmacy
1.0 INTRODUCTION
1.1 High-Performance Liquid Chromatography (HPLC)
High-performance liquid chromatography, is a chromatographic technique used to
separate the components in a mixture, to identify each component, and to quantify
each component. The method involves a liquid sample being passed over a solid
adsorbent material packed into a column using a flow of liquid solvent. Each analyte
in the sample interacts slightly differently with the adsorbent material, thus retarding
the flow of the analytes. If the interaction is weak, the analytes flow off the column in
a short amount of time, and if the interaction is strong, then the elution time is long.
(Sharma B.K, 1994).
Chromatography may be defined as a method of separating a mixture of
components into individual components through equilibrium distribution between two
phases. (Chatwal G.R, 1998)
The HPLC method was considered the choice of estimation, since this method
is the most powerful of all chromatographic and other separative methods. The HPLC
method has enabled analytical chemist to attain great success in solving his analytical
problems. The HPLC is the method of choice in the field of analytical chemistry,
since this method is specific, robust, linear, precise, and accurate and the limit of
detection is low and also it offers the following advantages. (Beckett, 2002)
The schematic representation of an HPLC instrument typically includes a
sampler, pumps, and a detector. The sampler brings the sample mixture into the
mobile phase stream which carries it into the column. The pumps deliver the desired
flow and composition of the mobile phase through the column. The detector generates
Page 5
Chapter-1 Introduction
Dept of Pharmaceutical Analysis 2 EGS Pillay College of Pharmacy
a signal proportional to the amount of sample component emerging from the column,
hence allowing for quantitative analysis of the sample components. A digital
microprocessor and user software control the HPLC instrument and provide data
analysis. Some models of mechanical pumps in a HPLC instrument can mix multiple
solvents together in ratios changing in time, generating a composition gradient in the
mobile phase. Various detectors are in common use, such as UV/Vis, photodiode
array (PDA) or Refractive Index (RI).
SCHEMATIC REPRESENTATION OF HPLC SYSTEM
Page 6
Chapter-1 Introduction
Dept of Pharmaceutical Analysis 3 EGS Pillay College of Pharmacy
1.2 Components Of HPLC System
1.2.1 Pump
Pump generates a flow of eluent from the solvent reservoir to the system. Most
pumps used in current LC systems generate the flow by back-and-forth motion of a
motor-driven piston (reciprocating pumps). Because of this piston motion, it produces
“pulses”. There have been large system improvements to reduce this pulsation and the
recent pumps create much less pulse compared to the older ones. Recent analysis
requires very high sensitivity to quantify a small amount of analytes, and thus even a
minor change in the flow rate can influence the analysis. Therefore, the pumps
required for the high sensitivity analysis needs to be highly precise.
1.2.2 Injector
An injector is placed next to the pump. The simplest method is to use a syringe, and
the sample is introduced to the flow of eluent. Since the precision of LC measurement
is largely affected by the reproducibility of sample injection, the design of injector is
an important factor. The most widely used injection method is based on sampling
loops. The use of autosampler (auto-injector) system is also widely used that allows
repeated injections in a set scheduled-timing.
1.2.3 Column
The separation is performed inside the column; therefore, it can be said that the
column is the heart of an LC system. The packing material generally used is silica or
polymer gels. The eluent used for LC varies from acidic to basic solvents. Most
column housing is made of stainless steel, since stainless is tolerant towards a large
variety of solvents. However, for the analysis of some analytes such as biomolecules
Page 7
Chapter-1 Introduction
Dept of Pharmaceutical Analysis 4 EGS Pillay College of Pharmacy
and ionic compounds, contact with metal is not desired, thus polyether ether ketone
(PEEK) column housing is used instead.
Table 1 - COLUMN SELECTION FLOW CHART
Sample LC mode Column choice
Reverse Phase-ion pair
(allows neutral and charged
compounds to be
simultaneously analyzed)
C18, C8, C6, C4, C2, TMS,
CN, amino (not for
carbonyl compounds),
phenyl, Hamilton PRP-1
(pH 1-13)
Basic or
Acidic
Ion suppression
C18, C8, C6, C4, C2, TMS,
CN, amino (not for
carbonyl compounds),
phenyl, Hamilton PRP-1
(pH 1-13)
Ionizable Ion Exchange
Anionic Strong Anion exchange
Cationic Strong Cation exchange
Normal phase Increasing polarity of
bonded phases diol
CN
Neutral NH2
Silica
Reverse phase Alumina
Increasing polarity of
bonding phase
C18
C8
Phenyl
C2
TMS
CN
Page 8
Chapter-1 Introduction
Dept of Pharmaceutical Analysis 5 EGS Pillay College of Pharmacy
1.2.4 Detector
Separation of analytes is performed inside the column, whereas a detector is used to
observe the obtained separation. The composition of the eluent is consistent when no
analyte is present. While the presence of analyte changes the composition of the
eluent. What detector does is to measure these differences. This difference is
monitored as a form of electronic signal. (Snyder L.R, Kirkland J.J 1983)
1.2.5 On-line detectors:
Refractive index
UV/Vis Fixed wavelength
UV/Vis Variable wavelength
UV/Vis Diode array
Fluorescence
Conductivity
Mass-spectrometric (LC/MS)
Evaporative light scattering
1.2.6 Off-line detector:
FTIR spiral disk monitor; requires sample transfer on the germanium disk and
the following scanning in FTIR instrument.
1.2.7 Recorder
The change in eluent detected by a detector is in the form of electronic signal, and
thus it is still not visible to our eyes. Nowadays, computer based data processor
(integrator) is more common. There are software that are specifically designed for LC
system. It provides not only data acquisition, but features like peak-fitting, base line
correction, automatic concentration calculation, molecular weight determination, etc.
Page 9
Chapter-1 Introduction
Dept of Pharmaceutical Analysis 6 EGS Pillay College of Pharmacy
1.2.8 Degasser
The eluent used for LC analysis may contain gases such as oxygen that are non-
visible to our eyes. When gas is present in the eluent, this is detected as a noise and
causes unstable baseline. Generally used method includes sparging (bubbling of inert
gas), use of aspirator, distillation system, and/or heating and stirring. However, the
method is not convenient and also when the solvent is left for a certain time period
(e.g., during the long analysis), gas will dissolve back gradually. Degasser uses
special polymer membrane tubing to remove gases. The numerous very small pores
on the surface of the polymer tube allow the air to go through while preventing any
liquid to go through the pore. By placing this tubing under low pressure container, it
created pressure differences inside and outside the tubing (higher inside the tubing).
This difference let the dissolved gas to move through the pores and remove the gas.
Compared to classical batch type degassing, the degasser can be used on-line, it is
more convenient and efficient.
1.2.9 Column Heater
The LC separation is often largely influenced by the column temperature. Also for
some analysis, such as sugar and organic acid, better resolutions can be obtained at
elevated temperature (50~80°C). It is also important to keep stable temperature to
obtain repeatable results even it is analyzed at around room temperature. There are
possibilities that small different of temperature causes different separation results.
Thus columns are generally kept inside the column oven (column heater).
Page 10
Chapter-1 Introduction
Dept of Pharmaceutical Analysis 7 EGS Pillay College of Pharmacy
1.3 Introduction To HPLC Method Development
Method development has following steps: (Willard H.H, Merritt L.L, Dean J.A.
and settle F.A,7th
Edn)
A good method development strategy should require only as many experimental runs
as are necessary to achieve the desired final result. Finally method development
should be as simple as possible, and it should allow the use of sophisticated tools such
as computer modelling. (Synder K.L, Krikland J.J and Glajch J.L, 1983).
Collect information on sample, define separation goals
Need for special HPLC procedure, sample pretreatment, etc.
Choose detector and detector settings
Choose LC method, preliminary run, select best separation conditions
Optimize separation conditions
Check for problems
Quantitative calibration
Recover purified material Qualitative method
Validate method for release to routine laboratory
Page 11
Chapter-1 Introduction
Dept of Pharmaceutical Analysis 8 EGS Pillay College of Pharmacy
1.4 Important factors to obtain reliable method
The important factors, which are to be taken into account to obtain reliable
quantitative analysis, are:
1. Careful sampling and sample preparation.
2. Appropriate choice of the column.
3. Choice of the operating conditions to obtain the adequate resolution of the
mixture.
4. Reliable performance of the recording and data handling systems.
5. Suitable integration/peak height measurement technique.
6. The mode of calculation best suited for the purpose
7. Validation of the developed method.
1.4.1 Careful Sampling And Sample Preparation
Before beginning method development, it is need to review what is known about the
sample in order to define the goals of separation. The sample related information that
is important is summarized in following Table 2
Table: 2
Number of compounds present
Chemical structures
Molecular weights of compounds
pKa values of compounds
UV spectra of compounds
Concentration range of compounds in samples of interest
Sample solubility
Page 12
Chapter-1 Introduction
Dept of Pharmaceutical Analysis 9 EGS Pillay College of Pharmacy
The chemical composition of the sample can provide valuable clues for the best
choice of initial conditions for an HPLC separation.
1.4.2 Separation Goals (Snyder et al., 1997, Sharma B.K., 1980)
The goals of HPLC separation need to be specified clearly, which include:
The use of HPLC to isolate purified sample components for spectral
identification or quantitative analysis.
It may be necessary to separate all degradants or impurities from a product for
reliable content assay.
In quantitative analysis, the required levels of accuracy and precision should be
known (a precision of 1 to 2% is usually achievable).
Whether a single HPLC procedure is sufficient for raw material or one or more
different procedures are desired for formulations.
When the number of samples for analysis at one time is greater than 10, a run
time of less than 20 minutes often will be important.
1.4.3 Sample preparation
Samples come in various forms:
Solutions ready for injection
Solutions that require dilution, buffering, addition of an internal standard or
other volumetric manipulation
Solids must be dissolved or extracted
Samples that require pretreatment to remove interferences and/or protect the
column or equipment from damage.
Most samples for HPLC analysis require weighing and /or volumetric dilution before
injection. Best results are often obtained when the composition of the sample solvent
Page 13
Chapter-1 Introduction
Dept of Pharmaceutical Analysis 10 EGS Pillay College of Pharmacy
is close to that of the mobile phase since this minimizes baseline upset and other
problems. Some samples require a partial separation (pretreatment) prior to HPLC,
because of need to remove interferences, concentrate sample analytes or eliminate
“column killers”.
The samples may be of two types, regular or special. The regular samples are typical
mixtures of small molecules (<2000Da) that can be separated by normal starting
conditions. Whereas special samples are better separated under customized conditions
given in Table: 3
Table 3
Sample Requirements
Inorganic ions Detection is primary problem; use ion chromatography.
Isomers Some isomers can be separated by reversed-phase HPLC
and are then classified as regular samples; better separations
of isomers are obtained using either (1) normal-phase HPLC
or (2) reversed-phase separations with cyclodextrin-silica
columns.
Enantiomers These compounds require “chiral” conditions for their
separation.
Biological Several factors make samples of this kind “special”:
molecular conformation, polar functionality, and a wide
range of hydrophobicity.
Macromolecules “Big” molecules require column packings with large pores
(>>10-nm diameters); in addition, biological molecules
require special conditions as noted above.
Page 14
Chapter-1 Introduction
Dept of Pharmaceutical Analysis 11 EGS Pillay College of Pharmacy
1.4.4 Choice of the Column
The selection of the column in HPLC is somewhat similar to the selection of
columns in G.C, in the sense that, in the adsorption and partition modes, the
separation mechanism is based on inductive forces, dipole-dipole interactions and
hydrogen bond formation. In case of ion-exchange chromatography, the separation is
based on the differences in the charge, size of the ions generated by the sample
molecules and the nature of ionisable group on the stationary phase. In the case of
size-exclusion chromatography the selection of the column is based on the molecular
weight and size of the sample components. Selection of columns based on the method
is briefly summarized in Table 4.
Table: 4
Method/ Description/Columns Preferred Method
Reversed-phase HPLC
Uses water- organic mobile phase
Columns: C18 (ODS), C8, phenyl,
trimethylsilyl (TMS), cyano.
First choice for most samples, especially
neutral or non-ionized compounds that
dissolve in water-organic mixtures
Ion-pair HPLC
Uses water-organic mobile phase,
a buffer to control pH, and an
Ion-pair reagent
Columns: C18, C8, Cyano
Acceptable choice for ionic or ionisable
compounds, especially bases or cations.
Page 15
Chapter-1 Introduction
Dept of Pharmaceutical Analysis 12 EGS Pillay College of Pharmacy
Method/ Description/Columns Preferred Method
Normal-phase HPLC
Uses mixtures of organic solvents as
mobile phase Columns: cyano, diol,
amino, silica
Good second choice when reversed-
phase or ion-pair HPLC is ineffective;
first choice for lipophilic samples that do
not dissolve well in water-organic
mixtures; first choice for mixtures of
isomers and for preparative HPLC
1.4.5 Operating conditions to obtain the adequate resolution of the mixture
Most of the drugs come under the category of regular samples. Regular samples mean
typical mixtures of small molecules (<2000Da) that can be separated using more or
less standardized starting conditions. Regular samples can be further classified as
neutral or ionic. Samples classified as ionic include acids, bases, amphoteric
compounds and organic salts. If the sample is neutral, buffers or additives are
generally not required in the mobile phase.
Acids or bases usually require the addition of a buffer to the mobile phase. For basic
or cationic samples, less acidic reverse phase columns are recommended. Based on
recommendations of the conditions, the first exploratory run is carried and then
improved systematically. On the basis of the initial exploratory run isocratic or
gradient elution can be selected as most suitable. If typical reverse-phase conditions
provided inadequate sample retention, it suggests the use of either ion-pair or normal
phase HPLC. Alternatively, the sample may be strongly retained with 100% ACN as
Page 16
Chapter-1 Introduction
Dept of Pharmaceutical Analysis 13 EGS Pillay College of Pharmacy
mobile phase suggesting the use of non-aqueous reverse phase chromatography or
normal phase HPLC.
1.4.6 Method Development
One approach is to use an isocratic mobile phase of some average organic solvent
strength (50%). A better alternative is to use a very strong mobile phase first
(80-100%) then reduce %B as necessary. The initial separation with 100% B results in
rapid elution of the entire sample, but few groups will separate. Decreasing the
solvent strength shows the rapid separation of all components with a much longer run
time, with a broadening of latter bands and reduced retention sensitivity. Goals that
are to be achieved in method development are briefly summarized in Table 5.
Table: 5
Goal Comment
Resolution Precise and rugged quantitative analysis requires that Rs be
greater than 1.5.
Separation time <5-10 min is desirable for routine procedures.
Quantitation 2% for assays; 5% for less-demanding analyses
15% for trace analyses.
Pressure <150 bar is desirable, <200 bar is usually essential (new column
assumed).
Peak height Narrow peaks are desirable for large signal/noise ratios.
Solvent
consumption
Minimum mobile-phase use per run is desirable.
Page 17
Chapter-1 Introduction
Dept of Pharmaceutical Analysis 14 EGS Pillay College of Pharmacy
Separation or resolution is a primary requirement in quantitative HPLC. The
resolution (Rs) value should be maximum (Rs > 1.5) favors maximum precision.
Resolution usually degrades during the life of the column and can vary from day to
day with minor fluctuations in separation conditions. Therefore, values of Rs=2 or
greater should be the goal during method development for sample mixtures. Such
resolution will favor both improved assay precision and greater method ruggedness.
Some HPLC assays do not require base line separation of the compounds of
interest (qualitative analysis). In such cases only enough separation of individual
components is required to provide characteristic retention times for peak
identification.
The time required for a separation (runtime = retention time for base band)
should be as short as possible and the total time spent on method development is
reasonable (runtimes 5 to 10 minutes are desirable).
Conditions for the final HPLC method should be selected so that the operating
pressure with a new column does not exceed 170 bar (2500 psi) and an upper pressure
limit below 2000 psi is desirable. There are two reasons for this pressure limit, despite
the fact that most HPLC equipment can be operated at much higher pressures. First,
during the life of a column, the backpressure may rise by a factor of as much as 2 due
to the gradual plugging of the column by particulate matter. Second, at lower
pressures (<170 bars) pumps, sample valves and especially auto samplers operate
much better, seals last longer, columns tend to plug less and system reliability is
significantly improved. For these reasons, a target pressure of less than 50 % of the
maximum capability of the pump is desirable. When dealing with more challenging
Page 18
Chapter-1 Introduction
Dept of Pharmaceutical Analysis 15 EGS Pillay College of Pharmacy
samples or if the goals of separation are particularly stringent, a large number of
method development runs may be required to achieve acceptable separation.
1.4.7 Repeatable Separation
As the experimental runs described above are being carried out, it is important to
confirm that each chromatogram can be repeated. When we change conditions
(mobile phase, column, and temperature) between method development experiments,
enough time must elapse for the column to come into equilibrium with the new
mobile phase and temperature.
Usually column equilibration is achieved after passage of 10 to 20 volumes of the new
mobile phase through the column. However, this should be confirmed by repeating
the experiment under the same conditions. When constant retention times are
observed in two such back-to-back repeat experiments (± 0.5% or better), it can be
assumed that the column is equilibrated and the experiments are repeatable.
1.4.8 Optimization of HPLC Method
During the optimization stage, the initial sets of conditions that have evolved from the
first stages of development are improved or maximized in terms of resolution and
peak shape, plate counts, asymmetry, capacity factor, elution time, detection limits,
limit of quantitation and overall ability to quantify the specific analyte of interest.
Optimization of a method can follow either of two general approaches:
Manual
Computer driven
The manual approach involves varying one experimental variable at a time, while
holding all other constant and recording changes in response. The variables might
include flow rate, mobile or stationary phase composition, temperature, detection
Page 19
Chapter-1 Introduction
Dept of Pharmaceutical Analysis 16 EGS Pillay College of Pharmacy
wavelength and PH. This approach to system is slow, time consuming and potentially
expensive. However, it may provide a much better understanding of the principles and
theory involved and of interactions of the variables.
In the second approach, computer driven automated method development,
efficiency is optimized while experimental input is minimized. This approach reduce
the time, energy and cost of all instrumental method development.
The various parameters that include to be optimized during method development are
A. Selection of mode of separation.
B. Selection of stationary phase.
C. Selection of mobile phase.
D. Selection of detector.
1.4.8.1 Selection Of Mode Of Separation
In reverse phase mode, the mobile phase is comparatively more polar than the
stationary phase. For the separation of polar or moderately polar compounds, the most
preferred mode is reverse phase. The nature of the analyte is the primary factor in the
selection of the mode of separation .A second factor is the nature of the matrix.
1.4.8.2 Selection of stationary phase
Selection of the column is the first and the most important step in method
development. The appropriate choice of separation column indicates three different
approaches.
Selection of separation
The particle size and nature of the column packing
The physical parameters of the column i.e. the length and the diameter
Page 20
Chapter-1 Introduction
Dept of Pharmaceutical Analysis 17 EGS Pillay College of Pharmacy
Some of the important parameters considered while selecting chromatographic
columns are
Length and diameter of the column
Packing material
Shape of the particles
Size of the particles
% of Carbon loading
Pore volume
Surface area
Reproducibility and reliability
End capping
In this case, the column selected had a particle size of 5µm and an internal diameter of
4.6mm.The column is selected depending on the nature of the solute and the
information about the analyte. Reversed phase mode of chromatography facilities a
wide range of columns like dimethyl silane (C2), butysilane (C4), octysilane(C8),
octadecylsane (C18),base deactivated silane (C18), BDS phenyl, cyanoproply (CN),
nitro, amino etc. Silica based columns with different cross linking’s in the increasing
order of Polarity are as follows:
<…………. Non-polar …………… moderately polar…………. Polar. ……>
C18 < C8 < C6 < Phenyl < Amino < Cyano < Silica
C18 was chosen for this study since it is most retentive one. The sample
manipulation becomes easier with this type of column. Generally longer columns
Page 21
Chapter-1 Introduction
Dept of Pharmaceutical Analysis 18 EGS Pillay College of Pharmacy
provide better separation due to higher theoretical plate numbers. Columns with 5µm
particle size give the best compromise of efficiency.
Peak shape is equally important in method development. Columns that provide
symmetrical peaks are always preferred while peaks with poor asymmetry can result
in,
Inaccurate plate number and resolution measurement
Imprecise quantitation
Degraded and undetected minor bands in the peaks tail
Poor retention reproducibility
A useful and practical measurement of peak shape is peak asymmetry factor
and peak tailing factor. Peak asymmetry is measured at 10% of full peak height and
peak tailing factor at 5%. Reproducibility of retention times and capacity factor is
important for developing a rugged and repeatable method.
A column which gives separation of all the impurities and degradants from
each other and from analyte peak and which is rugged for variation in mobile phase
shall be selected.
1.4.8.3 Selection Of Mobile Phase
The primary objective in selection and optimization of mobile phase is to achieve
optimum separation of all the individual impurities and degradants from each other
and from analyte peak.
In liquid chromatography, the solute retention is governed by the solute
distribution factor, which reflects the different interactions of the solute-stationary
phase, solute-mobile phase, and mobile phase-stationary phase. For a given stationary
phase, the nature and the composition of which has to be judiciously selected in order
Page 22
Chapter-1 Introduction
Dept of Pharmaceutical Analysis 19 EGS Pillay College of Pharmacy
to get appropriate and required solute retention. The mobile phase has to be adapted in
terms of elution strength (solute retention) and solvent selectivity (solute separation).
Solvent polarity is the key word in chromatographic separations since a polar mobile
phase will give rise to low solute retention in normal phase and high solute retention
in reverse phase LC. The selectivity will be particularly altered if the buffer pH is
close to the pKa of the analytes. The following are the parameters, which shall be
taken into consideration while selecting and optimizing the mobile phase.
Buffer
pH of the buffer
Mobile phase composition
1.4.8.4 Buffers if any and its strength:
Buffer and its strength play an important role in deciding the peak symmetries and
separations. Some of the most commonly employed buffers are
Phosphate buffers prepared using salts like KH2PO4, K2HPO4, NaH2PO4,
Na2HPO4.
Phosphoric acid buffers prepared using H3PO4.
Acetate buffers-Ammonium acetate, Sodium acetate etc.
Acetic acid buffers prepared using CH2COOH.
The retention also depends on the molar strengths of the buffer-Molar strength is
increasingly proportional to retention times. The strength of the buffer can be
increased, if necessary to achieve the required separations. The solvent strength is a
measure of its ability to pull analyte from the column. It is generally controlled by the
concentration of the solvent with the highest strength. The useful pH range for
Page 23
Chapter-1 Introduction
Dept of Pharmaceutical Analysis 20 EGS Pillay College of Pharmacy
columns is 2 to 8, since siloxane linkages are cleaved below pH-2 while at pH values
above eight, silica may dissolve.
1.4.8.5 Mobile phase composition:
Most chromatographic separations can be achieved by choosing the optimum mobile
phase composition. This is due to the fact that fairly large amount of selectivity can be
achieved by choosing the qualitative and quantitative composition of aqueous and
organic portions. Most widely used solvents in reverse phase chromatography are
Methanol and Acetonitrile. Experiments should be conducted with mobile phases
having buffers with different pH and different organic phases to check for the best
separations of analyte peak. A mobile phase which gives separation of analyte peak
and which is rugged for variation of both aqueous and organic phase by at least ±
0.2% of the selected mobile phase composition should be used.
1.4.8.6 Selection Of Detector
The detector was chosen depending upon some characteristic property of the analyte
like UV absorbance, florescence, conductance, oxidation, reduction etc. The
characteristics that are to be fulfilled by a detector to be used in HPLC determination
are,
High sensitivity facilitating trace analysis.
Negligible baseline noise to facilitate lower detection.
Large linear dynamic range.
Low dead volume.
Inexpensive to purchase and operate.
Pharmaceutical ingredients do not absorb all UV light equally, so that selection of
detection wavelength is important. An understanding of the UV light absorptive
Page 24
Chapter-1 Introduction
Dept of Pharmaceutical Analysis 21 EGS Pillay College of Pharmacy
properties of the organic impurities and the active pharmaceutical ingredient is very
helpful. For the greatest sensitivity λmax should be used. Ultra violet wavelengths
below 200nm should be avoided because detector noise increases in this region.
Higher wavelengths give greater selectivity.
1.4.8.7 Performance Calculations
Carrying out system suitability experiment does the performance calculations.
System suitability experiments can be defined as tests to ensure that the method can
generate results of acceptable accuracy and precision. The requirements for system
suitability are usually developed after method development and validations have been
completed. The criteria selected will be based on the actual performance of the
method as determined during its validation. For example, if sample retention times
form part of the system suitability criteria, their variation SD can be determined
during validation.
System suitability might then require that retention times fall within a ±3 SD
range during routine performance of the method.
The USP (2000) defines parameters that can be used to determine system
suitability prior to analysis include plate number (n), tailing factor (T), resolution (RS)
and relative standard deviation (RSD) of peak height or peak area for respective
injections.
The RSD of peak height or area of five injections of a standard solution is
normally accepted as one of the standard criteria. For assay method of a major
component, the RSD should typically be less than 1% for these five respective
injections.
Page 25
Chapter-1 Introduction
Dept of Pharmaceutical Analysis 22 EGS Pillay College of Pharmacy
The plate number and/ or tailing factor are used if the run contains only one
peak. For chromatographic separations with more than one peak, such as an internal
standard assay or an impurity method expected to contain many peaks, some measure
of separations such as RS is recommended. Reproducibility of tR or k value for a
specific compound also defines system performance.
The column performance can be defined in terms of column plate number. As
the plate count is more the column is more efficient.
1.4.9 METHOD VALIDATION
The word “Validation” means “Assessment” of validity or action of proving
effectiveness.
1.4.9.1 Definition
ICH defines validation as “establish the documented evidence which provides a high
degree of assurance that a specific process will consistently produce a product of
predetermined specifications and quantity attributes”.
Method validation is the process to confirm that the analytical procedure
employed for a specific test is suitable for its intended use. Methods need to be
validated or revalidated.
Before their introduction into routine use
Whenever the conditions change for which the method has been validated, e.g.,
instrument with different characteristics
Whenever the method is changed, and the change is outside the original scope of
the method.
Page 26
Chapter-1 Introduction
Dept of Pharmaceutical Analysis 23 EGS Pillay College of Pharmacy
1.4.9.2 Purpose Of Validation
Enable the scientists to communicate scientifically and effectively on technical
matter.
Setting the standards of evaluation procedures for checking compliance and taking
remedial action.
Economic: Reduction in cost associated with process sampling and testing.
As quality of the product cannot always be assured by routine quality control
because of testing of statistically insignificant number of samples.
Retrospective validation is useful for trend comparison of results compliance to
CGMP/CGLP.
Closure interaction with Pharmacopoeial forum to address analytical problems.
International Pharmacopoeial harmonization particularly in respect of impurities
determination and their limits.
Method validation is completed to ensure that an analytical methodology is accurate,
specific, reproducible and rugged over the specified range that an analyte will be
analyzed. Method validation provides an assurance of reliability during normal use,
and is sometime referred to as "the process of providing documented evidence that the
method does what it is intended to do."
For method validation, these specifications are listed in USP Chapter <1225>, and can
be referred to as the "Eight Steps of Method Validation," as shown in figure below.
These terms are referred to as "analytical performance parameters", or sometimes
as "analytical figures of merit."
Page 27
Chapter-1 Introduction
Dept of Pharmaceutical Analysis 24 EGS Pillay College of Pharmacy
The USP Eight Steps of Method Validation
In response to this situation, one of the first harmonization projects taken up by the
ICH was the development of a guideline on the "Validation of Analytical Methods:
Definitions and Terminology." ICH divided the "validation characteristics" somewhat
differently, as outlined in Figure below
ICH Method Validation Parameters
Page 28
Chapter-1 Introduction
Dept of Pharmaceutical Analysis 25 EGS Pillay College of Pharmacy
1.4.9.3 Method Validation Parameters
The developed methods were validated by following steps:
A. Accuracy
It is defined as closeness of agreement between the actual (true) value and mean
analytical value obtained by applying a test method number of times. Spike and
recovery studies are performed to measure accuracy: a known sample is added to the
excipients and the actual drug value is compared to the value found by the assay.
Accuracy is expressed as the bias or the % error between the observed value and the
true value (assay value/actual value x 100%).
The accuracy is acceptable if the difference between the true value and mean
measured value does not exceed the RSD values obtained for repeatability of the
method.
The parameter provides information about the recovery of the drug from sample and
effect of matrix, as recoveries are likely to be excessive as well as deficient.
Procedure:
Use a minimum of 3 spiking concentrations in the excipient solution. Prepare
two samples of each concentration. Test the 6 samples in triplicate on one run.
Measure expected vs. average measured value. Calculate the % recovery.
B. Precision
The precision of an analytical method is the degree of agreement among individual
test results when the method is applied repeatedly to multiple sampling of
homogenous sample.
Precision is the measure of the degree of repeatability of an analytical method under
normal operation and is normally expressed as the percent relative standard deviation
Page 29
Chapter-1 Introduction
Dept of Pharmaceutical Analysis 26 EGS Pillay College of Pharmacy
(%RSD) or coefficient of variation (% CV) for a statistically significant number of
samples. According to the ICH, precision should be performed at three different
levels: repeatability, intermediate precision, and reproducibility.
Repeatability is the results of the method operating over a short time interval under
the same conditions (or) is the % RSD of multiple determinations of a single sample
in a single test run (intra-assay precision). It should be determined from a minimum of
nine determinations covering the specified range of the procedure (for example, three
levels, three repetitions each) or from a minimum of six determinations at 100% of
the test or target concentration.
Procedure :
Prepare three dilutions of the sample (high/medium/low concentrations in the
range).
Test 10 replicates of each dilution of the sample.
Calculate the average and standard deviation for each point on the curve.
Calculate the RSD for each point on the curve.
Intermediate precision is the results from within lab variations due to random events
such as different days, analysts, equipment, etc. In determining intermediate
precision, experimental design should be employed so that the effects (if any) of the
individual variables can be monitored (or) intermediate precision (also called inter-
assay precision) measures the % RSD for multiple determinations of a single sample,
controls and reagents analyzed in several assay runs in the same laboratory.
Procedure:
Prepare three dilutions of the sample (high/medium/low concentrations in the
range).
Page 30
Chapter-1 Introduction
Dept of Pharmaceutical Analysis 27 EGS Pillay College of Pharmacy
Test triplicates of each dilution of the sample in three different assays.
Do for day-to-day variations
Do for lot-to-lot variations of assay materials
Do for technician-to-technician variation.
Calculate the average and standard deviation for each point on the curve for each
individual test.
Calculate the RSD for each point on the curve between the assay runs.
Reproducibility refers to the precision between laboratories usually in collaborative
studies and not directly relevant to assay validation in a manufacturing facility.
Documentation in support of precision studies should include the standard deviation,
relative standard deviation, coefficient of variation, and the confidence interval.
C. Specificity
It is the ability of an analytical method to assess unequivocally the analyte of interest
in the presence of components that may be expected to be present, such as impurities,
degradation products and matrix components. It is not possible to demonstrate that an
analytical procedure is specific for a particular analyte. In such case a combination of
two or more analytical procedure is recommended to achieve the necessary level of
discrimination. Lack of specificity of an individual analytical procedure may be
compensated by other supporting analytical procedures or tests.
In case of the assay, demonstration of specificity requires that the procedure is
unaffected by the presence of impurities or excipients. In practice, this can be done by
spiking the drug substances or product with appropriate levels of impurities or
excipients and demonstrating that the assay is unaffected by the presence of these
extraneous materials. If the degradation product impurity standards are unavailable,
Page 31
Chapter-1 Introduction
Dept of Pharmaceutical Analysis 28 EGS Pillay College of Pharmacy
specificity may be demonstrated by comparing the test results of samples containing
impurities or degradation products to a second well-characterized procedure e.g.,
pharmacopoeia method or other validated analytical procedure (independent
procedure). These comparisons should include samples stored under relevant stress
conditions (e.g. light, heat humidity, acid/base hydrolysis, oxidation, etc.).
D. Limit of Detection
The limit of detection (LOD) is defined as the lowest concentration of an analyte in a
sample that can be detected, not quantitated. It is a limit test that specifies whether or
not an analyte is above or below a certain value. It is expressed as a concentration at a
specified signal-to-noise ratio, usually two- or three-to-one. The ICH has recognized
the signal-to-noise ratio convention, but also lists two other options to determine
LOD: visual non-instrumental methods and a means of calculating the LOD. The
method used to determine LOD should be documented and supported, and an
appropriate number of samples should be analyzed at the limit to validate the level.
Procedure
Prepare a standard concentration of the product in the appropriate solution.
Prepare a blank solution without any sample (zero concentration).
Perform the assay at least 3 times in duplicate according to the SOP.
Measure the amount present in the sample and blank.
Calculate the average for the sample and blank.
Calculate and standard deviation of the blank.
Calculate the LOD as 3.3 x SD /slope of linearity curve.
Page 32
Chapter-1 Introduction
Dept of Pharmaceutical Analysis 29 EGS Pillay College of Pharmacy
E. Limit of Quantitation
The Limit of Quantitation (LOQ) is defined as the lowest concentration of an analyte
in a sample that can be determined with acceptable precision and accuracy under the
stated operational conditions of the method. That is, as the LOQ concentration level
decreases, the precision increases. If better precision is required, a higher
concentration must be reported for LOQ.
Procedure:
The calculation method is again based on the standard deviation of the response (SD)
and the slope of the calibration curve (S) according to the formula: LOQ = 10(SD/S).
Again, the standard deviation of the response can be determined based on the standard
deviation of the blank, on the residual standard deviation of the regression line, or the
standard deviation of y-intercepts of regression lines.
F. Linearity :
It is the ability of an assay to obtain test results, which are directly proportional to the
concentration of an analyte in the sample. The determination of linearity will identify
the range of the analytical assay. It can be measured as slope of the regression line
and its variance or as the coefficient of determination (R2) and correlation
coefficient (R).
Procedure:
Determining the coefficient of correlation R for dilutions of the sample over the range
claimed for the assay.
1. Prepare 6 to 8 sample dilutions across the claimed range
2. Test each dilution in triplicate for 3 runs
3. Record expected values, actual values, and % recoveries for each run
Page 33
Chapter-1 Introduction
Dept of Pharmaceutical Analysis 30 EGS Pillay College of Pharmacy
4. Analyze each set of dilutions as a linear curve and calculate R for each assay.
Alternative:
Calculate the accuracy and precision at each dilution. Range is the highest
and lowest concentration with satisfactory accuracy and precision.
If the validation study for an analytical test is well planned it should be possible to
design the protocol to consider many of the parameters in a single series of tests, for
instance: selectivity (specificity) linearity, range, accuracy and precision for a potency
test.
G. Range:
Range is the interval between the upper and lower levels of analyte (inclusive) that
have been demonstrated to be determined with precision, accuracy and linearity using
the method as written. If the relationship between response and concentration is not
linear, the range may be estimated by means of a calibration curve.
The range is normally expressed in the same units as the test results obtained by the
method. The ICH guidelines specify a minimum of five concentration levels, along
with certain minimum specified ranges. For assay, the minimum specified range is
from 80-120% of the target concentration. For an impurity test, the minimum range is
from the reporting level of each impurity, to 120% of the specification. (For toxic or
more potent impurities, the range should be commensurate with the controlled level).
H. Ruggedness:
Ruggedness, according to the USP, is the degree of reproducibility of the results
obtained under a variety of conditions, expressed as %RSD. The ruggedness of an
analytical method is the degree of reproducibility of test results obtained by the
analysis of the same samples under a variety of conditions such as different
Page 34
Chapter-1 Introduction
Dept of Pharmaceutical Analysis 31 EGS Pillay College of Pharmacy
laboratories, different analysts, different instruments, different lots of reagents,
different elapsed assay times, different assay temperatures, different days, etc.
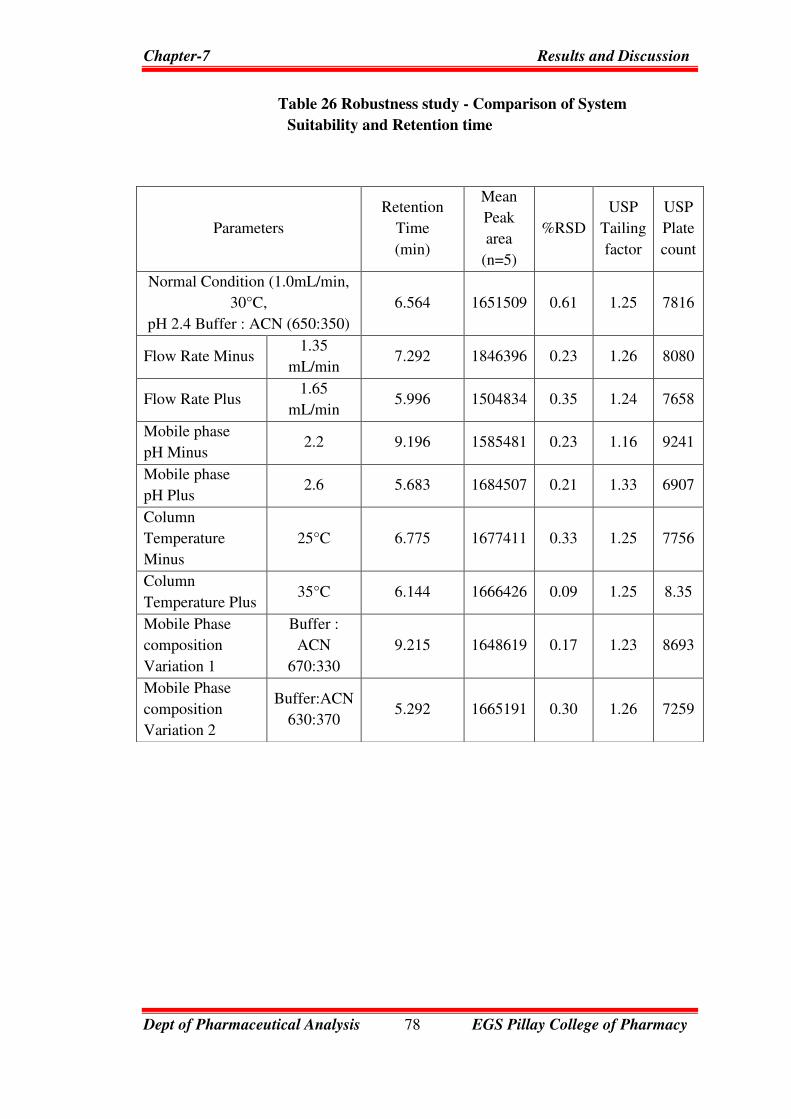
I. Robustness:
ICH defines robustness as a measure of the method's capability to remain unaffected by
small, but deliberate variations in method parameters. Robustness can be partly assured
by good system suitability specifications. The evaluation of robustness should be
considered during the development phase and depends on the type of procedure under
study. It should show the reliability of an analysis with respect to deliberate variations
in method parameters. If the results of a method or other measurements are susceptible
to variations in method parameters, these parameters should be adequately controlled
and a precautionary statement included in the method documentation. One consequence
of the evaluation of robustness should be that a series of system suitability parameters
(e.g., resolution test) is established to ensure that the validity of the analytical
procedure is maintained whenever used.
Examples of typical variations are:
Stability of analytical solutions
Extraction time
In the case of liquid chromatography, examples of typical variations are
Influence of variations of pH in a mobile phase
Influence of variations in mobile phase composition
Different columns (different lots and/or suppliers)
Temperature
Flow rate.
In the case of gas-chromatography, examples of typical variations are
Page 35
Chapter-1 Introduction
Dept of Pharmaceutical Analysis 32 EGS Pillay College of Pharmacy
Different columns (different lots and/or suppliers)
Temperature
Flow rate.
J. System Suitability Test (SST)
SST is commonly used to verify resolution, column efficiency, and repeatability of
the chromatographic system to ensure its adequacy for a particular analysis.
According to the United States pharmacopoeia (USP) and the International
Conference on Harmonization (ICH), SST is an integral part of many analytical
procedure.
Primary SST parameters are most important as they indicate system specificity,
precision and column stability. Other parameter include capacity factor (K) and signal
to noise ratio (S/N) for impurity peaks.
The USP chromatography general chapter states (USP 36–NF 31, 621 –
Chromatography)
“System suitability tests are an integral part of gas and liquid chromatographic
methods. They are used to verify that the resolution and reproducibility of the
chromatographic system are adequate for the analysis to be done. The tests are based
on the concept that the equipment, electronics, analytical operations and samples to be
analyzed constitute an integral system can be evaluated as such.”
1.5 Interpretation Of Chromatograms
Figure below represents a typical chromatographic separation of two substances, 1 and
2, where t1 and t2 are the respective retention times; and h, h/2, and Wh/2 are the height,
the half-height, and the width at half-height, respectively, for peak 1. W1 and W2 are
Page 36
Chapter-1 Introduction
Dept of Pharmaceutical Analysis 33 EGS Pillay College of Pharmacy
the respective widths of peaks 1 and 2 at the baseline. Air peaks are a feature of gas
chromatograms and correspond to the solvent front in liquid chromatography.
Figure - 1
Chromatographic retention times are characteristic of the compounds they represent
but are not unique. Coincidence of retention times of a test and a reference
substance can be used as a feature in construction of an identity profile but is
insufficient on its own to establish identity. Absolute retention times of a given
compound vary from one chromatogram to the next.
1.5.1 Relative Retention times:
Relative retention time is calculated by the equation Rr = t2/t1
t2 = Retention time of test.
t1 = Retention time of reference substance, determined under identical
experimental conditions on the same column.
1.5.2 Relative Retention:
t2- tM
To calculate the relative retention (r) : -------------
t1- tM
where tM is the retention time of the non-retained marker.
Page 37
Chapter-1 Introduction
Dept of Pharmaceutical Analysis 34 EGS Pillay College of Pharmacy
1.5.3 Resolution (as per USP) :
The resolution, R, is a function of column efficiency, N, and is specified to ensure that
closely eluting compounds are resolved from each other, to establish the general
resolving power of the system, and to ensure that internal standards are resolved
from the drug.
Figure - 2
R is determined by the equation:
2(t2 - t1)
R =
W2 + W1
Or
2(t2 - t1)
R =
1.70 (W1, h/2 + W2, h/2)
t2 and t1 are the retention times of the two components.
W2 and W1 are the corresponding width at the bases of the peaks obtained by
extrapolating the relatively straight sides of the peaks to the base line.
W1h/2 and W2 h/2 are the corresponding peak width at half-height.
Page 38
Chapter-1 Introduction
Dept of Pharmaceutical Analysis 35 EGS Pillay College of Pharmacy
1.5.4 Resolution (as per Ph.Eur) :
Where, tR2 > tR1
tR2 and tR1 = Retention times or distances along the baseline from the point of
injection to the perpendiculars dropped from the maxima of two adjacent peaks
Wh1 and Wh2 = peak width at half height
1.5.5 Theoretical Plates (as per USP and Ph.Eur)
Column efficiency also may be specified as system suitability requirements, especially
if there is only one peak of interest in the chromatograms. The number of the
theoretical plates, N, is a measure of column efficiency. It is calculated by the
equation.
t = Retention time of the substance.
w = width of the peak at its base, obtained by extrapolating the relatively
straight sides of the peak to the baseline.
w½ = Peak width at half-height.
1.5.6 Precision:
Precision a measure of either degree of reproducibility or of repeatability is
determined by making replicate injections of standard preparation and calculating
relative standard deviation. Unless otherwise specified in the individual monograph,
data from five replicate injections of the standard preparation are used to calculate
1.18(tR2 - tR1)
R =
(Wh1 + W h2)
Page 39
Chapter-1 Introduction
Dept of Pharmaceutical Analysis 36 EGS Pillay College of Pharmacy
the relative standard deviation (SR), if the requirement is 2.0% or less; data from six
replicate injections are used if the relative standard deviation requirement is more than
2.0%.
Relative Standard Deviation in percentage.
x = Arithmetic mean of the set.
xi = An individual measurement in a set of N measurements.
N = Number of individual values
1.5.7 Tailing Factor as per USP (or) Symmetry factor as per Ph.Eur:
Tailing factor, T, a measure of peak symmetry, is unity for perfectly symmetrical
peaks and its value increases as tailing factor is pronounced (Fig 1). In some cases
values less than unity may be observed. As peak asymmetry increases, integration and
hence precision becomes less reliable.
Figure - 3
W0.05 = Width of peak at 5% height.
f = Distance from the peak maximum to the leading edge of the peak, the distance is
being measured at a point 5% of the peak height from baseline.
Page 40
Chapter-1 Introduction
Dept of Pharmaceutical Analysis 37 EGS Pillay College of Pharmacy
1.5.8 Capacity Factor (Mass distribution ratio):
Capacity factor k’ of a sample component is a measure of the degree which
that component is retained by the column relative to an unretained component
Capacity factor is k’ = (tr - t0) / t0
tr - is the elution time of retained component and
t0 - is the elution time of the unretained sample.
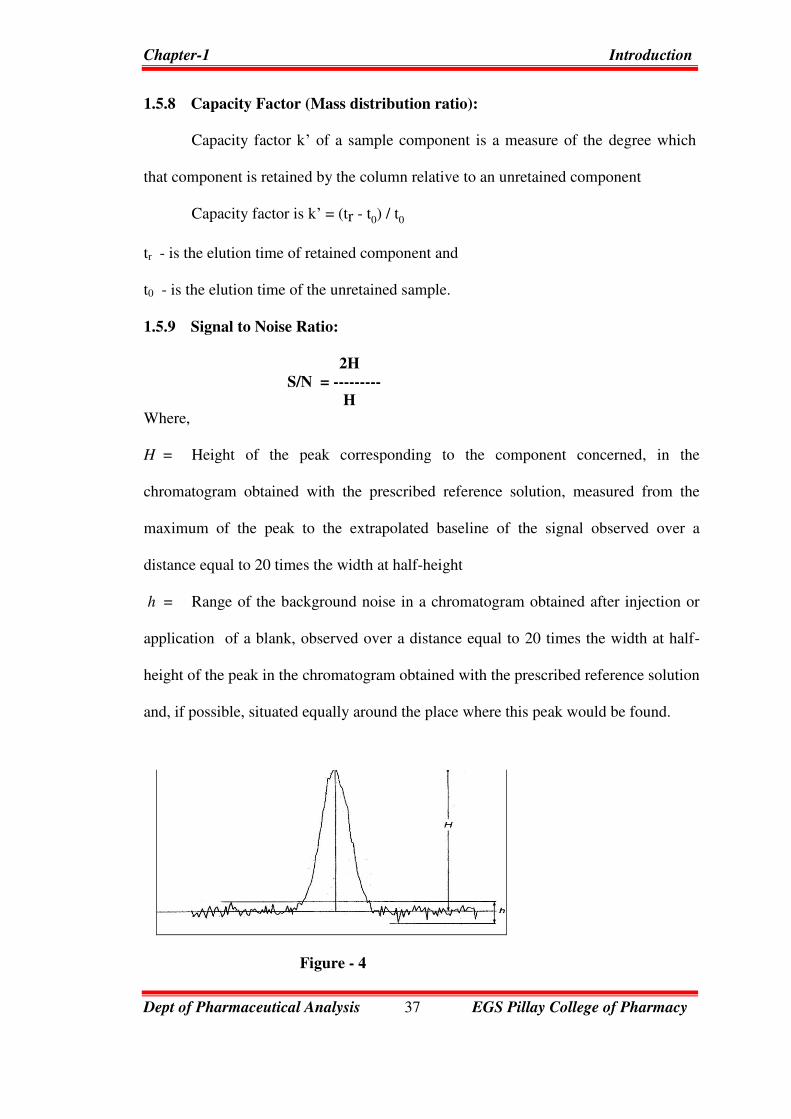
1.5.9 Signal to Noise Ratio:
2H
S/N = ---------
H
Where,
H = Height of the peak corresponding to the component concerned, in the
chromatogram obtained with the prescribed reference solution, measured from the
maximum of the peak to the extrapolated baseline of the signal observed over a
distance equal to 20 times the width at half-height
h = Range of the background noise in a chromatogram obtained after injection or
application of a blank, observed over a distance equal to 20 times the width at half-
height of the peak in the chromatogram obtained with the prescribed reference solution
and, if possible, situated equally around the place where this peak would be found.
Figure - 4
Page 41
Chapter-1 Introduction
Dept of Pharmaceutical Analysis 38 EGS Pillay College of Pharmacy
1.5.10 Peak to valley ratio
The peak-to-valley ratio (p/v) may be employed as a system suitability requirement in
a test for related substances when baseline separation between 2 peaks is not reached
Hp = Height above the extrapolated baseline of the minor peak,
Hv = Height above the extrapolated baseline at the lowest point of the curve
separating the minor and major peaks.
Figure - 5
System Suitability Parameters and Recommendations:
Parameter Recommendation
Capacity Factor (k’) The peak should be well-resolved from other peaks and the
void volume, generally k’>2.0
Repeatability RSD </= 1% for N >/= 5 is desirable
Relative retention Not essential as long as the resolution is stated
Resolution Rs of > 2 between the peak of interest and the closest eluting.
Tailing Factor (T) T of </= 2
Theoretical
Plates(N) In general should be > 2000
Page 42
Chapter-1 Introduction
Dept of Pharmaceutical Analysis 39 EGS Pillay College of Pharmacy
1.6 Statistical Parameters
1.6.1 Linear regression:
Once a linear relationship has been shown to have a high probability by the
value of the correlation coefficient ‘r’, then the best straight line through the data
points has to be estimated. This can often be done be done by visual inspection of the
calibration graph, but in many cases it is far more sensible to evaluate the best straight
line by linear regression (the method of least squares).
The equation of straight line is
y = mx + c
Where, y the dependent variable is plotted as result of changing x, the independent
variable.
To obtain the regression line ‘y on x’ the slope ‘m’ of the line and the intercept
‘c’ on the y axis are given by the following equation.
m = and c =
1.6.2 Correlation coefficient:
When the changes in one variable are associated or followed by changes in the other,
it is called correlation. To establish whether there is a linear relationship between two
variables x1 and y1, use Pearson’s correlation coefficient r.
r =
Where n is the number of data points.
The value of r must lie between +1 and -1, the nearer it is to +1, the greater the
probability that a definite linear relationship exists between the variables x and y,
values close to +1 indicate positive correlation and values close to -1 indicate negative
Page 43
Chapter-1 Introduction
Dept of Pharmaceutical Analysis 40 EGS Pillay College of Pharmacy
correlation values of ‘r’ that tend towards zero indicate that x and y are not linearly
related (they made be related in a non-linear fashion).
1.6.3 Standard deviation:
The standard deviation measures the spread of the data about the mean value.
It is commonly used in statistics as a measure of precision statistics as a measure of
precision and is more meaningful than is the average deviation. It may be thought of
as a root-mean-square deviation of values from their average and is expressed
mathematically as
1N
xx
S
ni
1i
i
Where,
S is standard deviation.
If N is large (50 or more) then of course it is immaterial whether the term in the
denomination is N -1 or N
Σ = sum
x = observed values
x = Mean or arithmetic average= X/N
x -x = deviation of a value from the mean
N = Number of observations
1.6.4 Percentage relative standard deviation (%RSD):
It is also known as coefficient of variation CV. It is defined as the standard
deviation (S.D) expressed as the percentage of mean.
C 100x
S.DRSD %or V
Page 44
Chapter-1 Introduction
Dept of Pharmaceutical Analysis 41 EGS Pillay College of Pharmacy
Where, S.D = standard deviation,
x = Mean or arithmetic average.
The variance is defined as S2 and is more important in statistics than S itself.
However, the latter is much more commonly used with chemical data.
1.6.5 Standard Error of mean (S.E.):
Standard error of mean can be defined as the value obtained by division of
standard deviation by square root of number of observations. It is mathematically
expressed as n
S.D.S.E.
Where, n = number of observations.
S.D = Standard deviation
1.7 Data elements required for assay validation:
It is not always necessary to evaluate every analytical performance parameter, as
different test methods require different validation schemes. The Most common
categories of assays for which validation data should be required are as follows:
i) Quantitation of major components or active ingredients.
ii) Determination of impurities or degradation compounds.
iii) Determination of performance characteristics
Category-I: Analytical methods for quantitation of major components of bulk drug
substances or active ingredients (including preservatives) in finished pharmaceutical
products.
Category-II: Analytical methods for determination of impurities in bulk drug
substances or degradation compounds in finished pharmaceutical products. These
methods includes quantitative assays and limit tests.
Page 45
Chapter-1 Introduction
Dept of Pharmaceutical Analysis 42 EGS Pillay College of Pharmacy
Category-III: Analytical methods for determination of performance characteristics
(e.g. dissolution, drug release).
The type of method and its intended use dictates which parameters are required to be
investigated. They are illustrated in the following Table 6.
Table 6: Data elements required for assay validation
Analytical
Performance
Parameter
Assay
Category-I
Assay category-II Assay
Category-
III Quantitative Limit Test
Accuracy Yes Yes * *
Precision Yes Yes No Yes
Specificity Yes Yes Yes *
LOD No No Yes *
LOQ No Yes No *
Linearity & range Yes Yes No *
Ruggedness Yes Yes Yes *
*may be required, depending on the nature of specific test.
Table 7: Comparison of Analytical Parameters Required for Assay validation
FDA reviewer Guidance USP General Chapter
<1225>
ICH Q2A
Guidelines
Accuracy Accuracy Accuracy
Precision Repeatability Analysis Precision
Precision
Intermediate precision No Intermediate
precision
Reproducibility No No
Page 46
Chapter-1 Introduction
Dept of Pharmaceutical Analysis 43 EGS Pillay College of Pharmacy
FDA reviewer Guidance USP General Chapter
<1225>
ICH Q2A
Guidelines
Specificity /selectivity Specificity Specificity
Detection limit Detection limit Detection limit
Quantitation limit Quantitation limit Quantitation limit
Linearity Linearity Linearity
Range Range Range
No Ruggedness No
Robustness Robustness Robustness
System suitability sample solution
stability System suitability System suitability
Page 47
Chapter-2 Literature Review
Dept of Pharmaceutical Analysis 44 EGS Pillay College of Pharmacy
2.0 LITERATURE REVIEW
2.1 Suneetha and Raja Rajeswari, IJPSR, 2015; Vol. 6(5): 1915-1923.,
Estimation of Teriflunomide Along with Concomitant Drugs in Different
Biological Matrices Using LC-MS/MS. Int J Pharm Sci Res 2015; 6(5):
1915-23.doi: 10.13040/IJPSR.0975-8232.6(5).1915-23.
The proposed validated method for the estimation of teriflunomide in different
biological matrices is highly sensitive and rapid compared to published reports.
The method offers significant advantages over those previously reported, in
terms of lower sample requirements, simplicity of extraction procedure without
any matrix effect. The efficiency of protein precipitation extraction and without
any interference from the concomitant drugs make it an attractive procedure in
bio analysis of teriflunomide.
The linear dynamic range established was adequate to measure the
concentration of teriflunomide in any preclinical and clinical study involving
different biological species. The concomitant drugs also can be estimated along
with the target analyte which is more advantageous than single compound
analysis and also useful in drug interaction and toxicology studies.
Page 48
Chapter-2 Literature Review
Dept of Pharmaceutical Analysis 45 EGS Pillay College of Pharmacy
2.2 Govind J. Kher, Vijay R. Ram, Kapil L. Dubal, Atul H. Bapodara and
Hitendra. S. Joshi, Validation of a Stability-Indicating LC Method for
Assay of Leflunomide in Tablets and for Determination of Content
Uniformity. International Journal of ChemTech Research CODEN( USA):
IJCRGG ISSN : 0974-4290, Vol. 3, No.2, pp 523-530, April-June 2011.
In the present work, an analytical method based on LC using UV detection was
developed and validated for assay and determination of content uniformity of
leflunomide in tablet dosage forms. The analytical conditions were selected
after testing the different parameters that effect LC analysis, such as column,
diluent, buffers, buffer concentration, organic solvent for mobile phase,
proportion of mobile phase and concentration of analyte etc. The Wakosil
column used because of its advantages of high retention, high resolving
capacity, better reproducibility, low back pressure and low tailing. Our
preliminary trials using different composition of mobile phases consisting of
water with methanol or acetonitrile, did gave poor peak shape. By using 0.02M
ammonium acetate buffer per 1000 mL and keeping mobile phase composition
as of 0.02M ammonium acetate buffer and acetonitrile (40:60, v/v), best peak
shape was obtained. For the selection of organic constituent of mobile phase,
acetonitrile was chosen to reduce the longer retention time and to attain good
peak shape. A detection wavelength of 260 nm was selected after scanning the
standard solution over the range 190-350 nm by using photo-diode array (PDA)
detector. Detection at 260 nm resulted in good response and good linearity.
The drug substance was easily extracted from the pharmaceutical dosage form
by use of acetonitrile and buffer 50:50 (v/v). The tablet dispersed readily in
buffer and the drug substance was freely soluble in acetonitrile. Solutions of
Page 49
Chapter-2 Literature Review
Dept of Pharmaceutical Analysis 46 EGS Pillay College of Pharmacy
standard and test preparations were found to be stable in this solvent mixture.
After developing the analytical method, it was validated. The analytical method
validation gave evidence that the procedure was suitable for the intended
purpose. The analytical method validation was carried out as per guidelines of
ICH Q2 (R1), USP and AOAC INTERNATIONAL.
2.3 Duygu Yeniceli, Dilek Dogrukol-Ak, , Muzaffer Tuncel. Department of
Analytical Chemistry, Faculty of Pharmacy, Anadolu University, 26470
Eskisehir, Turkey. Determination of leflunomide in tablets by high
performance liquid chromatography. Received 24 January 2005, Revised
24 June 2005, Accepted 28 June 2005, Available online 19 August 2005
In the present study, a reverse phase high performance liquid chromatography
(HPLC) method was validated and applied for the determination of leflunomide
in tablets. Chromatographic separation of leflunomide and oxazepam as an
internal standard was carried out on a C18 column (50 mm, 3 mm i.d.) using a
mobile phase, consisting of methanol and water (60:40, v/v), at a flow rate of
0.5 ml min−1 and UV detection at 260 nm. The retention times for oxazepam
and leflunomide were 2.6 and 5.2 min, respectively. The validated quantification
range of the method was 2.7 × 10⁻⁶ to 5.5 × 10⁻⁵ M for leflunomide. The
results of the developed procedure in tablets were compared with those of UV
spectrophotometry to assess active leflunomide content.
Page 50
Chapter-2 Literature Review
Dept of Pharmaceutical Analysis 47 EGS Pillay College of Pharmacy
2.4 Balraj Saini, Gulshan Bansal. Department of Pharmaceutical Sciences and
Drug Research, Punjabi University, Patiala 147002, India. Isolation and
characterization of a degradation product in leflunomide and a validated
selective stability-indicating HPLC–UV method for their quantification.
Received 14 May 2014, Revised 26 September 2014, Accepted 10 October
2014, Available online 22 October 2014
Leflunomide (LLM) is subjected to forced degradation under conditions of
hydrolysis, oxidation, dry heat, and photolysis as recommended by International
Conference on Harmonization guideline Q1A(R2). In total, four degradation
products (I–IV) were formed under different conditions. Products I, II and IV
were formed in alkaline hydrolytic, acidic hydrolytic and alkaline photolytic
conditions. LLM and all degradation products were optimally resolved by
gradient elution over a C18 column. The major degradation product (IV) formed
in hydrolytic alkaline conditions was isolated through column chromatography.
Based on its 1H NMR, IR and mass spectral data, it was characterized as a
British Pharmacopoeial impurity B. The HPLC method was found to be linear,
accurate, precise, sensitive, specific, rugged and robust for quantification of
LLM as well as product IV. Finally, the method was applied to stability testing
of the commercially available LLM tablets.
Page 51
Chapter-2 Literature Review
Dept of Pharmaceutical Analysis 48 EGS Pillay College of Pharmacy
2.5 D.S. Shokry, S.A. Weshahy Faculty of pharmaceutical sciences &
pharmaceutical industries and M. Abdel Kawy Future University in Egypt.
Faculty of Pharmacy, Cairo University. Application of Spectrophotometric
and Chromatographic Methods for Stability Indicating Determination of
Leflunomide. Journal of Applied Sciences Research, 8(3): 1547-1557, 2012
ISSN 1819-544X
Leflunomide, an amide containing compound, pyrimidine synthesis inhibitor a
leading drug in treatment of moderate to severe rheumatoid arthritis.Four
stability indicating methods are presented in this paper for the selective
determination of Leflunomide in presence of its alkaline degradate. The
resolution of the drug and its alkaline degradate has been achieved using
derivative spectrophotometry including second-, third- and fourth derivatives.
The derivative amplitudes are measured at 256.4 nm, 269.8 nm, 226.6 nm for
D2, D3 and D4 respectively. The proposed methods were found to be linear
over the range of (2.0-24.0 μgml-1). The fourth method is based on the
chromatographic separation on a C18 column using a mobile phase of 0.01 M
aqueous potassium dihydrogen phosphate adjusted at pH 3.5 with
orthophosphoric acid, acetonitrile in a ratio of [30:70], a flow rate of 1 ml/min
and UV detection at 262 nm. The proposed methods were validated with regard
to accuracy, precision, selectivity, robustness, application to pharmaceutical
preparation and further validated by applying standard addition technique.
Page 52
Chapter-3 Aim and Objective
Dept of Pharmaceutical Analysis 49 EGS Pillay College of Pharmacy
3.0 AIM AND OBJECTIVE
The drug analysis plays an important role in the development, manufacture and
therapeutic use of drugs. Most of the pharmaceutical industries do the quantitative
chemical analysis to ensure that the raw material used and the final product thus
obtained meet certain specification and to determine how much of each components
are present in the final product. Standard analytical procedure for newer drugs or
formulation may not be available in Pharmacopoeias; hence it is essential to develop
newer analytical methods which are accurate, precise, specific, linear, simple and
rapid.
Aim: To develop and validate new RP HPLC method for the assay of Teriflunomide
in tablet dosage.
Objective: Literature survey has revealed that various method were reported for
estimation of Teriflunomide. The existing methods are inadequate to meet the
requirements; hence it is proposed to improve the existing methods and to develop
new methods for the Estimation of Teriflunomide in pharmaceutical dosage forms.
Hence, on the basis of literature survey it was thought to develop a precise, accurate,
simple and reliable, less time consuming method for estimation.
Page 53
Chapter-4 Plan of Work
Dept of Pharmaceutical Analysis 50 EGS Pillay College of Pharmacy
4.0 PLAN OF WORK
Plan of Work
Gather/ generate background information obtain physico-chemical properties.
Determine if special handling/treatment of sample is needed.
From physicochemical properties select detector parameters.
Calculate approximately separation parameters/isocratic or gradient mode.
Perform forced degradation experiments to challenge method.
Optimization separation conditions
Summarize methodology and finalize documentation.
Analysis of marketed formulations and Validate method.
Page 54
Chapter-5 Drug Profile
Dept of Pharmaceutical Analysis 51 EGS Pillay College of Pharmacy
5.0 DRUG PROFILE
Proper Name : Teriflunomide
Synonyms : Teriflunomide
Structure :
Molecular formula : C12H9 F3 N2 O2
IUPAC name : (Z)-2-Cyano-3-hydroxy-but-2-enoic acid-(4-trifluromethyl
phenyl)-amide
(or)
2-Cyano-3-hydroxy-N-[4-(trifluromethyl)phenyl]-2(Z)-
butenamide
Molecular weight : 270.21 g/mol
CAS No. : 163451818
Melting point : 229 - 232°C
Description : White to almost white powder
Solubility : Sparingly soluble in acetone; slightly soluble in methylene
chloride; very slightly soluble in acetonitrile; insoluble in
water, ethanol and isopropyl alcohol.
pH (1% in water) : 3.19
Storage : Store at controlled room temperature, 15 to 30°C.
Category : Teriflunomide is the active metabolite of leflunomide, and
it acts as an immunomodulatory agent by inhibiting
pyrimidine synthesis.
Page 55
Chapter-5 Drug Profile
Dept of Pharmaceutical Analysis 52 EGS Pillay College of Pharmacy
Pharmacokinetic Data:
Teriflunomide is the principal active metabolite of leflunomide and is responsible for
leflunomide's activity in vivo. At recommended doses, teriflunomide and leflunomide
result in a similar range of plasma concentrations of teriflunomide.
Absorption :
After oral administration of teriflunomide, maximum plasma concentrations are
reached, on average, in 14 hours.
Distribution:
After a single intravenous dose, the volume of distribution is 11 L.
Metabolism:
Teriflunomide mainly undergoes hydrolysis to minor metabolites. Other minor
metabolic pathways include oxidation, Nacetylation and sulfate conjugation.
Teriflunomide is not metabolized by CYP450 or flavin monoamine oxidase.
Elimination:
Teriflunomide is eliminated unchanged and mainly through bile. Specifically 37.5% is
eliminated in the feces and 22.6% in urine.
Indications:
Used in the treatment of relapsing forms of multiple sclerosis (MS).
Pharmacology:
Teriflunomide is an immunomodulatory agent that decreases the amount of activated
CNS lymphocytes, which results in anti-inflammatory and antiproliferative effects.
Mechanism of Action:
The exact mechanism by which teriflunomide acts in MS is not known. What is
known is that teriflunomide prevents pyrimidine synthesis by inhibiting the
Page 56
Chapter-5 Drug Profile
Dept of Pharmaceutical Analysis 53 EGS Pillay College of Pharmacy
itochondrial enzyme dihydroorotate dehydrogenase, and this may be involved in its
immunomodulatory effect in MS.
Adverse Effects:
Most common adverse reactions (≥10% and ≥2% greater than placebo): ALT
increased, alopecia, diarrhea, influenza, nausea, paresthesia and warning for
Hepatotoxicity and risk of Teratogenicity
Hepatotoxicity Severe liver injury including fatal liver failure has been reported in
patients treated with leflunomide, which is indicated for rheumatoid arthritis.
Risk of Teratogenicity Based on animal data, Teriflunomide may cause major birth
defects if used during pregnancy.
Toxicity:
Teriflunomide is contraindicated in pregnant women or women of childbearing age
due to the risk of teratogenicity. Teriflunomide is also contraindicated in severe
hepatic impairment due to reports of hepatotoxicity, hepatic failure, and death.
Page 57
Chapter-6 Materials and Methods
Dept of Pharmaceutical Analysis 54 EGS Pillay College of Pharmacy
6.0 MATERIALS AND METHODS
Table 8: Instrumentation
S.NO Instrument Name Make Model
1. HPLC Waters 2996 PDA
2. Semi Micro Balance Sartorius CPA225D
3. Micro Balance Sartorius CPA2P
4. pH meter Thermo Electron
Corporation Orion 3 Star
5. Sonicator Spectra lab UCB70
6. Centrifuge Apparatus Hermle centrifuge
apparatus Not Available
7. UV Visible
Spectrophotometer Shimazdu UV-1700
Table 9: Reagents and Chemicals
S.No. Chemicals/Reagents Make/Grade
1. Acetonitrile Merck, (HPLC-Grade)
2. Potassium dihydrogen orthophosphate Merck (GR-Grade)
3. Ortho phosphoric acid Merck (GR-Grade)
4. Potassium Hydroxide Merck (GR-Grade)
5. Ammonium acetate Merck (GR-Grade)
6. Water Milli-Q Water
Table: 10 Filters Used
S.No. Name of the filter
1. 0.45µm PVDF membrane filter (Manufactured by PALL)
2. 0.45µm NYLON membrane filter (Manufactured by PALL)
Page 58
Chapter-6 Materials and Methods
Dept of Pharmaceutical Analysis 55 EGS Pillay College of Pharmacy
Table: 11 Working/reference standards
S.No Name of Working/reference standards
1. Teriflunomide Working Standard (Manufactured by Glenmark)
Table: 12 Test Sample
S.No Name of Test Sample
1. Teriflunomide Tablets, 14mg (Manufactured by Dr.Reddys)
Table: 13 Column Used
S.No Column Description
1. X Bridge C8 column (150 x 4.6 mm, 5 µm particle size)
2. Zorbax Eclipse XDB C8 column (150 x 4.6 mm, 5 µm particle size)
Page 59
Chapter-6 Materials and Methods
Dept of Pharmaceutical Analysis 56 EGS Pillay College of Pharmacy
METHOD DEVELOPMENT
The objective of this experiment was to optimize the assay method for
estimation of Teriflunomide tablets based on the literature survey and the trails made.
The trials mentioned bellow describes how the optimization was done.
Trial 1:
Buffer preparation : 50Mm of Ammonium Acetate buffer, filter through
0.45µm membrane filter and degas.
Mobile Phase : Buffer and ACN (60:40). Sonicated to degas.
Diluent : Water : ACN (30 : 70)
Chromatographic conditions:
Column : X Bridge C8 column (150 x 4.6 mm, 5 µm particle
size)
Column temperature : 30°C
Sample temperature : 5°C
Elution mode : Isocratic
Flow rate : 1.0 ml/min
Injection volume : 10l
Detector wave length : 294nm
Run time : 10 min.
Seal wash : 90:10 (Water: ACN)
Needle wash : 10:90 (Water: ACN)
System Suitability : USP Tailing Factor – NMT 2.0 and Plate count - NLT
2000.
Page 60
Chapter-6 Materials and Methods
Dept of Pharmaceutical Analysis 57 EGS Pillay College of Pharmacy
Conclusion : The peak was observed but the Plate count is below
2000.
Trial 2:
Buffer preparation : Similar to Trial 1
Mobile Phase : Similar to Trial 1
Diluent : Similar to Trial 1
Chromatographic conditions:
Column : Zorbax Eclipse XDB C8 column (150 x 4.6 mm, 5
µm particle size)
Column temperature : 30°C
Sample temperature : 5°C
Elution mode : Isocratic
Flow rate : 1.0 ml/min
Injection volume : 10l
Detector wave length : 294nm
Run time : 10 min.
Seal wash : 90:10 (Water: ACN)
Needle wash : 10:90 (Water: ACN)
System Suitability : USP Tailing Factor – NMT 2.0 and Plate count - NLT
2000.
Conclusion : The peak was observed but the Plate count is below
2000 and peak shape was asymmetrical.
Page 61
Chapter-6 Materials and Methods
Dept of Pharmaceutical Analysis 58 EGS Pillay College of Pharmacy
Trial 3 (Optimized Method):
Buffer preparation : 20Mm of Potassium dihydrogen orthophosphate
buffer pH 2.40, filter through 0.45µm membrane
filter and degas.
Mobile Phase : Buffer and ACN (65:35). Sonicated to degas.
Diluent : Water : ACN (30 : 70)
Chromatographic conditions:
Column : Zorbax Eclipse XDB C8 column (150 x 4.6 mm, 5
µm particle size)
Column temperature : 30°C
Sample temperature : 5°C
Elution mode : Isocratic
Flow rate : 1.0 ml/min
Injection volume : 10l
Detector wave length : 250nm
Run time : 10 min.
Seal wash : 90:10 (Water: ACN)
Needle wash : 10:90 (Water: ACN)
System Suitability : USP Tailing Factor – NMT 2.0 and Plate count - NLT
2000.
Conclusion : The peak was observed with good tailing and good
shape, with plate count above 2000 (10721) and
tailing factor below 2 (1.3). And this method was
finalized for assay of Teriflunomide Tablets.
Page 62
Chapter-6 Materials and Methods
Dept of Pharmaceutical Analysis 59 EGS Pillay College of Pharmacy
Preparation of Standard solution:
Weigh accurately about 50 mg of Teriflunomide RS/WRS and transfer to a 200 mL
volumetric flask. Add 140 mL of diluent and sonicate to dissolve. Dilute to volume
with diluent and mix well.
Transfer 10 mL of standard stock preparation into a 50 mL volumetric flask. Dilute to
volume with diluent and mix well. (Concentration of about 50 µg/mL of
Teriflunomide).
Preparation of Sample solution:
Determine the Average weight using not less than 20 tablets. Weigh and finely
powder not less than 20 tablets. Weigh accurately and transfer tablet powder
equivalent to about 25 mg into a 100 mL volumetric flask. Add 70 mL of diluent
and sonicate for 30 minutes with intermittent shaking. Dilute to volume with diluent
and mix well. Centrifuge a portion of the above solution at 3500 rpm for 10 minutes.
Transfer 5 mL of the supernatant solution to a 25 mL volumetric flask, dilute to
volume with diluent and mix well.
Filter a portion of the above solution through a 0.45 µm PVDF filter after discarding
atleast the first 4 mL of the filtrate.
(Sample preparation, concentration of about 50 µg/mL of Teriflunomide).
Procedure:
Equilibrate the column with mobile phase for not less than 30min at a flow rate of 1.0
l/min. Separately inject 10 µl of Blank (diluent), Standard solution (five times) and
Sample solution into the chromatographic system. Record the chromatograms and
measure the peak responses.
Page 63
Chapter-6 Materials and Methods
Dept of Pharmaceutical Analysis 60 EGS Pillay College of Pharmacy
System suitability:
The column efficiency as determined for the Teriflunomide peak from standard
solution is NLT 2000 theoretical plates.
Tailing factor for Teriflunomide peak obtained from standard chromatogram should
be NMT 2.0
The % RSD for the Teriflunomide peak for 5 replicate injections of standard solution
should be NMT 2.0
The retention time of Teriflunomide peak is about 6.0 minutes.
Calculations:
Quantity of Teriflunomide Present in the tablet as % of labelled amount:
AT Ws 10 100 25 P AW
= -------- x--------- x ------- x -------- x -------- x -------- x ------ x 100
AS 200 50 WT 5 100 L
AT : Peak area of Teriflunomide from the chromatogram of the assay preparation
AS : Mean peak area of Teriflunomide from the chromatogram of the standard
preparation.
Ws : Weight of Teriflunomide working standard taken, in mg
WT : Weight of tablet powder taken, in mg
P : Potency of Teriflunomide working standard used in percent on as is basis
L : Label claim in mg
AV : Average weight of tablet in mg
Page 64
Chapter-7 Results and Discussion
Dept of Pharmaceutical Analysis 61 EGS Pillay College of Pharmacy
7.0 RESULTS AND DISCUSSION
7.1 System Suitability:
A Standard solution was prepared by using Teriflunomide working standards as per
test method and was injected five times into the HPLC system.
The system suitability parameters were evaluated from standard chromatograms.
Acceptance criteria:
1. The USP Tailing factor should be not more than 2.0 for Teriflunomide peak from
standard solution.
2. The USP Theoretical plate count should be not less than 2000 for Teriflunomide
peak from standard solution.
3. The RSD of Teriflunomide peak area is NMT 2.0% from five replicate injections
of standard solution.
Table 14 System Suitability
Injection Peak Area USP Plate count USP Tailing
1 1616310 7147 1.27
2 1617462 7192 1.28
3 1621285 7096 1.28
4 1618228 7215 1.27
5 1610144 7220 1.28
SD 1616686 --- ---
% RSD 0.25 --- ---
Page 65
Chapter-7 Results and Discussion
Dept of Pharmaceutical Analysis 62 EGS Pillay College of Pharmacy
Observation:
The %RSD for peak areas, USP plate count and USP tailing were found to be within
the limits.
7.2 Accuracy: (Recovery):
A study of Accuracy was conducted. Drug Assay was performed in triplicate as per
test method by spiking the Teriflunomide drug substance to the placebo equivalent to
5%, 50%, 100% and 200% of the labeled amount as per the test method. The average
% recovery of Teriflunomide was calculated.
Separately inject the blank, placebo, Teriflunomide in to the chromatograph.
Acceptance criteria:
The mean % recovery of, Teriflunomide the at each level should be not less than
95.0% and not more than 105.0%.
Table 15 Accuracy
Sample
No.
Theoretical
(%)
Mean Peak
area
%
Recovery
Mean (%)
Recovery % RSD
1 5 79271 99.37
99.63 0.45 2 5 79243 99.37
3 5 79893 100.15
1 50 784059 100.65
100.44 0.21 2 50 786797 100.22
3 50 789985 100.46
1 100 1589177 101.16
101.05 0.28 2 100 1587887 100.73
3 100 1593464 101.28
1 200 3172132 101.92
101.15 0.73 2 200 3155725 101.12
3 200 3111902 100.43
Page 66
Chapter-7 Results and Discussion
Dept of Pharmaceutical Analysis 63 EGS Pillay College of Pharmacy
Observation:
The recovery results indicating that the test method has an acceptable level of
accuracy. Therefore the method is accurate.
7.3 Precision:
A. System precision: Standard solution was prepared as per test method and injected
five times into chromatographic system.
B. Method precision: Prepared six sample solutions as per test method and injected
each solution into chromatographic system.
Acceptance criteria:
1. %RSD of %assay results from six samples should be NMT 2.0
2. Assay should be in the range of test method i.e. not less than 95.0% and not more than
105.0%.
a) System Precision:
Table 16 System Precision
Concentration
100%
Injection Peak Areas Theoretical plates Tailing factor
1 1616310 7147 1.27
2 1617462 7192 1.28
3 1621285 7096 1.28
4 1618228 7215 1.27
5 1610144 7220 1.28
Statistical
Analysis
Mean 1616686 --- ---
SD 1616686 --- ---
% RSD 0.25 --- ---
Page 67
Chapter-7 Results and Discussion
Dept of Pharmaceutical Analysis 64 EGS Pillay College of Pharmacy
b) Method precision:
Table 17 Method Precision
Sample No. Area %Assay
1. 1570314 97.87
2. 1574009 98.18
3. 1594849 99.27
4. 1590749 99.07
5. 1606478 100.12
6. 1609080 100.31
Mean 99.13
Standard Deviation 0.98848
% RSD 0.99
Observation:
The precision study has shown that the test method is precise.
7.4 Linearity of test method:
Seven linearity solutions were prepared using Teriflunomide working standard at
concentration levels from 5% to 150% of target concentration of Teriflunomide (5%,
10%, 25%, 50%, 75%, 100% and 150%). The linearity graph plotted from 5% to
150%.
Acceptance criteria:
Correlation Coefficient should be not less than 0.999.
% of RSD for level 1 and Level 5 should be not more than 2.0.
Page 68
Chapter-7 Results and Discussion
Dept of Pharmaceutical Analysis 65 EGS Pillay College of Pharmacy
Table 18 Linearity
Linearity Level Concentration (µg/mL) Average Area
L1-5% 2.502 83096
L2-10% 5.004 154525
L3-25% 12.512 414647
L4-50% 25.024 823580
L5-75% 37.537 1241003
L6-100% 50.049 1650624
L7-150% 75.074 2510914
Linear Regression Analysis Concentration in µg/mL vs. Area
Correlation Coefficient Square (r2) 0.9999
Slope 33503.747
Y-Intercept -8279.311
Page 69
Chapter-7 Results and Discussion
Dept of Pharmaceutical Analysis 66 EGS Pillay College of Pharmacy
Observation:
The correlation coefficient was found to be 0.9999.
From the above study it was established that the linearity of test method is from 5% to
150% of the target concentration.
Range:
Data from linearity, precision, accuracy sections was considered to establish range of
the method. The results were summarized in table 19.
Acceptance Criteria:
For linearity, correlation coefficient shall be ≥ 0.999.
For precision, %RSD of assay of 6 replicate sample preparations shall be NMT 2.0%.
For accuracy, individual recovery at each spike level should be within 95.0% to
105.0%
Table 19 Range
Parameter Acceptance Criteria Result
Linearity R ≥ 0.999 0.999
Precision %RSD of 6 Replicates NMT 2.0 0.99
Accuracy Recovery 95.0% to 105.0% 99.99
Page 70
Chapter-7 Results and Discussion
Dept of Pharmaceutical Analysis 67 EGS Pillay College of Pharmacy
7.5 Selectivity/Specificity:
i) Placebo and impurity interference:
A study to establish the interference of placebo was conducted. Blank, Standard,
Placebo, Sample solution were prepared and injected into the chromatographic system
for Identification and interference with the Teriflunomide peak.
Acceptance Criteria:
a. No interference should be observed from diluent, individual impurity and
placebo at the retention time of Teriflunomide Peak.
b. Teriflunomide Peak should be separated from the known and unknown
impurities peak. (USP resolution NLT 1.5)
Table 20 Placebo interference
Observation:
From the chromatograms, it was concluded that there was no interference with
placebo as no peaks were observed at the retention times of Teriflunomide peaks.
Sample Name Retention Time
(minutes) Interference
Blank Not Detected Nil
Standard NA NA
Placebo Not Detected NA
Control Sample NA NA
Spiked Sample NA NA
Impurity A 2.597 Nil
Impurity B 6.295 Nil
Impurity C 19.041 Nil
Impurity D 18.111 Nil
Page 71
Chapter-7 Results and Discussion
Dept of Pharmaceutical Analysis 68 EGS Pillay College of Pharmacy
ii) Interference from degradation products:
A study was conducted to demonstrate the effective separation of degradants
from Teriflunomide. Separate portions of Drug product and Placebo were exposed to
following stress conditions to induce degradation.
a) Acid stress
b) Base stress
c) Peroxide stress
d) UV light stress
e) Heat stress
f) A sample solution was prepared as per the method.
Acid Stress Sample:
Weighed accurately and transferred Teriflunomide tablet powder equivalent to 25 mg
of Teriflunomide into a 100 mL volumetric flask. Added 35 mL of RS-diluent and
sonicated for 30 minutes with intermittent shaking. 3mL of 1N HCL was added and
heated on a water bath at 80°C for 3 hours. Cooled to room temperature and
neutralized with 3 mL of 1N NaOH. Diluted to volume with RS-diluent and mixed
well. Centrifuge a portion of the above solution at 3500 rpm for 10 minutes and
further 5 mL of supernatant solution was transferred to 50 mL flask and diluted to
volume with assay diluent and mixed well. Filtered through 0.45 µm PVDF filter by
discarding the first 4 mL of the filtrate.
Base Stress Sample:
Weighed accurately and transferred Teriflunomide tablet powder equivalent to 25 mg
of Teriflunomide into a 100 mL volumetric flask. Added 35 mL of RS-diluent and
sonicated for 20 minutes with intermittent shaking. 3 mL of 1N NaOH was added and
Page 72
Chapter-7 Results and Discussion
Dept of Pharmaceutical Analysis 69 EGS Pillay College of Pharmacy
heated on a water bath at 80°C for 8 hours. Cooled to room temperature and
neutralized with 3 mL of 1 N HCl. Diluted to volume with RS-diluent and mixed
well. Centrifuged a portion of the above solution at 3500 rpm for 10 minutes and
further 5 mL of supernatant solution was transferred to 50 mL flask and diluted to
volume with assay diluent and mixed well. Filtered through 0.45 µm PVDF filter by
discarding the first 4 mL of the filtrate.
Peroxide Stress Sample:
Weighed accurately and transferred Teriflunomide tablet powder equivalent to 25 mg
of Teriflunomide into a 100 mL volumetric flask. Added 20 mL of RS-diluent and
sonicated for 30 minutes with intermittent shaking. 3 mL of 30% hydrogen peroxide
was added and heated on a water bath at 80°C for 30 minutes. Cooled to room
temperature, diluted to volume with RS-diluent and mixed well. Centrifuged a portion
of the above solution at 3500 rpm for 10 minutes and further 5 mL of supernatant
solution was transferred to 50 mL flask and diluted to volume with assay diluent and
mixed well. Filtered through 0.45 µm PVDF filter by discarding the first 4 mL of the
filtrate.
UV Light Stress Sample:
Weigh accurately and transfer tablet powder equivalent to about 25 mg(Stressed
under UV light for 24 hours) into a 100 mL volumetric flask. Add 70 mL of diluent
and sonicate for 30 minutes with intermittent shaking. Dilute to volume with diluent
and mix well. Centrifuge a portion of the above solution at 3500 rpm for 10 minutes.
Transfer 5 mL of the supernatant solution to a 25 mL volumetric flask, dilute to
volume with diluent and mix well.
Filter a portion of the above solution through a 0.45 µm PVDF filter after discarding
atleast the first 4 mL of the filtrate.
Page 73
Chapter-7 Results and Discussion
Dept of Pharmaceutical Analysis 70 EGS Pillay College of Pharmacy
Heat Stress Sample:
Weigh accurately and transfer tablet powder equivalent to about 25 mg(Heated at
105°C for 1 hour and 30 minutes) into a 100 mL volumetric flask. Add 70 mL of
diluent and sonicate for 30 minutes with intermittent shaking. Dilute to volume with
diluent and mix well. Centrifuge a portion of the above solution at 3500 rpm for 10
minutes.
Transfer 5 mL of the supernatant solution to a 25 mL volumetric flask, dilute to
volume with diluent and mix well.
Filter a portion of the above solution through a 0.45 µm PVDF filter after discarding
atleast the first 4 mL of the filtrate.
Blanks were prepared in the similar way for Acid /Base reagent and for oxidation.
Placebo Solutions were prepared in the similar way for control, Acid, Base, Peroxide,
heat and UV light degradation.
Acceptance Criteria:
The net degradation should be in between 1% to 50%.
All degradation Products should be separated from active.
Purity angle should be less than purity Threshold.
Page 74
Chapter-7 Results and Discussion
Dept of Pharmaceutical Analysis 71 EGS Pillay College of Pharmacy
Table 21 Forced Degradation Studies
Sample
Name Condition
%
Assay
%
Degradation
Purity
Angle
Purity
Threshold
Control
Sample NA 99.77 NA 0.034 0.201
Spike
Sample NA NA NA 0.036 0.213
Acid
Stress
Sample
3 mL 5N HCl, heated on a
water bath at 80°C for 3
hours.
78.97 20.80 0.034 0.202
Base
Stress
Sample
3 mL 0.1N NaOH, heated
on a water bath at 60°C for
8 hours.
99.65 0.12 0.034 0.201
Peroxide
Stress
Sample
3 mL 30% H2O2, heated
on a water bath at 80°C for
30 minutes.
84.75 15.02 0.033 0.204
UV light
Stress
Sample
Stressed under UV light
for 24 hours. 100.77 NA 0.046 0.204
Heat
Stress
Sample
Heated in an oven at
105°C for
1 hour and 30 minutes.
98.90 0.87 0.044 0.203
Observation:
During the Specificity and forced degradation, it was observed that no secondary peak
arising from degraded samples interfered with the elution of the Teriflunomide Peak.
Analysis of blank, individual impurities and placebo preparations demonstrated no
interference with Teriflunomide Peak elution. Peak purity analysis using the
photodiode array detector demonstrated Teriflunomide Peak homogeneity. Known
and unknown impurities well separated from main peak (Resolution NLT 1.5). The
study validates that the method is specific and stability indicating.
Page 75
Chapter-7 Results and Discussion
Dept of Pharmaceutical Analysis 72 EGS Pillay College of Pharmacy
7.6 Ruggedness of test method:
System to system /Analyst to Analyst/column to Column variability:
System to system /Analyst to Analyst/column to Column variability study was
conducted on different HPLC systems, different columns and different analysts under
similar conditions at different times. Six samples were prepared and each were
analysed as per test method. The relative standard deviation for Teriflunomide was
found to be below 2 % on the columns, systems and Analysts.
Comparison of both the results obtained on two different HPLC systems, different
column and different analysts shows that the assay test method is rugged for System
to system /Analyst to Analyst/column to Column variability.
Acceptance criteria:
1) The system suitability acceptance criteria as described in the method must be
met.
2) The % RSD of Teriflunomide from the six sample preparations should be not
more than 2.0%.
3) All assay values should be within the 90.0 – 110.0 % of label claim.
Page 76
Chapter-7 Results and Discussion
Dept of Pharmaceutical Analysis 73 EGS Pillay College of Pharmacy
Table 22 System Suitability Ruggedness Results
Injection No. Analyst-1 Analyst-2
Peak area Peak area
1 1616310 1546066
2 1617462 1556162
3 1621285 1552999
4 1618228 1555638
5 1610144 1555822
Mean 1616686 1553337
% RSD 0.25 0.27
Tailing factor 1.27 1.39
Plate count 7147 7861
Sample No
Analyst-1 Analyst-2
Mean Peak area % Assay Mean Peak
area % Assay
1 1570314 97.22 1533048 98.39
2 1574009 97.51 1531820 98.43
3 1594850 98.57 1543101 99.02
4 1590749 98.36 1529833 98.21
5 1606478 99.40 1536675 98.52
6 1609080 99.62 1529051 97.82
Mean NA 98.44 NA 98.40
%RSD NA 0.98 NA 0.4
Cumulative RSD of 12 samples assay value: 1.00 %
Observation: The % of assay values obtained from six samples was between 90.0%
and 110.0%. The RSD of assay from 6 samples is less than 2.0%.
Page 77
Chapter-7 Results and Discussion
Dept of Pharmaceutical Analysis 74 EGS Pillay College of Pharmacy
7.7 Solution Stability
Establish the stability of standard and sample solution on bench top for a period of 2
days and in refrigerator for a period of about 5 to 7 days. Standard solution and
sample solution were prepared as per test method injected and evaluated at initial,
12Hr, 24Hr and 48Hr.
The concentration of standard at 24 hours and 48 hours were compared to that of the
initial. The assay of sample at 24 hours and 48 hours were compared to that of the
initial.
Acceptance Criteria:
The concentration and % assay difference between the initial and time point for
standard and sample solution should be NMT 2.0% from the initial value respectively.
Table 23 Solution stability of standard at 5°C
Time
(hours)
Mean Peak
area
Concentration
(µg/mL)
% Difference from
Initial
Initial 1616686 50.049 NA
24 hours 1624042 50.709 -1.31
48 hours 1633427 51.002 -1.90
Table 24 Solution stability of sample at 5°C
Time (hours) Mean Peak area Assay % % Difference from
Initial
Initial 1570315 97.22 NA
24 hours 1582351 98.81 -1.63
48 hours 1583676 98.89 -1.71
Page 78
Chapter-7 Results and Discussion
Dept of Pharmaceutical Analysis 75 EGS Pillay College of Pharmacy
Observation:
The concentration of the 24 and 48 hours injections of standard solution differed by
less than 2.0% when compared to the initial standard solution and assay value of the
24 hours and 48 hours of sample solution differed by less than 2.0% when compared
to the initial sample solution. Therefore, the standard and sample solutions can be
used up to 48 hours after its preparation if it is stored at 5°C.
7.8 Filter Study: (At least two filters)
For demonstrating that the filtration does not affect the analysis results. At least two
types of filters were validated before use.
A sample was prepared as per the method for the filter study. This sample was divided
into three portions. One portion of the prepared sample was centrifuged at 3500 RPM
for 10 minutes. The centrifuged sample was used as a control for the filter study.
Second portion of sample was filtered through 0.45µ PVDF filter and the filtrate was
collected after discarding the first 3 mL, 4 mL, 5 mL and 6 mL of the filtrate. The
third portion of sample was filtered through 0.45µ nylon filter and the filtrate was
collected after discarding the first 3 mL, 4 mL, 5 mL and 6 mL of the filtrate. The
centrifuged and filtered samples were injected.
Acceptance Criteria:
Compare the results of the filtered samples with that of the centrifuged sample
preparation. Difference between peak area response of centrifuged sample and filtered
sample should be not more than 2.0%.
Page 79
Chapter-7 Results and Discussion
Dept of Pharmaceutical Analysis 76 EGS Pillay College of Pharmacy
Table 25 Filter study of 0.45µm PVDF and Nylon filter
Sample Name Mean Peak
area % Difference
Centrifuged Sample (10 min @ 3500rpm) 1586029 NA
0.45µ PVDF filtrate sample, 3 mL discarded 1580351 0.35
0.45µ PVDF filtrate sample, 4 mL discarded 1582633 0.21
0.45µ PVDF filtrate sample, 5 mL discarded 1589423 -0.21
0.45µ PVDF filtrate sample, 6 mL discarded 1594893 -0.55
0.45µ Nylon filtrate sample, 3 mL discarded 1608774 -1.43
0.45µ Nylon filtrate sample, 4 mL discarded 1605951 -1.25
0.45µ Nylon filtrate sample, 5 mL discarded 1613098 -1.70
0.45µ Nylon filtrate sample, 6 mL discarded 1611165 -1.58
Observation:
The area found in the filtered fractions of sample solution was comparable to the area
found in the centrifuged portion of the sample solution. There is no significant
difference in area between different volumes 0.45µm PVDF and Nylon filtered.
Therefore, the filters are suitable for use and the discarding of 4 mL of sample
solution as filtrate, as stated in the method is a suitable volume to discard before
collecting for analysis by HPLC.
7.9 Robustness:
The robustness is a measure of method capacity to remain unaffected by small,
deliberate variations in method parameters and provides an indication of method
reliability during normal use.
A standard solution was prepared and injected into the chromatographic system as per
the conditions specified in the method. The same standard solution was re-injected by
changing one parameter at a time, keeping other parameters constant. A set of system
Page 80
Chapter-7 Results and Discussion
Dept of Pharmaceutical Analysis 77 EGS Pillay College of Pharmacy
suitability data was calculated for standards injected under altered method conditions
and compared against the values generated under normal method conditions.
Method Parameters:
1. Flow Rate (Normal flow is 1.5 mL/min)
a. Flow minus → 1.35 mL/min
b. Flow plus → 1.65 mL/min
2. Column Operating Temperature (Normal temperature is 30°C)
a. Temperature minus → 25° C
b. Temperature plus → 35° C
3. Buffer pH variation (Normal Buffer pH 2.4)
a. pH minus → pH 2.6
b. pH plus → pH 2.2
4. Mobile Phase Composition Variation (Normal Composition is Buffer: ACN,
650:350)
a. MPV1 → Buffer : ACN (620:380) b. MPV2 → Buffer : ACN (580:420)
Acceptance criteria:
All the system suitability requirements must be met.
Page 81
Chapter-7 Results and Discussion
Dept of Pharmaceutical Analysis 78 EGS Pillay College of Pharmacy
Table 26 Robustness study - Comparison of System
Suitability and Retention time
Parameters
Retention
Time
(min)
Mean
Peak
area
(n=5)
%RSD
USP
Tailing
factor
USP
Plate
count
Normal Condition (1.0mL/min,
30°C,
pH 2.4 Buffer : ACN (650:350)
6.564 1651509 0.61 1.25 7816
Flow Rate Minus 1.35
mL/min 7.292 1846396 0.23 1.26 8080
Flow Rate Plus 1.65
mL/min 5.996 1504834 0.35 1.24 7658
Mobile phase
pH Minus 2.2 9.196 1585481 0.23 1.16 9241
Mobile phase
pH Plus 2.6 5.683 1684507 0.21 1.33 6907
Column
Temperature
Minus
25°C 6.775 1677411 0.33 1.25 7756
Column
Temperature Plus 35°C 6.144 1666426 0.09 1.25 8.35
Mobile Phase
composition
Variation 1
Buffer :
ACN
670:330
9.215 1648619 0.17 1.23 8693
Mobile Phase
composition
Variation 2
Buffer:ACN
630:370 5.292 1665191 0.30 1.26 7259
Page 82
Chapter-7 Results and Discussion
Dept of Pharmaceutical Analysis 79 EGS Pillay College of Pharmacy
Conclusion:
No significant change was observed in retention time after individually changing the
conditions of flow rate of mobile phase, column operating temperature and pH of
buffer and mobile phase composition variation. Calculations for all other system
suitability parameters met the acceptance criteria and the data generated are
comparable with the normal conditions. Based on the above result, it is concluded that
the method is unaffected by small, deliberate variations in flow rate, column
temperature and pH of buffer and mobile phase composition variation.
Page 83
Chapter-7 Results and Discussion
Dept of Pharmaceutical Analysis 80 EGS Pillay College of Pharmacy
CHROMATOGRAMS UV Spectrum
Method Development trails in HPLC
Trial No.1
Page 84
Chapter-7 Results and Discussion
Dept of Pharmaceutical Analysis 81 EGS Pillay College of Pharmacy
Trial No. 2
Trial No. 3 (Optimised method)
Page 85
Chapter-7 Results and Discussion
Dept of Pharmaceutical Analysis 82 EGS Pillay College of Pharmacy
Diluent Effect:
System Suitability
Injection-1
Page 86
Chapter-7 Results and Discussion
Dept of Pharmaceutical Analysis 83 EGS Pillay College of Pharmacy
Injection-2
Injection-3
Page 87
Chapter-7 Results and Discussion
Dept of Pharmaceutical Analysis 84 EGS Pillay College of Pharmacy
Injection-4
Injection-5
Page 88
Chapter-7 Results and Discussion
Dept of Pharmaceutical Analysis 85 EGS Pillay College of Pharmacy
Accuracy Chromatograms
5% Sample 1
5% Sample 2
Page 89
Chapter-7 Results and Discussion
Dept of Pharmaceutical Analysis 86 EGS Pillay College of Pharmacy
5% Sample 3
50% Sample 1
Page 90
Chapter-7 Results and Discussion
Dept of Pharmaceutical Analysis 87 EGS Pillay College of Pharmacy
50% Sample 2
50% Sample 3
Page 91
Chapter-7 Results and Discussion
Dept of Pharmaceutical Analysis 88 EGS Pillay College of Pharmacy
100% Sample 1
100% Sample 2
Page 92
Chapter-7 Results and Discussion
Dept of Pharmaceutical Analysis 89 EGS Pillay College of Pharmacy
100% Sample 3
200% Sample 1
Page 93
Chapter-7 Results and Discussion
Dept of Pharmaceutical Analysis 90 EGS Pillay College of Pharmacy
200% Sample 2
200% Sample 3
Page 94
Chapter-7 Results and Discussion
Dept of Pharmaceutical Analysis 91 EGS Pillay College of Pharmacy
Method Precision Chromatograms
Sample 1 - Injection-1
Sample 1 - Injection-2
Page 95
Chapter-7 Results and Discussion
Dept of Pharmaceutical Analysis 92 EGS Pillay College of Pharmacy
Sample 2 - Injection-1
Sample 2 - Injection-2
Page 96
Chapter-7 Results and Discussion
Dept of Pharmaceutical Analysis 93 EGS Pillay College of Pharmacy
Sample 3 - Injection-1
Sample 3 - Injection-2
Page 97
Chapter-7 Results and Discussion
Dept of Pharmaceutical Analysis 94 EGS Pillay College of Pharmacy
Sample 4 - Injection-1
Sample 4 - Injection-2
Page 98
Chapter-7 Results and Discussion
Dept of Pharmaceutical Analysis 95 EGS Pillay College of Pharmacy
Sample 5 - Injection-1
Sample 5 - Injection-2
Page 99
Chapter-7 Results and Discussion
Dept of Pharmaceutical Analysis 96 EGS Pillay College of Pharmacy
Sample 6 - Injection-1
Sample 6 - Injection-2
Page 100
Chapter-7 Results and Discussion
Dept of Pharmaceutical Analysis 97 EGS Pillay College of Pharmacy
Linearity Chromatograms
L1 – 5%
L1 – 10%
Page 101
Chapter-7 Results and Discussion
Dept of Pharmaceutical Analysis 98 EGS Pillay College of Pharmacy
L1 – 25%
L1 – 50%
Page 102
Chapter-7 Results and Discussion
Dept of Pharmaceutical Analysis 99 EGS Pillay College of Pharmacy
L1 – 75%
L1 – 100%
Page 103
Chapter-7 Results and Discussion
Dept of Pharmaceutical Analysis 100 EGS Pillay College of Pharmacy
L1 – 150%
Selectivity/Specificity Chromatograms
Placebo and impurity interference:
Placebo
Page 104
Chapter-7 Results and Discussion
Dept of Pharmaceutical Analysis 101 EGS Pillay College of Pharmacy
Control Sample
Page 105
Chapter-7 Results and Discussion
Dept of Pharmaceutical Analysis 102 EGS Pillay College of Pharmacy
Spiked Sample
Page 106
Chapter-7 Results and Discussion
Dept of Pharmaceutical Analysis 103 EGS Pillay College of Pharmacy
Impurity A
Page 107
Chapter-7 Results and Discussion
Dept of Pharmaceutical Analysis 104 EGS Pillay College of Pharmacy
Impurity B
Page 108
Chapter-7 Results and Discussion
Dept of Pharmaceutical Analysis 105 EGS Pillay College of Pharmacy
Impurity C
Page 109
Chapter-7 Results and Discussion
Dept of Pharmaceutical Analysis 106 EGS Pillay College of Pharmacy
Impurity D
Page 110
Chapter-7 Results and Discussion
Dept of Pharmaceutical Analysis 107 EGS Pillay College of Pharmacy
Interference from degradation products:
Acid stress
Page 111
Chapter-7 Results and Discussion
Dept of Pharmaceutical Analysis 108 EGS Pillay College of Pharmacy
Base stress
Page 112
Chapter-7 Results and Discussion
Dept of Pharmaceutical Analysis 109 EGS Pillay College of Pharmacy
Peroxide stress
Page 113
Chapter-7 Results and Discussion
Dept of Pharmaceutical Analysis 110 EGS Pillay College of Pharmacy
Page 114
Chapter-7 Results and Discussion
Dept of Pharmaceutical Analysis 111 EGS Pillay College of Pharmacy
Page 115
Chapter-7 Results and Discussion
Dept of Pharmaceutical Analysis 112 EGS Pillay College of Pharmacy
UV light stress
Page 116
Chapter-7 Results and Discussion
Dept of Pharmaceutical Analysis 113 EGS Pillay College of Pharmacy
Heat stress
Page 117
Chapter-7 Results and Discussion
Dept of Pharmaceutical Analysis 114 EGS Pillay College of Pharmacy
Solution Stability
Standard – 24 Hrs
Standard – 48 Hrs
Page 118
Chapter-7 Results and Discussion
Dept of Pharmaceutical Analysis 115 EGS Pillay College of Pharmacy
Sample – 24 Hrs
Sample – 48 Hrs
Page 119
Chapter-7 Results and Discussion
Dept of Pharmaceutical Analysis 116 EGS Pillay College of Pharmacy
Filter Study
Centrifuged Sample (10 min @ 3500rpm)
Injection-1
Injection-2
Page 120
Chapter-7 Results and Discussion
Dept of Pharmaceutical Analysis 117 EGS Pillay College of Pharmacy
0.45µ PVDF filtrate sample, 3 mL discarded
Injection-1
Injection-2
Page 121
Chapter-7 Results and Discussion
Dept of Pharmaceutical Analysis 118 EGS Pillay College of Pharmacy
0.45µ PVDF filtrate sample, 4 mL discarded
Injection-1
Injection-2
Page 122
Chapter-7 Results and Discussion
Dept of Pharmaceutical Analysis 119 EGS Pillay College of Pharmacy
0.45µ PVDF filtrate sample, 5 mL discarded
Injection-1
Injection-2
Page 123
Chapter-7 Results and Discussion
Dept of Pharmaceutical Analysis 120 EGS Pillay College of Pharmacy
0.45µ PVDF filtrate sample, 6 mL discarded
Injection-1
Injection-2
Page 124
Chapter-7 Results and Discussion
Dept of Pharmaceutical Analysis 121 EGS Pillay College of Pharmacy
0.45µ Nylon filtrate sample, 3 mL discarded
Injection-1
Injection-2
Page 125
Chapter-7 Results and Discussion
Dept of Pharmaceutical Analysis 122 EGS Pillay College of Pharmacy
0.45µ Nylon filtrate sample, 4 mL discarded
Injection-1
Injection-2
Page 126
Chapter-7 Results and Discussion
Dept of Pharmaceutical Analysis 123 EGS Pillay College of Pharmacy
0.45µ Nylon filtrate sample, 5 mL discarded
Injection-1
Injection-2
Page 127
Chapter-7 Results and Discussion
Dept of Pharmaceutical Analysis 124 EGS Pillay College of Pharmacy
0.45µ Nylon filtrate sample, 6 mL discarded
Injection-1
Injection-2
Page 128
Chapter-8 Summary
Dept of Pharmaceutical Analysis 124 EGS Pillay College of Pharmacy
8.0 SUMMARY
A simple Reverse Phase High Performance Liquid Chromatographic method
has been developed and subsequently validated for Teriflunomide tablets.
The separation was carried out by using a Buffer : acetonitrile (65:35). The detection
was carried out at 250nm. The column was Zorbax Eclipse XDB, C8,150 x 4.6mm,
5µl. The flow rate was selected as 1.5ml/min.
The Retention time of Teriflunomide tablets was found to be 6.0. The asymmetry
factor or tailing factor of Teriflunomide tablets was found to be 1.2, which indicates
symmetrical nature of the peak. The number of theoretical plates of Teriflunomide
tablets was found to be 7391, which indicates the efficient performance of the
column. These parameters represent the specificity of the method.
From the linearity studies, specified concentration levels were determined. It was
observed that Teriflunomide tablets were linear in the range of 5% to 150% for the
target concentration by RP-HPLC. The linearity range of Teriflunomide tablets 5% to
150% was found to obey linearity with a correlation coefficient of 0.999.
The validation of the proposed method was verified by system precision and method
precision by RP-HPLC. The %RSD of system suitability for Teriflunomide tablets
was found to be 0.25.
The validation of the proposed method was verified by recovery studies. The
percentage recovery range was found to be satisfied which represent in results. The
robustness studies were performed by changing the flow rate, filters and wavelength.
The ruggedness study was also performed.
Page 129
Chapter-8 Summary
Dept of Pharmaceutical Analysis 125 EGS Pillay College of Pharmacy
The analytical method validation was carried out by RP-HPLC as per ICH
guidelines and given below are the tables are the summary of the results.
Analytical method validation report for Teriflunomide tablets
Table No. 27
S. NO. TEST ACCEPTANCE CRITERIA RESULTS
1. System
Suitability
The USP Tailing factor of
Teriflunomide peak is NMT 2.0
from standard preparation.
The USP Plate count for
Teriflunomide peak NLT 2000 from
standard preparation.
The RSD of Teriflunomide peak
area is NMT 2.0% from five
replicate injections of standard
preparation.
USP Tailing: 1.27
USP plate count: 7147
RSD: 0.25%
2. Accuracy The recovery at each level must be
97.0% to 103.0%.
The RSD of all determinations at
each level should be not more than
2.0%.
Average mean
Recovery at 5% Level:
99.63%
RSD: 0.45 %
Average mean
Recovery at 50%
Level: 100.44%
RSD: 0.21 %
Average mean
Recovery at 100%
Level: 101.05%
RSD: 0.28 %
Average mean
Recovery at 200%
Level: 101.15%
RSD: 0.73 %
Page 130
Chapter-8 Summary
Dept of Pharmaceutical Analysis 126 EGS Pillay College of Pharmacy
S. NO. TEST ACCEPTANCE CRITERIA RESULTS
3. Method
Precision
All assay values should be within
the 90.0–110.0 % of label claim.
The RSD of six (6) assay values
should be not more than 2.0%.
Assay
Mean: 99.13%
RSD: 0.99%
4. Linearity and
range
The correlation coefficient square
(r2) must be NLT 0.997
r2 = 0.9999
5. Selectivity/
Specificity
Any secondary peak arising from
forced degradation study should not
interfere with the Teriflunomide
peak.
The peak purity analysis using a
photodiode array detector should
demonstrate peak homogeneity.
No interference should be observed
from diluent, all known impurities
at the retention time of
Teriflunomide.
Teriflunomide peak should be
separated from the known and
unknown impurities peak (USP
resolution NLT 1.5).
No interference
observed.
Demonstrated
Teriflunomide peak
homogeneity.
No Interference
observed.
Teriflunomide peak
well separated from
the known and
unknown impurities
peak
USP resolution is
more than 1.5
Page 131
Chapter-8 Summary
Dept of Pharmaceutical Analysis 127 EGS Pillay College of Pharmacy
S. NO. TEST ACCEPTANCE CRITERIA RESULTS
6. Ruggedness The system suitability acceptance
criteria as described in the method
must be met.
The % RSD of Teriflunomide from
the six sample preparations should
be not more than 2.0%.
All assay values should be within
the 90.0 – 110.0 % of label claim.
Analyst 1
USP Tailing: 1.27
USP plate count: 7147
RSD: 0.25%
Analyst 2
USP Tailing: 1.39
USP plate count: 7861
RSD: 0.27%
Analyst 1
% RSD: 0.98%
Analyst 2
% RSD: 0.40%
Analyst 1
Assay
Mean: 98.44%
Analyst 2
Assay
Mean: 98.40%
7. Solution
stability
The concentration and % assay
difference between the initial and
time point for standard and sample
solution should be NMT 2.0% from
the initial value respectively.
Include an appropriate cautionary
statement in the method based on
the solution stability.
Standard and samples
solutions are stable up
to 48 hours when
stored at 5°C.
8. Filter Study
Compare the results of the filtered
samples with that of the centrifuged
sample preparation. Difference
between peak area response of
centrifuged sample and filtered
sample should not be more than
2.0%.
Results of samples
filtered by various
filters (0.45µm PVDF
and Nylon) are
comparable with that
of the centrifuged
sample
9. Robustness All the system suitability
requirements must be met.
Method is unaffected
by deliberate
variations in flow rate,
column temperature,
pH Variation and
mobile phase
composition.
Page 132
Chapter-9 Conclusion
Dept of Pharmaceutical Analysis 128 EGS Pillay College of Pharmacy
9.0 CONCLUSION
A HPLC method for Teriflunomide tablets was developed and validated in
tablet dosage form as per ICH guide lines. The results of this validation are as
summarized in the report. The results are found to be complying with the acceptance
criteria for each of the parameter.
Waters Alliance HPLC (Empower software with PDA detector) with Zorbax Eclipse
XDB, C8,150 x 4.6mm, 5µ column, Injection volume of 10 µl is injected and eluted
with the Mobile phase (Buffer and ACN, in the ratio of 65:35) which was pumped at a
flow rate of 1.5 ml at 250 nm. The peak of Teriflunomide was found well separated at
6.0 min. The developed method was validated for various parameters as per ICH
guidelines like system suitability, accuracy, precision, linearity, specificity,
ruggedness, robustness and solution stability.
Hence it is concluded that the assay method is found to be valid in terms of
reliability, precision, accuracy and specificity and hence it is suitable for routine
analysis as well as for stability analysis.
Page 133
Chapter-10 Bibliography
Dept of Pharmaceutical Analysis 129 EGS Pillay College of Pharmacy
10.0 BIBLIOGRAPHY
1. Asian J. Research Chem. 2(3): volume 02, Issue 03, July ,September,2009
2. Chinese Journal of Analysis Laboratory;2007-10 WU Ji1,WANG Hua-dong2
LIU Hong-wei1,QU Ling-bo2(1.The Commercial Scientific Research Limit
Companies of Henan; Province,Zhengzhou,China 2.Department of
Chemistry,Zhengzhou University,Zhengzhou 450052,China)
3. Chromatographia Volume 67,Numbers 1-2, Sudhir S. Kamat, Vishal B.
Choudhari
4. Ewing G. W., Instrumental Methods of Chemical Analysis, McGraw Hill
Publishing Company Ins., 2nd Ed., 1960: 3.
5. Hohat H. Willard., Lunne L. Merrit, John A. Dean. Instrumental methods of
analysis, 7th
edition New Delhi: CBS Publishers; 1999
6. Instrumental methods of analysis, 7th
Edn., CBS Publishers, New Delhi.
7. International Conference on Harmonization, Validation of Analytical
Procedures: Methodology, Federal Register, Nov. 1996:1-8.
8. International Conference on Harmonization, Draft Guideline on Validation of
Analytical Procedures, Definitions and Terminology, Federal Register (26),
1995: 11260.
9. J AOAC Int. 2010 Jul-Aug;93(4):1207-14. Ganpat University, S.K. Patel
College of Pharmaceutical Education and Research, Department of
Pharmaceutical Chemistry.
10. J Chromatogr B Analyt Technol Biomed Life Sci.2007 Jul 1;854 Laboratory
of Clinical Psychopharmacology, Beijing Anding Hospital, Capital Medical
University, China. Guo W, Li W, Guo G, Zhang J, Zhou B, Zhai Y.
Page 134
Chapter-10 Bibliography
Dept of Pharmaceutical Analysis 130 EGS Pillay College of Pharmacy
11. Jeffery G. H., Bassett J., Medham J.and Denney R. C., Vogel’s Textbook of
Quantitative Chemical Analysis, English Language Book Society/ Longman,
5th Ed., 1989 :668.
12. Journal of Pharmacy Research, Vol 4, No 6 (2011). Paras N. Raveshiya1 and
Hetal R. Prajapati.
13. Journal of Liquid Chromatography & Related Technologies, Volume 33, Issue
19, 2010 , Dilek Dogrukol-Aka & Duygu Yeniceli
a
14. Journal of Liquid Chromatography & Related Technologies Volume 31, Issue
5, 2008 , Preview V.Nagaraju&A.M.Crouch.
15. Lloyd R, Snyder, Joseph J, Kirkland, Joseph L, Glajesh. Practical HPLC
method development. 2nd
edition, 1997, pp 1-14.
16. Lurie S. Ira and Wittwer, D. John Jr., HPLC in Forensic Chemistry, vii.
17. Sharma, B.K. Instrumutal Methods of Chemicals Analysis. 13th
edition., Goel
Publisher House, Meerut, 1994, 7.
18. Skoog D. A., West D. M. and Holler F. J., Fundamentals of Analytical
Chemistry, Saunders College Publishing, New York, 6th Ed., 713
19. Synder K.L, Krikland J.J and Glajch J.L: Practical HPLC Method
Development 2nd
Edn, Wiley-Interscience Publication, USA, 1983, 653-661.
20. Talanta. 2010 Jun 30;82(1): 398-403.Epub 2010 May 7.Bioelectro chemistry
Laboratory, Chemical and Pharmaceutical Sciences Faculty, University of
Chile. Pérez-Ortiz M, Muñoz C, Zapata-Urzúa C, Alvarez-Lueje A.
21. United State Pharmacopoeia, Vol. I & II, Asian edition, United
Pharmacopoeial Convention, Inc., Rockville, 2000:1923.
Page 135
Chapter-10 Bibliography
Dept of Pharmaceutical Analysis 131 EGS Pillay College of Pharmacy
22. United State Pharmacopoeia, Vol. I & II, Asian edition, United
Pharmacopoeial Convention, Inc., Rockville, 2000: 2149.
23. Vijay Malik, Drugs and Cosmetics Act 1940,16th
Edn., Eastern Book
Company,Lucknow,5
24. Willard H.H, Merritt L.L, Dean J.A. and settle F.A: Instrumental Methods of
analysis,7th
Edn, CBS Publishers and Distributors, New Delhi 1988, 436-439.
25. www.applgate.co.uk
26. www.drugbank.ca/drugs/ DB00710
27. www.en.wikipedia.org/wiki/Analytical_chemistry.
28. www.elchem.kaist.ac.kr/vt/chem-ed/sep/lc/hplc.htm
29. www.ijpsonline.com/article.as
30. www.ncbi.nlm.nih.gov/pubmed.
31. www.pubchem.ncbi.nlm.nih.gov/summary/summary.cgi?sid=7847419
32. www.rxlist.com/strattera-drug-patient.htm
33. www.scribd.com/doc/29394798/Strattera-atomoxetine-product-Monograph -
for-Canada
34. www.scribd.com/doc/50027780/atomoxetine-research-papers
35. www.springerlink.com/content/v2up3wv62172176w/
36. www.tandfonline.com/doi/abs
37. www.waters.com