128
BALANCED PARTICIPATION OF WOMEN AND MEN IN DECISION-MAKING Analytical report - 2016 data Gender Equality Commission (GEC)

BALANCED PARTICIPATIONOF WOMEN AND MENIN DECISION-MAKING
Analytical report - 2016 dataGender Equality Commission (GEC)

BALANCED PARTICIPATIONOF WOMEN AND MENIN DECISION-MAKING
Analytical report - 2016 dataGENDER EQUALITY COMMISSION (GEC)
Council of Europe

French edition: Participation équilibrée des femmes
et des hommes à la prise de décision.
All requests concerning the reproduction or translation of all or part of this document should
be addressed to the Directorate of Communication (F-67075 Strasbourg
Cedex or [email protected]). All other correspondence concerning
this publication should be addressed to the Equality Division of the
Directorate General of Democracy.
Cover design and layout: Documents and Publications Production
Department (SPDP), Council of Europe
© Council of Europe, September 2017 Printed at the Council of Europe.

Third round of monitoring on the implementation of
CM Recommendation Rec(2003)3on balanced participation of women and men
in political and public decision-making
Analytical report - 2016 data
Prepared on the basis of a report byKaren Celis and Silvia Erzeel
Department of Political Science, Vrije Universiteit Brussel


Page 5
CONTENTS
EXECUTIVE SUMMARY 7
INTRODUCTION 13
METHODOLOGY 19
I. LEGISLATIVE POWER 231. Lower/single houses 232. Upper houses 343. Regional Parliaments 36
II. EXECUTIVE POWER 411. National executives 412. Regional executives 483. Local executives 50
III. POLITICAL PARTIES 591. Representation of women in political parties 592. Measures related to gender equality taken by political parties 63
IV. JUDICIAL POWER 671. Gender balance in High/Supreme Courts 672. Gender balance in Constitutional Courts 693. Gender balance in High Councils of the Judiciary 71
V. DIPLOMATIC SERVICE 751. Gender balance among ambassadors extraordinary and plenipotentiary 752. Gender balance among envoys and ministers plenipotentiary 773. Gender balance among minister counsellors 794. Gender balance among general consuls 81
VI. COUNCIL OF EUROPE 851. Gender balance among delegations to the Parliamentary Assembly
of the Council of Europe 852. Gender balance among delegations to the Congress
of Local and Regional Authorities of the Council of Europe 873. Gender balance in the European Court of Human Rights 97
CONCLUSIONS 101
RECOMMENDATIONS FROM THE THIRD ROUND OF MONITORING 111
APPENDIX 115Recommendation Rec(2003)3 of the Committee of Ministers of the Council of Europe to member states on balanced participation of women and men in political and public decision-making 115Appendix to Recommendation Rec(2003)3 117
BIBLIOGRAPHY 123


Page 7
EXECUTIVE SUMMARY
I n 2003, the Committee of Ministers of the Council of Europe adopted Recommendation Rec(2003)3 on balanced participation of women and men in political and public decision-making (hereafter referred to as the
Recommendation). The governments of the member states committed them-selves to report regularly to the Council of Europe’s Committee of Ministers on the measures taken and the progress made in achieving a balanced participation of women and men in political and public life, defined as a minimum representa-tion of 40% of each sex.
Two earlier monitoring rounds took place in 2005 and 2008 and a comparative study on the results of the first and second rounds of monitoring of the Recommendation was published in 2010 (Council of Europe, 2010). For the third monitoring round, an online questionnaire was made available to all 47 Council of Europe member states in January 2016, and 46 of them participated in the survey. The data gathered reflect the situation in member states as of 1 January 2016, except for data on political representatives which refer to election-day results (up to 15 July 2016).1 This report analyses the data gathered in 2016 and where possible, comparisons are made with data collected in the two earlier monitoring rounds, in order to identify evolutions and trends.
The main findings of the 2016 third monitoring round are:
Legislative Power
Legislative power – summary table 2016
COUNTRIES REACHING THE 40%
TARGET IN 2016
AVERAGE % WOMEN IN 2016
EVOLUTION2005-2016
Lower/single houses 2 (4%) 25.6% +
Upper houses 023.9% (elected) +
+35.8% (appointed)
Regional parliaments 3 (18%) 25.6% +
1. Member states communicated the following information regarding changes which took place after July 2016: Luxembourg: the revised Law of 15 December 2016 (Bill 6892) on the financing of political parties now provides that political parties shall receive the full public allowance on the condition that they respect a quota of 40% of candidates of each sex for the national legislative elections and of 50% of each sex for the European elections. These provisions do not apply to communal elections. Iceland: parliamentary elections took place in October 2016 and women’s representation reached 48%. Croatia: parliamentary elections took place in September 2016 and women’s representation amounted to 18.5%. The share of women deputy prime ministers was 25% (one of four in total) and the share of women ministers was 20% (four of twenty in total). Germany: elections took place in November 2016 and a woman was elected president of the upper house. Elections took place at the level of federal states in September 2016; the percentage of women members of regional parliaments was 31.9%. Changes took place in the federal government in November and December 2016; the percentage of women senior and junior ministers was 33.3%. Changes also took place in relation to mayors; the percentage of women mayors in Germany was 9.3%.

Page 8 Balanced participation of women and men in decision-making - Analytical report - 2016
Only a few countries met the Recommendation’s minimum target of 40% elected women and men in any of their legislative bodies in 2016. The average proportion of elected women stayed at around 25% and was consistent across the legislative assemblies surveyed (lower/single houses, upper houses and regional parliaments). Although almost all the countries surveyed witnessed an increase in the representation of women in lower/single houses in the last decade (2005-2016), the proportion of countries within the 30-39.9% remained stable between 2005 and 2016. In the same way, the number of countries with a proportion of women legislators below 20% decreased but remained significant: 46% of the countries participating in the monitoring exercise in 2005, 44% in 2008 and 30% in 2016. The trend identified at the level of the lower houses/single parliaments also applies to the regional level: only three countries met the 40% minimum target in 2016. Trends at national level vary from sharp increase or decrease in some of the member states. A better gender balance in assemblies was accompanied by a better gender balance among internal positions of power within the legislative branch. Overall, the 2016 monitoring round points towards slight improvement for some indicators, but also towards stagnation.
Executive Power
Executive power positions – summary figure 2016
35%
30%
25%
20%
15%
10%
5%
0%
9.5%
0% 0% 0% 0%
14.3%12.2%
5.8%
9.0%6.2% 7.1%
27.4%
22.4%
19.4%
11.0%13.4%
26%
31.4%
Average % of women in 2016 % of countries reaching the 40% target in 2016
Heads of
state elected
by citiz
ens
Heads of s
tate
appointed by
parliament
Heads of
national
government
Deputy prime
ministers/
vice
presidents
Senior and
junior minist
ers
Heads of
regional
governments
Regional
governments
Mayors
Municipality
council
lors
The positions at the very top of the political power in 2016 in Europe were almost exclusively male dominated: less than 11% of the countries met the 40% minimum target for each sex, for those executive positions examined. The average proportion of women heads of state or government, heads of regional governments and mayors was below 17%. When comparing 2005 and 2016, a positive evolution was discerned only with regard to heads of states appointed by parliaments, heads of national governments and heads of regional governments, although women’s representation among heads of governments remained on average at

Executive summary Page 9
a low 12.2%, and 19.4% for heads of regional governments (compared to none and 6%, respectively, in 2005). The function of minister remained more or less stable, reaching 22.4% of women senior and junior ministers in 2016. At regional level, the 2005-2016 evolution was predominantly positive. In 2016, all regional governments observed but two were below the 40% minimum target, but they performed substantially better than national ones (22.4% women ministers in national governments on average compared to 31.4% in regional governments). At local level women counted on average for about a quarter of municipality councillors but the positive trend was less stable with sharp increases or decreases in certain countries. Overall at the executive level, the results in 2016 presented only a minor increase in the number and percentage of countries reaching the 40% minimum target. The average proportion of women mayors (on average 13%) and of national executives were in general well below the targeted standard.
Impact of electoral systems, of gender quotas or parity systems and of gender-sensitive regulations of political parties
Proportional electoral systems were more favourable to a balanced participation of women and men in political decision-making bodies, compared to majoritarian electoral systems. In 2016, the highest proportion of women members of the single/lower houses was found in countries using proportional list systems, while the lowest proportion of women members was found in single majority systems.
A number of countries introduced gender quota legislation or parity systems between 2005 and 2016: five countries reported having them for national elections in 2005 and 17 in 2016, which represents progress with regard to the implementation of the 2003 Recommendation. Such legislation, especially when it was strong, had a positive impact on achieving a better gender balance in a number of countries and at different levels. Countries that only had political party quotas performed better in terms of gender balance in the lower/single houses than countries with quota legislation or legal parity systems, even when such legislation was combined with voluntary political party quotas. There was a strong correlation between the strength of the legislative quotas (measured in terms of quota percentage, whether they include a rank order for women and men, and whether they include sanctions and, if so, the type of sanction) and the percentage of women elected in national elections. In the five countries that had quota legislation or parity systems both in 2005 and 2016, women’s representation increased significantly. This seems to point at a positive impact of such measures over time, notwithstanding interval fluctuations.
Countries with political party quotas, rules or regulations, either for national elections or for internal party decision-making bodies, had on average higher levels of women in national lower houses, among party executives and among party members, than countries without such measures. However, including gender equality principles in legal frameworks for political parties or in laws on the public funding of political parties did not seem to automatically lead to significantly better results.
Furthermore, the provision of training for women candidates appears to have played a moderate role and did not lead to substantially better gender balance in

Page 10 Balanced participation of women and men in decision-making - Analytical report - 2016
national lower houses, among party executives or among party leaders. Training party leaders, executives and bodies responsible for the selection of candidates could increase the impact of training.
Judicial Power
Judicial power – summary figure
Constitutional Courts
High/Supreme Courts
High Councils of the Judiciary
0% 5% 10% 15% 20% 25% 30% 35% 40%
26%
33%
36%
22%
28%
28%
Average % of women in 2016 Responding countries reaching the 40% target in 2016
The findings show some positive evolutions in 2016, compared to 2005, regarding the judiciary but very few courts reached the 40% minimum target set by the Recommendation. On average, the representation of women in High/Supreme Courts was 33%, 28% in High Councils of the Judiciary and 26% in Constitutional Courts. The proportion of countries reaching the 40% minimum target was significantly higher in the High Councils of the Judiciary (36%) than in High/Supreme Courts (28%) or Constitutional Courts (22%). High/Supreme Courts witnessed a positive evolution between 2005 and 2016. This general trend should be read together with the sometimes significant increases and decreases in the number of women judges at the individual country level. In addition, the data show no link between the appointment method (whether by the head of state, government: high council of the judiciary, or in another way) and gender balance among judges in High/Supreme Courts.
Diplomatic service
The number of countries where the various functions of the diplomatic service reached the 40% minimum target was very low, especially for the highest functions, and in 2016 some countries had no women diplomats in some of the

Executive summary Page 11
functions within the diplomatic system. Furthermore, there were great variations between countries and over time concerning the participation of women and men at different levels of the diplomatic service. Of the diplomatic functions included in the study, the number of minister counsellors (lowest rank examined) had on average the highest number of women diplomats (just under a third). Also, the gender balance among envoys and ministers plenipotentiary (second lowest rank) was relatively positive (about a quarter). For all four functions considered, the most populated group of countries was the one scoring below 20% of women. The overall low proportion of women ambassadors (13%) was among the least gender balanced in the 2016 monitoring round, together with mayors and heads of state and government. These data clearly demonstrate the persistence of a glass ceiling in the diplomatic sector.
Council of Europe
Council of Europe – summary table
COUNTRIES REACHING THE MINIMUM 40%
TARGET IN 2016
AVERAGE % WOMEN IN 2016
EVOLUTION2005-2016
Parliamentary Assembly 21 (45.7%) 35.7% +
Chamber of Local
Authorities
Members 22 (46.8%)43% +
Substitutes 21 (55.3%)
Chamber of Regions
Members 22 (58%)44.8% +
Substitutes 24 (52.2%)
European Court of Human Rights 34.8% +
The results regarding gender balance in the Council of Europe bodies analysed showed positive developments. Both the Chamber of Local Authorities and the Chamber of Regions of the Council of Europe Congress of Local and Regional Authorities reached the minimum recommended target of 40% women in 2016 (43% and 44.8% respectively). Both bodies also showed major improvements compared to 2005.
The average percentage of women in the Parliamentary Assembly, on the other hand, remained below the 40% target (36%). Almost half of the country delegations reached the 40% minimum target in 2016.
The European Court of Human Rights saw a small improvement in 2016 compared to 2005, but with women making up on average only 35% of the judges, the Court has yet to achieve the targeted gender balance.

Page 12 Balanced participation of women and men in decision-making - Analytical report - 2016
Recommendations
Based on the findings of this monitoring exercise, the following seven recommendations are put forward:
1. Maintain and give further impetus to the commitment towards achieving bal-anced participation of women and men in political and public decision-making bodies.
2. Adopt strategies, policy and legislative measures to implement paragraph VI of the Recommendation and meet the 40% minimum target. This could be done through a double approach: a ‘problem-driven focus’ for the most problematic areas; and an ‘opportunity-driven focus’ for those areas where progress has been made and where only an ‘extra mile’ is needed to reach the 40% minimum target.
3. For both strategies, gender quota laws or parity systems as well as political party quotas can be considered. Where gender quota laws already exist, member states should consider making existing gender quota laws stricter (for instance by increasing the quota percentage, imposing rank order rules, and introducing or strengthening sanctions). These countries should also consider the introduc-tion of political party quotas.
4. Consider the advantages of proportional representation vis-à-vis majoritarian systems.
5. Support initiatives to include gender equality principles in legal frameworks for political parties and in laws on public funding of political parties and ensure that such provisions are supported by an active commitment to bring more women into political parties.
6. Reflect on and address the existence of gender biases in the functioning, re-cruitment and selection practices within political parties.
7. Provide training not only for women candidates, but also for all party leaders, executives and for bodies responsible for selecting candidates for elections (selectorates).
Finally, specific measures to achieve a gender balance in political and public decision-making should be part of a larger strategy to promote equality between women and men in all areas. A gender balance in decision making cannot be reached if other areas of public and private life remain fundamentally unbalanced.

Page 13
INTRODUCTION
T he target and how to get there: Council of Europe Recommendation Rec(2003)3 on balanced participation of women and men in political and public decision-making.
In 2003, the Committee of Ministers of the Council of Europe adopted Recommendation Rec(2003)3 on balanced participation of women and men in political and public decision-making (further referred to as the Recommendation). It includes eight recommendations addressed to the governments of member states so that they:
I. commit themselves to promote balanced representation of women and men by recognising publicly that the equal sharing of decision-making power be-tween women and men of different background and ages strengthens and enriches democracy;
II. protect and promote the equal civil and political rights of women and men, including running for office and freedom of association;
III. ensure that women and men can exercise their individual voting rights and, to this end, take all the necessary measures to eliminate the practice of family voting;
IV. review their legislation and practice, with the aim of ensuring that the strategies and measures described in this recommendation are applied and implemented;
V. promote and encourage special measures to stimulate and support women’s will to participate in political and public decision-making;
VI. consider setting targets linked to a time scale with a view to reaching balanced participation of women and men in political and public decision-making;
VII. ensure that this recommendation is brought to the attention of all relevant political institutions and to public and private bodies, in particular national parliaments, local and regional authorities, political parties, civil service, public and semi-public organisations, enterprises, trade unions, employers’ organisations and non-governmental organisations;
VIII. monitor and evaluate progress in achieving balanced participation of women and men in political and public life, and report regularly to the Committee of Ministers on the measures taken and progress made in this field.

Page 14 Balanced participation of women and men in decision-making - Analytical report - 2016
Importantly, balanced participation of women and men is defined by the Recommendation as follows: “the representation of either women or men in any decision-making body in political or public life should not fall below 40%” (Appendix to Recommendation Rec(2003)3).
The Recommendation indicates three types of measures that member states are invited to consider in order to reach the target: 1) legislative and administrative measures to achieve gender balance in political and public decision-making; 2) supportive measures to the same end; 3) monitoring the progress made.
Regarding the legislative and administrative measures to achieve gender balance in political and public decision-making, the Recommendation lists 17 measures to be taken by member states. They include: constitutional/legislative reforms; administrative measures; action through the funding of political parties; the reform of electoral systems; obligations regarding appointments made by ministers, governments and public authorities to public committees, posts or functions and national delegations. They envision: restricting the holding of several elected political offices simultaneously; improving the working conditions of elected representatives; facilitating the reconciliation of work and family life; making selection, recruitment and appointment processes for leading positions in public decision making gender sensitive and transparent; taking time off from employment for participating in political and public decision-making without being penalised.
Furthermore, the Recommendation attributes an exemplary role to public administrations in terms of gender-balanced distribution of decision-making positions and equal career development. It further refers to establishing, supporting and strengthening national equality machineries, including parliamentary committees, to implement gender mainstreaming.
Additionally, the Recommendation includes 24 supportive measures. These con-cern: supporting the programmes of women’s and gender equality organisations that aim at stimulating a gender balance in political life and public decision-mak-ing; setting up a data bank of women willing to run for office; organising seminars and training on gender equality for key people in society (leaders and top officials) and media professionals (journalists). Women candidates and elected representa-tives should further be supported by setting up networks for elected women and by developing mentoring or work-shadowing programmes and information and communication technology training. Especially girls, young women and women from ethnic and cultural minorities should be encouraged for greater involvement. School curricula should therefore include training activities and youth organ-isations should ensure balanced participation of women and men in their deci-sion-making structures.
A wide variety of actors are called upon to implement these supportive measures: political parties; social partners (employers’ and workers’ organisations); enterprises and organisations, in particular those subsidised for providing public services or implementing public policies; the media. Campaigns should be used to: raise awareness of the importance of gender balance in political and public decision-making among the general public, politicians, social partners and those who

Introduction Page 15
recruit and nominate political and public decision-makers; and encourage a more equal sharing of responsibilities between women and men in the private sphere. Furthermore, research should be conducted about women’s voting behaviour, and the conditions, measures and impact of gender balanced participation in political and public decision-making.
The seven monitoring measures suggested to member states in the Recommendation require establishing independent monitoring bodies, the setting up of indicators and the gathering of gender-disaggregated data. The Recommendation puts forward ten indicators to measure progress:
1. the percentage of women and men elected representatives in parliaments and local assemblies, according to political party;
2. the percentage of women and men elected representatives in parliaments, compared to the number of candidates according to political party (the success rate);
3. the percentage of women and men in national delegations to nominated assemblies;
4. the percentage of women and men in national, federal and regional governments;
5. the number of women and men senior/junior ministers in the different fields of action (portfolios/ministries) of the national, federal and regional govern-ments of member states;
6. the percentage of the highest ranking women and men civil servants and their distribution in different policy fields;
7. the percentage of women and men judges in supreme courts;
8. the percentage of women and men in bodies appointed by the government;
9. the percentage of women and men in the decision-making bodies of political parties at national level;
10. the percentage of women and men members of employer, labour and pro-fessional organisations, and the percentage of women and men in their decision-making bodies at national level.
Based on these indicators, reports on the measures taken and progress made should be submitted to parliaments and to the wide public. Gender-disaggregated statistics should be made readily accessible and the visibility and portrayal of women and men in the news and current affairs programmes should be analysed on a regular basis.
More than numbers: monitoring and reporting
As indicated, the governments of the member states committed themselves to report regularly to the Council of Europe Committee of Ministers on the measures taken and the progress made in achieving balanced participation of women and men in political and public life. For this purpose, the former Steering Committee for Equality between Women and Men (CDEG) organised two rounds of monitoring, in 2005 and 2008, using the same questionnaire to collect data from member states.

Page 16 Balanced participation of women and men in decision-making - Analytical report - 2016
The Gender Equality Commission2 launched the third monitoring round in 2016, using a revised and extended questionnaire (see the Methodology section and the Appendix).
This report analyses the data gathered in 2016,3 where possible comparing it with data gathered in 2005 and 2008 in order to identify evolution and trends. The analysis of the 2005 and 2008 data was published in a 2010 study: ‘Parity democracy: A far cry from reality. Comparative study on the results of the first and the second rounds of monitoring of the Council of Europe Recommendation Rec(2003)3 on balanced participation of women and men in political and public decision-making’,4 (further referred to as the 2010 study).
This report is accompanied by a complementary document compiling statistical data gathered during the 2016 monitoring round of the Council of Europe Recommendation Rec(2003)3 on balanced participation of women and men in political and public decision-making. This document entitled “Sex-disaggregated statistics on the participation of women and men in political and public decision-making in Council of Europe member states - Situation as at 15 July 2016” is available on the gender equality website of the Council of Europe.
The main aims of this report are to present and analyse the data collected in 2016, and more precisely to assess:
1. to which extent member states of the Council of Europe have reached the minimum target set by Recommendation Rec(2003)3 on balanced participation of women and men in political and public decision-making: i.e. a minimum of 40% of each sex. This minimum target should be reached in each decision-making body in the political and public sphere in the 47 Council of Europe member states, including the judiciary and diplomatic services.
2. the evolution and trends of women and men’s numerical representation in the key political and public decision-making bodies of member states; i.e. a comparison and analysis of developments between 2005 and 2016.
3. the efforts of member states to achieve a gender balance in decision making, including the types of measures taken and their impact.
Even though the current report focuses mostly on the number of women and men in political and public decision-making, it should be noted that the Recommendation goes far beyond increasing the numbers of women in
2. The Gender Equality Commission, the Council of Europe body in charge of promoting gender equality, replaced the CDEG in 2012.
3. The data in this report refer to the situation on 1 January 2016, except for data on political representatives which refer to election-day results (up to 15 July 2016).
4. Study prepared by Regina Tavares da Silva, Council of Europe consultant.

Introduction Page 17
political and public decision-making. It aims at achieving gender equality and promoting structural changes in the way our democracies function. This is evident from the eight key recommendations put forward, the legislative, administrative and supportive measures, and the scope of the monitoring. In this sense, the Preamble of Recommendation Rec(2003)3 points to the fact that a balanced participation of women and men in political and public decision-making is “a matter of the full enjoyment of human rights and of social justice, and a necessary condition for the better functioning of a democratic society”. Therefore, the degree of women’s participation in political and public decision-making bodies is not just a numerical indicator. It is in fact a key indicator of gender equality and women’s full enjoyment of their human rights and, at the same time, a condition for gender equality, social justice and true democracy.
The balanced participation of women and men in political and public decision-making is also an indicator of, and a condition for, the inclusiveness of these areas. The Preamble of the Recommendation states that the realisation of balanced participation of women and men in political and public decision-making “would lead to better and more efficient policy making through the redefinition of political priorities and the placing of new issues on the political agenda as well as to the improvement of quality of life for all”, and it is “needed for the development and construction of a Europe based on equality, social cohesion, solidarity and respect for human rights”.
To conclude, numbers are not just numbers. They tell us about the extent to which political and public decision-making processes are open to women, and hence about how democratic and fair they are.


Page 19
METHODOLOGY
T he data collected for this third monitoring round focused on the situation of women and men in different areas of public and political decision-making. An online questionnaire was made available to all Council of Europe member
states in January 2016. The data in this report refer to the situation as at 1 January 2016, except for data about political representatives which refer to the results of the most recent elections which took place up to and including 15 July 2016. In total, 46 member states of the Council of Europe participated in the survey. In addition, data were also gathered on the presence of women and men in different Council of Europe bodies.
The 2016 questionnaire, adopted by the Gender Equality Commission (GEC), was an enriched version of the questionnaire used in 2005 and 2008, and identical for all countries. It was divided into five main parts:
1. Legislative power2. Quota rules applied to elections3. Executive power4. Judicial power5. Diplomatic service
The present analysis offers an overview of women and men’s representation in each of the different sectors in 2016. If and where possible, the report compares 2016 data to the previous monitoring rounds (in 2005 and 2008), to offer a comparison over time. When data from 2005 and 2008 are used in the present report, they were drawn from the two previous data collection reports of the Council of Europe (“Sex-disaggregated statistics on the participation of women and men in political and public decision-making in Council of Europe member states - Situation as at 1 September 2005” and “Sex-disaggregated statistics on the participation of women and men in political and public decision-making in Council of Europe member states - Situation as at 1 September 2008”) and from the 2010 study and should be credited as such.

Page 20 Balanced participation of women and men in decision-making - Analytical report - 2016
Most of the Tables and Figures in the core of this report reflect percentages rather than absolute numbers. Only in cases where percentages could not be calculated, due to an overall low number of cases, absolute numbers are used. Absolute figures for 2016 are provided in the complementary document compiling statistical data gathered during the 2016 monitoring round (“Sex-disaggregated statistics on the participation of women and men in political and public decision-making in Council of Europe member states - Situation as at 15 July 2016”). 5
By comparing data available for the three monitoring rounds, the present report can put the findings of 2016 into perspective and offer a more longitudinal analysis of women and men’s presence in public and political decision-making. This analysis over time is conducted by comparing the results of 2016 directly to the results of 2005 (‘percentage of women in 2016 – percentage of women in 2005’) for the different bodies. Such a comparison over time is very useful, but it also has some limitations. Firstly, a comparison over time is obviously only possible for countries that provided information in both monitoring rounds. Secondly, it should be clear that a comparison between 2005 and 2016 can never reveal any real long-term trends over an 11-year period, because this report compares two moments (or ‘snapshots’) in time. Therefore, the changes in women and men’s presence revealed in our comparisons do not reflect interval fluctuations.
The number of countries that took part in the 2016 monitoring cycle is typically (much) larger than the number of countries included in 2005 and 2008. This is partially due to differences in response rates (36 countries completed the questionnaire in 2005, 42 in 2008 and 46 in 2016), but is also linked to the fact that the 2010 study only included data for countries that responded in both rounds (2005 and 2008). In the current report, countries that have at least one entry in either 2005, 2008 or 2016 were selected for the Tables and Figures. The tables in the complementary statistical document6 present a different comparative perspective in this regard as they include only countries which responded in the three rounds.
The 2016 questionnaire contained a question regarding voluntary political party quotas in relation to ethnic minority or migrant women both in terms of elections and regarding internal party structures, but as no member state replied yes to having such quotas for elections, there is no table covering this aspect. Only one political party in one country (Slovenia) replied that it had quotas for ethnic minority or migrant women regarding its internal party structures.
The tables in this report include average percentages for each monitoring round. The average percentages for 2005 and 2008 are based on the results in the 2010 study. The average percentages for 2016 have been calculated on the basis of percentages from the countries that replied to a specific question in 2016. Due to the different response rate in 2005, 2008 and 2016, average percentages for each year are calculated on the basis of different sets of countries, and can therefore
5. Available on the gender equality website of the Council of Europe.6. Sex-disaggregated statistics on the participation of women and men in political and public
decision-making in Council of Europe member states - Situation as at 15 July 2016, available on the gender equality website of the Council of Europe.
Methodology Page 21
not be (easily) compared. In the tables presented in the complementary statistical document, whenever possible, averages are calculated on the basis of absolute figures, which explains some differences of results.
In the tables in this report, figures above the 40% minimum target set by the Council of Europe Recommendation Rec(2003)3 on balanced participation of women and men in political and public decision-making are marked in green. Positive evolutions of more than 10 percentage points are marked in bold.
Whenever data were not provided by member states, a “not available” (N/A) mention was included in the tables. When the data provided was zero, a 0 or 0% was included in the tables. For tables covering qualitative issues (quotas, etc.), when member states had not adopted policy measure, this was indicated by “No” or by a “–“ sign.


LEGI
SLAT
IVE P
OWER
JUDI
CIAL
POW
ERPO
LITI
CAL P
ARTI
ESCO
UNCI
L OF E
UROP
EEX
ECUT
IVE P
OWER
DIPL
OMAT
IC SE
RVIC
ELE
GISL
ATIV
E POW
ER
Page 23
I. LEGISLATIVE POWER
1. Lower/single houses
1.1 Numbers and evolution
Table 1 provides an overview of the proportion of women in single/lower houses in 2005, 2008 and 2016. The results show that in 2016, out of the 46 countries that provided data, only two (4% of countries) met the 40% minimum recommended target (Finland and Sweden). In 2005, only one country out of 35 – and in 2008, three countries out of 41 – reached the minimum target. In 2016, about one third of the countries (i.e. 17 out of 46 countries) featured a proportion of women representatives of over 30%, similarly to the findings in 2005 (with 10 out of 35 countries). In 2016, five countries had a proportion of women representatives very close to the target, at over 39% (i.e. Belgium, Iceland, Netherlands, Norway and Spain). The number of countries with less than 20% of women representatives decreased compared to earlier figures. In 2005, the situation was the worst (with 17 out of 35 countries or 49%), this proportion decreased significantly in 2016 (30%). However, both in 2008 and in 2016 a significant proportion of the countries participating in the monitoring exercise had a proportion of women legislators below 20% (i.e. 18 out of 41 countries or 44% in 2008, and 14 out of 46 countries or 30% in 2016).
Table 1. Percentage of women elected to single/lower houses (2005-2016)
MEMBER STATE
2005 2008 2016COMPARISON 2005-2016 IN PERCENTAGE
POINTSWOMAN
PRESIDENT%
WOMENWOMAN
PRESIDENT%
WOMENWOMAN
PRESIDENT%
WOMEN
Albania N/A N/A 22.9% N/A
Andorra N/A N/A 35.7% N/A
Armenia 5.3% 8.4% 9.9% +4.6
Austria 33% 25.8% √ 33.3% +0.3
Azerbaijan 10.5% 11.2% 16.8% +6.3
Belgium 34.7% 37.3% 39.3% +4.6
Bosnia and Herzegovina 16.1% 11.9% 21.4% +5.3
Bulgaria N/A 21.7% √ 18.8% N/A
Croatia 21.1% 21.6% 20.5% -0.6
Cyprus 16.1% 16.1% 17.9% +1.8
Czech Republic 16% 15.5% 19.5% +3.5

Page 24 Balanced participation of women and men in decision-making - Analytical report - 2016
MEMBER STATE
2005 2008 2016COMPARISON 2005-2016 IN PERCENTAGE
POINTSWOMAN
PRESIDENT%
WOMENWOMAN
PRESIDENT%
WOMENWOMAN
PRESIDENT%
WOMEN
Denmark 36.9% 38% √ 38.3% +1.4
Estonia √ 19.8% √ 20.8% 23.8% +4
Finland 38% 41.5% √ 41.5% +3.5
France 12.3% 18.5% 26.9% +14.6Georgia N/A 5.1% 12% N/A
Germany 32.8% 32.2% 36.5% +3.7
Greece √ 13% 16% 18.3% +5.3
Hungary √ 9.1% √ 11.2% 10.1% +1
Iceland √ 33.3% 33.3% 39.7% +6.4
Ireland 13.9% 13.3% 22.2% +8.3
Italy 6.8% 21.1% √ 31.1% +24.3Latvia √ 18% 21% √ 20% +2
Liechtenstein 24% 24% 20% -4
Lithuania 20.6% 22% √ 23.4% +2.8
Luxembourg 20% 23.3% 28.3% +8.3
Malta N/A 8.7% 10.1% N/A
Monaco 20.8% 25% 20.8% 0
Montenegro N/A √ 11.1% 13.6% N/A
Netherlands 34.7% 41.3% √ 39.3% +4.6
Norway 37% 37.9% 39.6% +2.6
Poland N/A N/A 27.2% N/A
Portugal 25.2% 28.3% 33% +7.8
Republic of Moldova N/A N/A 20.8% N/A
Russian Federation N/A 14.2% 13.6% N/A
San Marino N/A 11.7% 16.7% N/A
Serbia N/A √ 21.6% √ 34.4% N/A
Slovak Republic 14.7% N/A 20% +5.3
Slovenia 13.3% 11.1% 35.6% +22.3Spain 36% 35.1% 39.7% +3.7
Sweden 46.4% 46.4% 43.6% -2.8
Switzerland √ 26.5% 28.5% √ 32% +5.5
“The former Yugoslav Republic of Macedonia”
20% 31.7% 35% +15
Turkey 4.4% 9.1% 14.7% +10.3Ukraine 4.9% 8.4% 11.3% +6.4
United Kingdom 19.7% √ 19.8% 29.5% +9.8
Average/Total 6 21.6% 5 22.0% 10 25.6%
Note: For information concerning women presidents of single/lower houses, see Table 3.

Legislative power Page 25
LEGI
SLAT
IVE P
OWER
JUDI
CIAL
POW
ERPO
LITI
CAL P
ARTI
ESCO
UNCI
L OF E
UROP
EEX
ECUT
IVE P
OWER
DIPL
OMAT
IC SE
RVIC
ELE
GISL
ATIV
E POW
ER
In 2016, the average of women’s representation in national lower house/single parliaments was 25.6%. Between 2005 and 2008 there was an increase of women in single/lower houses in about two thirds of the countries that participated in the 2005 and 2008 monitoring rounds. Between 2005 and 2016, there was an increase in all the countries that participated in the 2005 and 2016 monitoring rounds except for four.
Almost all the countries surveyed witnessed an increase in the representation of women in lower/single houses in the last decade (2005-2016). In two countries (Italy and Slovenia) the increase was substantial (over 20 percentage points). These countries were among those with the lowest numbers of women in 2005, and reached more than 30% of women in 2016. However, other countries with remarkably low numbers of women members of Parliament in 2005 (Armenia, Greece, Hungary, Ireland, Ukraine) witnessed only a minor increase in 2016. Liechtenstein and Sweden witnessed a slight decrease, while Sweden still presented the highest percentage of women members in its lower/single house (43.6%).
The 2010 study concluded that there was a positive development in the 2005-2008 periods (Council of Europe, 2010, page 14). This conclusion was based on the fact that there had been an increase in the number of countries reaching the 40% minimum target between 2005 and 2008, and on the increase of the overall average percentage of women in parliaments. In 2016, the average percentage of women in the lower/single houses showed an increase since 2005; the proportion of countries reaching the 40% minimum target remained stable; and the proportion of countries in the “promising” 30-40% range also remained stable. Proportionally, more countries witnessed an increase in the proportion of women in the lower/single houses, significantly less countries were in the category of below 20% (30% compared to 51% in 2005) but this proportion was still high. Hence, overall the 2016 findings point at a slight improvement or stagnation: the positive development that was reported in 2010 (based on the 2005 and 2008 monitoring rounds) did not clearly substantiate over time. Given that the percentages of women in single/lower houses are generally seen as a key indicator of women’s political representation, this is a key finding.
The 2010 study attributed the positive evolution to “the effect of the recommendation itself and of its guidelines, to a growing awareness of the importance of women’s equal participation as a democratic requirement, to the impact of the electoral system of quota laws or regulations, as well as to other factors, including a simple natural evolution” (Council of Europe, 2010, page 14). The 2016 monitoring round, on the other hand, warrants that a positive evolution is not a given. Stagnation, even setbacks, can occur even when the same conditions are in place.
1.2 Electoral systems
Besides collecting data about the presence of women and men in public and political decision-making, the 2016 questionnaire also gathered information on

Page 26 Balanced participation of women and men in decision-making - Analytical report - 2016
the type of electoral systems used in Council of Europe member states. Based on the questionnaire, seven types of electoral systems were identified:
f Plurality-majority – simple majority or first past the post: 4 countries
f Plurality-majority – absolute majority (two round system): 1 country
f Proportional representation – open lists: 16 countries
f Proportional representation – closed lists: 11 countries
f Proportional representation – other: 6 countries
f Semi-proportional representation system – open lists: 2 countries
f Semi-proportional representation – closed lists: 5 countries.
For each type of electoral system, the percentage of women elected in single/lower houses was calculated (see Figure 1). Some categories included only a limited number of countries in 2016. France was, for instance, the only country in the ‘two-round majority’ category; Greece and Lithuania were the only two countries with a semi-proportional, open list system. The interpretation of the results in Figure 1 needs to take this situation into account, as some percentages are based on only one or two countries.
Figure 1. Percentage of women elected in single/lower houses by electoral system (2005-2016)
19.5%19.2%
26.1%
Two rounds
majority
Simple majority or first past
the post
Semi-proportional:
open list
Semi-proportional:
closed list
Proportional representation:
other list
Proportional representation:
open list
Proportional representation:
closed list
0% 5% 10% 15% 20% 25% 30% 35%
% women 2016 % women 2008 % women 2005
26.9%
16.3%18.5%
24.8%
13.9%18.9%
20.0%
4.9%12.0%
23.0%
19.5%22.4%
30.2%
30.3%25.8%
30.5%28.2%
27.3%

Legislative power Page 27
LEGI
SLAT
IVE P
OWER
JUDI
CIAL
POW
ERPO
LITI
CAL P
ARTI
ESCO
UNCI
L OF E
UROP
EEX
ECUT
IVE P
OWER
DIPL
OMAT
IC SE
RVIC
ELE
GISL
ATIV
E POW
ER
Electoral systems matter greatly to achieve a gender-balanced representation of women and men. It is well established that proportional list systems in general offer more opportunities for the representation of a diverse group of elected politicians than majority systems (Norris 2004; Matland & Studlar 1996). Candidate lists in proportional list systems are more likely to be representative of the entire population and to include candidates who can represent a diversity of social backgrounds, including women. Parties in majority systems, on the other hand, select candidates who they believe can win over the ‘median voter’. In general, this tends to benefit men and outgoing representatives.
Looking into different types of proportional systems, according to research, the effect of open or closed lists is found to be conditional. When the party leadership is more strongly in favour of gender equality than the party voters, closed lists are favourable for women because in this case the party leadership has more power in deciding who gets elected. In contrast, when the party leadership is not in favour of gender equality, open lists are more favourable for women’s representation, especially when the voters are less biased against women (Norris 2004; Leyenaar 2004).
In 2016, the highest percentages of women members of single/lower houses were found in countries with proportional list systems (between 26% and 30%); and the lowest, in the two countries with a semi-proportional open list systems (20%) and in simple majority systems (24.8%). This confirms the results from both the 2005 and the 2008 monitoring. The percentage of women elected in the two-round majority system was exceptionally high; but given that this category included only one member state (France, which has a parity system), a strong conclusion cannot be drawn. The overall findings show that electoral system design is important, but not all that matters for establishing gender equality in parliaments. In addition, even under proportional rules, the minimum target of 40% of women was not reached (Dahlerup & Leyenaar eds. 2013).
The findings regarding the effect of open or closed lists were not clear-cut either. In the case of proportional systems, open lists presented the highest percentages of women elected to the single/lower houses in 2005 and 2008, but not 2016. However, when applied to semi-proportional systems, open lists did not lead to a higher percentage of women, compared to closed lists (i.e. 20% and 23% respectively in 2016). This confirms previous findings that the effects of closed or open lists are neither straightforward nor automatic.
1.3 Gender quotas/parity systems
Besides electoral systems, gender quotas or parity systems can have a major impact on the gender balance in political representation. Gender quotas can take many forms (Krook 2009). The difference between gender quota laws and parity systems is that gender quota laws are temporary legal measures providing for a minimum proportion (30% or 40% for example) of the under-represented sex (usually women) to be included among candidates to an election. Parity systems are permanent rules and aim at reaching 50/50, the equal representation of women and men in decision-making bodies.

Page 28 Balanced participation of women and men in decision-making - Analytical report - 2016
Another basic distinction differentiates between quota laws or parity systems that are legally binding for all political parties, on the one hand, and political party quotas that political parties adopt voluntarily, on the other hand. Based on a combination of these two forms of quotas, the following classification can be made:
Countries with quota laws/parity systems and political party quotas (5) Croatia, Ireland, Montenegro, Norway, Slovenia.
Countries with quota laws/parity systems only (15)
Albania, Armenia, Belgium, Bosnia and Herzegovina, France, Georgia, Greece, Italy, Poland,
Portugal, San Marino, Serbia, Spain, “the former Yugoslav Republic of Macedonia”, Ukraine.
Countries with political party quotas only (13)
Austria, Cyprus, Czech Republic, Estonia, Germany, Iceland, Lithuania, Luxembourg, Republic of Moldova, Sweden, Switzerland,
Turkey, United Kingdom.
Countries without any type of quota or parity system (11)
Andorra, Azerbaijan, Bulgaria, Finland, Hungary, Latvia, Malta, Monaco, Netherlands,
Russian Federation, Slovak Republic.
It follows from this classification that some form of quota/parity legal or voluntary system has been implemented in 75% of the member states reporting on it (33 out of 44).
Figure 2. Average percentage of women in lower/single houses, by gender quota type (2016)
Countries with political party
quotas only
Countries with both quota laws/
parity systems and political party quotas
Countries with quota laws/parity
systems only
Countries without any type of quotas
or parity system
28.8%
26.3% 25.3%23.1%
35%
30%
25%
20%
15%
10%
5%
0%
Aver
age
% w
omen
Note: Information on political party quotas was collected for the five parties with the highest seat share in the lower/single house elections.

Legislative power Page 29
LEGI
SLAT
IVE P
OWER
JUDI
CIAL
POW
ERPO
LITI
CAL P
ARTI
ESCO
UNCI
L OF E
UROP
EEX
ECUT
IVE P
OWER
DIPL
OMAT
IC SE
RVIC
ELE
GISL
ATIV
E POW
ER
Figure 2 is very revealing with regard to the impact of gender quotas. Most importantly, it shows that the differences in the percentages of women elected to lower/single houses in countries with and without gender quota laws depends on the types and strength of the quota legislation. In 2016, the average percentage of women elected in countries without any type of gender quotas was 23.1%; in countries with quota laws/parity systems, it was 25.3%; in countries with both types of gender quotas, it was 26.3%; and in countries with voluntary party quotas only it was 28.8%. The fact that there is only a two-percentage point difference between countries with legally-binding gender quotas and countries without any type of quota shows that there seems to be a glass ceiling for women’s political representation that even some types of legislative quotas do not break. As it is discussed below, this interesting finding can at least partially be explained by the design of the quotas. The strength of the quota legislation or parity system is therefore found to be more important than just their existence.
The finding that the difference (two percentage points) between countries with legally-binding gender quotas and countries without such quotas is rather small speaks to the literature on legal quotas adapting to the country’s ‘acceptable minimum’, i.e. legal quotas are set at the minimum level acceptable for the least willing party, thereby potentially discouraging any additional efforts by political parties that would have gone further otherwise (Dahlerup & Leyenaars eds. 2013).
Figure 2 shows that the biggest difference in the proportion of women elected in the single/lower house according to quota type was between countries with political party quotas (28.8%) and countries without any quotas (23.1%). Moreover, political party quotas produce a higher percentage of elected women (28.8%) than countries with quota laws or parity systems (25.3%). The explanation may be that political parties that are committed to gender balance set their target relatively high and implement these voluntary party quotas more effectively (Meier 2012).
Table 2 shows an important increase in the number of countries reporting the introduction of gender quota legislation or of a parity system between 2005 and 2016, which is a positive evolution as regards the measures suggested by the Recommendation: 5 countries in 2005 and 17 in 2016.
The data also point to the above finding concerning gender quota laws or parity systems: their impact and their effectiveness greatly depend on their design and in particular on:
f The minimum level of the target for candidates of each sex on electoral lists (quota percentage).
f The presence of a rule on rank order (no, yes).
f The presence and strength of sanctions for non-compliance (no sanction, financial penalty or lists not accepted when they do not comply).

Page 30 Balanced participation of women and men in decision-making - Analytical report - 2016
Table 2. Member states with gender quota laws/parity systems for national elections, their design and their effectiveness (2005 and 2016)
YEAR MEMBER STATE
QUOTA PERCENTAGE
RANK ORDER SANCTIONS % WOMEN
ELECTED
2005
Armenia 5% No No 5.3%
Belgium 50% Yes Yes, lists not accepted 34.7%
Bosnia and Herzegovina 33% Yes Yes, lists not
accepted 14.3%
France 50% No Yes, financial penalty 12.3%
“The former Yugoslav
Republic of Macedonia”
30% No Yes, lists not accepted 20%
2016
Albania 30% Yes Yes, financial penalty 22.9%
Armenia 25% No Yes, lists not accepted 9.9%
Belgium 50% Yes Yes, lists not accepted 39.3%
Bosnia and Herzegovina 40% Yes Yes, lists not
accepted 21.4%
Croatia 40% No Yes, financial penalty 20.5%
France 50% No Yes, financial penalty 26.9%
Georgia 30% No No 12%
Greece 33% No Yes, lists not accepted 18.3%
Ireland 30% No Yes, financial penalty 22.2%
Montenegro 30% Yes Yes, lists not accepted 13.6%
Poland 35% No Yes, lists not accepted 27.2%
Portugal 33% Yes Yes, financial penalty 33%
San Marino 33% No Yes, lists not accepted 16.7%
Serbia 33% Yes Yes, lists not accepted 34.4%
Slovenia 35% Yes Yes, lists not accepted 35.6%

Legislative power Page 31
LEGI
SLAT
IVE P
OWER
JUDI
CIAL
POW
ERPO
LITI
CAL P
ARTI
ESCO
UNCI
L OF E
UROP
EEX
ECUT
IVE P
OWER
DIPL
OMAT
IC SE
RVIC
ELE
GISL
ATIV
E POW
ER
YEAR MEMBER STATE
QUOTA PERCENTAGE
RANK ORDER SANCTIONS % WOMEN
ELECTED
2016
Spain 40% Yes Yes, lists not accepted 39.7%
“The former Yugoslav
Republic of Macedonia”
40% Yes Yes, lists not accepted 35%
The correlation between the design of quotas and the percentage of elected women is strong. Stronger quota laws or parity systems lead to better gender balance in the lower/single houses. Hence, having a gender quota law is not a decisive factor for reaching gender balance in elected assemblies if that quota law is weak. In this case, it may actually have no effect at all and in practice discredit the policy. It is the design of gender quotas that matters.
Gender quotas can be fashioned in such a way that they can almost guarantee an outcome, i.e. that the proportion they set for women candidates is almost the same as the proportion of women elected. Looking at the cases of Serbia, Slovenia and Spain in 2016, the percentages of women elected to the single/lower houses almost reached or even slightly exceeded the target set by the quotas. In other cases, like Belgium, where the parity law guarantees the equal presence of women and men on electoral lists, quotas clearly reinforced the presence of women (39.3% of the members of the single/lower house) without nevertheless reaching parity. In Bosnia and Herzegovina, 21.4% of the members of the single/lower house were women, also lower than the 33% set by the quota law.
In addition, notwithstanding the overall finding that the design of gender quota laws is crucial in determining the levels of women elected in national parliaments, there exists some variation, even among countries with strict quota regulations. The most common explanation for this is that effective quota rules do not necessarily increase the legitimacy of these rules. Because gender quotas imply a radical redistribution of power positions, the legitimacy of such measures often remains controversial among political elites and parties, both in countries with and without (strict) quota regulations. Contestations of the legitimacy of gender quotas (e.g. whether they answer to notions of democracy and equality) explain to an important extent why the expected changes in women’s political representation do not always occur (Meier 2008; Erzeel & Caluwaerts 2013). When the legitimacy of quotas is high, political elites and parties support complementary initiatives aimed at supporting the election of women, including through the active recruitment of women candidates, and preparing them for political office, which in turn increases the electoral success of these women (Davidson-Schmich 2006).
Looking at the evolution over time, it is positive to see that in all five countries which had quota legislation or parity systems both in 2005 and 2016, women’s representation has increased significantly: an increase of around five percentage points in Armenia and Belgium, to seven points in Bosnia and Herzegovina and at around 15 percentage points in France and “the former Yugoslav Republic of

Page 32 Balanced participation of women and men in decision-making - Analytical report - 2016
Macedonia”. This seems to point at an effective impact of such measures over time, notwithstanding interval fluctuations.
1.4 Positions of power within lower/single houses
Looking at a second and more qualitative layer of descriptive representation, it is important to observe whether gender balance is achieved with regard to internal positions of power within parliaments. This concern relates to the glass ceiling phenomenon identified in the literature on women’s participation in the labour market, which is also valid to analyse women’s participation in political institutions. Figure 3 shows that according to the 2016 data, only 21.7% of the single/lower houses surveyed had a woman president, while half of them had a woman deputy speaker.
Figure 3. Proportion of single/lower houses with women presidents or deputy speakers (2016)
60%
50%
40%
30%
20%
10%
0%
21.7%
50.0%
Women presidents of the single/lower house
Women deputy speakers of the single/lower house
Table 1 shows that the single/lower houses with the highest percentage of women members are not always the ones with women presidents, and vice-versa. Sometimes countries with critically low percentages of women members have a woman presiding over their single/lower houses – for instance, the Hungarian parliament in 2005 and 2008 had a woman president, but 90% of its members were men. Nevertheless, on average, assemblies with a woman president have a higher percentage of women representatives: 31.2% compared to 24.3% in assemblies with a man president. The latter is an indication of how the glass ceiling in lower/single houses can be cracked. In general, higher numbers of women representatives also increase the possibility to reach a gender balance in internal positions of power such as the presidency of the lower/single house.
The same holds for other powerful positions in elected assemblies, such as the presidency of parliamentary committees. Table 3 indicates the percentage of women presidents of parliamentary committees. There is again a strong correlation between the percentage of women representatives and the percentage of women presidents of committees. Assemblies with higher percentages of women also have higher percentages of women presidents of parliamentary committees.

Legislative power Page 33
LEGI
SLAT
IVE P
OWER
JUDI
CIAL
POW
ERPO
LITI
CAL P
ARTI
ESCO
UNCI
L OF E
UROP
EEX
ECUT
IVE P
OWER
DIPL
OMAT
IC SE
RVIC
ELE
GISL
ATIV
E POW
ER
Table 3. Percentage of women presidents of parliamentary committees, compared to percentage of women in single/lower houses (2016)
MEMBER STATE % WOMEN PRESIDENTS OF COMMITTEE
% WOMEN IN SINGLE/LOWER HOUSES
Albania 37.5% 22.9%
Andorra 50% 35.7%
Armenia 16.7% 9.9%
Austria 38.5% 33.3%
Azerbaijan 13.3% 16.8%
Belgium 32.4% 39.3%
Bosnia and Herzegovina 14.3% 21.4%
Bulgaria 26.1% 18.8%
Croatia 17.2% 20.5%
Cyprus 18.8% 17.9%
Czech Republic 16.7% 19.5%
Denmark 40% 38.3%
Estonia 18.2% 23.8%
Finland 37.5% 41.5%
France 55.6% 26.9%
Georgia 6.7% 12%
Germany 43.5% 36.5%
Greece 15.4% 18.3%
Hungary 11.8% 10.1%
Iceland 50% 39.7%
Ireland 30.4% 22.2%
Italy 14.3% 31.1%
Latvia 37.5% 20%
Liechtenstein 0% 20%
Lithuania 20% 23.4%
Luxembourg 23.1% 28.3%
Malta 0% 10.1%
Republic of Moldova 44.4% 20.8%
Monaco 20% 20.8%
Montenegro 21.4% 13.6%

Page 34 Balanced participation of women and men in decision-making - Analytical report - 2016
MEMBER STATE % WOMEN PRESIDENTS OF COMMITTEE
% WOMEN IN SINGLE/LOWER HOUSES
Netherlands 41.7% 39.3%
Norway 25% 39.6%
Poland 23.3% 27.2%
Portugal 25% 33%
Russian Federation 13.3% 13.6%
San Marino 16.7% 16.7%
Serbia 37.5% 34.4%
Slovak Republic 15.8% 20%
Slovenia 25% 35.6%
Spain 17.9% 39.7%
Sweden 46.7% 43.6%
Switzerland 35.7% 32%
“The former Yugoslav Republic of Macedonia” 28.6% 35%
Turkey 11.1% 14.7%
Ukraine 25% 11.3%
United Kingdom 16.7% 29.5%
Average 25.6% 25.6%
Only 8 countries out of 46 (17%) reached the 40% minimum target, with between 40% and 60% of women presidents of parliamentary committees: Andorra, Denmark, France, Germany, Iceland, Republic of Moldova, Netherlands and Sweden. Another eight (17%) fell within the 30-39.9% category. The countries with more than 30% of women presidents of parliamentary committees were outnumbered by countries with less than 20% of women in that position: 19 out of the 46 countries (41%), two of which had no woman president of parliamentary committees (Liechtenstein and Malta).
2. Upper houses
Table 4 shows the percentages of women elected and appointed to upper houses of Parliaments. The results indicate that in 2016 none of the upper houses of the 13 member states for which we have data reached the 40% minimum target. In 2008, only one country did (Belgium). In 2016, two countries (15%) had more than 30% women. Six countries (46%) had less than 20% women members. The exception was Ireland, where women were overrepresented (72.7%) but only among the appointed members.

Legislative power Page 35
LEGI
SLAT
IVE P
OWER
JUDI
CIAL
POW
ERPO
LITI
CAL P
ARTI
ESCO
UNCI
L OF E
UROP
EEX
ECUT
IVE P
OWER
DIPL
OMAT
IC SE
RVIC
ELE
GISL
ATIV
E POW
ER
Table 4. Percentage of women elected and appointed to upper houses (2005-2016)
MEMBER STATE
2005 2008 2016 COMPARISON 2005-2016 IN PERCENTAGE
POINTS
% WOMEN ELECTED
% WOMEN APPOINTED
% WOMEN ELECTED
% WOMEN APPOINTED
% WOMEN ELECTED
% WOMEN APPOINTED
Austria 27.4% N/A 31.7% N/A 31.1% N/A +3.7
Belgium 37.8% 29.4% 40.8% 35.5% N/A N/A N/A
Bosnia and Herzegovina 6.7% N/A 13.3% 13.3% N/A 13.3% N/A
Czech Republic 12.3% N/A 13.6% N/A 18.5% N/A +6.2
France 16.9% N/A 21.9% N/A 26.4% N/A +9.5
Germany N/A 18.8% N/A 21.7% N/A N/A N/A
Hungary 9.1% N/A N/A N/A N/A N/A N/A
Ireland 16.7% 18.2% 21.7% 36.4% 28.6% 72.7%
+11.9 elected+54.5
appointed
Italy 7% 14.3% 18% 14.3% 29.8% N/A +22.8
Netherlands 32% N/A 34.7% N/A 34.7% N/A +2.7
Poland N/A N/A N/A N/A 13% N/A N/A
Russian Federation N/A N/A 4.7% 4.7% 16.5% N/A N/A
Slovenia N/A N/A N/A N/A 7.5% N/A N/A
Spain 24.8% 20% 30% 21.8% 41.3% 31.6%
+16.5 elected+11.6
appointed
Switzerland 23.9% N/A 21.7% N/A 15.2% N/A -8.7
United Kingdom N/A N/A 20.2% N/A N/A 25.6% N/A
Average 19.5% 20.1% 22.7% 21.1% 23.9% 35.8%
Compared to 2005, women’s numerical participation increased in all upper houses in 2016, with the exception of Switzerland. There was an increase both for women elected and appointed to upper houses but it was much more substantial for women appointed to upper houses. Italy, for instance, witnessed an important increase of 22.8 percentage points for women elected members in the upper house. The increase among women appointed members is however most significant in the two countries where it took place (Ireland and Spain). Given that only four of the member states for which there are data appoint members to their upper house, firm conclusions cannot be drawn. Nevertheless, the findings seem to suggest that the feminisation of upper houses is to a certain extent a top-down process.

Page 36 Balanced participation of women and men in decision-making - Analytical report - 2016
Figure 4. Comparison of percentage of women elected to lower and upper houses (2016)
% women elected
39.7%
39.3%
33.3%
31.1%
27.2%
26.9%
22.2%
19.5%
13.6%16.5%
18.5%
26.4%
28.6%
32.0%
35.6%
41.3%
34.7%
31.1%
29.8%
7.5%
15.2%
13.0%
0% 5% 10% 15% 20% 25% 30% 35% 40% 45%
Spain
Netherlands
Slovenia
Austria
Switzerland
Italy
Poland
France
Ireland
Czech Republic
Russian Federation
Lower House 2016
Upper House 2016
Note: Figure 4 compares the percentage of women elected to lower houses with the percentage of women elected (not appointed) to upper houses of parliament in 2016 in countries for which data were available.
Figure 4 shows that in all countries concerned, the percentages of women elected to the national lower houses of parliaments were higher than in the upper houses, except for Ireland, Spain and the Russian Federation. Given that upper houses often have less power than lower houses, this can be considered as a good sign, as it suggests that women are not systematically discouraged or directed to the assemblies holding less power.
3. Regional Parliaments
3.1 Numbers and evolution
Table 5. Percentage of women elected to regional parliaments (2005-2016)
MEMBER STATE % WOMEN2005
% WOMEN2008
% WOMEN2016
COMPARISON2005-2016 IN PERCENTAGE
POINTS
Austria 29% 30.6% 32.5% +3.5
Azerbaijan 2.2% 2.2% 15.6% +13.4

Legislative power Page 37
LEGI
SLAT
IVE P
OWER
JUDI
CIAL
POW
ERPO
LITI
CAL P
ARTI
ESCO
UNCI
L OF E
UROP
EEX
ECUT
IVE P
OWER
DIPL
OMAT
IC SE
RVIC
ELE
GISL
ATIV
E POW
ER
Belgium 30% 23.3% 42% +12
Bosnia and Herzegovina 19.3% 21% 19.4% +0.1
Czech Republic N/A 16.6% 19.9% N/A
Georgia N/A 14.3% N/A N/A
Germany 31.7% 33.8% 31.5% -0.2
Greece N/A N/A 21.2% N/A
Iceland N/A N/A 44.1% N/A
Italy 13.3% 10.5% 17.7% +4.4
Portugal 11.7% 20.2% 22.3% +10.6
Republic of Moldova N/A N/A 2.9% N/A
Romania N/A 12.7% N/A N/A
Russian Federation N/A 11.8% 14.4% N/A
Serbia N/A 17.5% 31.6% N/A
Slovak Republic N/A N/A 15.7% N/A
Spain 37% 41.7% 44.5% +7.5
Switzerland 25.5% 26.2% 25.6% +0.1
United Kingdom N/A 30.0% 33.7% N/A
Average 22.7% 22.0% 25.6%
The trends highlighted with regard to lower houses/single parliaments also applied to the regional level. Firstly, only three countries out of the 17 countries which submitted data (18%) met the 40% minimum target in regional parliaments, as shown in Table 5: Belgium (42%), Iceland (44.1%) and Spain (44.5%). The same three countries almost reached the 40% minimum threshold in the single/lower houses. In 2016, four of the 17 countries (23.5%) were in the range between 30% and 39.9% of women members of regional parliaments (Austria, Germany, Serbia and United Kingdom). With the exception of the United Kingdom, all these countries were in the same range of women representation in the national single/lower houses. The seven countries (41%) with less than 20% of women in their regional parliaments in 2016 were also the countries with low levels of women in the single/lower houses (i.e. also below or only slightly above 20%): Azerbaijan, Bosnia and Herzegovina, Czech Republic, Republic of Moldova, Russian Federation and Slovak Republic. A remarkable exception was Italy, with only 17.7% women in the regional parliaments in 2016, but with 31.1% of women in the national lower house at that time. An important difference between women’s representation in regional and national parliaments was also found in the Republic of Moldova which had the lowest percentage of women in regional parliaments among the countries surveyed (2.9%), while it had 20.8% women in the national parliament. In the countries where the percentage of women in regional parliaments was higher

Page 38 Balanced participation of women and men in decision-making - Analytical report - 2016
than the percentage of women in the national single/lower houses (i.e. Belgium, Czech Republic, Greece, Russian Federation, Spain and United Kingdom), the difference was marginal (i.e. it never exceeded five percentage points).
Secondly, the average percentage of women in regional parliaments in 2016 was 25.6%, which was identical to the national single/lower house average. This seems to contradict the theory that women are directed toward less powerful institutions, in this case the regional parliaments/assemblies which sometimes have more limited level of budget control and breadth of responsibilities (Celis and Woodward 2003). In addition, not all regional parliaments are less powerful than national ones and for example, there was a gender balanced participation of women and men in Belgium and Spain, where regional parliaments are rather powerful. Obviously, higher levels of women in regional parliaments in cases where those are less powerful are positive as such, but could also be an illustration of women being more easily elected in less powerful institutions.
Another, more positive reason discussed in the literature for a potentially higher number of women in regional assemblies compared to national ones concerns the newness of the institutions, whereby periods of institutional (re)structuring can offer opportunities for the women’s movement to push for the inclusion of new, previously marginalised, actors and perspectives, and the adoption and institutionalisation of policy innovations that promote gender equality. (Chappell 2002; Vickers 2010).
Figure 5. Changes in percentage points of women elected to regional parliaments in selected countries (2005-2016)
14
12
10
8
6
4
2
0
-2Germany Bosnie and
HerzegovinaSwitzerland Austria Italy Spain Portugal Belgium Azerbaijan
Perc
enta
ge p
oint
s
-0.2 0.1 0.1
3.54.4
7.5
10.6
12.013.4
Note: Only countries for which data were available for both 2005 and 2016 were included in Figure 5.
Thirdly, and also with regard to the evolution of the proportion of women in regional parliaments (see Figure 5) there are no patterns that sharply contrast with the national evolution. Four of the countries concerned remained more or less stable or increased slightly (Austria, Bosnia and Herzegovina, Germany and Switzerland) while five countries (Azerbaijan, Belgium, Italy, Portugal and Spain) saw a substan-tive increase of women’s representation (between 4.4 and 13.4 percentage points).

Legislative power Page 39
LEGI
SLAT
IVE P
OWER
JUDI
CIAL
POW
ERPO
LITI
CAL P
ARTI
ESCO
UNCI
L OF E
UROP
EEX
ECUT
IVE P
OWER
DIPL
OMAT
IC SE
RVIC
ELE
GISL
ATIV
E POW
ER
3.2 Gender quotas/parity systems in regional parliaments
There are eight countries with gender quotas/parity systems for regional parliaments. In Italy, some regions have adopted gender quotas, but not all. The eight countries with electoral gender quota laws or parity systems for regional parliaments have higher average percentage of women in regional parliaments than the ones without: 28.4%, compared to 23.6 %. The proportion of women is also higher compared to the 25.6% general average for the 17 countries that provided data on this issue.
A similar method as the one used to analyse national gender quota laws was used to assess the presence and effectiveness of gender quotas in regional parliaments in the countries and elections where quota legislation was in place:
f The minimum level of the target for candidates of each sex on electoral lists (quota percentage).
f The presence of a rule on rank order (no, yes).
f The presence of sanctions for non-compliance and their strength (no sanction; financial penalty; lists not accepted when they do not comply).
Table 6. Member states with electoral gender quota laws at the regional level (2016)
MEMBER STATE QUOTA PERCENTAGE
RANK ORDER SANCTIONS
AVERAGE % WOMEN ELECTED
Belgium 50% Yes Lists not accepted 42%
Bosnia and Herzegovina 40% Yes Lists not accepted 19.4%
France 50% Yes Lists not accepted N/A
Greece 33% No Lists not accepted 21.2%
Italy 40% Yes Other 17.7%
Portugal 33% Yes Financial penalty 22.3%
Serbia 33% Yes Lists not accepted 31.6%
Spain 40% Yes Lists not accepted 44.5%
As shown in Table 6, in Belgium and Spain, the percentage of women in regional assemblies reached and even went beyond the 40% minimum target. This is an indication that strong gender quotas, especially when the target is set high, as was the case in the two countries concerned, are very effective.


LEGI
SLAT
IVE P
OWER
JUDI
CIAL
POW
ERPO
LITI
CAL P
ARTI
ESCO
UNCI
L OF E
UROP
EEX
ECUT
IVE P
OWER
DIPL
OMAT
IC SE
RVIC
EEX
ECUT
IVE P
OWER
Page 41
II. EXECUTIVE POWER
1. National executives
1.1 Gender balance among heads of state and government and deputy prime ministers/vice-presidents
Figure 6. Overall percentage of women heads of state and government (2005-2016)
16%
14%
12%
10%
8%
6%
4%
2%
0%Heads of state, elected
by citizensHeads of state, appointed
by parliamentHeads of government
13.3%
10.0%
7.7%
5.1%
12.2%
0.0% 0.0%
14.3%
9.5%
% w
omen
% women 2005 % women 2008 % women 2016
Note: the last entry (heads of government) applies only for cases when the head of state was not also the head of government
Figure 6 and Table 7 clearly indicate that heads of state or governments in Europe were still almost entirely male in 2016. The 40% minimum target was very far from being achieved and evolutions were not consistent over time for the different categories observed. The proportion of women decreased for heads of state elected by citizens between 2005 and 2016, but it increased significantly for heads of governments (+12.2 percentage points) and for heads of states appointed by parliaments (+6.6 percentage points). In 2016, women made up 9.5% of the heads of state elected by the citizens, 14.3% of the heads of state appointed by parliament, and 12.2% of the heads of government (when the head of state was not the head of government).

Page 42 Balanced participation of women and men in decision-making - Analytical report - 2016
Table 7. Countries with women heads of state or heads of government (2016)
MEMBER STATE
WOMEN HEADS OF STATE
WOMEN HEADS OF GOVERNMENT*
Croatia √
Germany √
Latvia √
Lithuania √
Malta √
Norway √
Poland √
United Kingdom √ √
Total 4 5
* When the head of state was not the head of government
In addition, in 2016 a majority of member states (18 out of 32 countries, 56%) reported not having a woman deputy prime minister or vice-president, as shown in Table 8. The average proportion of women deputy prime ministers or vice-presidents was 27.4%, which is modest, but higher than many of the averages for the different bodies studied. In countries where more than one position was available, a gender balance among the deputy prime ministers or vice-presidents was only reached in one country: Serbia, with a 50-50 distribution. Obviously, reaching a gender balanced distribution is easier when there are more of such posts available. But even in Italy, where there were 11 such positions, or in Azerbaijan with 6 of them, there were no women deputy prime minister or vice-president. The Russian Federation, with eight deputy prime ministers or vice-presidents, counted only one woman.
Table 8. Number of women deputy prime ministers/vice-presidents (2016)
MEMBER STATE NUMBER OF WOMEN
NUMBER OF MEN TOTAL
Albania 0 1 1
Andorra 2 8 10
Armenia 0 1 1
Azerbaijan 0 6 6
Belgium 0 4 4
Bosnia and Herzegovina 0 2 2
Bulgaria 2 1 3
Croatia 0 2 2
Czech Republic 0 2 2
Georgia 0 2 2

Executive power Page 43
LEGI
SLAT
IVE P
OWER
JUDI
CIAL
POW
ERPO
LITI
CAL P
ARTI
ESCO
UNCI
L OF E
UROP
EEX
ECUT
IVE P
OWER
DIPL
OMAT
IC SE
RVIC
EEX
ECUT
IVE P
OWER
MEMBER STATE NUMBER OF WOMEN
NUMBER OF MEN TOTAL
Greece 0 1 1
Hungary 0 1 1
Ireland 1 1 1
Italy 0 11 11
Liechtenstein 0 1 1
Luxembourg 0 1 1
Malta 0 1 1
Republic of Moldova 0 4 4
Monaco 1 4 5
Montenegro 1 5 6
Netherlands 0 1 1
Poland 0 3 3
Portugal 76 154 230
Russian Federation 1 7 8
Serbia 2 2 4
Slovak Republic 1 2 3
Slovenia 0 3 3
Spain 1 0 1
Sweden 1 0 1
Switzerland 2 4 6
Turkey 0 5 5
Ukraine 1 5 6
Total 92 235 336
Average 27.4%
1.2 Gender balance among senior and junior ministers
The average percentage of women senior and junior ministers was 22.4% (Table 9), slightly lower than the percentages of elected women in national lower/single house (25.6%). The same countries were above and below the average both with regard to the number of elected representatives and to ministers. There were exceptions however, such as Albania and Lithuania, with a higher than average proportion of women ministers, even though they had a less than average proportion of women in the national lower/single house. Belgium, Poland and the United Kingdom showed a less than average proportion of women ministers while having a more than average proportion of women in the national lower/single house.

Page 44 Balanced participation of women and men in decision-making - Analytical report - 2016
Only 4 out of 44 countries (9%) met the 40% minimum target of the Council of Europe regarding ministers: France, Liechtenstein, Slovenia and Sweden. Furthermore, nine countries (20%) were within the 30-39.9% range. The countries with more than 40% women were again largely outnum-bered by the countries with less than 20% of women. The latter were 21 countries, which represented almost half (48%) of the countries surveyed.
Table 9. Percentage of women senior and junior ministers (2016)
MEMBER STATE % WOMEN
Albania 37.5%
Andorra 35.3%
Armenia 12.5%
Austria 26.7%
Azerbaijan 2.9%
Belgium 22.2%
Bosnia and Herzegovina 10.5%
Croatia 15%
Cyprus 9.1%
Czech Republic 9.1%
Denmark 17.6%
Estonia 14.3%
Finland 35.7
France 48.5%
Georgia 10.5%
Germany 39.6%
Greece 18.2%
Hungary 9.1%
Iceland 33.3%
Ireland 21.6%
Italy 31.3%
Latvia 18.8%
Liechtenstein 40%
Lithuania 28.6%
Luxembourg 27.8%
Malta 8.7%
Republic of Moldova 25%
Monaco 0%

Executive power Page 45
LEGI
SLAT
IVE P
OWER
JUDI
CIAL
POW
ERPO
LITI
CAL P
ARTI
ESCO
UNCI
L OF E
UROP
EEX
ECUT
IVE P
OWER
DIPL
OMAT
IC SE
RVIC
EEX
ECUT
IVE P
OWER
MEMBER STATE % WOMEN
Montenegro 17.6%
Netherlands 35.0%
Norway 39.4%
Poland 17.1%
Portugal 31.6%
Russian Federation 21.1%
San Marino 11.1%
Serbia 14.3%
Slovak Republic 14.3%
Slovenia 43.5%
Spain 25.8%
Sweden 58.9%
Switzerland 25.0%
Turkey 4.8%
Ukraine 6.3%
United Kingdom 23.5%
Average 22.4%
The average proportion of women ministers in national governments (22.4%) was slightly lower but close to the proportion of women in the national lower/single houses (25.6%) and hence did not point to a significant extra discriminatory barrier for women when moving toward this level of executive power.
Table 10. Evolution regarding women senior ministers (2005-2016)
MEMBER STATE
2005 2008 2016 EVOLUTION 2005-2016 IN PERCENTAGE
POINTS% WOMEN % WOMEN % WOMEN
Armenia 0.0% 11.1% 16.7% + 16.7
Austria 50.0% 46.2% 23.1% - 26.9
Azerbaijan 0.0% 0.0% 0.0% 0
Belgium 21.4% 40.0% 21.4% 0
Bosnia and Herzegovina 11.1% 0.0% 22.2% + 11.1
Croatia 30.8% 20.0% 15.0% - 15.8
Cyprus 0.0% 9.1% 9.1% + 9.1
Czech Republic 17.6% 11.1% 17.6% 0
Denmark 26.3% 36.8% 29.4% + 3.1

Page 46 Balanced participation of women and men in decision-making - Analytical report - 2016
MEMBER STATE
2005 2008 2016 EVOLUTION 2005-2016 IN PERCENTAGE
POINTS% WOMEN % WOMEN % WOMEN
Estonia 15.4% 23.1% 14.3% - 1.1
Finland 44.4% 60.0% 35.7% - 8.7
France 19.4% 43.8% 50.0% + 30.6
Germany 42.9% 37.5% 33.3% - 9.6
Greece 10.0% 11.1% 18.2% + 8.2
Hungary 11.8% 15.4% 0.0% - 11.8
Iceland 25.0% 33.3% 33.3% + 8.3
Ireland 20.0% 20.0% 26.7% + 6.7
Italy 8.3% 16.0% 31.3% + 23.0
Latvia 23.5% 21.1% 18.8% - 4.8
Liechtenstein 20.0% 20.0% 40.0% + 20.0
Lithuania 15.4% 15.4% 28.6% + 13.2
Luxembourg 14.3% 14.3% 26.7% + 12.4
Monaco 0.0% 0.0% 0.0% 0
Netherlands 31.3% 31.3% 38.5% + 7.2
Norway 44.4% 44.4% 47.4% + 3.0
Portugal 12.5% 12.5% 17.6% + 5.1
Slovenia 18.8% 17.6% 50.0% + 31.2
Spain 50.0% 52.9% 33.3% - 16.7
Sweden 52.4% 45.5% 50.0% - 2.4
Turkey 4.5% 4.2% 4.8% + 0.3
Average 21.4% 23.8% 25.1%
Note: For this table, only the countries that provided data for the three monitoring rounds were included.
Looking at the evolution over time for the 30 countries that provided data for the three rounds of monitoring, the results are mixed and the progress is modest (Table 10). Eight countries showed a significant increase of women’s representation between 2005 and 2016 (more than 10 percentage points) while four showed a significant decrease. Six countries reached the 40% minimum target in 2005 and five did so in 2016, with two countries performing well in both years (Norway and Sweden). This shows steady good performance for a very limited number of countries. The number of countries in the 30-39% range increased from two to six between 2005 and 2016, which is a good sign. On the other hand, while the number of countries below 20% of women senior ministers decreased when comparing 2005 and 2016 (from 16 to 12), 10 identical countries remained in that category.

Executive power Page 47
LEGI
SLAT
IVE P
OWER
JUDI
CIAL
POW
ERPO
LITI
CAL P
ARTI
ESCO
UNCI
L OF E
UROP
EEX
ECUT
IVE P
OWER
DIPL
OMAT
IC SE
RVIC
EEX
ECUT
IVE P
OWER
Figure 7. Changes in the proportion of women senior ministers in selected countries in percentage points (2005-2016)
Slovenia 31.2France 30.6
Italy 23.0Liechtenstein 20.0
Armenia 16.7Lithuania 13.2
Luxembourg 12.4
Cyprus 9.1Iceland 8.3Greece 8.2
Netherlands 7.2Ireland 6.7
Portugal 5.1Denmark 3.1
Turkey 0.3Czech Republic 0.0Belgium 0.0
Estonia -1.1
Latvia -4.8Finland -8.7
Germany -9.6
Croatia -15.8Spain -16.7
Austria -26.9
Hungary -11.8
Sweden -2.4
Norway 3.0
Bosnia and Herzegovina 11.1
-30 -20 -10 0 10 20 30 Percentage points
The changes in percentage points between 2005 and 2016 (Figure 7) show the same number of countries with a negative or neutral evolution (less than plus five percentage points) as the number of countries with progress (14). Eight countries observed significant changes: a considerable decrease of more than 15 percentage points for five countries and considerable decreases of more than 15 percentage points for three countries. However, these data represent only two moments in time and do not reflect interval fluctuations.
1.3 Quota legislation or parity systems for the national government
Only two of the countries for which data were available (46 in total for this question) had quota legislation or a parity system for their national government: Albania and Belgium. In Albania, the target was 30% and in Belgium, the law guaranteed the representation of persons from both sexes in the different governments of the country. In terms of the effect of the quota legislation or parity system at this level, Albania with 37.5% women ministers exceeded its own 30% quota target and almost reached the 40% Council of Europe target. On the other hand, Belgium was far from the 40% Council of Europe target, with only 22.2% women representatives.

Page 48 Balanced participation of women and men in decision-making - Analytical report - 2016
2. Regional executives
Table 11. Women among heads of regional governments (2005-2016)
MEMBER STATE % WOMEN2005
% WOMEN2008
% WOMEN2016
COMPARISON2005-2016 IN PERCENTAGE
POINTS
Austria 22.2% 11.1% 0% -22.2
Azerbaijan 0% 0% N/A N/A
Belgium 20% 0% 0% -20
Bosnia and Herzegovina 0% 0% 7.7% +7.7
Czech Republic N/A 0% 0% N/A
Denmark 92.3% N/A 60% -32.3
France N/A 7.7% 23.1% N/A
Georgia N/A 0% N/A N/A
Germany 0% 0% 18.8% +18.8
Greece N/A 1.9% 15.4% N/A
Italy 10% 10% 10% 0
Republic of Moldova N/A N/A 100% N/A
Romania N/A 8.5% N/A N/A
Portugal 0% 0% 0% 0
Russian Federation N/A N/A 4.7% N/A
Serbia N/A 0% 0% N/A
Slovak Republic N/A N/A 0% N/A
Spain 5.3% 5.3% 21.1% +15.8
Switzerland 38.5% N/A 19.2% N/A
United Kingdom N/A 0% 50% N/A
Ukraine 0% 0% N/A N/A
Average 17.1% 2.8% 19.4%
As shown in Table 11, regional governments also remained largely male dominated, even more so than national governments. In 2016, women made up on average only 19.4% of the heads of regional governments. Moreover, only the regional governments in Denmark and the Republic of Moldova reached and outnumbered the 40% minimum target. The small number of regions in some countries do not allow for broad conclusions. However, the sharp drops in Austria and Belgium in 2016, compared to 2005, can be highlighted, as well as the sharp increase for Germany and Spain, and the high number of countries where none of the regional governments had a woman head (i.e. six out of 17, or 35% of the countries that provided data). Arguably, this serious gap may be due to lack of political will among regions, which are mostly embedded in their own electoral and internal political party dynamics, and to absence of incentives to achieve gender balance.

Executive power Page 49
LEGI
SLAT
IVE P
OWER
JUDI
CIAL
POW
ERPO
LITI
CAL P
ARTI
ESCO
UNCI
L OF E
UROP
EEX
ECUT
IVE P
OWER
DIPL
OMAT
IC SE
RVIC
EEX
ECUT
IVE P
OWER
This produces male over-representation at the level of the individual regional governments and, taken together, also at the country level.
Table 12. Percentage of women in regional governments (2005-2016)
MEMBER STATE % WOMEN 2005
% WOMEN 2008
% WOMEN 2016
COMPARISON2005-2016 IN PERCENTAGE
POINTS
Austria 27.1% 32.4%% 31.2% +4.1
Azerbaijan 0% 4.8% N/A N/A
Belgium 37.8% 31.6% 33.3% -4.5
Bosnia and Herzegovina 8.8% 6.7% 14.6% +5.8
Czech Republic N/A 14.2% 19.4% N/A
Denmark 27.3% N/A 39.5% +12.2
France N/A 37.8% N/A N/A
Georgia N/A 10.0% N/A N/A
Germany 22.4% 22.4% 37.5% +15.1
Greece N/A 20.7% 21.2% N/A
Italy 13.7% 17.2% 32.9% +19.2
Norway 38.8% N/A N/A N/A
Republic of Moldova N/A N/A 38.1% N/A
Portugal 13.3% 11.8% 22.8% +9.5
Russian Federation N/A N/A 73% N/A
Serbia N/A 29.4% 7.7% N/A
Spain 32.4% 39.7% 44.4% +12
Switzerland 19% 19.2% 24% +5
Ukraine N/A 15.0% N/A N/A
United Kingdom N/A 30% N/A N/A
Average 21.9% 21.4% 31.4%
The average percentage of women in regional governments in 2016 was 31.4% (see Table 12), which is still below the 40% minimum target. In 2016, only two countries out of 14 reached the 40% minimum target for women members of regional governments (Russian Federation and Spain). In 2016, Spain counted 44.4% women regional ministers – in 2005 and 2008 Spain also had the highest percentages among the countries surveyed. Furthermore, in 2016, six out of the 14 countries for which we have data fell in the 30-39.9% category (43%). Only three countries (21.4%) had less than 20% women members in their regional governments.
The comparison between 2005 and 2016 at the regional level is predominantly a positive one, with important increases in Denmark, Germany, Italy and Spain. Only Belgium witnessed a decrease between 2005 and 2016. Whereas in the
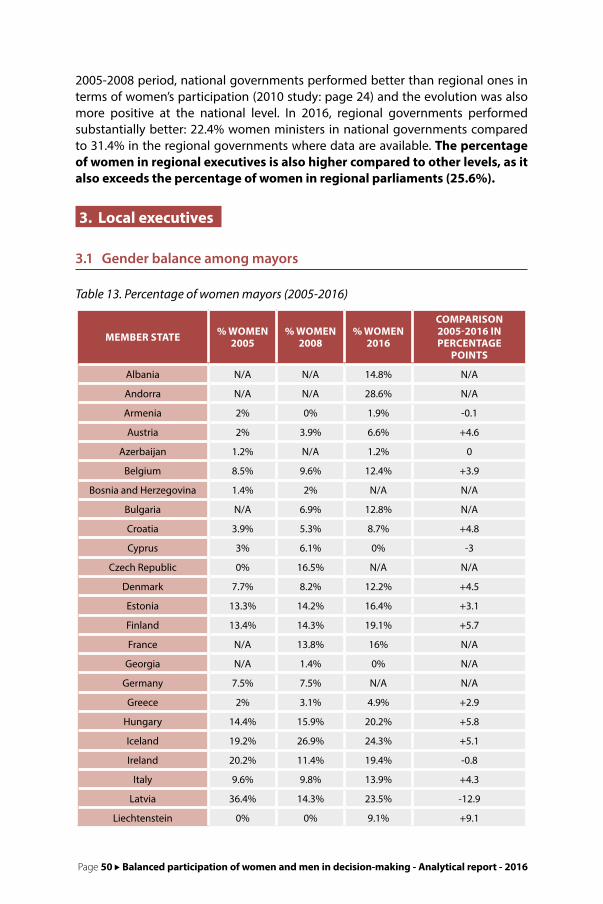
Page 50 Balanced participation of women and men in decision-making - Analytical report - 2016
2005-2008 period, national governments performed better than regional ones in terms of women’s participation (2010 study: page 24) and the evolution was also more positive at the national level. In 2016, regional governments performed substantially better: 22.4% women ministers in national governments compared to 31.4% in the regional governments where data are available. The percentage of women in regional executives is also higher compared to other levels, as it also exceeds the percentage of women in regional parliaments (25.6%).
3. Local executives
3.1 Gender balance among mayors
Table 13. Percentage of women mayors (2005-2016)
MEMBER STATE % WOMEN 2005
% WOMEN 2008
% WOMEN 2016
COMPARISON2005-2016 IN PERCENTAGE
POINTS
Albania N/A N/A 14.8% N/A
Andorra N/A N/A 28.6% N/A
Armenia 2% 0% 1.9% -0.1
Austria 2% 3.9% 6.6% +4.6
Azerbaijan 1.2% N/A 1.2% 0
Belgium 8.5% 9.6% 12.4% +3.9
Bosnia and Herzegovina 1.4% 2% N/A N/A
Bulgaria N/A 6.9% 12.8% N/A
Croatia 3.9% 5.3% 8.7% +4.8
Cyprus 3% 6.1% 0% -3
Czech Republic 0% 16.5% N/A N/A
Denmark 7.7% 8.2% 12.2% +4.5
Estonia 13.3% 14.2% 16.4% +3.1
Finland 13.4% 14.3% 19.1% +5.7
France N/A 13.8% 16% N/A
Georgia N/A 1.4% 0% N/A
Germany 7.5% 7.5% N/A N/A
Greece 2% 3.1% 4.9% +2.9
Hungary 14.4% 15.9% 20.2% +5.8
Iceland 19.2% 26.9% 24.3% +5.1
Ireland 20.2% 11.4% 19.4% -0.8
Italy 9.6% 9.8% 13.9% +4.3
Latvia 36.4% 14.3% 23.5% -12.9
Liechtenstein 0% 0% 9.1% +9.1

Executive power Page 51
LEGI
SLAT
IVE P
OWER
JUDI
CIAL
POW
ERPO
LITI
CAL P
ARTI
ESCO
UNCI
L OF E
UROP
EEX
ECUT
IVE P
OWER
DIPL
OMAT
IC SE
RVIC
EEX
ECUT
IVE P
OWER
MEMBER STATE % WOMEN 2005
% WOMEN 2008
% WOMEN 2016
COMPARISON2005-2016 IN PERCENTAGE
POINTS
Lithuania 5% 8.3% 5% 0
Luxembourg 10.2% 11.2% 11.4% +1.2
Malta N/A 8.8% 17.6% N/A
Republic of Moldova N/A N/A 20.6% N/A
Monaco 0% 0% 0% 0
Montenegro N/A 4.8% 17.4% N/A
Netherlands 18% 20.9% 22.7% +4.7
Norway 17.1% 22.6% 28.3% +11.2
Poland N/A N/A 10.7% N/A
Portugal 5.2% 6.9% 7.5% +2.3
Romania N/A 3.6% N/A N/A
Russian Federation N/A 29.5% N/A N/A
San Marino N/A 11.1% N/A N/A
Serbia N/A 26.3% 5.5% N/A
Slovak Republic 19.4% N/A 22.1% +2.7
Slovenia 5.7% 3.3% 7.5% +1.8
Spain 12.5% 14.9% 19.1% +6.6
Sweden 32.1% 26.9% 36.6% +4.5
Switzerland 25% 11.6% N/A N/A
“The former Yugoslav Republic of Macedonia” N/A 3.6% 4.9% N/A
Turkey 0.6% 0.6% 2.9% +2.3
Ukraine N/A 5.7% N/A N/A
United Kingdom N/A 8.3% 15.3% N/A
Average 10.2% 10.2% 13.4%
Table 13 shows that none of the 39 countries that reported data on this issue reached the minimum target of 40% women mayors. Only one country (2.6% of respondents) had over 30% women mayors in 2016 (Sweden), which was also among the countries with higher numbers of women mayors in 2005 and 2008. The large majority of countries surveyed (30 out of the 39 countries for which we have data, or 77% of them) had less than 20% women mayors, 38.5% had less than 10% and three had no woman mayor (Cyprus, Georgia and Monaco). Given the overall high numbers of mayors, these findings are solid and strikingly low. It confirms the conclusion that especially the top ranks of political and public decision-making were overwhelmingly male, a finding that was also noticeable at the national level, in particular in relation to the poor representation of women as heads of state or heads of government.

Page 52 Balanced participation of women and men in decision-making - Analytical report - 2016
The comparison between the 2005 and 2016 data at the country level revealed only minor changes, which indicates stagnation at a low level. An exception is Norway, where women’s representation increased by 11.2 percentage points. Compared to executives at the national and regional level, the heads of states and mayors performed the worst in terms of the participation of women.
3.2 Gender balance among municipality councillors
Table 14. Percentage of women municipality councillors (2005-2016)
MEMBER STATE % WOMEN 2005
% WOMEN 2008
% WOMEN 2016
COMPARISON2005-2016 IN PERCENTAGE
POINTS
Albania N/A N/A 34.8% N/A
Andorra N/A N/A 40% N/A
Armenia 6.6% 7.7% 9.4% +2.8
Azerbaijan 1.7% 0% 35% +33,3
Belgium 26.5% 33.6% 36% +9.5
Bosnia and Herzegovina 16.7% 16.8% 2.8% -13.9
Bulgaria N/A 26.2% N/A N/A
Croatia 10.7% 10.7% 23.3% +12.6
Cyprus 20.4% 20.3% 13.9% -6.5
Denmark 27% 27.3% 29.7% +2.7
Estonia 28.4% 29.6% 31.1% +2.7
Finland 36.4% 36.4% 36.2% -0.2
France N/A 35% 40% N/A
Georgia N/A 11.4% 1.7% N/A
Germany 24.4% 24.4% N/A N/A
Greece N/A N/A 18.1% N/A
Iceland 31.2% 36.5% 24.3% -6.9
Ireland 18.9% 17.9% 20.7% +1.8
Italy 16.9% 2.2% N/A N/A
Latvia 42.3% 19.2% 31.3% -11
Liechtenstein 28.3% 27.4% 16.5% -11.8
Lithuania 20.6% 22.2% 24.3% +3.7
Luxembourg 17.8% 23.6% 22.4% +4.6
Malta N/A 20.1% 22.6% N/A
Republic of Moldova N/A N/A 28.9% N/A
Monaco 33.3% 28.6% 40% +6.7
Montenegro N/A 11.4% 26.2% N/A
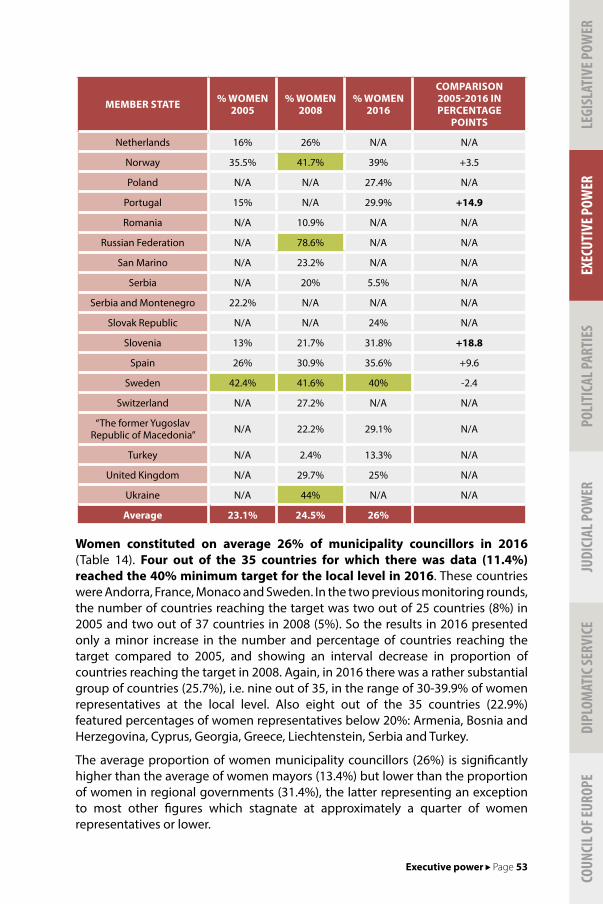
Executive power Page 53
LEGI
SLAT
IVE P
OWER
JUDI
CIAL
POW
ERPO
LITI
CAL P
ARTI
ESCO
UNCI
L OF E
UROP
EEX
ECUT
IVE P
OWER
DIPL
OMAT
IC SE
RVIC
EEX
ECUT
IVE P
OWER
MEMBER STATE % WOMEN 2005
% WOMEN 2008
% WOMEN 2016
COMPARISON2005-2016 IN PERCENTAGE
POINTS
Netherlands 16% 26% N/A N/A
Norway 35.5% 41.7% 39% +3.5
Poland N/A N/A 27.4% N/A
Portugal 15% N/A 29.9% +14.9
Romania N/A 10.9% N/A N/A
Russian Federation N/A 78.6% N/A N/A
San Marino N/A 23.2% N/A N/A
Serbia N/A 20% 5.5% N/A
Serbia and Montenegro 22.2% N/A N/A N/A
Slovak Republic N/A N/A 24% N/A
Slovenia 13% 21.7% 31.8% +18.8
Spain 26% 30.9% 35.6% +9.6
Sweden 42.4% 41.6% 40% -2.4
Switzerland N/A 27.2% N/A N/A
“The former Yugoslav Republic of Macedonia” N/A 22.2% 29.1% N/A
Turkey N/A 2.4% 13.3% N/A
United Kingdom N/A 29.7% 25% N/A
Ukraine N/A 44% N/A N/A
Average 23.1% 24.5% 26%
Women constituted on average 26% of municipality councillors in 2016 (Table 14). Four out of the 35 countries for which there was data (11.4%) reached the 40% minimum target for the local level in 2016. These countries were Andorra, France, Monaco and Sweden. In the two previous monitoring rounds, the number of countries reaching the target was two out of 25 countries (8%) in 2005 and two out of 37 countries in 2008 (5%). So the results in 2016 presented only a minor increase in the number and percentage of countries reaching the target compared to 2005, and showing an interval decrease in proportion of countries reaching the target in 2008. Again, in 2016 there was a rather substantial group of countries (25.7%), i.e. nine out of 35, in the range of 30-39.9% of women representatives at the local level. Also eight out of the 35 countries (22.9%) featured percentages of women representatives below 20%: Armenia, Bosnia and Herzegovina, Cyprus, Georgia, Greece, Liechtenstein, Serbia and Turkey.
The average proportion of women municipality councillors (26%) is significantly higher than the average of women mayors (13.4%) but lower than the proportion of women in regional governments (31.4%), the latter representing an exception to most other figures which stagnate at approximately a quarter of women representatives or lower.

Page 54 Balanced participation of women and men in decision-making - Analytical report - 2016
Figure 8. Changes in percentage points of women municipality councillors over time (2005-2016)
Azerbaijan 33.3
Slovenia 18.8
Finland -0.2
Sweden -2.4
Cyprus -6.5
Iceland -6.9
Latvia -11
Bosnia and Herzegovina -13.9
Liechtenstein -11.8
Croatia 12.6
Spain 9.6
Belgium 9.5
Monaco 6.7
Luxembourg 4.6
Lithuania 3.8
Armenia 2.8
Denmark 2.7
Estonia 2.7
Ireland 1.7
Norway 3.5
-20 -10 0 10 20 30 40 Percentage points
The evolution of the proportion of women municipality councillors per country over time (2005-2016) is less stable than regional legislative level (see Figure 8). Even though about half of the countries remained stable over time, the local level featured the strongest drops in the representation of women, together with some steep increases. This may be partly explained by the centralisation hypothesis: when efforts to improve women’s representation are centralised they can be enacted more efficiently (Hinojosa 2012). In contrast, when local party branches are in charge, the implementation and success of such efforts depends on the goodwill of local parties, which leads to varying results over time.
3.3 Gender quotas at the local level
FIfteen countries had electoral gender quota laws or parity systems for local elections. As for the previous analysis, three criteria were used to assess the presence and effectiveness of gender quotas at the local level in the countries and elections under study:
f The minimum level of the target for candidates of each sex on electoral lists (quota percentage).
f The presence of a rule on rank order (no, yes). f The presence of sanctions for non-compliance and their strength (no sanction; financial penalty; lists not accepted when they do not comply).

Executive power Page 55
LEGI
SLAT
IVE P
OWER
JUDI
CIAL
POW
ERPO
LITI
CAL P
ARTI
ESCO
UNCI
L OF E
UROP
EEX
ECUT
IVE P
OWER
DIPL
OMAT
IC SE
RVIC
EEX
ECUT
IVE P
OWER
Table 15. Member states with electoral gender quota laws/parity systems for local elections (2016)
MEMBER STATE QUOTA PERCENTAGE
RANK ORDER SANCTIONS AVERAGE %
WOMEN ELECTED*
Belgium 50% Yes Lists not accepted 36%
Bosnia and Herzegovina 40% Yes Lists not accepted 2,8%
France 50% Yes Lists not accepted 40%
Croatia 40% No Financial penalty 23,3%
Georgia 30% No No 1,7%
Greece 33% No Lists not accepted 18,1%
Italy 40% Yes
Lists not accepted/ Financial penalty
N/A
Montenegro 30% Yes Lists not accepted 26.2%
Poland 35% No Lists not accepted 27,4%
Portugal 33% Yes Financial penalty 29,9%
Serbia 33% Yes Lists not accepted 5,5%
Slovenia 40% Yes Lists not accepted 31.8%
Spain 40% Yes Lists not accepted 35.6%
“The former Yugoslav Republic of Macedonia” 40% Yes Lists not
accepted 29,1%
Ukraine 30% Yes Lists not accepted N/A
Note: This concerns the election of municipality councillors. Gender quotas do not necessarily apply to all local elections in every country.
The impact of legal quotas or parity systems at the local level is not obvious, as Table 15 shows. The 13 countries providing data and having legal quotas for local elections had a lower average percentage of women municipality councillors than the ones without legal gender quotas: 23.6%, compared to 27%. It is particularly striking that the three countries with the lowest proportion of women municipality councillors, of all countries observed, had legal gender quotas (Bosnia and

Page 56 Balanced participation of women and men in decision-making - Analytical report - 2016
Herzegovina, Georgia and Serbia). Nevertheless, among countries with gender quotas or parity systems, the ones that performed better in terms of gender balance at the local level, were the ones with strong gender quotas (with high minimum levels and strict sanctions). It should be noted, that the proportion of women elected to local councils was in all cases lower (i.e. between 25% and 40%) than the targets set by the legislation (i.e. between 30% and 50%). In addition, out of the four countries that reached the 40% minimum target at the local level (Andorra, France, Monaco and Sweden) only France did so with a parity system.
Conclusions regarding gender balance in the executive power
Overall, the analysis of the national, regional and local executive power shows that the positions at the very top of the political hierarchy at the executive level in 2016 in Europe were still almost exclusively male-dominated. In all the executive functions, not even 10% of the respondent countries met the 40% target set by the Recommendation. Moreover, the comparison between 2005 and 2016 shows that percentages of women in executive positions have increased in some cases (notably in regional governments), but not in a systematic way. Whereas averages of women among senior and junior ministers, local councillors and regional governments members were close to each other (between a quarter and 31%), the under-representation of women among heads of state and government, heads of regional governments as well as mayors, remained problematic.

Executive power Page 57
LEGI
SLAT
IVE P
OWER
JUDI
CIAL
POW
ERPO
LITI
CAL P
ARTI
ESCO
UNCI
L OF E
UROP
EEX
ECUT
IVE P
OWER
DIPL
OMAT
IC SE
RVIC
EEX
ECUT
IVE P
OWER
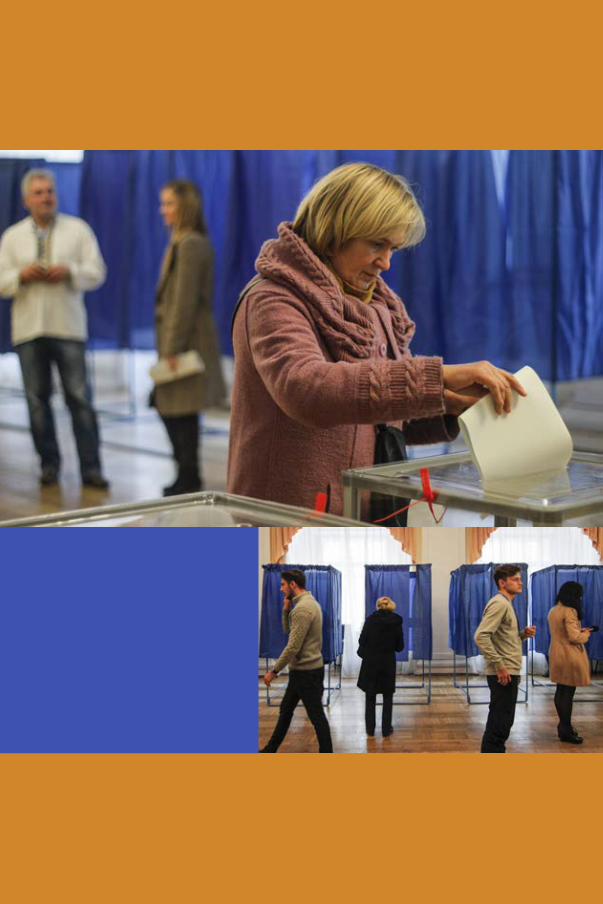
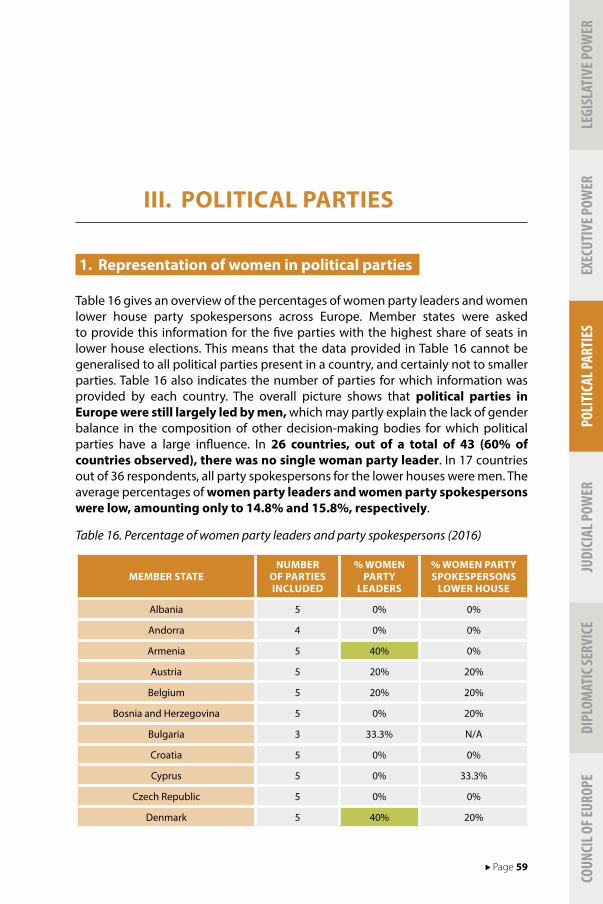
LEGI
SLAT
IVE P
OWER
JUDI
CIAL
POW
ERPO
LITI
CAL P
ARTI
ESCO
UNCI
L OF E
UROP
EEX
ECUT
IVE P
OWER
DIPL
OMAT
IC SE
RVIC
EPO
LITI
CAL P
ARTI
ES
Page 59
III. POLITICAL PARTIES
1. Representation of women in political parties
Table 16 gives an overview of the percentages of women party leaders and women lower house party spokespersons across Europe. Member states were asked to provide this information for the five parties with the highest share of seats in lower house elections. This means that the data provided in Table 16 cannot be generalised to all political parties present in a country, and certainly not to smaller parties. Table 16 also indicates the number of parties for which information was provided by each country. The overall picture shows that political parties in Europe were still largely led by men, which may partly explain the lack of gender balance in the composition of other decision-making bodies for which political parties have a large influence. In 26 countries, out of a total of 43 (60% of countries observed), there was no single woman party leader. In 17 countries out of 36 respondents, all party spokespersons for the lower houses were men. The average percentages of women party leaders and women party spokespersons were low, amounting only to 14.8% and 15.8%, respectively.
Table 16. Percentage of women party leaders and party spokespersons (2016)
MEMBER STATENUMBER
OF PARTIES INCLUDED
% WOMEN PARTY
LEADERS
% WOMEN PARTY SPOKESPERSONS
LOWER HOUSE
Albania 5 0% 0%
Andorra 4 0% 0%
Armenia 5 40% 0%
Austria 5 20% 20%
Belgium 5 20% 20%
Bosnia and Herzegovina 5 0% 20%
Bulgaria 3 33.3% N/A
Croatia 5 0% 0%
Cyprus 5 0% 33.3%
Czech Republic 5 0% 0%
Denmark 5 40% 20%

Page 60 Balanced participation of women and men in decision-making - Analytical report - 2016
MEMBER STATENUMBER
OF PARTIES INCLUDED
% WOMEN PARTY
LEADERS
% WOMEN PARTY SPOKESPERSONS
LOWER HOUSE
Estonia 5 0% 40%
Finland 5 0% 20%
France 5 20% 0%
Georgia 5 20% 0%
Germany 5 60% 20%
Greece 5 20% 20%
Hungary 5 0% 0%
Iceland 5 20% 60%
Ireland 4 0% 0%
Italy 3 0% 0%
Liechtenstein 4 0% 50%
Lithuania 5 0% 0%
Luxembourg 5 40% 20%
Malta 2 0% N/A
Republic of Moldova 5 0% 40%
Monaco 3 0% 0%
Montenegro 5 0% N/A
Norway 5 40% 40%
Poland 5 0% 40%
Portugal 1 100% N/A
Russian Federation 4 0% 0%
San Marino 5 40% 0%
Serbia 5 0% 0%
Slovak Republic 5 0% 20%
Slovenia 4 0% 20%
Spain 5 0% 0%
Sweden 5 60% 40%
Switzerland 5 40% N/A
“The former Yugoslav Republic of Macedonia” 5 0% 0%
Turkey 4 0% 25%
Ukraine 5 0% N/A
United Kingdom 5 60% N/A
Average 14.8% 15.8%

Political parties Page 61
LEGI
SLAT
IVE P
OWER
JUDI
CIAL
POW
ERPO
LITI
CAL P
ARTI
ESCO
UNCI
L OF E
UROP
EEX
ECUT
IVE P
OWER
DIPL
OMAT
IC SE
RVIC
EPO
LITI
CAL P
ARTI
ES
Despite the lack of women as party leaders and party spokespersons, women were more frequently present among party executives (the governing bodies of political parties), party members and party candidates for national elections, as can be seen in Table 17. This means that, even though women were not always able to break the glass ceiling in political parties, they were - at least to a certain extent - integrated in some of the layers of the parties’ organisations. However, in most cases women’s presence among party executives, party members and party candidates did not reach the minimum recommended target of 40%.
Party executives are governing bodies in charge of the daily operations of parties. They usually include the party leader and deputy leaders, as well as party officials who manage thematic areas (such as the secretary of public relations or the secretary of organisation). Party executives can be very powerful bodies, not the least because they make important day-to-day decisions and often play a crucial role in the recruitment and selection of party candidates for elections (Lovenduski & Norris 1993; Kittilson 2006). On average, women made up 27.1% of party executives in the 33 countries that provided this information. In six countries (18%), women achieved considerable progress by making up more than 40% of party executives. This was the case in Estonia, France, Iceland, Norway, Sweden and Switzerland. In an additional seven countries (Belgium, Ireland, Italy, Liechtenstein, Luxembourg, Slovenia, Spain), women held between 30% and 39.9% of party executive positions. In 10 countries (30%), the percentage of women in party executives was situated between 20% and 29.9%. In the remaining nine countries (27%), women made up less than 20% of party executives.
Only 18 countries provided information on the presence of women and men among political party members. Nevertheless, we can conclude, based on the data gathered, that women were integrated throughout parties, albeit not to the same extent in every country. Front runners were Estonia, Ireland, Republic of Moldova and San Marino, where parties had on average more than 40% women members. The average percentage of women party members was nevertheless only 27.5%, which was still well below the 40% minimum target.
Academic research on the recruitment and selection of women in political parties furthermore suggests that the presence of women among party executives and party members impacts on the presence of women candidates for elections. It is suggested that women, when they are part of the internal organisation and leadership of political parties, may support to a greater extent than men, the adoption of rules for the improvement of gender balance and represent a new pool of experienced women candidates (Kittilson 2006). This seems to be confirmed on the basis of the findings in Table 17. Overall, percentages of women among party executives and party members correlated (moderately) with percentages of women candidates for national elections: countries with higher percentages of women among party executives and members also tended to have higher percentages of women among electoral candidates.

Page 62 Balanced participation of women and men in decision-making - Analytical report - 2016
Table 17. Percentage of women in party executives, as members and candidates for national elections (2016)
MEMBER STATE% WOMEN IN
PARTY EXECUTIVES (AVERAGE)
% WOMEN MEMBERS (AVERAGE)
% WOMEN PARTY CANDIDATES FOR NATIONAL
ELECTIONS (AVERAGE)
Andorra N/A 36.3% N/A
Armenia 25% 5% N/A
Belgium 30.2% N/A N/A
Bosnia and Herzegovina 14.1% 14.3% 36.9%
Bulgaria 28.2% N/A N/A
Croatia 14% 18% 33.3%
Cyprus N/A N/A 19.4%
Czech Republic 20.4% N/A 24%
Denmark 25.7% 37.5% 33.4%
Estonia 45% 42.3% 27.1%
Finland N/A N/A 45%
France 43.8% N/A 39.1%
Georgia 27.3% 14.2% 11.9%
Greece 11.8% N/A 35%
Hungary 14% 27.2% N/A
Iceland 47.6% 39.5% 49.4%
Ireland 34.9% 40.4% 35.1%
Italy 35% 25.3% N/A
Liechtenstein 36.1% N/A 25.9%
Lithuania 21.6% 17% N/A
Luxembourg 32.9% N/A 34%
Malta 20.5% N/A 18.5%
Republic of Moldova 16.7% 48.6% 40.2%
Monaco 8.3% 8.3% N/A
Norway 48.1% N/A N/A
Poland 18.6% 27.4% 41.5%
Russian Federation 15.6% N/A N/A
San Marino 24.7% 41.1% 34.9%
Serbia 25% N/A 37.5%
Slovak Republic 17.4% N/A N/A
Slovenia 34.8% N/A 44.4%
Spain 30.2% N/A 48.8%
Sweden 41% N/A 43.4%
Switzerland 50% N/A 36.3%

Political parties Page 63
LEGI
SLAT
IVE P
OWER
JUDI
CIAL
POW
ERPO
LITI
CAL P
ARTI
ESCO
UNCI
L OF E
UROP
EEX
ECUT
IVE P
OWER
DIPL
OMAT
IC SE
RVIC
EPO
LITI
CAL P
ARTI
ES
MEMBER STATE% WOMEN IN
PARTY EXECUTIVES (AVERAGE)
% WOMEN MEMBERS (AVERAGE)
% WOMEN PARTY CANDIDATES FOR NATIONAL
ELECTIONS (AVERAGE)
Turkey 29.6% 37.1% 26%
Ukraine 5.8% 14.8% 15.8%
Average 27.1% 27.5% 33.5%
Note: National percentages are average percentages, calculated on the basis of the answers received from the member states for the five parties with the highest seat shares in lower house elections. The global average is an average of those percentages. All data were not available for all member states.
2. Measures related to gender equality taken by political parties
The Council of Europe Recommendation on gender balance in decision making addresses political parties as key actors in achieving gender equality (paragraph VII of the Recommendation). One of the supportive measures recommends member states to inform political parties of the different strategies used in the various countries to promote the balanced participation of women and men in elected assemblies; and to encourage them to implement one or more of these strategies and to promote the balanced participation of women and men in positions of decision making within the party structures. Including gender equality in their legal frameworks and adopting gender quotas for elections and party bodies notably are crucial ways for political parties to contribute to achieving a gender balance. Furthermore, both the legislative and administrative measures and other supportive measures suggested by the Recommendation include concrete actions related to political parties, such as the use of public funding of political parties to encourage them to promote gender equality; the need to develop and support leadership and media training for women considering entering political decision-making; and training for women candidates in the use of information and communication technologies.
The data gathered in 2016 showed that a number of countries have taken measures to encourage political parties to advance gender equality, as shown in Figure 9 one third of the countries included gender equality provisions in the legal framework applying to political parties, and almost one quarter included rules on gender equality in the law on the public funding of political parties.
In addition, political parties themselves have adopted measures. In 2016, parties in 40% of the member states had introduced electoral gender quotas, which is positive given that this report shows that party quotas, presumably due to their strong designs, tend to be more efficient in producing higher numbers of elected women, compared to weak gender quota laws or parity systems (see discussion above). Furthermore, political parties have adopted gender quotas for internal party bodies in over 50% of member states. While gender quotas were a rather widespread strategy in 2016, other strategies were also used. For example, in one third of the countries, parties provided training for women candidates.

Page 64 Balanced participation of women and men in decision-making - Analytical report - 2016
Figure 9. Presence of rules and measures on gender equality in relation to political parties (2016)
60%
50%
40%
30%
20%
10%
0%
56%
42%
32% 30%
23%
Political party quotas for
party decision-making bodies
Political party quotas for elections
Gender equality in legal
framework for political parties
Political parties organising
training for women candidates
Rules on gender equality in
law on public funding of
political parties
Table 18 examines the role that rules and regulations related to political parties may play in fostering women’s presence in national lower houses of parliament and in political parties as party leaders, party executives and party members. The existence of gender equality in legal frameworks for parties and the existence of gender equality rules in laws on the public funding of political parties did not seem to achieve much progress. Table 18 shows that countries with such rules presented similar, and sometimes even lower, levels of women in lower houses of Parliament and party organisations. This is probably linked to the fact that such measures risk being symbolic gestures. If they are not linked to more binding rules and regulations, they risk remaining empty measures not contributing to (and even hindering) women’s overall presence in political decision-making.
The presence of political party quotas, rules or regulations for elections and for party decision-making bodies were more effective. Countries where party quotas, rules or regulations existed (either for elections or for internal party bodies) tended to have higher levels of women in national lower houses of parliament, party executives and among party members. The fact that party quotas also foster women’s membership of political parties can be explained by the fact that by adopting party quotas, political parties demonstrate their ‘women-friendliness’ to audiences in or outside the party. In addition, by adopting measures to promote gender equality they can create a women-friendly image for themselves, which may in turn encourage more women to join their ranks.
Finally, the provision of trainings for women candidates played a moderate role. In general, countries where political parties organised such trainings had only slightly higher levels of women in national lower houses or among political party leaders. The impact was stronger for party executives and party members. The reason for this could be that training constitutes ‘soft’ measures for addressing women’s

Political parties Page 65
LEGI
SLAT
IVE P
OWER
JUDI
CIAL
POW
ERPO
LITI
CAL P
ARTI
ESCO
UNCI
L OF E
UROP
EEX
ECUT
IVE P
OWER
DIPL
OMAT
IC SE
RVIC
EPO
LITI
CAL P
ARTI
ES
under-representation (Lovenduski and Norris 1993). They do not force political parties to fundamentally change their recruitment and selection procedures, nor do they encourage parties to critically reflect upon the existence of gender biases or male privilege in candidate recruitment and selection processes. Also, such measures do not change the position of the party´s selectorates (the bodies responsible for selecting candidates for elections) about what constitutes a ‘good’ candidate, and whether or not this notion is biased in favour of male candidates.
Table 18. Gender-sensitivity of political parties (2016)
% WOMEN IN NATIONAL
LOWER HOUSES
% WOMEN PARTY
LEADERS
% WOMEN IN PARTY
EXECUTIVES
% PARTY MEMBERS
Legal framework for political parties
provides for gender equality
Yes 21.6% 11% 27% 20.6%
No 27.4% 18% 27.1% 30.9%
Rules on gender equality in law on public funding of political parties
Yes 19.6% 4% 24.4% 20.3%
No 26.3% 16% 26.5% 29.6%
Political party quotas, rules or regulations
for elections
Yes 28% 20% 34% 35%
No 23.5% 14% 21.5% 21.4%
Political party quotas, rules or regulations for party decision-
making bodies
Yes 28.6% 16% 32% 35%
No 20.5% 18% 18.9% 17.1%
Political parties providing training to
women candidates
Yes 26.5% 16% 30% 33%
No 25.2% 16% 26% 25%
Conclusions regarding gender balance in political parties
The findings for political parties show that, although some positive examples can be detected in some countries, overall political parties remained male-dominated organisations, largely led by men. The percentage of women in party executives or as party members and candidates remained well below the 40% minimum target. Regulations adopted with regard to political parties or adopted by them to improve women’s presence seemed to produce mixed results. The best results were generated by party quotas for elections or internal party decision-making bodies. This is in line with the findings in other parts of the report: when parties voluntarily adopt strong measures to improve the gender balance, they are usually also (very) effective. Other measures, such as the adoption of the principle of gender equality in legal frameworks or the provision of trainings for women, are important measures on a symbolic level, but they did not seem to automatically translate into a higher presence of women at all levels in political parties.


LEGI
SLAT
IVE P
OWER
JUDI
CIAL
POW
ERPO
LITI
CAL P
ARTI
ESCO
UNCI
L OF E
UROP
EEX
ECUT
IVE P
OWER
DIPL
OMAT
IC SE
RVIC
EJU
DICI
AL P
OWER
Page 67
IV. JUDICIAL POWER
1. Gender balance in High/Supreme Courts
Table 19. Percentage of women judges in High/Supreme Courts and appointment methods (2005-2016)
MEMBER STATE APPOINTMENT METHOD
% WOMEN2005
APPOINTMENT METHOD
% WOMEN2008
APPOINTMENT METHOD
% WOMEN2016
COMPARISON2005-2016 IN PERCENTAGE
POINTS
Albania N/A N/A N/A N/A HS 25% N/A
Andorra N/A N/A N/A N/A HCJ 33.3% N/A
Armenia HCJ 21% HS 0% HS 23.5% +2.5
Austria O 17.5% HS 24.6% HS 31.7% +14.2
Azerbaijan O 12.5% O 12% HS 16.2% +3.7
Belgium HS 20.4% HS 16.7% HS 22.2% +1.8
Bosnia and Herzegovina O 20% HS/HG 47.2% O 49.1% +29.1
Bulgaria N/A N/A N/A N/A HS/HG 76.9% N/A
Croatia HCJ 50% O 46.2% HCJ 38.1% -11.9
Cyprus HS 7.7% HS 7.7% HG 30.8% +23.1
Czech Republic HS 23.3% HS 27.1% HS 20% -3.3
Denmark HG 26.3% O 21.1% O 30% +3.7
Estonia O 15.8% O 15.8% O 21.1% +5.3
Finland HS 33.3% HS 31.6% HS 27.8% -5.5
France N/A N/A N/A N/A HG/O 24.8% N/A
Georgia N/A N/A N/A N/A O 38.5% N/A
Germany O 20.5% O 20.5% O 31.5% +11
Greece HCJ 2% HCJ 17.6% HS 45.1% +43.1
Hungary HS 71.9% HS 57.3% HS 46.5% -25.4
Iceland O 22.2% HS 22.2% HS 11.1% -11.1
Ireland O 33.3% O 25% HS 40% +6.7
Italy N/A 9.6% O 4.8% HCJ 7.1% -2.5
Latvia O 48.7% O 56.3% O 70% +21.3
Liechtenstein O 20% O 10% N/A N/A N/A

Page 68 Balanced participation of women and men in decision-making - Analytical report - 2016
MEMBER STATE APPOINTMENT METHOD
% WOMEN2005
APPOINTMENT METHOD
% WOMEN2008
APPOINTMENT METHOD
% WOMEN2016
COMPARISON2005-2016 IN PERCENTAGE
POINTS
Lithuania O 20% O 21.6% O 31.4% +11.4
Luxembourg HS 42.9% HS 46.9% HS 69.4% +26.5
Malta N/A N/A N/A N/A O 27.3% N/A
Republic of Moldova N/A N/A N/A N/A HS 43.3% N/A
Monaco HS 0% N/A 28.6% HS 11.1% +11.1
Montenegro N/A N/A N/A N/A HCJ 68.4% N/A
Netherlands N/A N/A N/A N/A O 25.7% N/A
Norway HG 31.6% N/A 36.8% HS 35% +3.4
Poland N/A N/A N/A N/A O 28.7% N/A
Portugal N/A 1.7% HCJ 1.7% N/A N/A N/A
Russian Federation N/A N/A N/A N/A O 35.9% N/A
Serbia N/A N/A N/A N/A O 56.8% N/A
Slovak Republic N/A N/A N/A N/A HS 55.7% N/A
Slovenia O 35.1% N/A 41.5% O 38.7% +3.6
Spain HS 1.1% HCJ 8% HCJ 13% +11.9
Sweden O 43.8% O 43.8% O 29.4% -14.4
Switzerland O 22% O 23.7% O 31.6% +9.6
“The former Yugoslav
Republic of Macedonia”
N/A N/A N/A N/A SCM 31.8% N/A
Turkey O 22.4% HS/HCJ 36.1% HS/HCJ 45.3% +22.9
Ukraine N/A 12.2% O 21.3% O 28.9% +16.7
United Kingdom N/A N/A N/A N/A O 8.3% N/A
Average 23.6% 25.8% 33%
Note: The appointment methods indicated are the following: appointed by the head of state (HS), by the head of government (HG), by the high council of the judiciary (HCJ), or in another way (O).
Out of the 43 member states for which data were available (Table 19), the percentage of women in the High/Supreme Courts of 12 of them (28%) fell between the 40-60% range, as set by the Recommendation. These were: Bosnia and Herzegovina, Greece, Hungary, Ireland, Republic of Moldova, Serbia, Slovak Republic and Turkey. Four countries had over 60% women judges in their High/Supreme Courts (Bulgaria, Latvia, Luxembourg and Montenegro). Furthermore, 13 countries (30%) had between 30% and 39.9% women judges in their High/Supreme Court. About half of the countries studied had a proportion of women judges within the 30-60% range, which outnumbers the six countries (14%) with a percentage of women judges below 20%. Furthermore, in contrast to previous

Judicial power Page 69
LEGI
SLAT
IVE P
OWER
JUDI
CIAL
POW
ERPO
LITI
CAL P
ARTI
ESCO
UNCI
L OF E
UROP
EEX
ECUT
IVE P
OWER
DIPL
OMAT
IC SE
RVIC
EJU
DICI
AL P
OWER
monitoring rounds, all countries under consideration in 2016 had some women judges in their High/Supreme Courts. This is clearly a positive evolution.
Six of the countries (14%) witnessed an important increase in the proportion of women judges in 2016 compared to 2005, with a 43.1 percentage point increase in Greece; a 29.1 percentage point increase in Bosnia and Herzegovina; a 26.5 percentage point increase in Luxembourg; a 23.1 percentage point increase in Cyprus; a 22.9 percentage point increase in Turkey and a 21.3 percentage point increase in Latvia. In addition, these six countries belong to the group of countries with more than 30% women judges in their High/Supreme Courts. One country (Hungary) witnessed a decrease of over 20 percentage points from 71.9% to 46.5%. Whereas the 2010 study stated that progress in numbers of women’s presence as judges in High/Supreme Courts in the 2005-2008 period, was “too small to be significant” (2010 study: page 41), the analysis of the 2016 data can confirm that progress was continued and increased in significance.
When comparing the average percentage of women according to the appointment method, there seemed to be no clear-cut link. Countries where judges are appointed by the head of state (HS) had on average 35.3% women judges, while countries where the head of government (HG) appoints them had 27.8% women judges. Countries where the high council of the judiciary (HCJ) appoints judges had on average 32% of women judges, and countries where another entity appoints them (O) had 34.9% of women judges. It should be taken into account that the number of observations for some appointed methods was very limited (i.e. only two for HG), so these conclusions have to be treated with caution.
2. Gender balance in Constitutional Courts
Table 20. Percentage of women judges in Constitutional Courts (2005-2016)
MEMBER STATE % WOMEN2005
% WOMEN2008
% WOMEN2016
COMPARISON2005-2016 IN PERCENTAGE
POINTS
Albania N/A N/A 25% N/A
Andorra N/A N/A 25% N/A
Armenia 0% 0% 22.2% +22.2
Austria 21.4% 28.6% 35.7% +14.3
Azerbaijan 11.1% 22.2% 22.2% +11.1
Belgium 0% 8.3% 16.7% +16.7
Bosnia and Herzegovina 22.2% 44.4% 44.4% +22.2
Bulgaria N/A 16.7% 41.7% N/A
Croatia 30.8% 46.2% 23.1% -7.7
Cyprus 7.7% N/A 30.8% +23.1
Czech Republic 35.7% 33.3% 13.3% -22.4
France 30% 0% 40% +10

Page 70 Balanced participation of women and men in decision-making - Analytical report - 2016
MEMBER STATE % WOMEN2005
% WOMEN2008
% WOMEN2016
COMPARISON2005-2016 IN PERCENTAGE
POINTS
Georgia N/A 22.2% 33.3% N/A
Germany 25% 25% 31.3% +6.3
Hungary 9.1% 0% 18.2% +9.1
Italy 6.7% 6.7% 20% +13.3
Latvia 28.6% 28.6% 42.9% +14.3
Liechtenstein 10% 0% N/A N/A
Lithuania 22.2% 22.2% 18.2% -4
Luxembourg 44.4% 44.4% 33.3% -11.1
Republic of Moldova N/A N/A 0% N/A
Monaco 0% N/A N/A N/A
Montenegro N/A 16.7% 28.6% N/A
Poland N/A N/A 20% N/A
Portugal 30.8% 23.1% 38.5% +7.7
Romania N/A 12.5% N/A N/A
Russian Federation N/A 15.8% 16.7% N/A
San Marino N/A 0% 0% N/A
Serbia N/A N/A 40% N/A
Serbia and Montenegro 27.3% N/A N/A N/A
Slovak Republic 9.1% N/A 36.4% +27.3
Slovenia 44.4% 33.3% 55.6% +11.2
Spain 16.7% 16.7% 18.2% +1.5
Sweden 44.4% 47.4% N/A N/A
“The former Yugoslav Republic of Macedonia” N/A 28.6% 44.4% N/A
Turkey 13.3% 14.9% 0% -13.3
Ukraine 14.3% 11.1% 6.3% -8
Average 20.2% 20.3% 26.3%
Out of the 32 countries which provided data on the gender composition of Constitutional Courts in 2016 (Table 20), seven reached the 40% minimum target in 2016 (21.9%). These countries are: Bosnia and Herzegovina, Bulgaria, France, Latvia, Serbia, Slovenia and “the former Yugoslav Republic of Macedonia”. Seven more countries (21.9%) were situated within the 30-39.9% range. Ten countries (31.3%) had less than 20% women judges in the Constitutional Court. But, in contrast to the High/Supreme Courts discussed above, three Constitutional Courts had no woman judge (Republic of Moldova, San Marino and Turkey). Similar to the evolution of the number of women judges in High/Supreme Courts, a majority of the respondent countries (15 out of 20, or 75%) witnessed a positive evolution in women’s presence in Constitutional Courts in 2016

Judicial power Page 71
LEGI
SLAT
IVE P
OWER
JUDI
CIAL
POW
ERPO
LITI
CAL P
ARTI
ESCO
UNCI
L OF E
UROP
EEX
ECUT
IVE P
OWER
DIPL
OMAT
IC SE
RVIC
EJU
DICI
AL P
OWER
compared to 2005 (although the absolute numbers of judges in the different courts are small and results should be interpreted with caution). Some countries showed important increases: in Armenia, the Constitutional Court went from no women to 22% in 2016; in Bosnia and Herzegovina, the number of women judges in the Constitutional Court rose from 22.2% in 2005 to 44.4% in 2008, a level that was also observed in 2016. On the other hand, two Constitutional Courts also witnessed important decreases in the proportion of women judges. The Constitutional Court of the Czech Republic had 35.7% women judges in 2005 and only 13.3% in 2016; the Turkish Constitutional Court that already had a low percentage of 13.3% in 2005 was left with no women in 2016.
3. Gender balance in High Councils of the Judiciary
Table 21. Percentage of women and men in High Councils of the Judiciary and women presidents (2016)
MEMBER STATES WOMAN PRESIDENT % WOMEN
Albania √ 23,1%
Andorra 0%
Armenia 30,0%
Azerbaijan 11,1%
Belgium 40,9%
Bosnia and Herzegovina 46,7%
Bulgaria 50,0%
Croatia 9,1%
Cyprus 30,8%
Denmark 54,5%
France 28,0%
Georgia √ 25,0%
Greece √ 40,0%
Hungary 44,8%
Iceland 0%
Italy 8,3%
Latvia 46,7%
Lithuania 26,1%
Republic of Moldova 33,3%
Monaco 25,0%
Montenegro 40,0%
Netherlands 0%
Norway 50,0%

Page 72 Balanced participation of women and men in decision-making - Analytical report - 2016
MEMBER STATES WOMAN PRESIDENT % WOMEN
Poland 24,0%
Portugal 15,8%
Russian Federation 21,0%
San Marino √ 18,2%
Serbia 18,2%
Slovak Republic √ 25,0%
Slovenia √ 45,5%
Spain 45,0%
Turkey 4,9%
Ukraine 44,4%
Total/average 6 28%
Twelve out of the 33 countries which provided data on the composition of the High Council of the Judiciary (or 36%) went beyond the 40% target in 2016 (Table 21). These countries were Belgium, Bosnia and Herzegovina, Bulgaria, Denmark, Greece, Hungary, Latvia, Montenegro, Norway, Slovenia, Spain and Ukraine. Three countries (9%) had a representation between 30% and 39%. Finally, ten out of 33 countries had less than 20% women in their High Council of the Judiciary. Among them, three countries had a 100% male council (Andorra, Iceland and the Netherlands). In 2016 the average representation of women in High Councils of the Judiciary remained well below the 40% minimum target as is the case for High/Supreme Courts and Constitutional Courts.
As data regarding gender balance in High Councils of the Judiciary was not included in the previous monitoring rounds of Recommendation Rec(2003)3, a comparison with 2005 and 2008 figures was not possible.
Conclusions regarding gender balance in the judicial power
The findings show some positive evolutions in 2016 compared to 2005 regarding gender balance in the judiciary. A majority of countries witnessed an increase in the percentage of women judges in their High/Supreme Courts as well as in Constitutional Courts. However, still very few of the observed courts reached in 2016 the 40% minimum target set by the Recommendation: 12 of the High/Supreme Courts (28%), seven of the Constitutional Courts (22%) and 12 of the High Councils for the Judiciary (36%).

Judicial power Page 73
LEGI
SLAT
IVE P
OWER
JUDI
CIAL
POW
ERPO
LITI
CAL P
ARTI
ESCO
UNCI
L OF E
UROP
EEX
ECUT
IVE P
OWER
DIPL
OMAT
IC SE
RVIC
EJU
DICI
AL P
OWER


LEGI
SLAT
IVE P
OWER
JUDI
CIAL
POW
ERPO
LITI
CAL P
ARTI
ESCO
UNCI
L OF E
UROP
EEX
ECUT
IVE P
OWER
DIPL
OMAT
IC SE
RVIC
EDI
PLOM
ATIC
SERV
ICE
Page 75
V. DIPLOMATIC SERVICE
1. Gender balance among ambassadors extraordinary and plenipotentiary
Table 22. Percentage of women ambassadors extraordinary and plenipoten-tiary (2005-2016)
MEMBER STATE % WOMEN 2005
% WOMEN 2008
% WOMEN 2016
COMPARISON 2005-2016 IN PERCENTAGE
POINTS
Albania N/A N/A 24.4% N/A
Andorra N/A N/A 57.1% N/A
Armenia 2.9% 5.3% 10% +7.1
Austria N/A 23.8% 24.7% N/A
Azerbaijan 2.6% 3.7% 1.7% -0.9
Belgium 10.8% 14.3% 13% +2.2
Bosnia and Herzegovina 17% 23.7% 13.3% -3.7
Bulgaria N/A 6.5% 17.3% N/A
Croatia 9.1% 11.3% 27.8% +18.7
Cyprus 25% 17.6% 12.5% -12.5
Czech Republic 10.7% 7.2% 18.1% +7.4
Denmark N/A 6.5% 24.4% N/A
Estonia 29% 21.2% 18.6% -10.4
Finland 24.7% 25.7% 42.5% +17.8
France 9.3% N/A 22.1% +12.8
Georgia N/A 10.5% 15.6% N/A
Germany 4.7% 6.4% 13.4% +8.7
Greece N/A 0% 27.3% N/A
Hungary 2.4% N/A 15% +12.6
Iceland 8.3% N/A 29.3% +21
Ireland 12.5% 9.1% 16.7% +4.2

Page 76 Balanced participation of women and men in decision-making - Analytical report - 2016
MEMBER STATE % WOMEN 2005
% WOMEN 2008
% WOMEN 2016
COMPARISON 2005-2016 IN PERCENTAGE
POINTS
Italy 8.3% 8% 8.3% 0
Latvia 15.2% 19.6% 22.4% +7.2
Liechtenstein 33.3% 22.2% 37.5% +4.2
Lithuania N/A 18.6% 31.6% N/A
Luxembourg 5.6% 15% 27.8% +22.2
Malta N/A 12.5% 25% N/A
Republic of Moldova N/A N/A 12.9% N/A
Monaco 0% 9.1% 56.3% +56.3
Montenegro N/A 15% 17.6% N/A
Netherlands N/A 20.5% 28.2% N/A
Norway 18.1% 28% 36.4% +18.3
Poland N/A N/A 15.3% N/A
Portugal N/A 4.5% 11.8% N/A
Romania N/A 15.8% N/A N/A
Russian Federation N/A 0.7% 0% N/A
San Marino N/A 2.5% 25.3% N/A
Serbia N/A 39.2% 15.9% N/A
Serbia and Montenegro 14.5% N/A N/A N/A
Slovak Republic 8.5% N/A 11.3% +2.8
Slovenia 19.4% 22.6% 29.5% +10.1
Spain 4.1% 13.3% 10.3% +6.2
Sweden 35.4% 29.4% 38.5% +3.1
Switzerland 8.3% 10.7% 14.9% +6.6
“The former Yugoslav Republic of Macedonia” N/A 17.6% 13.2% N/A
Turkey 10.2% 9% 16% +5.8
Ukraine N/A 3.6% 4.3% N/A
Average 12.5% 13.9% 13%
Table 22 shows that in 2016, out of the 45 countries with data on the number of women ambassadors extraordinary and plenipotentiary (the highest positions in diplomatic service), only three reached the 40% minimum target (7% of countries). These were Andorra, Finland and Monaco. Four more countries were situated within the 30-39.9% range (9%). The largest was the group of countries with less than 20% women ambassadors extraordinary and plenipotentiary: 24 out of the 45 countries (53%), including one country (Russian Federation) with no woman ambassador extraordinary and plenipotentiary at all.

Diplomatic service Page 77
LEGI
SLAT
IVE P
OWER
JUDI
CIAL
POW
ERPO
LITI
CAL P
ARTI
ESCO
UNCI
L OF E
UROP
EEX
ECUT
IVE P
OWER
DIPL
OMAT
IC SE
RVIC
EDI
PLOM
ATIC
SERV
ICE
When turning to a country-level comparison between 2005 and 2016, very important increases of more than 15 percentage points can be noticed in five member states: Croatia, Finland, Iceland, Luxembourg, Monaco and Norway. Important increases of about 12 percentage points also took place in Hungary and France. Notwithstanding these sharp increases, the overall picture is not positive. Of the four categories regarding diplomatic services included in the questionnaire, the ambassadors extraordinary and plenipotentiary featured the lowest overall percentage of women. The fact that it concerns the highest diplomatic grade adds to the importance of this finding.
2. Gender balance among envoys and ministers plenipotentiary
Table 23. Percentage of women envoys and ministers plenipotentiary (2005-2016)
MEMBER STATE % WOMEN2005
% WOMEN2008
% WOMEN2016
COMPARISON2005-2016 IN PERCENTAGE
POINTS
Albania N/A N/A 21.4% N/A
Armenia N/A 0% 25% N/A
Austria N/A N/A 45.2% N/A
Azerbaijan 0% N/A N/A N/A
Belgium 0% N/A N/A N/A
Bosnia and Herzegovina N/A N/A 33.3% N/A
Bulgaria N/A 14.3% N/A N/A
Croatia 28.6% 46.7% 47.1% +15.5
Cyprus 15.4% 12.1% 12.1% -3.3
Czech Republic 0% 0% N/A N/A
Denmark N/A 0% 50% N/A
Finland N/A 33.3% N/A N/A
Georgia N/A 12.5% 25% N/A
Germany 56.5% 4.8% 9.8% -46.7
Greece N/A 13% N/A N/A
Hungary 0% N/A 14% +14
Ireland 14.6% 11.4% N/A N/A
Italy 5.9% 5% 7.3% +1.4
Latvia N/A N/A 100% N/A
Lithuania N/A 0% N/A N/A
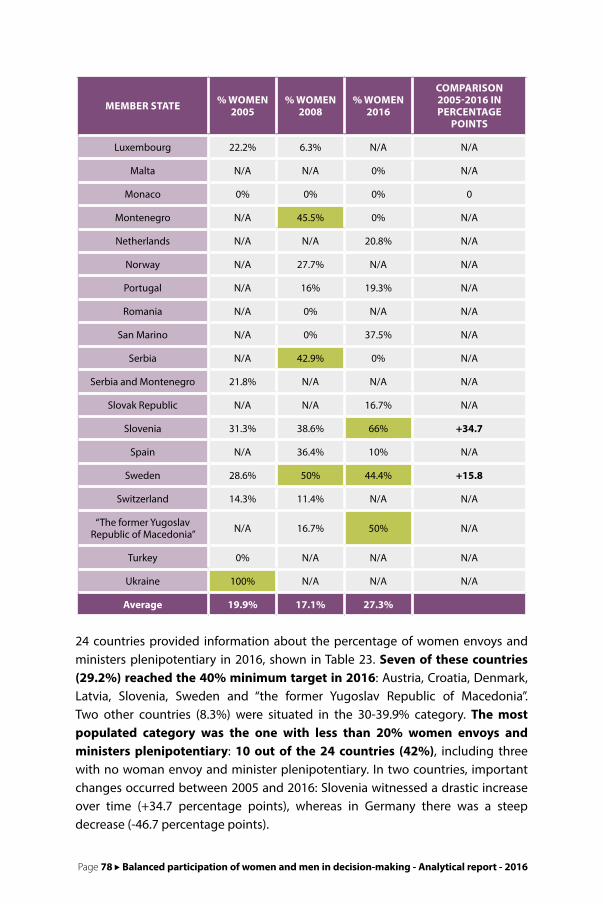
Page 78 Balanced participation of women and men in decision-making - Analytical report - 2016
MEMBER STATE % WOMEN2005
% WOMEN2008
% WOMEN2016
COMPARISON2005-2016 IN PERCENTAGE
POINTS
Luxembourg 22.2% 6.3% N/A N/A
Malta N/A N/A 0% N/A
Monaco 0% 0% 0% 0
Montenegro N/A 45.5% 0% N/A
Netherlands N/A N/A 20.8% N/A
Norway N/A 27.7% N/A N/A
Portugal N/A 16% 19.3% N/A
Romania N/A 0% N/A N/A
San Marino N/A 0% 37.5% N/A
Serbia N/A 42.9% 0% N/A
Serbia and Montenegro 21.8% N/A N/A N/A
Slovak Republic N/A N/A 16.7% N/A
Slovenia 31.3% 38.6% 66% +34.7
Spain N/A 36.4% 10% N/A
Sweden 28.6% 50% 44.4% +15.8
Switzerland 14.3% 11.4% N/A N/A
“The former Yugoslav Republic of Macedonia” N/A 16.7% 50% N/A
Turkey 0% N/A N/A N/A
Ukraine 100% N/A N/A N/A
Average 19.9% 17.1% 27.3%
24 countries provided information about the percentage of women envoys and ministers plenipotentiary in 2016, shown in Table 23. Seven of these countries (29.2%) reached the 40% minimum target in 2016: Austria, Croatia, Denmark, Latvia, Slovenia, Sweden and “the former Yugoslav Republic of Macedonia”. Two other countries (8.3%) were situated in the 30-39.9% category. The most populated category was the one with less than 20% women envoys and ministers plenipotentiary: 10 out of the 24 countries (42%), including three with no woman envoy and minister plenipotentiary. In two countries, important changes occurred between 2005 and 2016: Slovenia witnessed a drastic increase over time (+34.7 percentage points), whereas in Germany there was a steep decrease (-46.7 percentage points).

Diplomatic service Page 79
LEGI
SLAT
IVE P
OWER
JUDI
CIAL
POW
ERPO
LITI
CAL P
ARTI
ESCO
UNCI
L OF E
UROP
EEX
ECUT
IVE P
OWER
DIPL
OMAT
IC SE
RVIC
EDI
PLOM
ATIC
SERV
ICE
3. Gender balance among minister counsellors
Table 24. Percentage of women minister counsellors (2005-2016)
MEMBER STATE % WOMEN 2005
% WOMEN 2008
% WOMEN 2016
COMPARISON 2005-2016 IN PERCENTAGE
POINTS
Albania N/A N/A 35.3% N/A
Andorra N/A N/A 0% N/A
Armenia N/A 9.1% N/A N/A
Austria N/A N/A 33.3% N/A
Azerbaijan N/A 0% 0% N/A
Belgium 29.4% N/A 20% -9.4
Bosnia and Herzegovina 35.1% 41.7% 61.5% +26.4
Croatia 44.3% 37.5% 60.4% +16.1
Cyprus 5.6% 8.3% 27.7% +22.1
Czech Republic 26.7% 29.7% N/A N/A
Denmark N/A 19% 31.1% N/A
Estonia 50% 0% N/A N/A
Finland 47.8% N/A N/A N/A
France 33.3% N/A N/A N/A
Georgia N/A N/A 16.7% N/A
Germany 8.2% 13% 17.6% +9.4
Greece N/A 0% 42.6% N/A
Hungary N/A N/A 28% N/A
Iceland 11.5% 9.1% 7.7% -3.8
Ireland 19.5% 20.2% 34.8% +15.3
Italy 9.7% 0% 16% +6.3
Latvia 0% N/A 43.7% +43.7
Liechtenstein 50% N/A 57.1% +7.1
Lithuania N/A 30.3% N/A N/A
Luxembourg 40.7% 40.7% N/A N/A
Republic of Moldova N/A N/A 0% N/A
Monaco 100% 66.7% N/A N/A
Montenegro N/A 44.4% 83.3% N/A
Norway 39% 36.8% 52.2% +13.2
Poland N/A N/A 18.9% N/A

Page 80 Balanced participation of women and men in decision-making - Analytical report - 2016
MEMBER STATE % WOMEN 2005
% WOMEN 2008
% WOMEN 2016
COMPARISON 2005-2016 IN PERCENTAGE
POINTS
Portugal N/A 24.6% 33.8% N/A
Romania N/A 6.9% N/A N/A
Russian Federation N/A 6% 3.1% N/A
San Marino N/A 0% N/A N/A
Serbia N/A 42.9% 17.4% N/A
Serbia and Montenegro 29.4% N/A N/A N/A
Slovak Republic 44.9% N/A N/A N/A
Slovenia N/A 62.1% 50% N/A
Spain N/A 15.5% 25.5% N/A
Sweden N/A 21.3% 45.2% N/A
Switzerland 12.9% 20.3% 26.1% +13.2
“The former Yugoslav Republic of Macedonia” N/A 54.5% 42.1% N/A
Turkey 0% N/A 33.3% +33.3
Ukraine N/A 0% 12.5% N/A
Average 30.3% 22.8% 30.5%
In 2016, ten countries out of the 32 for which data were available (31%) met the 40% minimum target regarding women minister counsellors. As shown in Table 24, these were Bosnia and Herzegovina, Croatia, Greece, Latvia, Liechtenstein, Montenegro, Norway, Slovenia, Sweden and “the former Yugoslav Republic of Macedonia”, among which, three countries (Bosnia and Herzegovina, Croatia and Montenegro) featured a representation of women above 60%, while six countries (19%) were within the 30-39.9% range. The most populated category was still the one with less than 20% of women: 11 countries (34%) had less than 20% women minister counsellors, including three with no woman at all (Andorra, Azerbaijan and the Republic of Moldova).
Compared to 2005, Bosnia and Herzegovina, Croatia, Cyprus, Ireland, Latvia and Turkey witnessed an important increase (of more than 15 percentage points) in 2016. The proportion of women minister counsellors decreased (slightly) in only two countries (Belgium and Iceland). Given the limited number of countries for which data were available for both 2005 and 2016, no conclusions can be drawn about the evolution at the average level. Of all the positions in the diplomatic service included in this report, minister counsellors featured the highest overall percentage of women, which unfortunately correlates with the fact that this is also the lowest hierarchical function of the diplomatic service considered.

Diplomatic service Page 81
LEGI
SLAT
IVE P
OWER
JUDI
CIAL
POW
ERPO
LITI
CAL P
ARTI
ESCO
UNCI
L OF E
UROP
EEX
ECUT
IVE P
OWER
DIPL
OMAT
IC SE
RVIC
EDI
PLOM
ATIC
SERV
ICE
4. Gender balance among general consuls
Table 25. Percentage of women general consuls (2005-2016)
MEMBER STATE % WOMEN2005
% WOMEN2008
% WOMEN2016
COMPARISON2005-2016 IN PERCENTAGE
POINTS
Albania N/A N/A 40% N/A
Armenia N/A N/A 0% N/A
Austria N/A 50% 38.4% N/A
Azerbaijan 0% 0% 0% 0
Belgium 17.6% 30.2% 17.6% 0
Bosnia and Herzegovina 23.1% 43.5% 16.6% -6.5
Bulgaria N/A 6.3% 11.8% N/A
Croatia 21.1% 16.7% 33.3% +12.2
Cyprus 25% 20% 37.5% +12.5
Czech Republic 16.7% 17.6% N/A N/A
Denmark N/A 27.3% 28.6% N/A
Estonia 37.5% 50% 66.6% +29.1
Finland 28.6% 57.1% N/A N/A
France 8.9% N/A 14.6% +5.7
Georgia N/A 9.7% 16.6% N/A
Germany 8.5% 7.5% 18.2% +9.7
Greece N/A 28.3% 21.6% N/A
Hungary 12.5% 10.7% 10% -2.5
Iceland 0% N/A 17.3% +17.3
Ireland 33.3% 16.7% 66.7% +33.3
Italy 6% 12% N/A N/A
Latvia 50% 72.7% 100% +50
Lithuania N/A 16.7% N/A N/A
Luxembourg 0% 0% 0% 0
Malta N/A 100% 0% N/A
Republic of Moldova N/A N/A 0% N/A
Monaco 100% 9.4% 0% -100
Montenegro N/A 0% 0% N/A
Netherlands N/A 14.8% 16.6% N/A

Page 82 Balanced participation of women and men in decision-making - Analytical report - 2016
MEMBER STATE % WOMEN2005
% WOMEN2008
% WOMEN2016
COMPARISON2005-2016 IN PERCENTAGE
POINTS
Norway 12.5% 27.3% 44.4% +31.9
Poland N/A N/A 18.9% N/A
Portugal N/A 24.3% 41.9% N/A
Romania N/A 0% N/A N/A
Russian Federation N/A 1.2% 2.3% N/A
San Marino N/A 16.7% 18.2% N/A
Serbia N/A 54.9% N/A N/A
Slovak Republic 11.1% N/A 25% +13.1
Slovenia 0% 20% 80% +80
Spain N/A 3.4% 33.7% N/A
Sweden 16.7% 22.2% 57.1% +40.4
Switzerland 5% 6.3% 25% +20
“The former Yugoslav Republic of Macedonia” N/A 0% 57.1% N/A
Turkey 4.7% 3.4% 12.2% +7.5
Ukraine 100% 7.7% 28.6% -71.4
Average 22.4% 21.7% 25.9%
In 2016, nine out of the 38 countries, for which the proportion of women general consuls was available (23.7%), fulfilled the 40% minimum target (as shown in Table 25). The countries were Albania, Estonia, Ireland, Latvia, Norway, Portugal, Slovenia, Sweden and “the former Yugoslav Republic of Macedonia”, and among which, Estonia, Ireland, Latvia and Slovenia featured a representation of women general consuls above 60%. There are four other countries (10.5%) within the 30-39.9% range. Similarly to the minister counsellor’s position, the most populated category was the one with less than 20% women. There were 20 countries that reported having less than 20% women general consuls (52.6%), among which seven had no women general consuls at all.
In three countries, the upward trend in 2016, compared to 2005, was remarkably sharp: Slovenia went from having no woman general consul to having 80%. Latvia went from 50% to 100% and Sweden went from 16.7% to 57.1%. Estonia, Ireland, Norway and Switzerland also featured a significant increase of (more than 15 percentage points). The downward evolutions were also important in two countries: Monaco went from all general consuls being women to having none, and Ukraine went from having only women general consuls to just 28.6% of them.

Diplomatic service Page 83
LEGI
SLAT
IVE P
OWER
JUDI
CIAL
POW
ERPO
LITI
CAL P
ARTI
ESCO
UNCI
L OF E
UROP
EEX
ECUT
IVE P
OWER
DIPL
OMAT
IC SE
RVIC
EDI
PLOM
ATIC
SERV
ICE
Conclusions regarding gender balance in the diplomatic service
To sum up, although the analyses show a lot of variation among countries concerning the respective presence of women and men in the diplomatic service, one important conclusion is that the number of countries having reached the 40% minimum target is still very low. Even in 2016, some countries had no women diplomats in some of these functions. It is particularly striking that for all four functions considered, the most populated group of countries was the one scoring below 20% of women. In addition, going up the diplomatic hierarchy, the proportion of women declined. Compared to the other diplomatic functions, ambassadors had a particularly negative record: the average percentage of women ambassadors was as low as 13%. These data clearly demonstrate the existence of a glass ceiling in the diplomatic sector.


LEGI
SLAT
IVE P
OWER
JUDI
CIAL
POW
ERPO
LITI
CAL P
ARTI
ESCO
UNCI
L OF E
UROP
EEX
ECUT
IVE P
OWER
DIPL
OMAT
IC SE
RVIC
ECO
UNCI
L OF E
UROP
E
Page 85
VI. COUNCIL OF EUROPE
I n addition to the data collected by means of a questionnaire completed by the member states, this section presents data on the presence of women and men in Council of Europe bodies, including the Parliamentary Assembly, the
Chamber of Local Authorities, and the Chamber of the Regions (which make up the Council of Europe Congress of Local and Regional Authorities) and the European Court of Human Rights. Data from 2016 are again compared to data from 2005 and 2008 (based on the 2010 study) to assess whether or not the composition of these bodies has evolved towards a more balanced participation of women and men.
1. Gender balance among delegations to the Parliamentary Assembly of the Council of Europe
Table 26 presents the percentages of women representatives and substitutes to the Parliamentary Assembly of the Council of Europe. The number of member states in the three rounds of monitoring is not exactly the same. Serbia and Montenegro appeared as one country in 2005 and as two separate member states in 2008 and 2016 (Council of Europe, 2010). Data for Bulgaria were provided in 2008 and 2016, but not in 2005 (Council of Europe, 2010).
The average percentage of women representatives and substitutes to the Parliamentary Assembly in 2016 (Table 26) was 35.7%. This is an increase from 26.2% in 2005 and 29.3% in 2008. The developments in individual member states show that the percentage of women representatives improved in 34 out of 47 member states between 2005 and 2016. However, despite the improvements in the majority of the countries, there were also cases where the situation worsened. In three countries, the percentage of women representatives and substitutes to the Parliamentary Assembly dropped in 2016 compared to 2005 (Denmark, Georgia and Slovenia). In six member states, there were no changes.
In relation to the recommended minimum target of 40% representation of each sex, some significant improvements took place between 2005 and 2016. The minimum target was reached in 21 countries in 2016, compared to only six countries in 2005 and 12 countries in 2008.

Page 86 Balanced participation of women and men in decision-making - Analytical report - 2016
Table 26. Percentage of women representatives and substitutes to the Parliamentary Assembly of the Council of Europe (2005-2016)
MEMBER STATE % WOMEN2005
% WOMEN2008
% WOMEN2016
COMPARISON2005-2016 IN PERCENTAGE
POINTS
Albania 25% 37.5% 37.5% +12.5
Andorra 25% 50% 75% +50
Armenia 12.5% 25% 37.5% +25
Austria 33.3% 41.7% 41.7% +8.4
Azerbaijan 25% 25% 25% 0
Belgium 28.6% 7.1% 35.7% +7.1
Bosnia and Herzegovina 20% 30% 30% +10
Bulgaria N/A 54.5% 25% N/A
Croatia 22.2% 40% 28.6% +6.4
Cyprus 25% 25% 50% +25
Czech Republic 35.7% 50% 50% +14.3
Denmark 50% 40% 30% -20
Estonia 33.3% 50% 33.3% 0
Finland 50% 40% 60% +10
France 5.6% 20% 38.9% +33.3
Georgia 60% 20% 40% -20
Germany 30.6% 27.8% 44.4% +13.8
Greece 28.6% 28.6% 42.9% +14.3
Hungary 14.3% 7.1% 28.6% +14.3
Iceland 50% 16.7% 66.7% +16.7
Ireland 12.5% 12.5% 20% +7.5
Italy 11.1% 19.4% 47.2% +36.1
Latvia 20% 33.3% 50% +30
Liechtenstein 25% 50% 50% +25
Lithuania 25% 37.5% 37.5% +12.5
Luxembourg 33.3% 33.3% 50% +16.7
Malta 16.7% 16.7% 16.7% 0
Republic of Moldova 22.2% 20% 50% +27.8
Monaco 25% 20% 25% 0
Montenegro N/A 16.7% 50% N/A
Netherlands 21.4% 28.6% 35.7% +14.3
Norway 30% 40% 40% +10

Council of Europe Page 87
LEGI
SLAT
IVE P
OWER
JUDI
CIAL
POW
ERPO
LITI
CAL P
ARTI
ESCO
UNCI
L OF E
UROP
EEX
ECUT
IVE P
OWER
DIPL
OMAT
IC SE
RVIC
ECO
UNCI
L OF E
UROP
E
MEMBER STATE % WOMEN2005
% WOMEN2008
% WOMEN2016
COMPARISON2005-2016 IN PERCENTAGE
POINTS
Poland 16.7% 25% 16.7% 0
Portugal 28.6% 28.6% 35.7% +7.1
Romania 10% 20% 25% +15
Russian Federation 11.1% 11.1% N/A N/A
San Marino 25% 25% 50% +25
Serbia N/A 38.5% 57.1% N/A
Serbia and Montenegro 21.4% N/A N/A N/A
Slovak Republic 20% 10% 40% +20
Slovenia 66.7% 50% 16.7% -50
Spain 33.3% 37.5% 41.7% +8.4
Sweden 41.7% 58.3% 58.3% +16.6
Switzerland 16.7% 33.3% 25% +8.3
“The former Yugoslav Republic of Macedonia” 33.3% 20% 33.3% 0
Turkey 8.3% 20.8% 25% +16.7
Ukraine 8.3% 16.7% 25% +16.7
United Kingdom 19.4% 20% 25% +5.6
Average 26.2% 29.3% 35.7%
2. Gender balance among delegations to the Congress of Local and Regional Authorities of the Council of Europe
2.1 Gender balance in the Chamber of Local Authorities
Figure 10 presents a general overview of the percentage of women in the Chamber of Local Authorities in 2005, 2008 and 2016, distinguishing between the presence of women as members and as substitutes. The results show that overall the presence of women has increased considerably over time.
The global average percentage of women members and substitutes went from 27.7% in 2005 to 36.8% in 2008 and 43% in 2016. This means that the 40% minimum target was reached in 2016. Looking more closely at the two categories separately (members and substitutes), this reveals an even more interesting picture. Whereas the increase between 2005 and 2008 was mostly the result of an increase in the percentage of women substitutes (Council of Europe, 2010), the increase in 2016 was the result of an increase in the percentage of women members. The fact that the percentage of women both as members and as substitutes (almost) reached parity is reason for optimism.

Page 88 Balanced participation of women and men in decision-making - Analytical report - 2016
Figure 10. Percentage of women members and substitutes of the Chamber of Local Authorities (2005-2016)
60%
50%
40%
30%
20%
10%
0%2005
% women2008
% women2016
% women
27.8% 27.6%24.4%
49.3%
38.2%
47.9%
Members Substitutes
Tables 27 and 28 take a closer look at the situation in individual member states. Table 27 shows the percentage of women members, and Table 28 includes the percentage of women substitutes. In 2016, 22 countries (46.8%) reached the minimum target of 40%. Compared to 2005, the percentage of women members of the Chamber of Local Authorities improved in 24 countries (Table 27). The increases in the proportion of women members were sometimes substantial. In seven countries, for instance, the percentage of women members went up by 50 percentage points. In opposition to these positive developments, some negative developments also occurred. In 11 member states, the proportion of women members decreased between 2005 and 2016, and in some of these countries it did so rather dramatically. In ten countries, the presence of women in 2016 remained the same compared to the situation in 2005.
All in all, the cross-national and comparisons over time reveal a great deal of fluctuation in the presence of women members in the Chamber of Local Authorities. An important explanation for this fluctuation is the fact that a low number of positions is allocated to each member state, meaning that changes in the actual numbers of women or men can lead to big variations in the percentages for these groups. Nevertheless, it seems important to monitor these fluctuations in the future, to consider what other underlying causes may play a role.

Council of Europe Page 89
LEGI
SLAT
IVE P
OWER
JUDI
CIAL
POW
ERPO
LITI
CAL P
ARTI
ESCO
UNCI
L OF E
UROP
EEX
ECUT
IVE P
OWER
DIPL
OMAT
IC SE
RVIC
ECO
UNCI
L OF E
UROP
E
Table 27. Percentage of women members of the Chamber of Local Authorities of the Council of Europe (2005-2016)
MEMBER STATE % WOMEN 2005
% WOMEN 2008
% WOMEN 2016
COMPARISON 2005-2016 IN PERCENTAGE
POINTS
Albania 0% 0% 50% +50
Andorra 0% 0% 0% 0
Armenia 0% 0% 0% 0
Austria 33.3% 33.3% 66.7% +33.4
Azerbaijan 66.7% 0% 33.3% -33.4
Belgium 0% 0% 33.3% +33.3
Bosnia and Herzegovina 0% 0% 50% +50
Bulgaria 40% 20% 60% +20
Croatia 66.7% 33.3% 33.3% -33.4
Cyprus 0% 0% 50% +50
Czech Republic 50% 50% 50% 0
Denmark 50% 66.7% 0% -50
Estonia 50% 50% 50% 0
Finland 66.7% 33.3% 33.3% -33.4
France 11.1% 11.1% 33.3% +22.2
Georgia 50% 50% 50% 0
Germany 11.1% 22.2% 44.4% +33.3
Greece 25% 25% 50% +25
Hungary 25% 25% 50% +25
Iceland 33.3% 33.3% 33.3% 0
Ireland 50% 50% 50% 0
Italy 44.4% 33.3% 33.3% -11.1
Latvia 100% 50% 33.3% -66.7
Liechtenstein 0% 0% 50% +50
Lithuania 0% 0% 50% +50
Luxembourg 0% 0% 33.3% +33.3
Malta 0% 0% 0% 0

Page 90 Balanced participation of women and men in decision-making - Analytical report - 2016
MEMBER STATE % WOMEN 2005
% WOMEN 2008
% WOMEN 2016
COMPARISON 2005-2016 IN PERCENTAGE
POINTS
Republic of Moldova 0% 50% 33.3% +33.3
Monaco 50% 0% 0% -50
Montenegro N/A 33.3% 33.3% N/A
Netherlands 50% 50% 50% 0
Norway 50% 50% 33.3% -16.7
Poland 0% 0% 16.7% +16.7
Portugal 0% 0% 50% +50
Romania 20% 25% 40% +20
Russian Federation 11.1% 22.2% 55.6% +44.5
San Marino 100% 0% 50% -50
Serbia N/A 0% 50% N/A
Serbia and Montenegro 0% N/A N/A N/A
Slovak Republic 0% 33.3% 33.3% +33.3
Slovenia 50% 50% 100% +50
Spain 16.7% 50% 16.7% 0
Sweden 66.7% 66.7% 33.3% -33.4
Switzerland 0% 33.3% 33.3% +33.3
“The former Yugoslav Republic of Macedonia” 0% 0% 33.3% +33.3
Turkey 16.7% 16.7% 44.4% +27.7
Ukraine 16.7% 33.3% 33.3% +16.6
United Kingdom 55.6% 33.3% 33.3% -22.3
Average 27.8% 24.1% 38.2%
Table 28 equally shows some positive results. The average percentage of women substitutes in the Chamber of Local Authorities reached the minimum target of 40% in 2008, and continued to do so in 2016 (with an average of 47.9% women substitutes). Also at the individual country level, more than half of the countries (21 out of 38, or 55%) had at least 40% of women among the substitutes for the Chamber of Local Authorities. This is also a positive trend compared to 2005, when only 13 out of 41 countries (32%) reached the minimum target; a similar positive trend was observed in 2008.
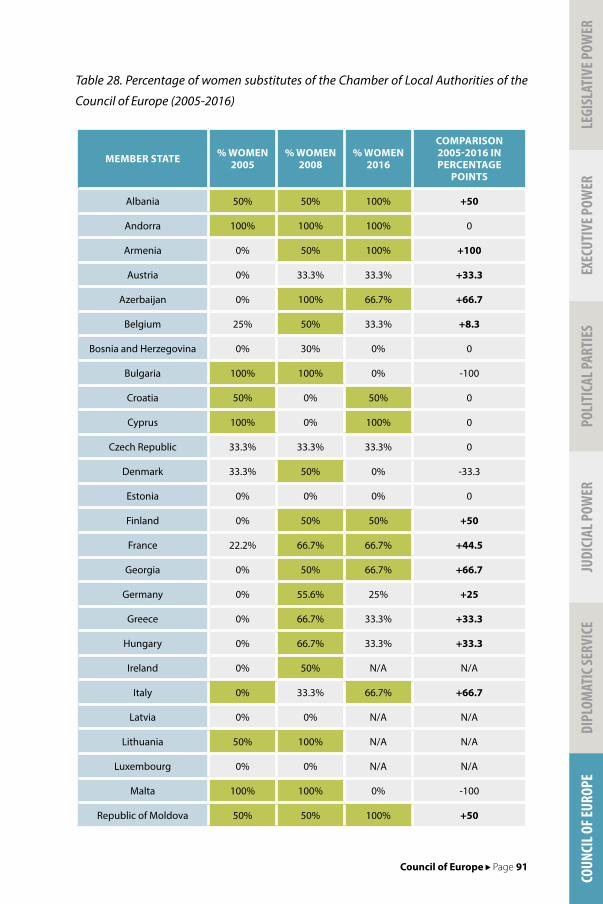
Council of Europe Page 91
LEGI
SLAT
IVE P
OWER
JUDI
CIAL
POW
ERPO
LITI
CAL P
ARTI
ESCO
UNCI
L OF E
UROP
EEX
ECUT
IVE P
OWER
DIPL
OMAT
IC SE
RVIC
ECO
UNCI
L OF E
UROP
E
Table 28. Percentage of women substitutes of the Chamber of Local Authorities of the
Council of Europe (2005-2016)
MEMBER STATE % WOMEN 2005
% WOMEN 2008
% WOMEN 2016
COMPARISON2005-2016 IN PERCENTAGE
POINTS
Albania 50% 50% 100% +50
Andorra 100% 100% 100% 0
Armenia 0% 50% 100% +100
Austria 0% 33.3% 33.3% +33.3
Azerbaijan 0% 100% 66.7% +66.7
Belgium 25% 50% 33.3% +8.3
Bosnia and Herzegovina 0% 30% 0% 0
Bulgaria 100% 100% 0% -100
Croatia 50% 0% 50% 0
Cyprus 100% 0% 100% 0
Czech Republic 33.3% 33.3% 33.3% 0
Denmark 33.3% 50% 0% -33.3
Estonia 0% 0% 0% 0
Finland 0% 50% 50% +50
France 22.2% 66.7% 66.7% +44.5
Georgia 0% 50% 66.7% +66.7
Germany 0% 55.6% 25% +25
Greece 0% 66.7% 33.3% +33.3
Hungary 0% 66.7% 33.3% +33.3
Ireland 0% 50% N/A N/A
Italy 0% 33.3% 66.7% +66.7
Latvia 0% 0% N/A N/A
Lithuania 50% 100% N/A N/A
Luxembourg 0% 0% N/A N/A
Malta 100% 100% 0% -100
Republic of Moldova 50% 50% 100% +50

Page 92 Balanced participation of women and men in decision-making - Analytical report - 2016
MEMBER STATE % WOMEN 2005
% WOMEN 2008
% WOMEN 2016
COMPARISON2005-2016 IN PERCENTAGE
POINTS
Monaco N/A 100% 100% N/A
Netherlands 50% 33.3% 33.3% -16.7
Norway 100% 66.7% 0% -100
Poland 0% 83.3% 50% +50
Portugal 33.3% 100% 33.3% 0
Romania 20% 33.3% 60% +40
Russian Federation 44.4% 33.3% 66.7% +22.3
Serbia N/A 66.7% 66.7% N/A
Serbia and Montenegro 0% N/A N/A N/A
Slovak Republic 0% 50% 50% +50
Slovenia 0% 0% 0% 0
Spain 16.7% 16.7% 33.3% +16.6
Sweden 66.7% 33.3% 66.7% 0
Switzerland 33.3% 33.3% 66.7% +33.4
Turkey 16.7% 33.3% 55.6% +38.9
Ukraine 16.7% 33.3% 33.3% +16.6
United Kingdom 22.2% 66.7% 44.4% +22.2
Average 27.6% 49.3% 47.9%
2.2 Gender balance in the Chamber of Regions
Women’s presence in the Chamber of Regions as either members or substitutes reached the minimum target of 40% in 2016, as shown in Figure 11. In 2016, 44.8% of members and substitutes were women, compared to 29.7% in 2005 and 41.1% in 2008. Two elements, however, are important to note. Firstly, women’s presence has increased over time, but the sharpest increase took place between 2005 and 2008, and not between 2008 and 2016. In fact, women’s overall presence in the Chamber of Regions in 2016 was only marginally higher than their presence in 2008. Secondly, and more importantly, evolutions in women’s presence differ if we compare the percentage of women as members with their percentage as substitutes. Whereas the percentage of women substitutes decreased between 2008 and 2016, the percentage of women members actually went up by 18.9 percentage points since 2008 and by 29.6 percentage points since 2005.

Council of Europe Page 93
LEGI
SLAT
IVE P
OWER
JUDI
CIAL
POW
ERPO
LITI
CAL P
ARTI
ESCO
UNCI
L OF E
UROP
EEX
ECUT
IVE P
OWER
DIPL
OMAT
IC SE
RVIC
ECO
UNCI
L OF E
UROP
E
Figure 11. Percentage of women members and substitutes of the Chamber of Regions (2005-2016)
60%
50%
40%
30%
20%
10%
0%
19.8%
39.6%
30.5%
51.8% 49.4%
40.2%
2005% women
2008% women
2016% women
Members Substitutes
The increase shown in Figure 11 is also noticeable in Table 29 displaying percentages of women members by individual member states. Table 29 demonstrates that in 2016, 22 out of 38 countries (or 58%) had 40% or more women members in the Chamber of Regions. These positive developments are also apparent if we consider the final column in Table 29. A large majority of 28 countries (73.7%) witnessed an upward trend in the percentage of women members between 2005 and 2016. Eight countries stagnated and no countries experienced a downward trend. In 2016, the general average percentage of women members in the Chambers of Regions was well above the 40% target, reaching 49.4% for the 38 countries observed.
Table 29. Percentage of women members of the Chamber of Regions (2005-2016)
MEMBER STATE % WOMEN 2005
% WOMEN 2008
% WOMEN 2016
COMPARISON 2005-2016 IN PERCENTAGE
POINTS
Albania 0% 0% 50% +50
Andorra 0% 0% 100% +100
Armenia 50% 50% 100% +50
Austria 0% 33.3% 33.3% +33.3
Azerbaijan 0% 33.3% 33.3% +33.3
Belgium 25% 50% 50% +25
Bosnia and Herzegovina 66.7% 33.3% 66.7% 0
Bulgaria 0% 0% 0% 0
Croatia 50% 0% 50% 0

Page 94 Balanced participation of women and men in decision-making - Analytical report - 2016
MEMBER STATE % WOMEN 2005
% WOMEN 2008
% WOMEN 2016
COMPARISON 2005-2016 IN PERCENTAGE
POINTS
Cyprus 0% 100% 0% 0
Czech Republic 0% 33.3% N/A N/A
Denmark 33.3% 50% 100% +66.7
Estonia 0% 0% 0% 0
Finland 100% 100% 100% 0
France 22.2% 33.3% 42.9% +20.7
Georgia 0% 33.3% 33.3% +33.3
Germany 22.2% 44.4% 22.2% 0
Greece 0% 0% 66.7% +66.7
Hungary 0% 33.3% 33.3% +33.3
Ireland 50% 50% N/A N/A
Italy 11.1% 44.4% 33.3% +22.2
Latvia 0% 0% N/A N/A
Lithuania 0% 0% 50% +50
Luxembourg 100% 100% N/A N/A
Malta 0% 100% 100% +100
Republic of Moldova 0% 0% 50% +50
Monaco N/A 0% 100% N/A
Netherlands 0% 33.3% 33.3% +33.3
Norway 33.3% 33.3% 100% +66.7
Poland 16.7% 0% 50% +33.3
Portugal 0% 33.3% 33.3% +33.3
Romania 20% 50% 40% +20
Russian Federation 22.2% 11.1% 33.3% +11.1
Serbia N/A 33.3% 33.3% N/A
Slovak Republic 0% 0% 50% +50
Slovenia 0% 0% 0% 0
Spain 50% 16.7% 66.7% +16.7
Sweden 33.3% 33.3% 50% +16.7
Switzerland 0% 33.3% 66.7% +66.7

Council of Europe Page 95
LEGI
SLAT
IVE P
OWER
JUDI
CIAL
POW
ERPO
LITI
CAL P
ARTI
ESCO
UNCI
L OF E
UROP
EEX
ECUT
IVE P
OWER
DIPL
OMAT
IC SE
RVIC
ECO
UNCI
L OF E
UROP
E
MEMBER STATE % WOMEN 2005
% WOMEN 2008
% WOMEN 2016
COMPARISON 2005-2016 IN PERCENTAGE
POINTS
Turkey 16.7% 33.3% 22.2% +5.5
Ukraine 33.3% 33.3% 50% +16.7
United Kingdom 22.2% 12.5% 33.3% +11.1
Average 19.8% 30.5% 49.4%
Compared to Table 29 related to members of the Chamber of Regions, the results in Table 30 on the percentage of women as substitutes in the Chamber of Regions show less of a consistent progress. Although the average percentage of women substitutes still just reached the minimum target of 40% in 2016, this percentage was comparable to the average percentage of women substitutes in 2005 (39.6%) and lower than the average percentage of women substitutes in 2008 (51.8%). There is also considerable variation at the individual country level. Compared to 2005, 18 countries out of 44 (40.9%) witnessed an increase in the percentage of women substitutes in 2016, 9 countries (20.5%) witnessed a decrease and 17 countries (38.6%) stagnated. In 2016, a total of 23 countries (48.9%) reached the minimum target of 40% women substitutes.
Table 30. Percentage of women substitutes of the Chamber of Regions (2005-2016)
MEMBER STATE % WOMEN 2005
% WOMEN 2008
% WOMEN 2016
COMPARISON 2005-2016 IN PERCENTAGE
POINTS
Albania 0% 100% 0% 0
Andorra 0% 100% 0% 0
Armenia 0% 50% 0% 0
Austria 33.3% 33.3% 33.3% 0
Azerbaijan 0% 33.3% 33.3% +33.3
Belgium 0% 33.3% 33.3% +33.3
Bosnia and Herzegovina 50% 50% 100% +50
Bulgaria 0% 20% 40% +40
Croatia 33.3% 66.7% 66.7% +33.4
Cyprus 0% 50% 50% +50
Czech Republic 0% 25% N/A N/A
Denmark 0% 0% 66.7% +66.7
Estonia 50% 50% 50% 0

Page 96 Balanced participation of women and men in decision-making - Analytical report - 2016
MEMBER STATE % WOMEN 2005
% WOMEN 2008
% WOMEN 2016
COMPARISON 2005-2016 IN PERCENTAGE
POINTS
Finland 33.3% 66.7% 33.3% 0
France 44.4% 37.5% 14.3% -30.1
Georgia N/A 0% 0% N/A
Germany 33.3% 55.6% 50% +16.7
Greece 25% 50% 50% +25
Hungary 0% 25% 50% +50
Iceland 33.3% N/A 66.7% +33.4
Ireland 0% 0% 50% +50
Italy 50% 33.3% 33.3% -16.7
Latvia 50% 50% 33.3% -16.7
Liechtenstein 50% 100% 50% 0
Lithuania 50% 50% 100% +50
Luxembourg 50% 50% 33.3% -16.7
Malta 50% 0% 50% 0
Republic of Moldova 33% 33.3% 0% -33
Monaco 50% 100% 0% -50
Montenegro N/A 50% 33.3% N/A
Netherlands 25% 75% 50% +25
Norway 0% 50% 66.7% +66.7
Poland 33.3% 40% 50% +16.7
Portugal 50% 25% 50% 0
Romania 20% 40% 20% 0
Russian Federation 44.4% 62.5% 37.5% -6.9
San Marino 50% 100% 50% 0
Serbia N/A 50% 50% N/A
Serbia and Montenegro 50% N/A N/A N/A
Slovak Republic 33.3% 66.7% 33.3% 0
Slovenia 50% 50% 50% 0
Spain 33.3% 75% 40% +6.7
Sweden 100% 75% 50% -50

Council of Europe Page 97
LEGI
SLAT
IVE P
OWER
JUDI
CIAL
POW
ERPO
LITI
CAL P
ARTI
ESCO
UNCI
L OF E
UROP
EEX
ECUT
IVE P
OWER
DIPL
OMAT
IC SE
RVIC
ECO
UNCI
L OF E
UROP
E
MEMBER STATE % WOMEN 2005
% WOMEN 2008
% WOMEN 2016
COMPARISON 2005-2016 IN PERCENTAGE
POINTS
Switzerland 66.7% 33.3% 66.7% 0
“The former Yugoslav Republic of Macedonia” 33.3% 66.7% 33.3% 0
Turkey 33.3% 50% 33.3% 0
Ukraine 33.3% 50% 33.3% 0
United Kingdom 37.5% 55.6% 22.2% -15.3
Average 39.6% 51.9% 40.2%
3. Gender balance in the European Court of Human Rights
Figure 12 and Table 31 give an overview of the presence of women judges in the European Court of Human Rights. In 2016, out of the 46 judges of the European Court of Human Rights, 16 were women and 30 were men,7 bringing the percentage of women judges to 34.8%. This percentage is comparable to the 33.3% of women judges present in 2008 and higher than the 27% of women judges present in 2005.
Figure 12. Percentage of women judges in the European Court of Human Rights (2005-2016)
2005% women
2008% women
2016% women
40%
35%
30%
25%
20%
15%
10%
5%
0%
27.0%
33.3%34.8%
7. One post was vacant at the time of reporting.

Page 98 Balanced participation of women and men in decision-making - Analytical report - 2016
As for the composition of the Court, a positive improvement could also be noticed, especially in comparison to the situation in 2005. In 2016, the President of the Court was a man, but the 40% minimum target was reached for vice-presidents, reaching perfect parity 50/50 and even exceeded for section presidents and section vice-presidents (60% women). Among the five section presidents and five section vice-presidents, there were each time three women. Women have therefore become visible among all leading posts and in both lower and higher ranks except the highest one.
Comparing the average in Figure 12 (34.8%) with data on women in the judiciary at the national level, the situation in the European Court of Human Rights is similar to average data regarding High and Supreme Courts (33%) but higher or significantly higher than the average for High Councils of the Judiciary (28%) or Constitutional Courts (19%).
Table 31. Gender balance in the different functions of the European Court of Human Rights (2005-2016)
% WOMEN2005
% WOMEN2008
% WOMEN2016
COMPARISON2005-2016 IN
PERCENTAGE POINTS
President of the Court 0% 0% 0% 0
Vice-presidents 0% 0% 50% +50
Section presidents 0% 20% 60% +60
Section vice-presidents 0% 40% 60% +60
Conclusions regarding gender balance in the bodies of the Council of Europe
Overall, the presence of women and men in Council of Europe bodies is balanced. For all functions except the Parliamentary Assembly (35.7% women) and the President of the European Court of Human Rights (0%), Council of Europe bodies reached or surpassed the 40% target. Both the Chamber of Local Authorities and the Chamber of Regions went slightly above the minimum target of 40%. This increase was mostly the result of an increase in the presence of women as members, rather than substitutes. This is a positive development, compared to the previous years. The presence of women in the Parliamentary Assembly and on average among judges in the European Court of Human Rights was still below 40% but higher than 30%. With a small effort and commitment to achieve balanced participation, these average percentages could, in the short term, be increased to 40%.

Council of Europe Page 99
LEGI
SLAT
IVE P
OWER
JUDI
CIAL
POW
ERPO
LITI
CAL P
ARTI
ESCO
UNCI
L OF E
UROP
EEX
ECUT
IVE P
OWER
DIPL
OMAT
IC SE
RVIC
ECO
UNCI
L OF E
UROP
E


LEGI
SLAT
IVE P
OWER
JUDI
CIAL
POW
ERPO
LITI
CAL P
ARTI
ESCO
UNCI
L OF E
UROP
EEX
ECUT
IVE P
OWER
DIPL
OMAT
IC SE
RVIC
E
Page 101
CONCLUSIONS
Legislative power
Legislative power – summary table 2016
COUNTRIES REACHING THE 40%
TARGET IN 2016
AVERAGE % WOMEN IN 2016
EVOLUTION2005-2016
Lower/single houses 2 (4%) 25.6% +
Upper houses 023.9% (elected) +
35.8% (appointed) +
Regional parliaments 3 (18%) 25.6% +
As the above table recapitulates, only a few countries met the Recommendation’s minimum target of 40% representatives of each sex in any of their legislative bodies in the third monitoring cycle to review its implementation. None of the upper houses of parliament for which data were available reached the target, only two lower/singles houses and three of the regional parliaments did. The average proportion of women stayed at around one quarter, and was strikingly consistent across the legislative assemblies surveyed.
Both the lower/single houses of parliament and the regional parliaments counted on average 25.6% women. The appointed senators counted the highest number of women within their ranks (35.8%), which compensated for the relatively lower proportion of elected senators (23.9%). These findings speak to three main scholarly concerns. Firstly, the similarity of the averages in the various legislative bodies contradicts the idea that women would be more easily directed – or would more easily find their way - to less powerful institutions such as the upper houses.

Page 102 Balanced participation of women and men in decision-making - Analytical report - 2016
Secondly, the finding that, overall, women were not particularly better represented in regional parliaments, which tend to be newer institutions compared to national parliaments, contradicts the idea that women predominantly find inroads in new institutions. Changing older institutions through establishing a gender balance therefore seems neither more nor less difficult than changing new institutions. Thirdly, the relatively highest proportion of women among the appointed senators confirms the theory that the more centralised or top-down the inroad for women is into politics, the more women we find.
The analysis also shows that between one fifth and one third of countries fell within the 30-39.9% category: one third of the lower/single house and about 23% of the regional parliaments. But only 15% of the upper houses fell within the 30% and above category. Countries in this category may reach the 40% target in the short term. There were, however, a substantive amount of countries that were far from the 40% minimum target and for which that goal will not be reached in the near future without strong incentives, policy and legislative measures. No less than 30% of the lower/single houses of parliament, 46% of the upper houses and 41% of the regional parliaments counted less than 20% women representatives. Furthermore, these countries already had this strong male over-representation a decade ago. Achieving change towards gender balance in these countries seems particularly difficult. Overall, the proportion of countries that were situated in the +30 category remained rather stable between the 2005 and 2016 data and a significant number of countries remained in the lower than 20% category (30%), although their proportion decreased (from 46% in the lower than 20% category in 2005, to 30% in 2016). This points to a slight improvement for some indicators but also to overall stagnation.
These signs of stagnation and slightly positive trend should however be read together with the country level evolution showing sharp increases or decreases in certain countries. This warrants against the often-voiced idea that the evolution towards gender balance is linear: setbacks are possible for a wide variety of reasons related to country- and party-specific contexts and a positive evolution is not a natural given.
When turning to internal decision-making positions within the legislative power, 21.7% of the countries studied had a woman president of the single/lower house of parliament and 50% had a deputy speaker of the single/lower house. The average percentage of women presidents of parliamentary committees in the lower/single house was 25.6%; while only 17% of the countries reached the minimum target of 40% women parliamentary committee presidents. While this is still a serious imbalance, it shows that on average the proportion of women members and parliamentary committee presidents is similar, which is a good sign. Although it is not the case that all countries with high proportions of women in the single/lower houses have more women presidents, deputy speakers or presidents of parliamentary committees, the data collected has shown that higher numbers of women representatives increase their ability to reach these positions of power.

LEGI
SLAT
IVE P
OWER
JUDI
CIAL
POW
ERPO
LITI
CAL P
ARTI
ESCO
UNCI
L OF E
UROP
EEX
ECUT
IVE P
OWER
DIPL
OMAT
IC SE
RVIC
E
Conclusions Page 103
Executive power
Executive power positions – summary figure 2016
35%
30%
25%
20%
15%
10%
5%
0%
9.5%
0% 0% 0% 0%
14.3%12.2%
5.8%
9.0%6.2% 7.1%
27.4%
22.4%
19.4%
11.0%13.4%
26%
31.4%
Average % of women in 2016 % of countries reaching the 40% target in 2016
Heads of
state elected
by citiz
ens
Heads of s
tate
appointed by
parliament
Heads of
national
government
Deputy prime
ministers/
vice
presidents
Senior and
junior minist
ers
Heads of
regional
governments
Regional
governments
Mayors
Municipality
council
lors
The overall conclusion of the analysis about the executive power, especially when it concerns heads of states, heads of governments and mayors, is that positions at the very top of the political hierarchy at the executive level in Europe were still almost exclusively male dominated in 2016. For all of the executive functions, less than 11% of the respondent countries met the 40% minimum target. The summary figure concerning executive power positions shows that the average proportion of women heads of state or in an executive body did not exceed 20%: of the countries studied, 9.5% of the heads of states were women when elected and 14.3% when appointed by parliaments. Women represented 12.2% of the heads of national governments; 19.4% of heads of regional governments; 31.4% of members of regional governments; 13.5% of the mayors and 26% of local councillors.
Heads of national governments and members of regional governments showed a positive evolution when comparing 2005 and 2016; while the other functions featured very modest progress.
The situation appears especially worrying for the proportion of women mayors: in 2016 their average percentage was extremely low (13.4% on average) and none of the countries reached the minimum target of 40%. Furthermore, in 2016 only 2.5% of the countries had over 30% of women mayors and no less than 77% of the countries had less than 20% women mayors. Taken together, these findings highlight the top level of the local executive as very resistant to change. An explanation may again be found in the centralisation hypothesis. Strategies for reaching a gender balance in political office are said to work better when in the hands of few (at the national level) than in the hands of many (at the local level). The latter increases the opportunities for political dynamics and strategies that favour those who are already in power (i.e. predominantly men), which also reduces the impact of the efforts of national party leaders to strive for greater gender balance.

Page 104 Balanced participation of women and men in decision-making - Analytical report - 2016
The averages of women’s presence in executive functions rose with the number of executive functions in the countries, but seemed to be to some extend inversely proportional to the level of power, except for the local level (mayors) and notwithstanding large variations in the power attributed to the different levels between member states. 27.4% of the deputy prime ministers/vice presidents and 22.4% of the senior and junior ministers of the national governments were women, and 31.4% of the members of regional governments were women. Regional executives also stand out positively in terms of gender balance when looking at other findings. 43% of regional governments were situated within the 30-39.9% women range, whereas this was only the case in 20% of the countries regarding senior and junior ministers. Furthermore, one fifth (21.4%) of the regional governments still had less than 20% women, whereas this was the case in almost half (49%) of the countries when it comes to senior and junior ministers. The analysis also showed that almost 26% of local councils (nine countries) fell within the 30-39.9% category but 23% of local councils counted less than 20% women representatives. In addition, the data reveal that the level of local councils was particularly unstable.
In conclusion, while the local and national executives were (highly) problematic, the regional governments stood out as more promising (even though there was no gender balance there either). It should be further studied to find out whether these findings can be interpreted as suggesting that there are more women in regional governments than in national governments because the first are less powerful.
The average proportion of women ministers in national governments (22.4%) was not too far from the proportion of women in the national lower/single houses (25.6%) and hence do not point to an extra discriminatory barrier for women when moving upwards on the political ladder to national executive positions. What is striking, however, is that there were proportionally more women on average in regional governments (31.4%) than in regional parliaments (25.6%). More research is needed to understand these patterns.
Impact of electoral systems, gender quotas or parity systems and gender-sensitive regulations of political parties
One of the measures suggested in Recommendation Rec(2003)3 calls on member states to reform their electoral systems in order to reach a gender balanced representation. Furthering women’s participation in political decision-making can be done by increasing the proportionality of the electoral system, changing the ballot structure (open or closed), including rules on gender equality in the laws on public funding of political parties, and through the implementation of gender quotas legislation or parity systems. The Recommendation also strongly calls upon political parties to take different types of internal measures to reach a gender balance. Both member states and political parties are encouraged to introduce parity systems or gender quotas. Political parties can also take other steps, such as including gender equality in their regulatory framework, implementing gender quotas for their internal decision-making bodies and providing training for women politicians.
Regarding the effect of electoral systems, findings confirmed the expected result that proportional systems are clearly more favourable for a balanced participation of women and men in political decision-making bodies than

LEGI
SLAT
IVE P
OWER
JUDI
CIAL
POW
ERPO
LITI
CAL P
ARTI
ESCO
UNCI
L OF E
UROP
EEX
ECUT
IVE P
OWER
DIPL
OMAT
IC SE
RVIC
E
Conclusions Page 105
majoritarian electoral systems. In 2016, the highest proportion of women members of the single/lower houses was found in countries using proportional list systems (27.5% women with open lists; 26.6% with closed lists and 27% with other lists). The lowest proportion of women members was found in single majority systems (19.3%). Also as expected, the effect of open or closed lists was not clear-cut. In the case of proportional systems, open lists were slightly more favourable than closed lists (27.5% women compared to 26.6%). In the case of semi-proportional systems, they produced slightly lower level of women (20.9% women compared to 21.1%). Overall, with respect to women’s participation, the proportionality of the electoral system seemed of more importance than the openness of the ballot structure.
Percentage of women in lower/single houses, by gender quota type – summary table 2016
Countries with political party
quotas only
Countries with both quota laws/
parity systems and political party quotas
Countries with quota laws/parity
systems only
Countries without any type of quotas
or parity system
28.8%
26.3% 25.3%23.1%
35%
30%
25%
20%
15%
10%
5%
0%
Aver
age
% w
omen
Note: Information on political party quotas was collected for the five parties with the highest seat share in the lower/single house elections.
Gender quotas or parity systems are considered to be a direct tool to increase women’s participation and a fast track to achieve gender balance. As shown in the above figure, countries that applied both gender quota laws and political party voluntary quotas had only slightly more women representatives in the lower/single houses than countries with none of these measures (26.3% and 23.1%, respectively). A second surprising finding is that countries that only had political party quotas performed better than countries with quota laws or parity systems, even when those had voluntary political party quotas. The first group of countries (with only voluntary political party quotas) counted on average 28.8% women in the lower/single houses; while the group of countries with gender quota laws or parity systems reached only 25.3% of women and countries with both types, 26.3%.

Page 106 Balanced participation of women and men in decision-making - Analytical report - 2016
These findings can be explained by the ‘acceptable minimum’ hypothesis: when different political parties have to agree upon gender quotas (i.e. in the case of establishing gender quota laws) their design will be adapted to the least willing party. This decreases the efforts of the most willing party, which put their quota target higher only when they can design the measure as they wish, as in the case of voluntary political party quotas, and do not experience a downwards pull by gender quota laws that set the target lower than they would.
Why do all gender quota laws or parity systems not produce significantly higher percentages of women legislators? The answer is because only strong quota laws or parity systems work. The analysis has shown a strong correlation between the strength of the quotas (measured in terms of quota percentage, whether they include a stipulation on rank order of women and men, and whether or not they include sanctions, as well as the type of sanction), and the percentage of women elected in national elections. Also for regional parliaments there was a correlation between strong quotas and better performance in terms of gender balance. In sum, this implies that if well designed and strong enough, gender quotas legislation or parity systems are effective tools to establish gender balance in political decision-making.
Countries where party quotas existed, either for national elections or for party decision-making bodies, had on average higher levels of women in lower houses, among party executives and among party members, than countries without such measures. This shows the effectiveness of the quotas or measures in place. Gender equality elements in legal frameworks regarding political parties or in laws on the public funding of political parties however did not seem to automatically lead to better results. Countries that have adopted such rules did not, on average, present significantly higher levels of women in national elected assemblies or political party organisations. Here too, the conclusion is that such measures, in order to be effective, need to be strong enough and be complemented with additional practical measures. Otherwise, such measures risk remaining merely symbolic gestures rather than real mechanisms for change.
Finally, countries that organised training for women candidates had only slightly higher levels of women in national lower houses, among party executives or as party leaders. The fact that training seemed to be less effective than gender quotas for elections or internal party bodies is linked to two reasons. Firstly, training for women constitutes a ‘soft’ measure to address women’s under-representation in politics. It does not systematically address underlying gender biases in recruitment and selection processes; for instance, it does not change the consideration of the party’s selectorates as to what constitutes a ‘good’ candidate, nor do they challenge informal practices that benefit men more than women. In order to tackle these structural barriers caused by informal rules and practices, training and gender awareness campaigns need to target first and foremost the party’s leadership. Secondly, training for women may be less effective than gender quotas in increasing women’s presence in numbers, but it can still be useful to strengthen the position of women at a later stage, i.e. once they are selected as candidates or elected as representatives.

LEGI
SLAT
IVE P
OWER
JUDI
CIAL
POW
ERPO
LITI
CAL P
ARTI
ESCO
UNCI
L OF E
UROP
EEX
ECUT
IVE P
OWER
DIPL
OMAT
IC SE
RVIC
E
Conclusions Page 107
Judicial powerJudicial power – summary figure 2016
Constitutional Courts
High/Supreme Courts
High Councils of the Judiciary
0% 5% 10% 15% 20% 25% 30% 35% 40%
26%
33%
36%
22%
28%
28%
Average % of women in 2016 Responding countries reaching the 40% target in 2016
In 2016, very few of the courts observed reached the 40% minimum target set by the Recommendation: 12 (28%) of the High/Supreme Courts, seven (22%) of the Constitutional Courts and 12 of the High Councils of the Judiciary (36%) (see summary figure above). The High/Supreme Courts and High Councils of the Judiciary performed better than the Constitutional Courts as far as gender balance is concerned. The first counted on average 33% women, the second 28% and the latter 26%. High/Supreme Courts witnessed a positive evolution between 2005 and 2016: the majority of countries saw an increase in the percentage of women judges and in 2016 none of the High/Supreme Courts included in the study only had male judges. The percentage of women judges in Constitutional Courts also increased slightly in the majority of countries. Furthermore, 30% of High/Supreme Courts were situated in the 30-39.9% women-judges range – an important signal of potential increase of countries reaching the 40% minimum target – and only 14% had less than 20% women judges. In addition, only 21.8% of the Constitutional Courts were situated within the 30-39.9% women-judges range, which is less than the 28% with less than 20% women judges. Moreover, some Constitutional Courts counted no woman at all.
Judicial power – evolution over time
EVOLUTION2005-2016*
High/Supreme Courts +
Constitutional Courts +/-
High Councils of the Judiciary N/A
*Data regarding High Council of the Judiciary were gathered for the first time in 2016.
These general trends should however be read together with the sometimes significant increases and decreases in the number of women judges at the individual country level. Finally, concerning women judges in High/Supreme Courts, the analyses show no correlation with the appointment method (by head of state, government, high council of the judiciary, or in another way).

Page 108 Balanced participation of women and men in decision-making - Analytical report - 2016
Diplomatic service
Even though the analyses shows a lot of variety among the countries and over time concerning gender balance in the diplomatic service, some general conclusions can be drawn (table hereunder).
Diplomatic service – evolution over time
EVOLUTION2005-2016
Ambassadors extraordinary and plenipotentiary +/-
Envoys and ministers plenipotentiary +
Minister counsellors +/-
General consuls +/-
The proportion of countries where the various functions of the diplomatic service reached the 40% minimum target was low, especially for the highest functions and in 2016, some countries had no women diplomats in some of these functions. Of the diplomatic functions included in the study, minister counsellors (the lowest grade analysed) counted on average the most women diplomats (30.5%) (summary figure hereunder), the highest proportion of countries in the +40% (31%) and the 30-39.9% women range; and the lowest in the minus 20% category (34%). Also, the function of envoys and ministers plenipotentiary performed relatively well, with an average of 27.3% women, with a significant progress compared to 2005 (19.9%). However, regarding this function, only 8.3% of countries were reaching 40% and 42% had less than 20% women envoys and ministers plenipotentiary.
Diplomatic service – summary figure 2016
General consuls
Minister counsellors
Envoys and ministers
plenipotentiary
Ambassadors extraordinary and
plenipotentiary
0% 5% 10% 15% 20% 25% 30% 35%
25.9%
23.0%
30.5%
31.0%
27.3%
8.3%
13.0%
7.0%
Average % of women in 2016 Responding countries reaching the 40% target in 2016

LEGI
SLAT
IVE P
OWER
JUDI
CIAL
POW
ERPO
LITI
CAL P
ARTI
ESCO
UNCI
L OF E
UROP
EEX
ECUT
IVE P
OWER
DIPL
OMAT
IC SE
RVIC
E
Conclusions Page 109
The average low proportion of women ambassadors (13%), together with the data regarding mayors and heads of state and government were among the poorest performance indicators in terms of gender balance in the 2016 monitoring round. Furthermore, the analysis shows the same pattern for general consuls, with very few countries in the 30-39.9% range - where one may expect that in the near future at least some countries will reach the 40% minimum target; and many more countries in the less than 20% range: 9% countries with 30-39.9% and 24.7% with less than 20% of women ambassadors. The diplomatic service therefore remained male dominated, especially regarding its highest functions.
Council of EuropeCouncil of Europe – summary table 2016
COUNTRIES DELEGATIONS REACHING THE MINIMUM 40%
TARGET IN 2016
AVERAGE % WOMEN
IN 2016
EVOLUTION2005-2016
Parliamentary Assembly 21 (45.7%) 35.7% +
Chamber of Local Authorities
Members 22 (46.8%) 43% +
Substitutes 21 (55.3%)
Chamber of Regions
Members 22 (58%) 44.8% +
Substitutes 24 (52.2%)
European Court of Human Rights - 34.8% +
The results regarding gender balance in the Council of Europe bodies show positive developments (above summary table). The Chamber of Local Authorities and the Chamber of Regions had on average 43% and 44.8% of women respectively. Hence, both reached the minimum target of 40%. At the individual country level, 46.8% of the member states reached the 40% minimum target for the members of the Chamber of Local Authorities and 58% reached the minimum target for the members of the Chamber of Regions. Both bodies also showed important improvements compared to 2005.
The average percentage of women in the Parliamentary Assembly, on the other hand, remained slightly below the 40% threshold (35.7%). Almost half of the countries reached the 40% minimum target in 2016. With a small effort by individual member states, this average percentage could, in the short term, reach the 40% minimum target.
As for the European Court of Human Rights, a small positive improvement could be noticed in 2016 compared to 2005. In 2016, out of the 46 judges in office at the European Court of Human Rights at the time of reporting,8 16 were women and 30 were men, bringing the percentage of women judges to 34.8%. While the presidency of the Court remained male, parity was reached and even exceeded in 2016 for vice-presidents, section presidents and section vice-presidents.
8. One post was vacant at the time of reporting.


LEGI
SLAT
IVE P
OWER
JUDI
CIAL
POW
ERPO
LITI
CAL P
ARTI
ESCO
UNCI
L OF E
UROP
EEX
ECUT
IVE P
OWER
DIPL
OMAT
IC SE
RVIC
E
Page 111
RECOMMENDATIONS FROM THE THIRD ROUND OF MONITORING
R ecommendation Rec(2003)3 on balanced participation of women and men in political and public decision-making was adopted nearly one and a half decades ago. It may be time to ‘renew the vows’. While overall positive evolu-
tions can be discerned when comparing the levels of participation of women and men in political and public decision-making in 2005 and in 2016, many countries also feature stability at a level below the 40% minimum standard, as well as sharp decreases, which sometimes have led to the complete absence of women in some political and public decision-making arenas. Regression the level of representation of women in political and public decision-making is a real threat. The commitment towards the balanced participation of women and men in political and public deci-sion-making bodies should hence be maintained and further strengthened.
However, trends which indicate progress and sharp increases in some countries or areas – including at a significant level – prove that targets can be achieved. Given the wide variations in women’s and men’s presence in decision-making bodies across Europe and the different national contexts, the Recommendation leaves it to the member states to set targets linked to a time scale with a view to reaching balanced participation of women and men in political and public decision-making (paragraph VI of the Recommendation). This strategy acknowledges and takes into account institutional, political and cultural specificities, as well as levels of political will. The 2016 monitoring round could be used by member states to identify the problematic areas (and decide upon the targets and the time frame for meeting

Page 112 Balanced participation of women and men in decision-making - Analytical report - 2016
them), and the areas where the 40% minimum target is closer to be reached (and put in place relevant measures that could contribute to reaching the target).
In light of paragraph VI of the Recommendation, member states could adopt a double approach when setting their targets and timeframe to meet the 40% minimum target:
1. A problem-driven approach, focusing on the most problematic areas to achieve gender balanced participation in political and public decision-making in their country.
2. An opportunity-driven approach, for those areas where progress has been made and an ‘extra and sustained effort’ will contribute to reach the 40% minimum target set by the Recommendation.
The analyses show that in many countries and sectors, the level of women’s participation was within the 30-39.9% range. Therefore, some targeted measures could make a difference to reach the 40% minimum threshold.
For both the problem-driven and opportunity-driven strategies, strict gender quota laws or parity systems and party quotas could be considered.
As stipulated in paragraph 3 of the Appendix to the Recommendation, which lists legislative and administrative measures concerning parity thresholds for candidates in elections, member states should consider making gender quota laws more strict, for instance by increasing the quota percentage, imposing rank order rules and/or introducing/strengthening the sanctions. In countries where gender quotas have generated the most effective results, the minimum level of the target for candidates of each sex on electoral lists was set high (50%-50%), rules on rank order were adopted, and strict sanctions for non-compliance were in place. Another option would be to argue in favour of the (re-)introduction of strong political party quotas (even in countries where gender quota laws or parity systems exist), in order to create a competition dynamic among political parties.
In majoritarian systems the switch to proportional representation may also be considered as a strategy. Initiatives to include gender equality principles in legal frameworks for political parties and in laws on public funding of political parties should be supported, as they show the willingness of political parties and governments to tackle the unequal representation of women and men in politics. At the same time, when such commitments are made, care should be taken to ensure that these provisions do not remain ‘empty vessels’. In order for such measures to be effective, they need to be supported by an active commitment to bring more women to the party and – more importantly – by a willingness to reflect on the existence of gender biases in the functioning of recruitment and selection practices within political parties. One recommendation would be to not only organise training sessions for women candidates, but also for party leaders, party executives and party’s bodies responsible for selecting candidates for elections (selectorates). Such training sessions would not only focus on ways to recruit women candidates, but also on identifying, tracking and amending existing gender stereotypes and biases in how parties recruit, select and support candidates, and in the practices and criteria that drive the selection of men and women candidates. In order to

LEGI
SLAT
IVE P
OWER
JUDI
CIAL
POW
ERPO
LITI
CAL P
ARTI
ESCO
UNCI
L OF E
UROP
EEX
ECUT
IVE P
OWER
DIPL
OMAT
IC SE
RVIC
E
Recommendationsfrom the third round of monitoring Page 113
support their attempts to reflect on their recruitment and selection processes, political parties could consider relying on internal or external gender equality experts.
Arguably, both types of strategies (problem-driven and opportunity-driven) require not only different measures, but also a different discourse. For the first strategy, a sense of emergency needs to be generated; while the second strategy rather points at the good progress made and encourages the continuation of efforts.
Finally, it is important to emphasise that achieving a gender balance in political and public decision-making also depends on the adoption of general gender equality policies in all fields, including economic independence and empowerment, education, media, addressing gender stereotypes and combating violence against women to mention a few. A gender balance in decision making cannot be reached if other areas of public and private life remain fundamentally unbalanced.


LEGI
SLAT
IVE P
OWER
JUDI
CIAL
POW
ERPO
LITI
CAL P
ARTI
ESCO
UNCI
L OF E
UROP
EEX
ECUT
IVE P
OWER
DIPL
OMAT
IC SE
RVIC
E
Page 115
APPENDIX
Recommendation Rec(2003)3 of the Committee of Ministers of the Council of Europe to member states on balanced participation of women and men in political and public decision-making
(Adopted by the Committee of Ministers on 12 March 2003 at the 831st meeting of the Ministers’ Deputies)
The Committee of Ministers, under the terms of Article 15.b of the Statute of the Council of Europe,
Bearing in mind that women make up more than half of the population and the electorate in its member states, but continue to be seriously under-represented in political and public decision-making in a large part of its member states;
Bearing in mind that, in spite of the existence of de jure equality, the distribution of power, responsibilities and access to economic, social and cultural resources between women and men is still very unequal due to the persistence of prevailing traditional gender roles;
Mindful that the functioning of electoral systems and political institutions, including political parties, may hamper women’s participation in political and public life;
Considering that balanced participation of women and men in political and public decision-making is a matter of the full enjoyment of human rights, of social justice and a necessary condition for the better functioning of a democratic society;
Considering that the realisation of balanced participation of women and men in political and public decision-making would lead to better and more efficient policy making through the redefinition of political priorities and the placing of new issues on the political agenda as well as to the improvement of quality of life for all;
Considering that balanced participation of women and men in political and public decision-making is needed for the development and construction of a Europe based on equality, social cohesion, solidarity and respect for human rights;
Recalling the declaration adopted at the 2nd Summit of the Council of Europe (October 1997) at which the heads of state and government of the Council of Europe stressed “the importance of a more balanced representation of men and women in all sectors of society, including political life”, and called for “continued

Page 116 Balanced participation of women and men in decision-making - Analytical report - 2016
progress with a view to achieving effective equality of opportunities between women and men”;
Bearing in mind the Convention for the Protection of Human Rights and Fundamental Freedoms (1950) and its Protocols;
Bearing in mind the European Social Charter (1961), the revised European Social Charter (1996) and the Additional Protocol to the European Social Charter providing for a System of Collective Complaints (1995);
Bearing in mind the texts adopted at the European Ministerial Conference on Human Rights held in Rome in 2000;
Bearing in mind the following Recommendations of the Committee of Ministers to member states of the Council of Europe: Recommendation No. R(85)2 on legal protection against sex discrimination; Recommendation No. R(96)5 on reconciling work and family life and Recommendation No. R(98)14 on gender mainstreaming;
Bearing in mind the following texts adopted by the Parliamentary Assembly: Recommendation 1229 (1994) on equality of rights between women and men; Recommendation 1269 (1995) on achieving real progress in women’s rights as from 1995 and Recommendation 1413 (1999) on equal representation in political life;
Bearing in mind the United Nations Universal Declaration of Human Rights and the International Covenant on Civil and Political Rights;
Recalling the United Nations Convention on the Elimination of all forms of Discrimination Against Women (CEDAW, 1979), especially its Articles 7 and 8;
Recalling also the commitments in the Beijing Platform for Action as well as in the Agreed Conclusions of the Special Session of the UN General Assembly in 2000 (Beijing +5);
Considering that democracy can no longer afford to ignore the competence, skills and creativity of women but must become gender sensitive and include women with different backgrounds and of different age groups in political and public decision-making at all levels;
Mindful of the high priority the Council of Europe gives to the promotion of democracy and human rights,
Recommends that the governments of member states:
I. commit themselves to promote balanced representation of women and men by recognising publicly that the equal sharing of decision-making power between women and men of different background and ages strengthens and enriches democracy;
II. protect and promote the equal civil and political rights of women and men, including running for office and freedom of association;
III. ensure that women and men can exercise their individual voting rights and, to this end, take all the necessary measures to eliminate the practice of family voting;

LEGI
SLAT
IVE P
OWER
JUDI
CIAL
POW
ERPO
LITI
CAL P
ARTI
ESCO
UNCI
L OF E
UROP
EEX
ECUT
IVE P
OWER
DIPL
OMAT
IC SE
RVIC
E
Appendix Page 117
IV. review their legislation and practice, with the aim of ensuring that the strategies and measures described in this recommendation are applied and implemented;
V. promote and encourage special measures to stimulate and support women’s will to participate in political and public decision-making;
VI. consider setting targets linked to a time scale with a view to reaching balanced participation of women and men in political and public decision-making;
VII. ensure that this recommendation is brought to the attention of all relevant political institutions and to public and private bodies, in particular national parliaments, local and regional authorities, political parties, civil service, public and semi-public organisations, enterprises, trade unions, employers’ organisations and non-governmental organisations;
VIII. monitor and evaluate progress in achieving balanced participation of women and men in political and public life, and report regularly to the Committee of Ministers on the measures taken and progress made in this field.
Appendix to Recommendation Rec(2003)3
For the purpose of this recommendation, balanced participation of women and men is taken to mean that the representation of either women or men in any decision-making body in political or public life should not fall below 40%.
On this basis, the governments of member states are invited to consider the following measures:
A. Legislative and administrative measures
Member states should:
1. consider possible constitutional and/or legislative changes, including positive action measures, which would facilitate a more balanced participation of women and men in political and public decision-making;
2. adopt administrative measures so that official language reflects a balanced sharing of power between women and men;
3. consider adopting legislative reforms to introduce parity thresholds for candidates in elections at local, regional, national and supra-national levels. Where proportional lists exist, consider the introduction of zipper systems;
4. consider action through the public funding of political parties in order to encourage them to promote gender equality;
5. where electoral systems are shown to have a negative impact on the political representation of women in elected bodies, adjust or reform those systems to promote gender-balanced representation;

Page 118 Balanced participation of women and men in decision-making - Analytical report - 2016
6. consider adopting appropriate legislative measures aimed at restricting the concurrent holding of several elected political offices simultaneously;
7. adopt appropriate legislation and/or administrative measures to improve the working conditions of elected representatives at the local, regional, national and supra-national levels to ensure more democratic access to elected bodies;
8. adopt appropriate legislative and/or administrative measures to support elected representatives in the reconciliation of their family and public responsibilities and, in particular, encourage parliaments and local and regional authorities to ensure that their timetables and working methods enable elected representatives of both sexes to reconcile their work and family life;
9. consider adopting appropriate legislative and/or administrative measures to ensure that there is gender-balanced representation in all appointments made by a minister or government to public committees;
10. ensure that there is a gender-balanced representation in posts or functions whose holders are nominated by government and other public authorities;
11. ensure that the selection, recruitment and appointment processes for leading positions in public decision-making are gender sensitive and transparent;
12. make the public administration exemplary both in terms of a gender-balanced distribution of decision-making positions and in equal career development for women and men;
13. consider adopting appropriate legislative and/or administrative measures to ensure that there is gender-balanced representation in all national delegations to international organisations and fora;
14. take due account of gender balance when appointing representatives to international mediation and negotiating committees, particularly in the peace process or the settlement of conflicts;
15. consider taking legislative and/or administrative measures aiming at encouraging and supporting employers to allow those participating in political and public decision-making to have the right to take time off from their employment without being penalised;
16. set up, where necessary, support and strengthen the work of the national equality machinery in bringing about balanced participation in political and public life;
17. encourage parliaments at all levels to set up parliamentary committees or delegations for women’s rights and equal opportunities and to implement gender mainstreaming in all their work;

LEGI
SLAT
IVE P
OWER
JUDI
CIAL
POW
ERPO
LITI
CAL P
ARTI
ESCO
UNCI
L OF E
UROP
EEX
ECUT
IVE P
OWER
DIPL
OMAT
IC SE
RVIC
E
Appendix Page 119
B. Supportive measures
Member states should:
18. support, by all appropriate measures, programmes aimed at stimulating a gender balance in political life and public decision-making initiated by women’s organisations and all organisations working for gender equality;
19. consider the setting up of a data bank of women willing to serve in political and public decision-making positions;
20. support and develop women’s political action by providing the opportunity for women elected representatives to network at the local, regional, national and international levels;
21. develop and support mentoring/work-shadowing programmes, confidence building, leadership and media training for women considering entering political and public decision-making;
22. encourage training for women candidates and elected representatives in the use of information and communication technologies;
23. incorporate into school curricula education and training activities aimed at sensitising young people about gender equality and preparing them for democratic citizenship;
24. promote the participation of young people, especially young women, in associations to enable them to acquire experience, knowledge and capacities which are transferable to the field of institutional, and especially political, participation;
25. encourage youth organisations to ensure a balanced participation of women and men in their decision-making structures;
26. encourage greater involvement of ethnic and cultural minorities, and especially women from these minorities, in decision making at all levels;
27. inform political parties of the different strategies used in the various countries to promote the balanced participation of women and men in elected assemblies; encourage them to implement one or more of these strategies and to promote balanced participation of women and men in positions of decision making within the party structures;
28. support programmes initiated by the social partners (employers’ and workers’ organisations) to promote balanced participation of women and men in positions of responsibility and decision making, within their own ranks and in the context of collective bargaining;
29. encourage enterprises and associations to ensure balanced representation of women and men in their decision-making bodies, in particular those subsidised for providing public services or implementing public policies;

Page 120 Balanced participation of women and men in decision-making - Analytical report - 2016
30. promote campaigns aimed at the general public in order to raise its awareness of the importance of gender-balanced representation in political and public decision-making as a prerequisite for genuine democracy;
31. promote campaigns aimed at encouraging the sharing of responsibilities between women and men in the private sphere;
32. promote campaigns aimed at specific groups, in particular politicians, social partners and those who recruit and nominate political and public decision-makers, in order to raise their awareness of the importance of gender-balanced representation in political and public decision-making;
33. organise interactive seminars on gender equality for key people in society, such as leaders and top officials, to make them aware of the importance of the balanced participation of women and men in all levels of decision making;
34. support non-governmental organisations and research institutes that conduct studies on women’s participation in and impact on decision-making and the decision-making environment;
35. carry out research on the distribution of votes according to opinion polls in order to determine the voting patterns of women and men;
36. promote research on the obstacles which prevent women’s access to political and public decision-making at the different levels and publish the results;
37. promote research on women’s participation in social and voluntary sector decision-making;
38. promote gender-sensitive research on the roles, functions, status and working conditions of elected representatives at all levels;
39. promote balanced participation in decision-making positions in the media, including management, programming, education, training, research and regulatory bodies;
40. support training and awareness-raising for students of journalism and media professionals on questions linked to gender equality and how to avoid sexist stereotypes and sexism;
41. encourage media professionals to ensure that women and men candidates and elected representatives receive equal visibility in the media, especially during election periods.
C. Monitoring
Member states should:
42. consider establishing independent bodies, such as a parity observatory or a special independent mediation body, with a view to following governmental policy in the field of balanced participation of women and men in political and public life, or entrust national equality machineries with this task;

LEGI
SLAT
IVE P
OWER
JUDI
CIAL
POW
ERPO
LITI
CAL P
ARTI
ESCO
UNCI
L OF E
UROP
EEX
ECUT
IVE P
OWER
DIPL
OMAT
IC SE
RVIC
E
Appendix Page 121
43. consider setting up and applying indicators for the monitoring and evaluation of the balanced participation of women and men in decision making on the basis of internationally comparable gender segregated data;
44. consider adopting the following indicators for measuring progress in the field of political and public decision-making:
i. the percentage of women and men elected representatives in parliaments (supra-national/national/federal/regional) and local assemblies according to political party;
ii. the percentage of women and men elected representatives in parliaments (supra-national/national) compared to the number of candidates according to political party (the success rate);
iii. the percentage of women and men in national delegations to nominated assemblies such as the Council of Europe’s Parliamentary Assembly and Congress of Local and Regional Authorities of Europe and to international organisations and fora;
iv. the percentage of women and men in national, federal and regional governments;
v. the number of women and men senior/junior ministers in the different fields of action (portfolios/ministries) of the national, federal and regional governments of the member states;
vi. the percentage of the highest ranking women and men civil servants and their distribution in different fields of action;
vii. the percentage of women and men judges in the supreme court;
viii. the percentage of women and men in bodies appointed by the government;
ix. the percentage of women and men in the decision-making bodies of political parties at national level;
x. the percentage of women and men members of employer, labour and professional organisations and the percentage of women and men in their decision-making bodies at national level;
45. submit, every other year, reports to their national parliaments on the measures taken and progress made according to the indicators listed above;
46. publish, every other year, reports on the measures taken and progress made in women’s involvement in decision-making and disseminate these reports widely;
47. publish and make readily accessible, statistics on candidates for political office and on elected representatives containing information on sex, age, occupation, occupational sector (private/public), education;
48. encourage the regular analysis of the visibility and portrayal of women and men in national news and current affairs programmes, especially during election campaigns.


LEGI
SLAT
IVE P
OWER
JUDI
CIAL
POW
ERPO
LITI
CAL P
ARTI
ESCO
UNCI
L OF E
UROP
EEX
ECUT
IVE P
OWER
DIPL
OMAT
IC SE
RVIC
E
Page 123
BIBLIOGRAPHY
Celis, Karen and Woodward, Alison. (2003), “Flanders: Do It Yourself and Do It Better? Regional Parliaments as Sites for Democratic Renewal and Gendered Representation”. In: José Magone (ed.) Regional Institutions and Governance in the European Union. Westport: Praeger, pp. 173-191.
Chappell, Louise. (2002), “Gendering Government: Feminist Engagement with the State in Australia and Canada”, University of British Columbia Press, Vancouver.
Council of Europe (2003), Recommendation Rec(2003)3 of the Committee of Ministers to member states on balanced participation of women and men in political and public decision-making, Strasbourg, Council of Europe, available on: https://search.coe.int/cm/Pages/result_details.aspx?ObjectID=09000016805e0848, accessed on 07.03.2017.
Council of Europe (2005), “Sex-disaggregated statistics on the participation of women and men in political and public decision-making in Council of Europe member states - Situation as at 1 September 2005”, Strasbourg, Council of Europe, available on: https://rm.coe.int/1680591671, accessed on 15.05.2017.
Council of Europe (2008), “Sex-disaggregated statistics on the participation of women and men in political and public decision-making in Council of Europe member states - Situation as at 1 September 2008”, Strasbourg, Council of Europe, available on: https://rm.coe.int/1680591674, accessed on 15.05.2017.
Council of Europe (2010), “Parity democracy - A far cry from reality: Comparative study on the results of the first and second rounds of monitoring of Council of Europe Recommendation Rec(2003)3 on balanced participation of women and men in political and public decision-making”, Strasbourg, Council of Europe, available on: https://rm.coe.int/CoERMPublicCommonSearchServices/DisplayDCTMContent?documentId=0900001680591672, accessed on 07.03.2017.
Council of Europe (2017), “Sex-disaggregated statistics on the participation of women and men in political and public decision-making in Council of Europe member states - Situation as at 15 July 2016”, Strasbourg, Council of Europe, available on: https://rm.coe.int/statistical-data-balanced-participation-report/168072ab4b, accessed on 01.07.2017.
Dahlerup, Drude and Leyenaar, Monique eds. (2013), “Breaking Male Dominance in Old Democracies”, Oxford: Oxford University Press.

Page 124 Balanced participation of women and men in decision-making - Analytical report - 2016
Davidson-Schmich, Louise. (2006), “Implementation of Political Party Gender Quotas. Evidence from the German Länder, 1990-2000”, Party Politics 12(2): 211-232.
Erzeel, Silvia and Caluwaerts, Didier (2013), “How legislators think about gender quotas: a cross-national study”, Paper presented at the Third European Conference on Politics and Gender, Barcelona, March 2013.
Hinojosa, Magda (2012), “Selecting Women, Electing Women. Political Representation and Candidate Selection in Latin America”, Philadelphia: Temple University Press.
Kittilson, Miki C. (2006), “Challenging Parties, Changing Parliaments. Women and Elected Office in Contemporary Western Europe”, Columbus: Ohio State University Press.
Krook, Mona Lena. (2009), “Quotas for Women in Politics: Gender and Candidate Selection Reform Worldwide”, Oxford: Oxford University Press.
Leyenaar, Monique. (2004), “Vrouwvriendelijk Europees Kiessysteem”, In: Petra Meier and Karen Celis (eds.) Vrouwen vertegenwoordigd, Wetstraat gekraakt? Brussels: VUBPress, pp. 49-80.
Lovenduski, Joni and Norris, Pippa eds. (1993), “Gender and Party Politics”, London: Sage.
Matland, Richard E. and Studlar, Donley T. (1996), “The Contagion of Women Candidates in Single-Member Districts and Proportional Representation Electoral Systems”, Journal of Politics 58(3): 707-733.
Meier, Petra. (2008), “A Gender Gap not Closed by Quotas: the Renegotiation of the Public Sphere”, International Feminist Journal of Politics 10(3): 329-347.
Meier, Petra. (2012), “From Laggard to Leader: Explaining the Belgian Gender Quotas and Parity Clause”, West European Politics 35(2): 362-379.
Norris, Pippa. (2004), “Electoral Engineering. Voting rules and political behaviour”, Cambridge: Cambridge University Press.
Vickers, Jill. (2010), “A Two-Way Street: Federalism and Women’s Politics in Canada and the United States”, Publius: The Journal of Federalism 40 (3): 412-435.


The Council of Europe is the continent’s leading human rights organisation. It comprises 47 member states, 28 of which are members of the European Union. All Council of Europe member states have signed up to the European Convention on Human Rights, a treaty designed to protect human rights, democracy and the rule of law. The European Court of Human Rights oversees the implementation of the Convention in the member states.
“Democracy can no longer afford to ignore the competence, skills and creativity of women but must become gender sensitive and include women with different backgrounds and of different age groups in political and public decision-making at all levels.”
Preamble of the Committee of Ministers Recommendation Rec(2003)3 to member states on balanced participation of women and men in political and public decision-making
ENGPR
EMS
1151
17


