International Journal of Applied Engineering Research ISSN 0973-4562 Volume 12, Number 19 (2017) pp. 9176-9194
© Research India Publications. http://www.ripublication.com
9176
Analytical Study of Foundation – Soil – Pipe Interaction
Rafi M. Qasim
Department of Environmental and Pollution Engineering,
Basra Engineering Technical Collage, Southern Technical University, Basra, Iraq.
Abstract
Pipes and pipelines are structural element have important
substantial. Pipes gives various services for example transmit
of fluid. The evaluation of structural behavior more necessary
and more effect .In this paper, a three dimensional finite
element model is achieved by using numerical method to study
the static interaction between soil and pipe when it is path under
statically loaded foundation. The paper studying the influence
of buried depth, embedment ratio, foundation thickness, soil
type, pipe diameter, pipe wall thickness and pipe rigidity on
vertical displacement. In addition, investigation of shear force
and bending moment developed into the pipe. The ANSYS
program is utilized in this study.
Keywords: Foundation, Soil-Pipe-Interaction, Static Loading,
Numerical Modeling.
INTRODUCTION
Pipes and pipelines used to transmit drinkable water or disposal
of wastewater and drainage water are used to transmit oil and
gas or any liquid they are used as means of service in transport
of electric and communication cable. In general, pipes play
very effective and significant role in modern life, especially in
controlling of disaster after flood and seismic hazard. The
behaviour of a buried pipeline will depend very highly on how
its stiffness is compared with the stiffness of the native soil in
which it is to be buried in (1). A pipe must have sufficient
strength and/or stiffness to fulfill its intended use and must be
permanent during the serviceability of life the behavior of
buried pipes is much affected by geotechnical soil properties,
which are shared in the performance of buried pipes.
Evaluation of the behavior and stability of buried pipes are
shown in terms of permissible deflection and buckling
resistance (2) In modeling of pipe-soil interaction soil can be
modeled by an elastic continuum or by winkler model (3).
Modeling of buried pipelines can be carried out as: continuum
finite element modeling for the pipe and using special beam-
type finite elements for the pipe (4).
PROBLEM DEFINITION AND OBJECTIVE
Pipes or Pipelines play a vital role in modern life due to its
ability to convey any liquid between any system. This paper
deals with a problem of pipes buried into soil and pass under
spread foundation especially when the pipe locates under the
center of foundation or footing at shallow depth when the
thickness of superficial soil layer above the pipes can be
considered always small. This search includes numerical
application to study the static interaction between foundation
and pipe due to load transfer by soil layer that covers the pipe.
it is required to investigate:
1. Effect of buried depth and embedment ratio on
vertical displacement.
2. Effect of foundation thickness on vertical
displacement.
3. Effect of static load magnitude on vertical
displacement.
4. Effect of pipe diameter, also wall thickness and pipe
rigidity on vertical displacement.
5. The shear force and bending moment developed into
the pipe.
6. Effect of soil type on vertical displacement.
NUMERICAL MODELING
Finite element continuum method is adopted to represent and
analysis the problem. The ANSYS program is performed to
solve this problem. The pipe are modeled as linear elastic two
nodes beam element with circular section and six degrees of
freedom at each node (three translations and three rotations).
The soil is modeled as an elastic material by using solid
element, which has 8 nodes with three translational degrees of
freedom at each node. The foundation is modeled as an elastic
material by using solid element, which has 8 nodes with three
translational degrees of freedom at each node. Table (1)
reviews the descriptions of circular steel pipe for all case study.
Also table (2) reviews engineering properties of circular steel
pipe. Table (3) reviews the geotechnical data for different clay
soil used in the analysis of the problem. Table (4) shows the
dimension of square spread foundation. Table (5) shows the
concrete properties of foundation. Two different buried depth
0.5m and 1m are used in all case study to infer the static
interaction. The soil domain used to model the problem is
extended to 5 foundation width measured from the center of
foundation to soil boundary on each side and below the
foundation. Fixed boundary conditions applied at the side ends
of the soil domain and the bottom except the top is free. The
connection between the foundation and soil and the connection
between the pipe and soil is considered as perfect bond. The
International Journal of Applied Engineering Research ISSN 0973-4562 Volume 12, Number 19 (2017) pp. 9176-9194
© Research India Publications. http://www.ripublication.com
9177
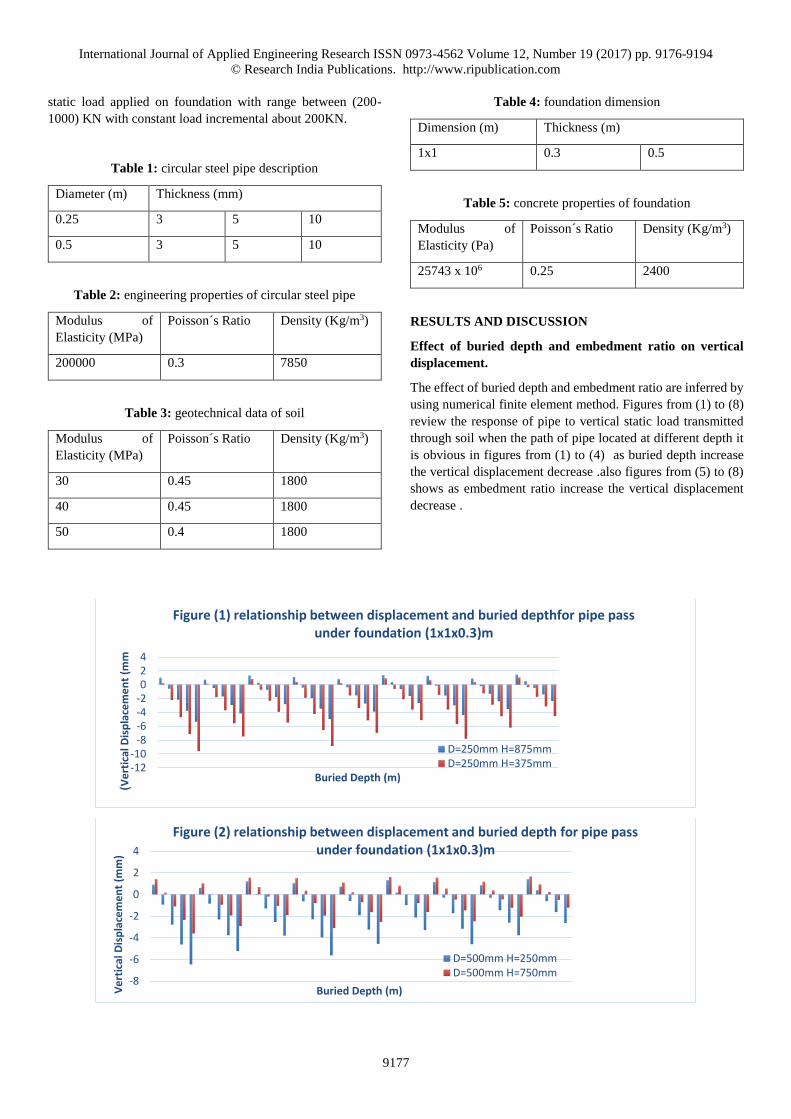
static load applied on foundation with range between (200-
1000) KN with constant load incremental about 200KN.
Table 1: circular steel pipe description
Diameter (m) Thickness (mm)
0.25 3 5 10
0.5 3 5 10
Table 2: engineering properties of circular steel pipe
Modulus of
Elasticity (MPa)
Poisson´s Ratio Density (Kg/m3)
200000 0.3 7850
Table 3: geotechnical data of soil
Modulus of
Elasticity (MPa)
Poisson´s Ratio Density (Kg/m3)
30 0.45 1800
40 0.45 1800
50 0.4 1800
Table 4: foundation dimension
Dimension (m) Thickness (m)
1x1 0.3 0.5
Table 5: concrete properties of foundation
Modulus of
Elasticity (Pa)
Poisson´s Ratio Density (Kg/m3)
25743 x 106 0.25 2400
RESULTS AND DISCUSSION
Effect of buried depth and embedment ratio on vertical
displacement.
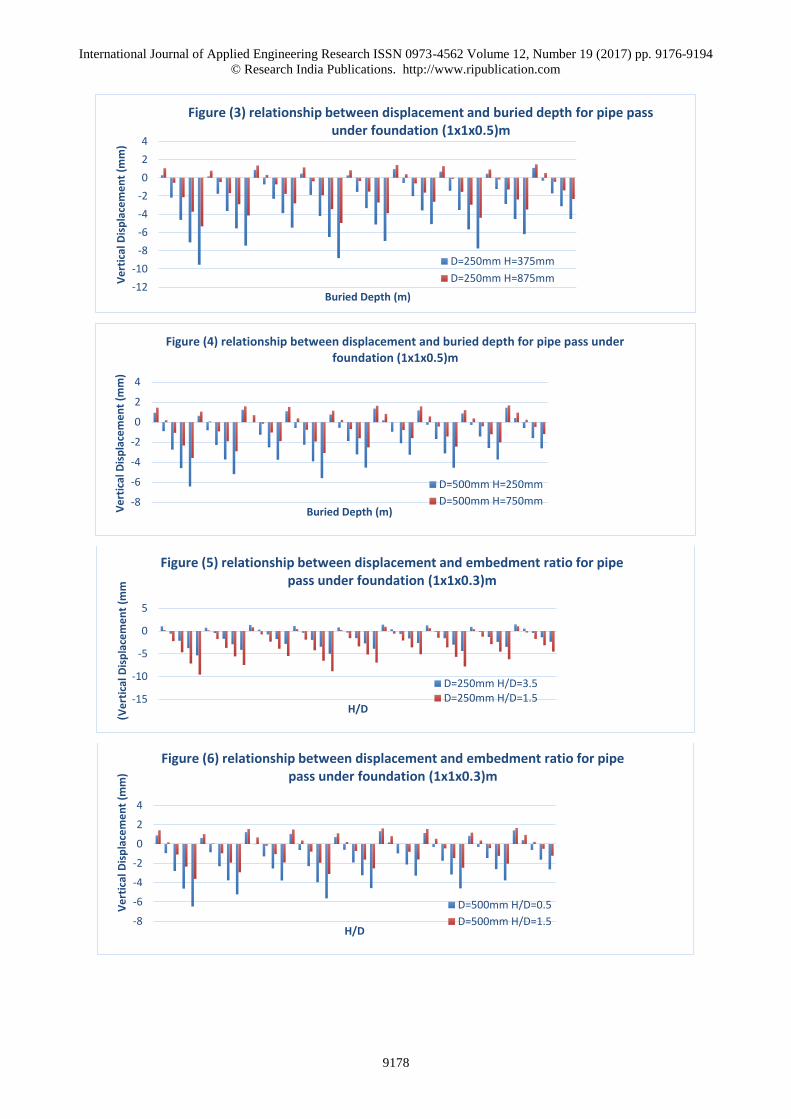
The effect of buried depth and embedment ratio are inferred by
using numerical finite element method. Figures from (1) to (8)
review the response of pipe to vertical static load transmitted
through soil when the path of pipe located at different depth it
is obvious in figures from (1) to (4) as buried depth increase
the vertical displacement decrease .also figures from (5) to (8)
shows as embedment ratio increase the vertical displacement
decrease .
-12-10
-8-6-4-2024
Ve
rtic
al D
isp
lace
me
nt
(mm
)
Buried Depth (m)
Figure (1) relationship between displacement and buried depthfor pipe pass under foundation (1x1x0.3)m
D=250mm H=875mmD=250mm H=375mm
-8
-6
-4
-2
0
2
4
Ve
rtic
al D
isp
lace
me
nt
(mm
)
Buried Depth (m)
Figure (2) relationship between displacement and buried depth for pipe pass under foundation (1x1x0.3)m
D=500mm H=250mmD=500mm H=750mm
International Journal of Applied Engineering Research ISSN 0973-4562 Volume 12, Number 19 (2017) pp. 9176-9194
© Research India Publications. http://www.ripublication.com
9178
-12
-10
-8
-6
-4
-2
0
2
4
Ve
rtic
al D
isp
lace
me
nt
(mm
)
Buried Depth (m)
Figure (3) relationship between displacement and buried depth for pipe pass under foundation (1x1x0.5)m
D=250mm H=375mm
D=250mm H=875mm
-8
-6
-4
-2
0
2
4
Ve
rtic
al D
isp
lace
me
nt
(mm
)
Buried Depth (m)
Figure (4) relationship between displacement and buried depth for pipe pass under foundation (1x1x0.5)m
D=500mm H=250mm
D=500mm H=750mm
-15
-10
-5
0
5
Ve
rtic
al D
isp
lace
me
nt
(mm
)
H/D
Figure (5) relationship between displacement and embedment ratio for pipe pass under foundation (1x1x0.3)m
D=250mm H/D=3.5D=250mm H/D=1.5
-8
-6
-4
-2
0
2
4
Ve
rtic
al D
isp
lace
me
nt
(mm
)
H/D
Figure (6) relationship between displacement and embedment ratio for pipe pass under foundation (1x1x0.3)m
D=500mm H/D=0.5
D=500mm H/D=1.5
International Journal of Applied Engineering Research ISSN 0973-4562 Volume 12, Number 19 (2017) pp. 9176-9194
© Research India Publications. http://www.ripublication.com
9179
This is because the load transmitted by foundation and soil to
pipe dissipation with depth. If the structural capacity of pipe is
greater than the applied load which is combine of four
component (static load , foundation weight , soil weight and
pipe weight ) the pipe displacement will converse it is direction
.also this will appear in first loading condition as shown in
figures from (1) to (8).
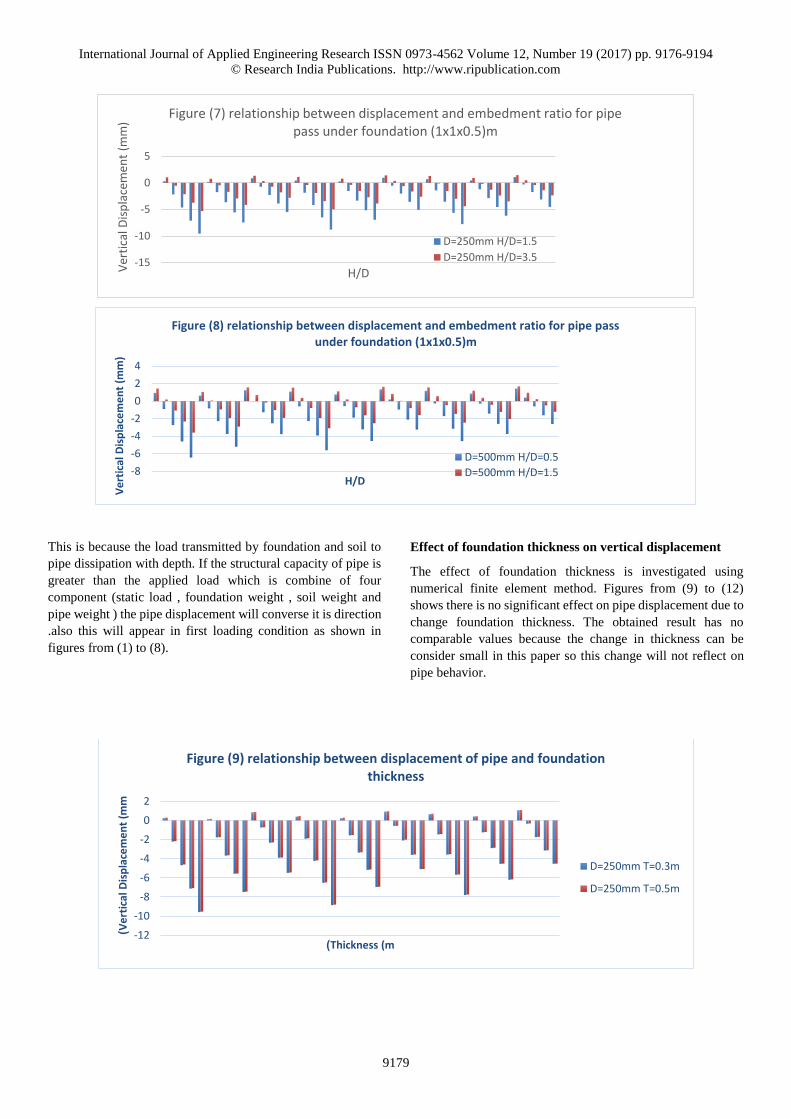
Effect of foundation thickness on vertical displacement
The effect of foundation thickness is investigated using
numerical finite element method. Figures from (9) to (12)
shows there is no significant effect on pipe displacement due to
change foundation thickness. The obtained result has no
comparable values because the change in thickness can be
consider small in this paper so this change will not reflect on
pipe behavior.
-15
-10
-5
0
5
Ver
tica
l Dis
pla
cem
ent
(mm
)
H/D
Figure (7) relationship between displacement and embedment ratio for pipe pass under foundation (1x1x0.5)m
D=250mm H/D=1.5
D=250mm H/D=3.5
-8
-6
-4
-2
0
2
4
Ve
rtic
al D
isp
lace
me
nt
(mm
)
H/D
Figure (8) relationship between displacement and embedment ratio for pipe pass under foundation (1x1x0.5)m
D=500mm H/D=0.5
D=500mm H/D=1.5
-12
-10
-8
-6
-4
-2
0
2
Ve
rtic
al D
isp
lace
me
nt
(mm
)
Thickness (m)
Figure (9) relationship between displacement of pipe and foundation thickness
D=250mm T=0.3m
D=250mm T=0.5m
International Journal of Applied Engineering Research ISSN 0973-4562 Volume 12, Number 19 (2017) pp. 9176-9194
© Research India Publications. http://www.ripublication.com
9180
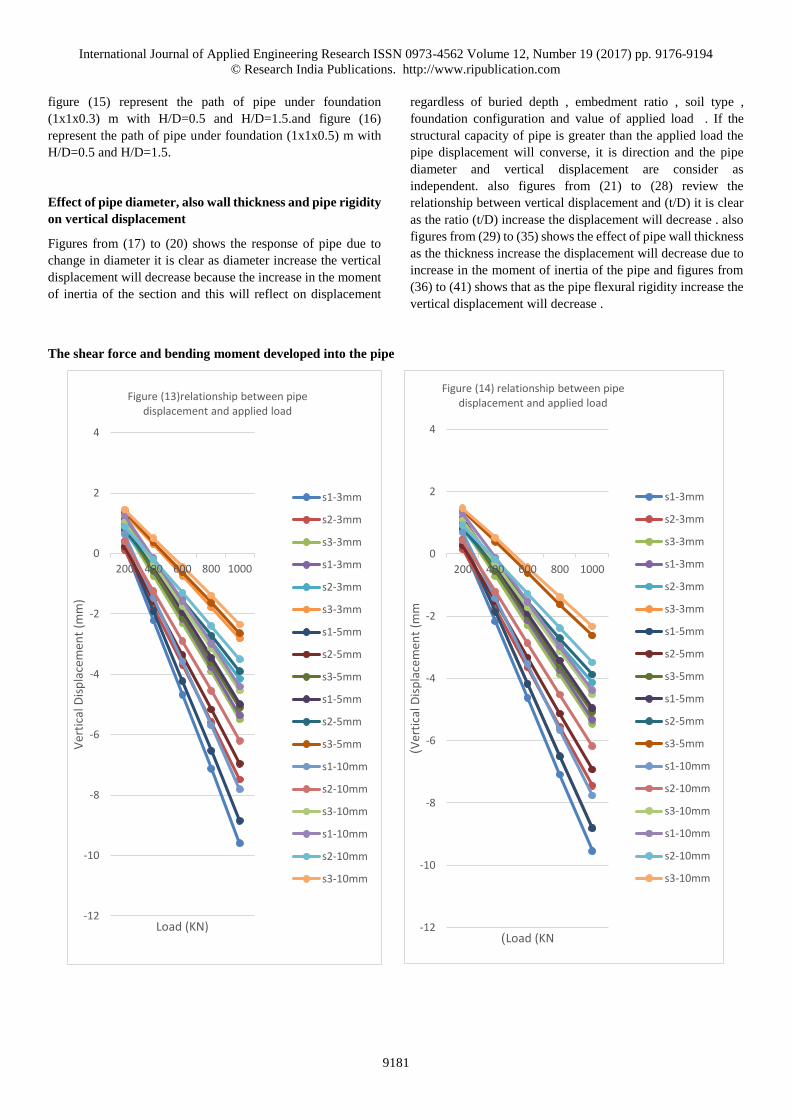
Effect of static load magnitude on vertical displacement
The effect of static load and gradually increase in load
magnitude are investigated. Figures from (13) to (16) shows
that the displacement increase linearly with increasing in load
magnitude regardless of soil type, foundation and pipe
configuration respectively. Note that figure (13) represent the
path of pipe under foundation (1x1x0.3) m with H/D=1.5 and
H/D=3.5. Figure (14) represent the path of pipe under
foundation (1x1x0.5) m with H/D=1.5 and H/D=3.5. Also
-6
-5
-4
-3
-2
-1
0
1
2
Ve
rtic
al D
isp
lace
me
nt
(mm
)
Thickness(m)
Figure (10) relationship between displacement of pipe and foundation thickness
D=250mm T=0.3m
D=250mm T=0.5m
-8
-6
-4
-2
0
2
Ve
rtic
al D
isp
lace
me
nt
(mm
)
Thickness (m)
Figure (11) relationship between displacement of pipe and foundation thickness
D=500mm T=0.3m
D=500mm T=0.5m
-4
-3
-2
-1
0
1
2
Ve
rtic
al D
isp
lace
me
nt
(mm
)
Thickness (m)
Figure (12) relationship between displacement of pipe and foundation thickness
D=500mm T=0.3m
D=500mm T=0.5m
International Journal of Applied Engineering Research ISSN 0973-4562 Volume 12, Number 19 (2017) pp. 9176-9194
© Research India Publications. http://www.ripublication.com
9181
figure (15) represent the path of pipe under foundation
(1x1x0.3) m with H/D=0.5 and H/D=1.5.and figure (16)
represent the path of pipe under foundation (1x1x0.5) m with
H/D=0.5 and H/D=1.5.
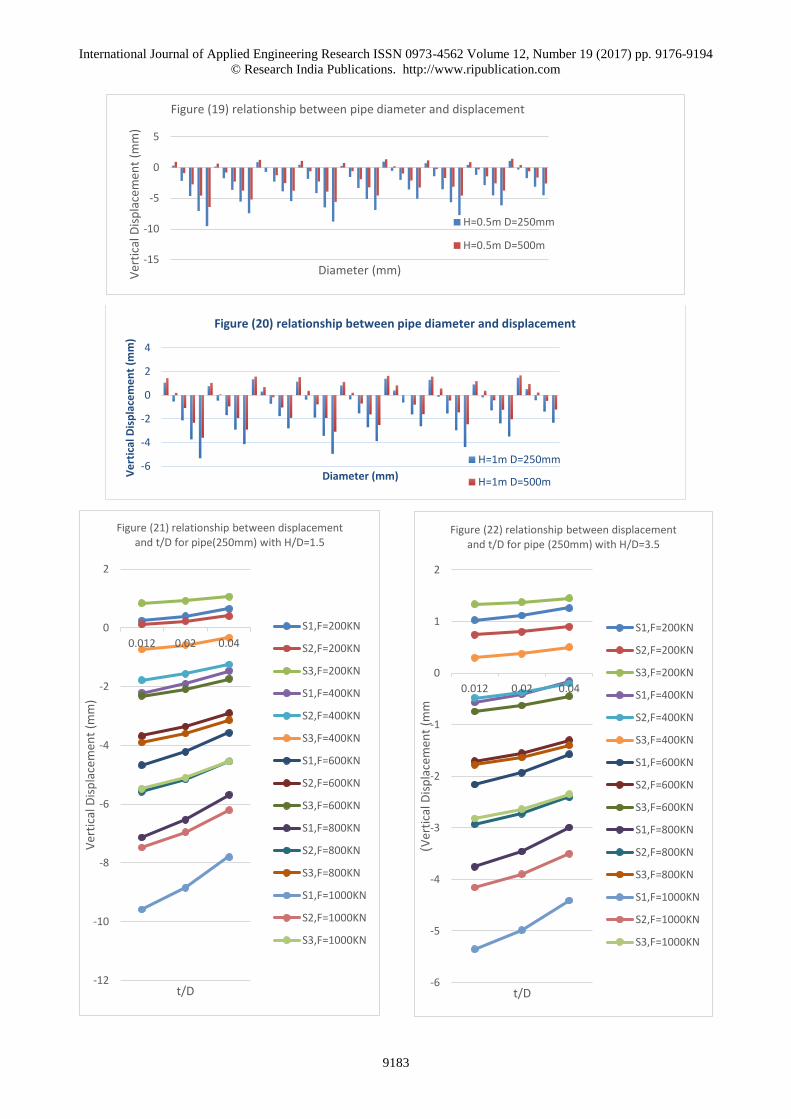
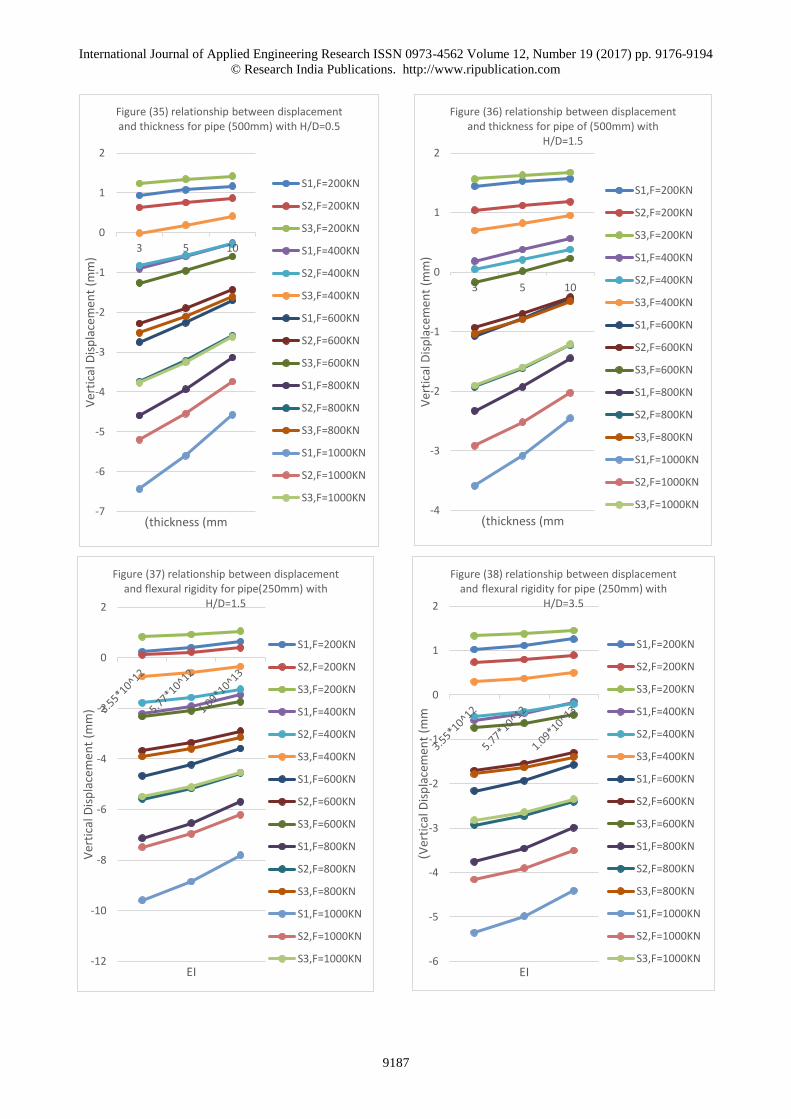
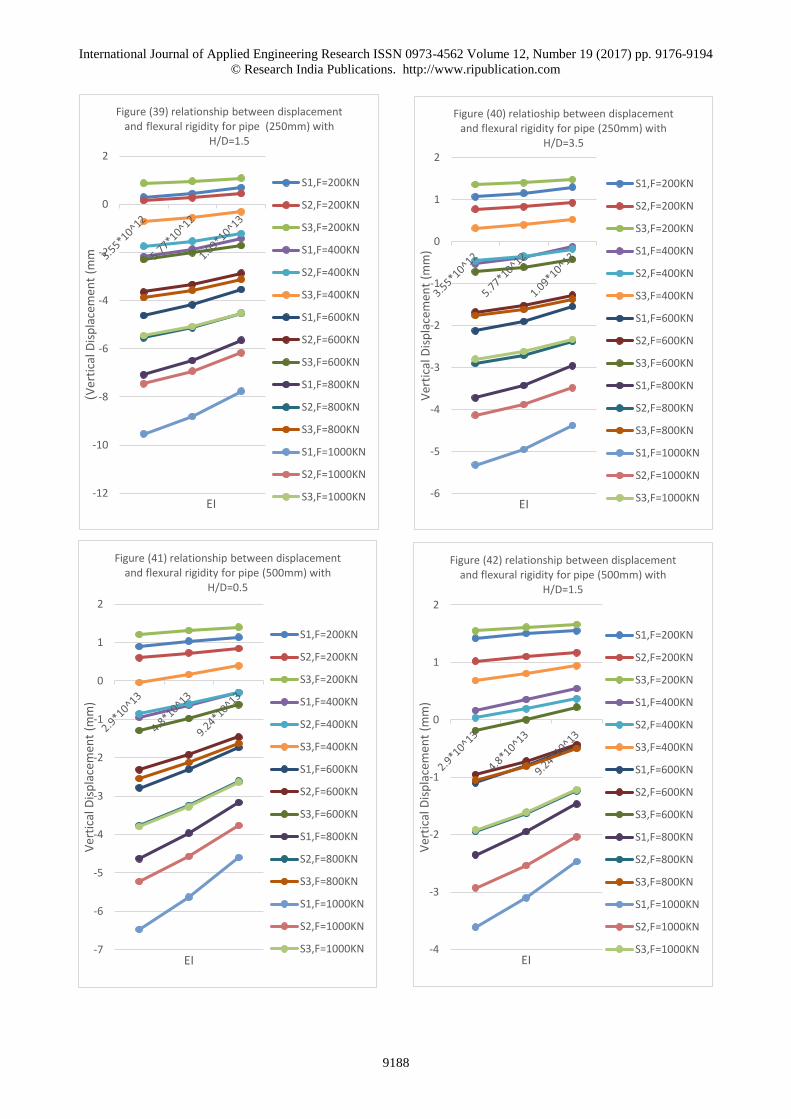
Effect of pipe diameter, also wall thickness and pipe rigidity
on vertical displacement
Figures from (17) to (20) shows the response of pipe due to
change in diameter it is clear as diameter increase the vertical
displacement will decrease because the increase in the moment
of inertia of the section and this will reflect on displacement
regardless of buried depth , embedment ratio , soil type ,
foundation configuration and value of applied load . If the
structural capacity of pipe is greater than the applied load the
pipe displacement will converse, it is direction and the pipe
diameter and vertical displacement are consider as
independent. also figures from (21) to (28) review the
relationship between vertical displacement and (t/D) it is clear
as the ratio (t/D) increase the displacement will decrease . also
figures from (29) to (35) shows the effect of pipe wall thickness
as the thickness increase the displacement will decrease due to
increase in the moment of inertia of the pipe and figures from
(36) to (41) shows that as the pipe flexural rigidity increase the
vertical displacement will decrease .
The shear force and bending moment developed into the pipe
-12
-10
-8
-6
-4
-2
0
2
4
200 400 600 800 1000
Ver
tica
l Dis
pla
cem
ent
(mm
)
Load (KN)
Figure (13)relationship between pipe displacement and applied load
s1-3mm
s2-3mm
s3-3mm
s1-3mm
s2-3mm
s3-3mm
s1-5mm
s2-5mm
s3-5mm
s1-5mm
s2-5mm
s3-5mm
s1-10mm
s2-10mm
s3-10mm
s1-10mm
s2-10mm
s3-10mm
-12
-10
-8
-6
-4
-2
0
2
4
200 400 600 800 1000
Ver
tica
l Dis
pla
cem
ent
(mm
)
Load (KN)
Figure (14) relationship between pipe displacement and applied load
s1-3mm
s2-3mm
s3-3mm
s1-3mm
s2-3mm
s3-3mm
s1-5mm
s2-5mm
s3-5mm
s1-5mm
s2-5mm
s3-5mm
s1-10mm
s2-10mm
s3-10mm
s1-10mm
s2-10mm
s3-10mm
International Journal of Applied Engineering Research ISSN 0973-4562 Volume 12, Number 19 (2017) pp. 9176-9194
© Research India Publications. http://www.ripublication.com
9182
-7
-6
-5
-4
-3
-2
-1
0
1
2
3
200 400 600 800 1000
Ver
tica
l Dis
pla
cem
ent
(mm
)
Load (KN)
Figure (15) relationship between pipe displacement and applied load
s1-3mm
s2-3mm
s3-3mm
s1-3mm
s2-3mm
s3-3mm
s1-5mm
s2-5mm
s3-5mm
s1-5mm
s2-5mm
s3-5mm
s1-10mm
s2-10mm
s3-10mm
s1-10mm
s2-10mm
s3-10mm-7
-6
-5
-4
-3
-2
-1
0
1
2
3
200 400 600 800 1000
Ver
tica
l Dis
pla
cem
ent
(mm
)
Load (KN)
Figure(16) relationship between pipe displacement and applied load
s1-3mm
s2-3mm
s3-3mm
s1-3mm
s2-3mm
s3-3mm
s1-5mm
s2-5mm
s3-5mm
s1-5mm
s2-5mm
s3-5mm
s1-10mm
s2-10mm
s3-10mm
s1-10mm
s2-10mm
s3-10mm
-15
-10
-5
0
5
Ve
rtic
al D
isp
lace
me
nt
(mm
)
Diameter (mm)
Figure (17) relationship between pipe diameter and displacement
H=0.5m D=250mm
H=0.5m D=500m
-6
-4
-2
0
2
4
Ve
rtic
al D
isp
lace
me
nt
(mm
)
Diameter (mm)
Figure (18) relationship between pipe diameter and displacement
H=1m D=250mm
H=1m D=500m
International Journal of Applied Engineering Research ISSN 0973-4562 Volume 12, Number 19 (2017) pp. 9176-9194
© Research India Publications. http://www.ripublication.com
9183
-15
-10
-5
0
5V
erti
cal D
isp
lace
men
t (m
m)
Diameter (mm)
Figure (19) relationship between pipe diameter and displacement
H=0.5m D=250mm
H=0.5m D=500m
-6
-4
-2
0
2
4
Ve
rtic
al D
isp
lace
me
nt
(mm
)
Diameter (mm)
Figure (20) relationship between pipe diameter and displacement
H=1m D=250mm
H=1m D=500m
-12
-10
-8
-6
-4
-2
0
2
0.012 0.02 0.04
Ver
tica
l Dis
pla
cem
ent
(mm
)
t/D
Figure (21) relationship between displacement and t/D for pipe(250mm) with H/D=1.5
S1,F=200KN
S2,F=200KN
S3,F=200KN
S1,F=400KN
S2,F=400KN
S3,F=400KN
S1,F=600KN
S2,F=600KN
S3,F=600KN
S1,F=800KN
S2,F=800KN
S3,F=800KN
S1,F=1000KN
S2,F=1000KN
S3,F=1000KN
-6
-5
-4
-3
-2
-1
0
1
2
0.012 0.02 0.04
Ver
tica
l Dis
pla
cem
ent
(mm
)
t/D
Figure (22) relationship between displacement and t/D for pipe (250mm) with H/D=3.5
S1,F=200KN
S2,F=200KN
S3,F=200KN
S1,F=400KN
S2,F=400KN
S3,F=400KN
S1,F=600KN
S2,F=600KN
S3,F=600KN
S1,F=800KN
S2,F=800KN
S3,F=800KN
S1,F=1000KN
S2,F=1000KN
S3,F=1000KN
International Journal of Applied Engineering Research ISSN 0973-4562 Volume 12, Number 19 (2017) pp. 9176-9194
© Research India Publications. http://www.ripublication.com
9184
-12
-10
-8
-6
-4
-2
0
2
0.012 0.02 0.04
Ver
tica
l Dis
pla
cem
ent
(mm
)
t/D
Figure (23) relationship between displacement and t/D for pipe (250mm) with H/D=1.5
S1,F=200KN
S2,F=200KN
S3,F=200KN
S1,F=400KN
S2,F=400KN
S3,F=400KN
S1,F=600KN
S2,F=600KN
S3,F=600KN
S1,F=800KN
S2,F=800KN
S3,F=800KN
S1,F=1000KN
S2,F=1000KN
S3,F=1000KN -6
-5
-4
-3
-2
-1
0
1
2
0.012 0.02 0.04
Ver
tica
l Dis
pla
cem
ent
(mm
)
t/D
Figure (24) relatioship between displacement and t/D for pipe (250mm) with H/D=3.5
S1,F=200KN
S2,F=200KN
S3,F=200KN
S1,F=400KN
S2,F=400KN
S3,F=400KN
S1,F=600KN
S2,F=600KN
S3,F=600KN
S1,F=800KN
S2,F=800KN
S3,F=800KN
S1,F=1000KN
S2,F=1000KN
S3,F=1000KN
-7
-6
-5
-4
-3
-2
-1
0
1
2
0.012 0.02 0.04
Ver
tica
l Dis
pla
cem
ent
(mm
)
t/D
Figure (25) relationship between displacement and t/D for pipe (500mm) with H/D=0.5
S1,F=200KN
S2,F=200KN
S3,F=200KN
S1,F=400KN
S2,F=400KN
S3,F=400KN
S1,F=600KN
S2,F=600KN
S3,F=600KN
S1,F=800KN
S2,F=800KN
S3,F=800KN
S1,F=1000KN
S2,F=1000KN
S3,F=1000KN -4
-3
-2
-1
0
1
2
0.012 0.02 0.04
Ver
tica
l Dis
pla
cem
ent
(mm
)
t/D
Figure (26) relationship between displacement and t/D for pipe (500mm) with H/D=1.5
S1,F=200KN
S2,F=200KN
S3,F=200KN
S1,F=400KN
S2,F=400KN
S3,F=400KN
S1,F=600KN
S2,F=600KN
S3,F=600KN
S1,F=800KN
S2,F=800KN
S3,F=800KN
S1,F=1000KN
S2,F=1000KN
S3,F=1000KN
International Journal of Applied Engineering Research ISSN 0973-4562 Volume 12, Number 19 (2017) pp. 9176-9194
© Research India Publications. http://www.ripublication.com
9185
-7
-6
-5
-4
-3
-2
-1
0
1
2
0.012 0.02 0.04
Ver
tica
l Dis
pla
cem
ent
(mm
)
t/D
Figure (27) relationship between displacement and t/D for pipe (500mm) with H/D=0.5
S1,F=200KN
S2,F=200KN
S3,F=200KN
S1,F=400KN
S2,F=400KN
S3,F=400KN
S1,F=600KN
S2,F=600KN
S3,F=600KN
S1,F=800KN
S2,F=800KN
S3,F=800KN
S1,F=1000KN
S2,F=1000KN
S3,F=1000KN-4
-3
-2
-1
0
1
2
0.012 0.02 0.04
Ver
tica
l Dis
pla
cem
ent
(mm
)
t/D
Figure (28) relationship between displacement and t/D for pipe of (500mm) with H/D=1.5
S1,F=200KN
S2,F=200KN
S3,F=200KN
S1,F=400KN
S2,F=400KN
S3,F=400KN
S1,F=600KN
S2,F=600KN
S3,F=600KN
S1,F=800KN
S2,F=800KN
S3,F=800KN
S1,F=1000KN
S2,F=1000KN
S3,F=1000KN
-12
-10
-8
-6
-4
-2
0
2
3 5 10
Ver
tica
l Dis
pla
cem
ent
(mm
)
thickness (mm)
Figure (29) relationship between displacement and thickness for pipe(250mm) with H/D=1.5
S1,F=200KN
S2,F=200KN
S3,F=200KN
S1,F=400KN
S2,F=400KN
S3,F=400KN
S1,F=600KN
S2,F=600KN
S3,F=600KN
S1,F=800KN
S2,F=800KN
S3,F=800KN
S1,F=1000KN
S2,F=1000KN
S3,F=1000KN-6
-5
-4
-3
-2
-1
0
1
2
3 5 10
Ver
tica
l Dis
pla
cem
ent
(mm
)
thickness (mm)
Figure (30) relationship between displacement and thickness for pipe (250mm) with H/D=3.5
S1,F=200KN
S2,F=200KN
S3,F=200KN
S1,F=400KN
S2,F=400KN
S3,F=400KN
S1,F=600KN
S2,F=600KN
S3,F=600KN
S1,F=800KN
S2,F=800KN
S3,F=800KN
S1,F=1000KN
S2,F=1000KN
S3,F=1000KN
International Journal of Applied Engineering Research ISSN 0973-4562 Volume 12, Number 19 (2017) pp. 9176-9194
© Research India Publications. http://www.ripublication.com
9186
-12
-10
-8
-6
-4
-2
0
2
3 5 10
Ver
tica
l Dis
pla
cem
ent
(mm
)
thickness (mm)
Figure (31) relationship between displacement and thickness for pipe (250mm) with H/D=1.5
S1,F=200KN
S2,F=200KN
S3,F=200KN
S1,F=400KN
S2,F=400KN
S3,F=400KN
S1,F=600KN
S2,F=600KN
S3,F=600KN
S1,F=800KN
S2,F=800KN
S3,F=800KN
S1,F=1000KN
S2,F=1000KN
S3,F=1000KN -6
-5
-4
-3
-2
-1
0
1
2
3 5 10
Ver
tica
l Dis
pla
cem
ent
(mm
)
thickness (mm)
Figure (32) relatioship between displacement and thickness for pipe (250mm) with H/D=3.5
S1,F=200KN
S2,F=200KN
S3,F=200KN
S1,F=400KN
S2,F=400KN
S3,F=400KN
S1,F=600KN
S2,F=600KN
S3,F=600KN
S1,F=800KN
S2,F=800KN
S3,F=800KN
S1,F=1000KN
S2,F=1000KN
S3,F=1000KN
-7
-6
-5
-4
-3
-2
-1
0
1
2
3 5 10
Ver
tica
l Dis
pla
cem
ent
(mm
)
thickness (mm)
Figure (33) relationship between displacement and thickness for pipe (500mm) with H/D=0.5
S1,F=200KN
S2,F=200KN
S3,F=200KN
S1,F=400KN
S2,F=400KN
S3,F=400KN
S1,F=600KN
S2,F=600KN
S3,F=600KN
S1,F=800KN
S2,F=800KN
S3,F=800KN
S1,F=1000KN
S2,F=1000KN
S3,F=1000KN -4
-3
-2
-1
0
1
2
3 5 10
Ver
tica
l Dis
pla
cem
ent
(mm
)
thickness (mm)
Figure (34) relationship between displacement and thickness for pipe (500mm) with H/D=1.5
S1,F=200KN
S2,F=200KN
S3,F=200KN
S1,F=400KN
S2,F=400KN
S3,F=400KN
S1,F=600KN
S2,F=600KN
S3,F=600KN
S1,F=800KN
S2,F=800KN
S3,F=800KN
S1,F=1000KN
S2,F=1000KN
S3,F=1000KN
International Journal of Applied Engineering Research ISSN 0973-4562 Volume 12, Number 19 (2017) pp. 9176-9194
© Research India Publications. http://www.ripublication.com
9187
-7
-6
-5
-4
-3
-2
-1
0
1
2
3 5 10
Ver
tica
l Dis
pla
cem
ent
(mm
)
thickness (mm)
Figure (35) relationship between displacement and thickness for pipe (500mm) with H/D=0.5
S1,F=200KN
S2,F=200KN
S3,F=200KN
S1,F=400KN
S2,F=400KN
S3,F=400KN
S1,F=600KN
S2,F=600KN
S3,F=600KN
S1,F=800KN
S2,F=800KN
S3,F=800KN
S1,F=1000KN
S2,F=1000KN
S3,F=1000KN-4
-3
-2
-1
0
1
2
3 5 10
Ver
tica
l Dis
pla
cem
ent
(mm
)
thickness (mm)
Figure (36) relationship between displacement and thickness for pipe of (500mm) with
H/D=1.5
S1,F=200KN
S2,F=200KN
S3,F=200KN
S1,F=400KN
S2,F=400KN
S3,F=400KN
S1,F=600KN
S2,F=600KN
S3,F=600KN
S1,F=800KN
S2,F=800KN
S3,F=800KN
S1,F=1000KN
S2,F=1000KN
S3,F=1000KN
-12
-10
-8
-6
-4
-2
0
2
Ver
tica
l Dis
pla
cem
ent
(mm
)
EI
Figure (37) relationship between displacement and flexural rigidity for pipe(250mm) with
H/D=1.5
S1,F=200KN
S2,F=200KN
S3,F=200KN
S1,F=400KN
S2,F=400KN
S3,F=400KN
S1,F=600KN
S2,F=600KN
S3,F=600KN
S1,F=800KN
S2,F=800KN
S3,F=800KN
S1,F=1000KN
S2,F=1000KN
S3,F=1000KN -6
-5
-4
-3
-2
-1
0
1
2
Ver
tica
l Dis
pla
cem
ent
(mm
)
EI
Figure (38) relationship between displacement and flexural rigidity for pipe (250mm) with
H/D=3.5
S1,F=200KN
S2,F=200KN
S3,F=200KN
S1,F=400KN
S2,F=400KN
S3,F=400KN
S1,F=600KN
S2,F=600KN
S3,F=600KN
S1,F=800KN
S2,F=800KN
S3,F=800KN
S1,F=1000KN
S2,F=1000KN
S3,F=1000KN
International Journal of Applied Engineering Research ISSN 0973-4562 Volume 12, Number 19 (2017) pp. 9176-9194
© Research India Publications. http://www.ripublication.com
9188
-12
-10
-8
-6
-4
-2
0
2
Ver
tica
l Dis
pla
cem
ent
(mm
)
EI
Figure (39) relationship between displacement and flexural rigidity for pipe (250mm) with
H/D=1.5
S1,F=200KN
S2,F=200KN
S3,F=200KN
S1,F=400KN
S2,F=400KN
S3,F=400KN
S1,F=600KN
S2,F=600KN
S3,F=600KN
S1,F=800KN
S2,F=800KN
S3,F=800KN
S1,F=1000KN
S2,F=1000KN
S3,F=1000KN -6
-5
-4
-3
-2
-1
0
1
2
Ver
tica
l Dis
pla
cem
ent
(mm
)
EI
Figure (40) relatioship between displacement and flexural rigidity for pipe (250mm) with
H/D=3.5
S1,F=200KN
S2,F=200KN
S3,F=200KN
S1,F=400KN
S2,F=400KN
S3,F=400KN
S1,F=600KN
S2,F=600KN
S3,F=600KN
S1,F=800KN
S2,F=800KN
S3,F=800KN
S1,F=1000KN
S2,F=1000KN
S3,F=1000KN
-7
-6
-5
-4
-3
-2
-1
0
1
2
Ver
tica
l Dis
pla
cem
ent
(mm
)
EI
Figure (41) relationship between displacement and flexural rigidity for pipe (500mm) with
H/D=0.5
S1,F=200KN
S2,F=200KN
S3,F=200KN
S1,F=400KN
S2,F=400KN
S3,F=400KN
S1,F=600KN
S2,F=600KN
S3,F=600KN
S1,F=800KN
S2,F=800KN
S3,F=800KN
S1,F=1000KN
S2,F=1000KN
S3,F=1000KN -4
-3
-2
-1
0
1
2
Ver
tica
l Dis
pla
cem
ent
(mm
)
EI
Figure (42) relationship between displacement and flexural rigidity for pipe (500mm) with
H/D=1.5
S1,F=200KN
S2,F=200KN
S3,F=200KN
S1,F=400KN
S2,F=400KN
S3,F=400KN
S1,F=600KN
S2,F=600KN
S3,F=600KN
S1,F=800KN
S2,F=800KN
S3,F=800KN
S1,F=1000KN
S2,F=1000KN
S3,F=1000KN
International Journal of Applied Engineering Research ISSN 0973-4562 Volume 12, Number 19 (2017) pp. 9176-9194
© Research India Publications. http://www.ripublication.com
9189
-7
-6
-5
-4
-3
-2
-1
0
1
2
Ver
tica
l Dis
pla
cem
ent
(mm
)
EI
Figure (43) relationship between displacement and flexural rigidity for pipe (500mm) with
H/D=0.5
S1,F=200KN
S2,F=200KN
S3,F=200KN
S1,F=400KN
S2,F=400KN
S3,F=400KN
S1,F=600KN
S2,F=600KN
S3,F=600KN
S1,F=800KN
S2,F=800KN
S3,F=800KN
S1,F=1000KN
S2,F=1000KN
S3,F=1000KN -4
-3
-2
-1
0
1
2
Ver
tica
l Dis
pla
cem
ent
(mm
)
EI
Figure (44) relationship between displacement and flexural rigidity for pipe of (500mm) with
H/D=1.5
S1,F=200KN
S2,F=200KN
S3,F=200KN
S1,F=400KN
S2,F=400KN
S3,F=400KN
S1,F=600KN
S2,F=600KN
S3,F=600KN
S1,F=800KN
S2,F=800KN
S3,F=800KN
S1,F=1000KN
S2,F=1000KN
S3,F=1000KN
0
20000
40000
60000
80000
100000
120000
140000
160000
She
ar F
orc
e (
N)
Buried Depth (m)
Figure (45) relationship between shear force and buried depth
H=0.5m D=250mm
H=0.5m D=500m
0
20000
40000
60000
80000
100000
Shea
r Fo
rce
(N)
Buried Depth (m)
Figure (46) relationship between shear force and buried depth
H=1m D=250mm
H=1m D=500m
International Journal of Applied Engineering Research ISSN 0973-4562 Volume 12, Number 19 (2017) pp. 9176-9194
© Research India Publications. http://www.ripublication.com
9190
0
20000
40000
60000
80000
100000
120000
140000
160000Sh
ear
Forc
e (N
)
Buried Depth (m)
Figure (47) relationship between shear force and buried depth
H=0.5m D=250mm
H=0.5m D=500m
0
20000
40000
60000
80000
100000
120000
140000
Shea
r Fo
rce
(N)
Buried Depth (m)
Figure (48) relationship between shear force and buried depth
H=1m D=250mm
H=1m D=500m
0
10000
20000
30000
40000
50000
60000
70000
80000
Be
nd
ing
Mo
me
nt
(N.m
)
Buried Depth (m)
Figure (49) relationship between bending moment and buried depth
H=0.5m D=250mm
H=0.5m D=500m
0
10000
20000
30000
40000
50000
60000
Ben
din
g M
om
ent
(N.m
)
Buried Depth (m)
Figure (50) relationship between bending moment and buried depth
H=1m D=250mm
H=1m D=500m
International Journal of Applied Engineering Research ISSN 0973-4562 Volume 12, Number 19 (2017) pp. 9176-9194
© Research India Publications. http://www.ripublication.com
9191
The variation of the shear force and bending moment with
buried depth are shown in figures from 45 to 52 respectively.
All figures show that the variation in shear forces and bending
moments due to different load applied and change in pipe
diameter take in consideration wall thickness and pipe rigidity
Figures 45,47,49 and 51represent the path of pipe (250mm)
under foundation (1x1x0.3)m also figures 46,48,50 and 52
represent the path of pipe (500mm) under foundation
(1x1x0.5)m. these figures shows the maximum value of shear
force and bending moment respectively.
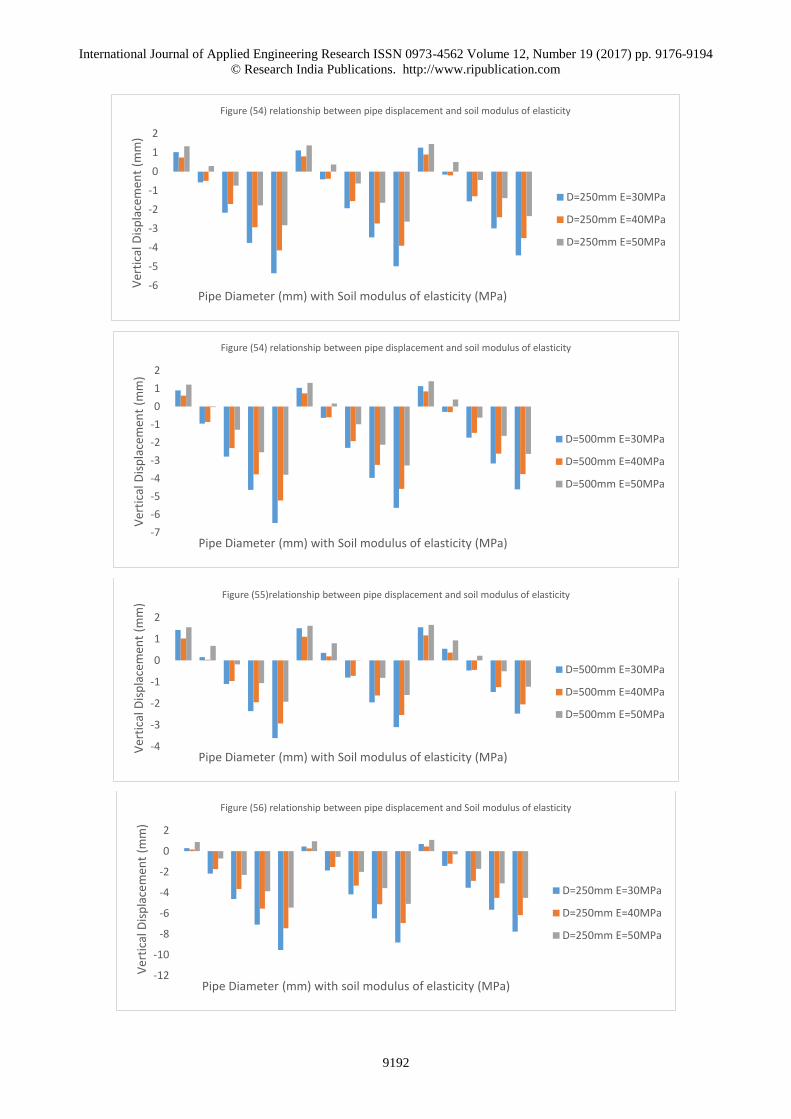
Effect of soil type on vertical displacement
Three types of soils are differed in properties are considered in
case study it is clear in figures from 53 to 59 as the soil modulus
of elasticity increase the response of buried pipe decrease for
the same loading condition regardless of foundation
configuration .except in the case when the structural capacity
of pipe greater than the applied load the soil modulus of
elasticity has no significant effect .
0
10000
20000
30000
40000
50000
60000
70000
80000B
end
ing
Mo
men
t (N
.m)
Buried Depth (m)
Figure (51) relationship between bending moment and buried depth
H=0.5m D=250mm
H=0.5m D=500m
0
10000
20000
30000
40000
50000
60000
Ben
din
g M
om
ent
(N.m
)
Buried Depth (m)
Figure (52) relationship between bending moment and buried depth
H=1m D=250mm
H=1m D=500m
-12
-10
-8
-6
-4
-2
0
2
Ver
tica
l Dis
pla
cem
ent
(mm
)
Pipe Diameter (mm) with Soil modulus of elasticity (MPa)
Figure (53) relationship between pipe displacement and soil modulus of elasticity
D=250mm E=30MPa
D=250mm E=40MPa
D=250mm E=50MPa
International Journal of Applied Engineering Research ISSN 0973-4562 Volume 12, Number 19 (2017) pp. 9176-9194
© Research India Publications. http://www.ripublication.com
9192
-6
-5
-4
-3
-2
-1
0
1
2V
erti
cal D
isp
lace
men
t (m
m)
Pipe Diameter (mm) with Soil modulus of elasticity (MPa)
Figure (54) relationship between pipe displacement and soil modulus of elasticity
D=250mm E=30MPa
D=250mm E=40MPa
D=250mm E=50MPa
-7
-6
-5
-4
-3
-2
-1
0
1
2
Ver
tica
l Dis
pla
cem
ent
(mm
)
Pipe Diameter (mm) with Soil modulus of elasticity (MPa)
Figure (54) relationship between pipe displacement and soil modulus of elasticity
D=500mm E=30MPa
D=500mm E=40MPa
D=500mm E=50MPa
-4
-3
-2
-1
0
1
2
Ver
tica
l Dis
pla
cem
ent
(mm
)
Pipe Diameter (mm) with Soil modulus of elasticity (MPa)
Figure (55)relationship between pipe displacement and soil modulus of elasticity
D=500mm E=30MPa
D=500mm E=40MPa
D=500mm E=50MPa
-12
-10
-8
-6
-4
-2
0
2
Ver
tica
l Dis
pla
cem
ent
(mm
)
Pipe Diameter (mm) with soil modulus of elasticity (MPa)
Figure (56) relationship between pipe displacement and Soil modulus of elasticity
D=250mm E=30MPa
D=250mm E=40MPa
D=250mm E=50MPa
International Journal of Applied Engineering Research ISSN 0973-4562 Volume 12, Number 19 (2017) pp. 9176-9194
© Research India Publications. http://www.ripublication.com
9193
CONCLUSIONS
The main conclusions from this paper shows , The buried depth
and embedment ratio play important role on the response of
buried pipe , Foundation thickness has no significant effect on
the response of buried pipe , The vertical displacement of pipe
increase linearly with increasing in load magnitude , As the
pipe diameter , pipe wall thickness , ratio (t/D) , and pipe
rigidity increase the pipe displacement will decrease , The
variation of shear force and bending moment will reflect the
behavior of buried pipe , As the soil modulus of elasticity
increase the pipe vertical displacement decrease , The structural
capacity of pipe will reflect it is behavior under loading
condition .
REFERENCE
[1] J.L.Olliff , S.J.Rolfe , D.C Wijeyesekera and
J.T.Reginold , Soil-Structure-Pipe Interaction with
Particular Reference to Ground Movement Induced
Failures , Proceedings of Plastics Pipes XI , 2000.
-6
-5
-4
-3
-2
-1
0
1
2V
erti
cal D
isp
lace
men
t (m
m)
Pipe Diameter (mm) with Soil modulus of elasticity (MPa)
Figure (57) relationship between pipe displacement and Soil modulus of elasticity
D=250mm E=30MPa
D=250mm E=40MPa
D=250mm E=50MPa
-7
-6
-5
-4
-3
-2
-1
0
1
2
Ver
tica
l Dis
pla
cem
ent
(mm
)
Pipe Diameter (mm) with Soil modulus of elasticity (MPa)
Figure (58) relationship between pipe displacement and soil modulus of elasticity
D=500mm E=30MPa
D=500mm E=40MPa
D=500mm E=50MPa
-4
-3
-2
-1
0
1
2
Ver
tica
l Dis
pla
cem
ent
(mm
)
Pipe Diameter (mm) with Soil modulus of elasticity (MPa)
Figure (59) relationship between pipe displacement and soil modulus of elasticity
D=500mm E=30MPa
D=500mm E=40MPa
D=500mm E=50MPa
International Journal of Applied Engineering Research ISSN 0973-4562 Volume 12, Number 19 (2017) pp. 9176-9194
© Research India Publications. http://www.ripublication.com
9194
[2] A . P . Moser, Buried Pipe Design: McGraw - Hill,
1990 .
[3] Jian Yu, Chenrong Zhang, Maosong Huang, Soil-Pipe
interaction due to tunneling: Assessment of Winkler
modulus for underground pipelines, Computers and
Geotechnices 50(2013),17-28.
[4] Bernardo Horowitz, Evandro Parente Jr , Assesment
of Simplified Pipe-Soil Interaction Models, 17th
International Congress of Mechanical Engineering,
November 10-14 , 2003.