©IBM 2014
Spyros Kontogiorgis, PhD
with Brent Hodges, Tom Luin, Elmer Corbin IBM Development Enterprise Transformation Initiative
2014 George Mason and IBM Symposium on Diverse Data Analytics Applications,
November 4th 2014.
Using analytics to capture the Voice of the Customer and influence product development
2
Overview: Analytics for Customer Experience (CX)
What is Quality and Customer Experience? Why measure it?
How can we measure it? What metrics and methods can we use?
Where can we find the underlying data and/or how can we create them?
What types of analytics can we apply?
What kind of insights can analytics produce?
What new methods and tools does the future hold?
3
The evolution of Quality: From hard metrics to soft ones
Definition: Quality is the extend to which products and services meet the
requirements of their users* .
Quality has two aspects
– Quality of Design: The degree a product possesses an intended feature.
More features distinguish a product vs. the competition. (3 airbags are better than 1…)
– Quality of Conformance: The extend to which the product conforms to the
intent of the design.
The features perform as intended. (… provided they deploy when needed. )
The supplier can control (track, improve) these aspects by instituting
metrics on
– the product itself
test results of compliance to specs (defects, rejects etc.).
– The production line and processes that create the product
setup time, down time, scrap, rework, completion time etc.
* “Introduction to Statistical Quality Control. 3rd Ed.”, by D.C. Montgomery (1996)
Some material adapted from “Measuring Customer Satisfaction, 2nd Ed.” by R.E. Hayes (1998)
4
Evolution of Quality (cont.): The case of services
Supply-side metrics are “hard”, i.e. produced by an “objective” process.
Experience has shown that hard metrics cannot capture (or forecast)
the success (adoption) of a product accurately, esp. of services, given
their unique characteristics*
Inseparability of production and consumption
High visibility to client. No buffer to hide mistakes or shortfalls.
Intangibility
Hard to test, measure, inventory, inspect and verify in advance of sale.
Perishability
Cannot store for later consumption. Must be right every time.
Heterogeneity
Performance varies with producers, delivery timeframe and customers expectation.
Hard to predict.
* Ghobadian et al, “Service quality: concepts and models”, Intl’ J. of Quality and Reliability Mgmt, 1997,
5
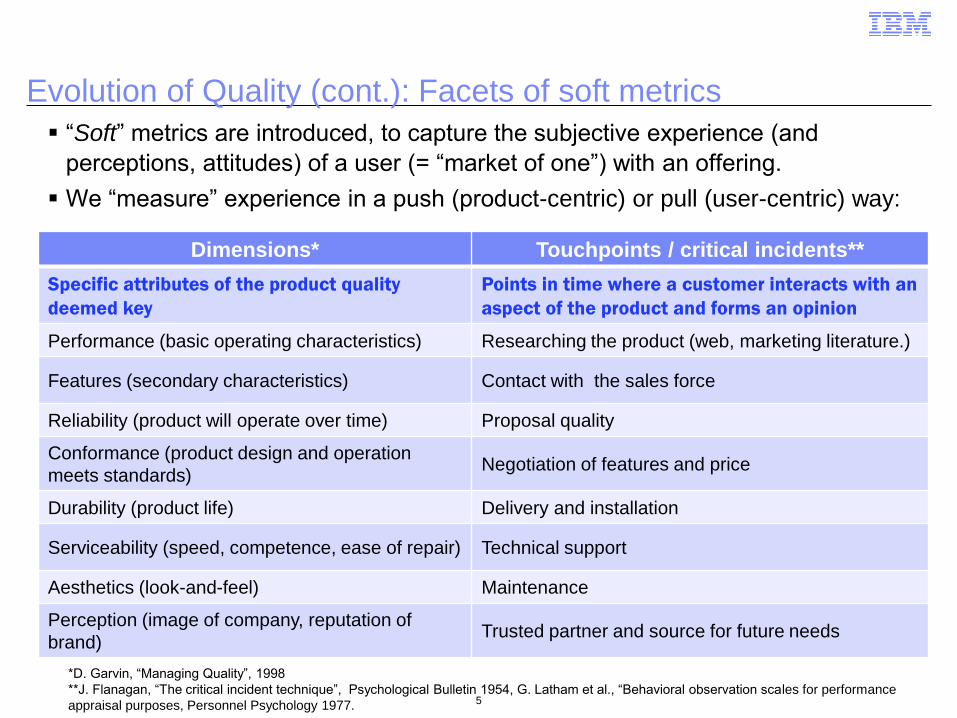
Evolution of Quality (cont.): Facets of soft metrics
“Soft” metrics are introduced, to capture the subjective experience (and
perceptions, attitudes) of a user (= “market of one”) with an offering.
We “measure” experience in a push (product-centric) or pull (user-centric) way:
*D. Garvin, “Managing Quality”, 1998
**J. Flanagan, “The critical incident technique”, Psychological Bulletin 1954, G. Latham et al., “Behavioral observation scales for performance
appraisal purposes, Personnel Psychology 1977.
Dimensions* Touchpoints / critical incidents**
Specific attributes of the product quality
deemed key
Points in time where a customer interacts with an
aspect of the product and forms an opinion
Performance (basic operating characteristics) Researching the product (web, marketing literature.)
Features (secondary characteristics) Contact with the sales force
Reliability (product will operate over time) Proposal quality
Conformance (product design and operation
meets standards) Negotiation of features and price
Durability (product life) Delivery and installation
Serviceability (speed, competence, ease of repair) Technical support
Aesthetics (look-and-feel) Maintenance
Perception (image of company, reputation of
brand) Trusted partner and source for future needs
6
“Soft” CX metrics are important: IBM Enterprise Transformation mandates using them in all phases of the lifecycle of an offering
Corporate Instruction ET 105 (of July 1, 2014) iterates that IBM
– views Quality through the eyes of our clients.
– is committed to continuously improve the overall quality experience for our
clients, which includes both
• their perception of product performance, as well as
• their interaction with IBM’s processes.
To implement this commitment, ET 105 tasks
– Group Executives, to establish a Management system (with a focus on
Quality based on client experience) which will monitor the overall quality of
IBM offerings.
– Product Management, to set and implement aggressive client experience
Quality goals for their offerings.
– Design, to determine user experience focus areas.
7
To capture CX, we can use both push and pull methods
Feedback on customer experience can be captured by either of:
A controlled (“push”) approach, such as surveys, with
– a crafted, officially-vetted questionnaire, directed at
– a segmented, often pre-qualified target audience, typically selected by
sampling methods, at
– pre-determined times (fixed dates, or after specific events, e.g. purchase,
registration, service completion), with
– responses given in numerical scales, and
– processed statistically.
A free-form (“pull”) approach, such as data-mining opinions
– available in digital media (web sites, blogs, SMS, tweets etc.)
– unsolicited, and all available
– in text format (unstructured)
– scraped 24/7, and
– processed semantically.
8
Push practice: Capturing CX via trusted data surveys
Continuously through the year, Market Development and Intelligence at
IBM (through affiliated vendors) field a series of surveys, which
capture feedback from the leadership in customers’ organization (C-Suite and IT
managers who bought an offering recently), on an extensive range of interaction
facets with IBM
– 30+ questions (on delivery, pricing, support etc.), with replies scored in a 1-10 scale
(highest is 10), plus text comments to selected questions.
are global (administered world-wide and across all brand groups. )
are extensively used by the Marketing and Sales Organizations, and
are data-maintained by a Business Intelligence Team, which syndicates them
through the enterprise.
These surveys are the starting point in our analytics effort, with plans in
the future to expand into the CX analytics ecosystem…
9
It takes a diverse, sophisticated ecosystem to transmute CX from raw data to actions informing business transformation
Capture Channels
• Purchase Surveys
• Board postings
• Chats
• Online Product Reviews
• Sensors (IoT)
Customer Experience
Aggregators
• IT datamarts
• BI reports
• Automated On-Page Recorders
Processors
• Embedded Analytics Teams
• IBM Research
Brokers & Enablers
• Quality SMEs
• Leadership Teams
• Change Consultants
End Adopters
• Product Managers, Designers & Developers
• Marketing and Sales
Analytics
Supply
Our team
Analytics
Demand
10
Which analytics for CX? Dashboards are an often indispensable first step in displaying metrics and indicators
Co
mp
lexit
y
Co
mp
eti
tive A
dvan
tag
e
Ad hoc and Standard reporting
Query/drill down
Simulation
Forecasting
Statistical models
Optimization Prescriptive
Descriptive
Predictive
Dashboards, although at just the first level of the analytics hierarchy, are a crucial
first step in generating business value from analytics.
They provide values and visualizations of summary metrics (survey results and other CX
experience) – A “Close Encounter of the First Kind”* .
They can be available on-demand 24/7, for rapid dissemination and adoption.
They represent an advanced milestone of the journey travelled (and battles won) through
data capture, aggregation and processing.
They can be used to trigger alerts, for special (outlier) events.
They often provide a drill-down capability, used for elementary root-cause analysis.
Hypothesis testing
Dashboards
Stochastics
* ”Visual sightings of an unidentified flying object seemingly less than 500 feet away that show an appreciable angular extension and
considerable detail.” Hynek, Allen J. (1998) The UFO Experience: A Scientific Inquiry
11
However, to fully mine the CX experience, we need to go up the analytics value chain, adding hypothesis testing
Dashboards they may not be enough for decision making, since they
• show just one or two summary metrics, usually an average.
• show what happened in the past, which may lead to reactive (“fix it”) actions.
• show only what happened in one part of the business; the decision maker
must correlate with findings in other parts.
• may contain insights hidden; the decision maker must invest time to
discover them .
• provide no statistical valuation of variances (“is it a glitch or is it an issue?”)
Thus, we must add higher-level analytics, such as hypothesis testing…
12
With our SME partners, we formulated and tested hypotheses on client satisfaction
The hypotheses come from suspected pain points, anecdotal info,
strategic and tactical goals and examination of patterns in the data.
Examples:
• Poorly-satisfied customers cannot be explained away as a random variation (i.e. the distribution of satisfaction scores is skewed, not normal.)
• The portion of poorly-satisfied customers is decreasing over time. • Satisfaction levels have greater variability in service offerings, than in
hardware and software ones. • Product defects is not one of the top issues contributing to negative
satisfaction. • Clients at the exec-level would like IBM to provide guidance into future
technology trends proactively .
While carrying out the analysis, we also sought to provide expressive
summaries (enhanced dashboard views, heat maps), to illustrate
findings in the data in a non-specialist language.
13
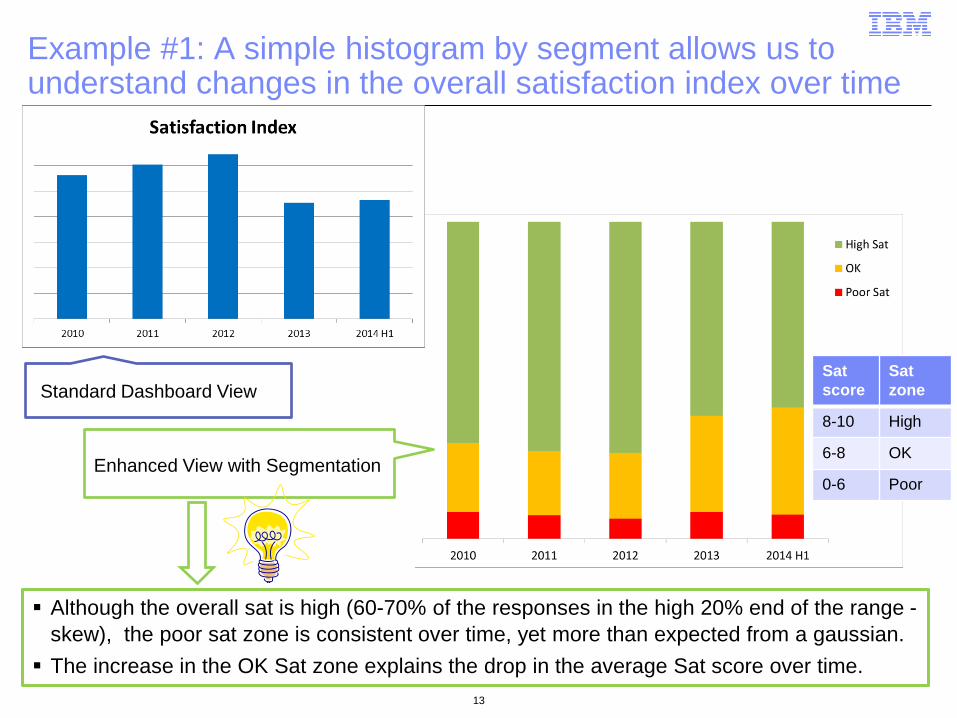
Example #1: A simple histogram by segment allows us to understand changes in the overall satisfaction index over time
Although the overall sat is high (60-70% of the responses in the high 20% end of the range -
skew), the poor sat zone is consistent over time, yet more than expected from a gaussian.
The increase in the OK Sat zone explains the drop in the average Sat score over time.
Standard Dashboard View Sat
score
Sat
zone
8-10 High
6-8 OK
0-6 Poor Enhanced View with Segmentation
14
Example #2: Adding a simple linear trend and prediction simplifies comparative satisfaction by brand.
To gauge future behavior of poor sat, we added a 2-year-out linear trend to history.
This extrapolation shows that poor sat with Red will continue to rise, while poor sat with
Yellow and Purple will decrease, and poor sat with Green will stay nearly flat.
15
Example #3: A heat map (geo drill down) reveals markets where poor levels of sat require attention
For the markets with the most
responses for A and B, we
segment their scores.
We flag markets with
– High % of Poor sat as Red
– High % of OK sat as Yellow
– High % of High sat as Green.
Prioritizing by # of responses
(proxy for business volume),
we identify markets in need of
immediate attention, and can
generate email alerts for.
Market Product A Product B
Poor Sat
OK High Sat
# responses
Poor Sat
OK High Sat
# responses
Segontium 3% 13% 84% 596 1% 11% 88% 224
Corinium 4% 34% 61% 174
Glevum 3% 15% 82% 114 19% 81% 16
Londinium 1% 26% 73% 74
Deva Victrix
16% 37% 47% 70 100% 1
Eboracum 9% 26% 65% 46 13% 13% 75% 8
Mamucium 13% 35% 52% 23 33% 67% 6
Durnovaria 0% 19% 81% 21 100% 1
Lindinis 7% 36% 57% 14 60% 40% 5
Concangis 6% 44% 50% 18
Coria 6% 50% 44% 16 100% 2
Petuaria 7% 93% 14 100% 1
Sat
score
Sat
zone
0 to 6 Poor
6+ to 8 OK
8+ to 10 High
16
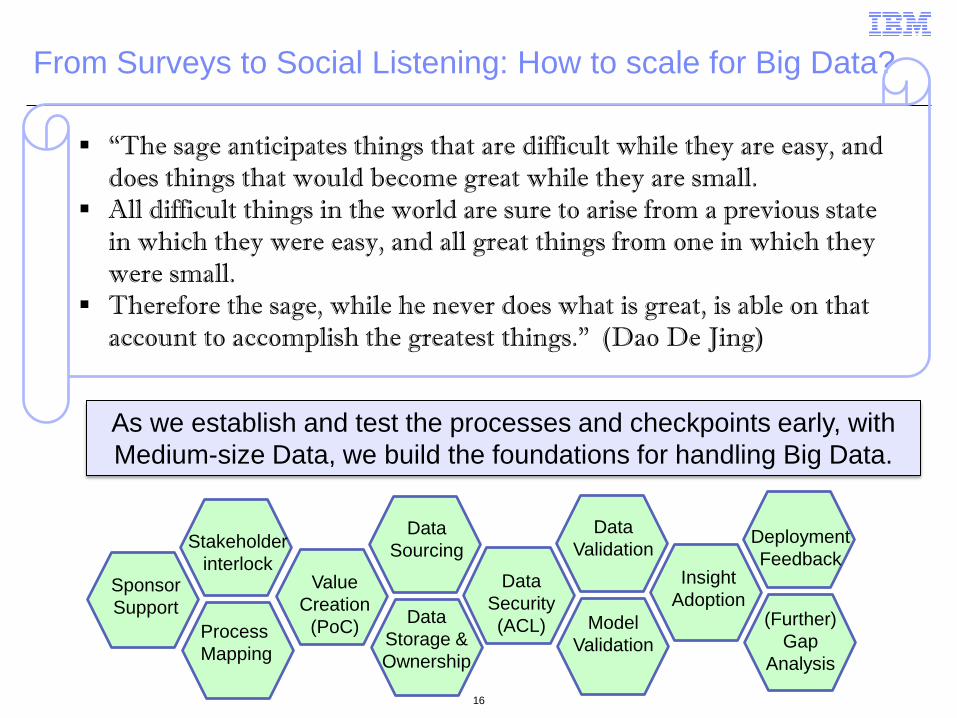
From Surveys to Social Listening: How to scale for Big Data?
“The sage anticipates things that are difficult while they are easy, and
does things that would become great while they are small.
All difficult things in the world are sure to arise from a previous state
in which they were easy, and all great things from one in which they
were small.
Therefore the sage, while he never does what is great, is able on that
account to accomplish the greatest things.” (Dao De Jing)
As we establish and test the processes and checkpoints early, with
Medium-size Data, we build the foundations for handling Big Data.
Sponsor
Support
Process
Mapping
Stakeholder
interlock Value
Creation
(PoC) Data
Storage &
Ownership
Data
Sourcing
Data
Security
(ACL) Model
Validation
Data
Validation
Insight
Adoption (Further)
Gap
Analysis
Deployment
Feedback
17
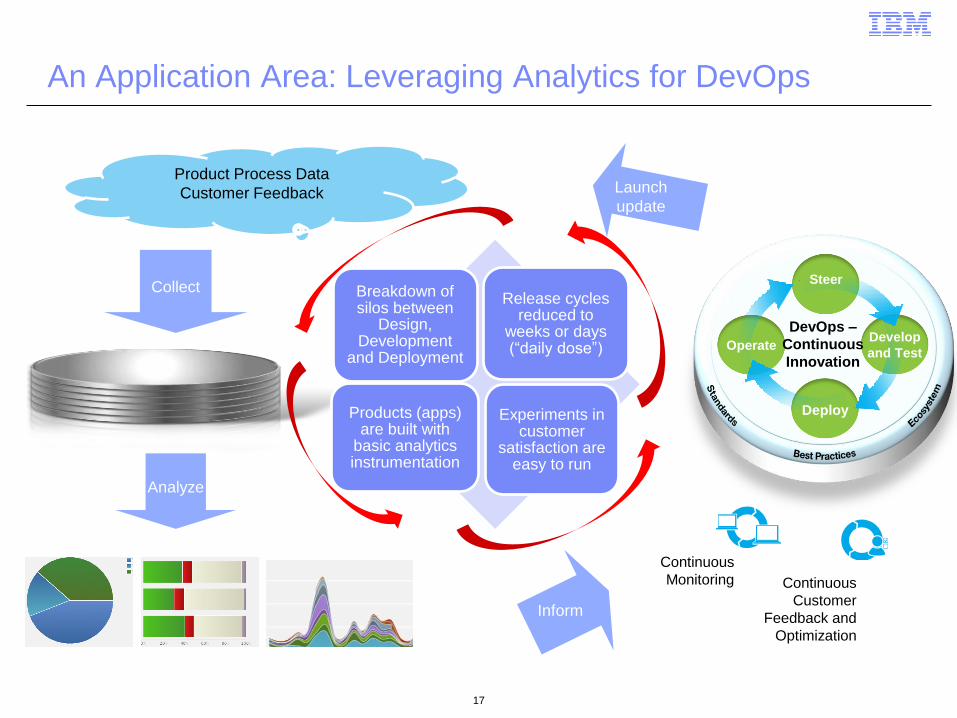
Continuous
Monitoring Continuous
Customer
Feedback and
Optimization
An Application Area: Leveraging Analytics for DevOps
Operate Develop
and Test
Deploy
Steer
DevOps –
Continuous
Innovation
Product Process Data
Customer Feedback
Collect
Analyze
Inform
Launch
update
Breakdown of silos between
Design, Development
and Deployment
Release cycles reduced to
weeks or days (“daily dose”)
Products (apps) are built with
basic analytics instrumentation
Experiments in customer
satisfaction are easy to run
18
Into the future: Analytics by Cognitive Systems
The Decision-Maker asks in natural language: “What are the main causes of
customer dissatisfaction? How may they affect orders in the pipeline?“
The Cognitive System understands the question, produces possible answers
(hypotheses), collects supporting data, analyzes the evidence, computes the
confidence and delivers.
ARMONK, N.Y. - 09 Jan
2014: IBM today unveiled
three new Watson services
delivered over the cloud.
Watson Discovery Advisor is
designed to accelerate and
strengthen research and
development projects in
pharmaceuticals, publishing
and biotechnology. Watson
Analytics delivers visualized
Big Data insights, based on
questions posed in natural
language by any business
user. Watson Explorer helps
users across an enterprise
uncover and share data-driven
insights more easily, while
empowering organizations
launch Big Data initiatives
faster. Scenario


![Welcome [tc18.tableau.com] · Call Center Analytics Marketing & Sales Analytics Tableau Voice of the Customer Call Recordings. VoiceBase Speech Analytics Example I like data and analytics](https://static.documents.pub/doc/80x56/5e70918de44f3165181c2dbd/welcome-tc18-call-center-analytics-marketing-sales-analytics-tableau-voice.jpg)


