Abstract This paper aims at providing a better understanding of the concept of logistics cost and its optimization techniques. The goal is to show a comparison between present cost model of bulk carrying vehicle at Lafarge Surma Cement (LSC) and an optimization tool developed using Microsoft excel which will show the percentage of cost reduction and total savings in Bangladeshi Taka (BDT). In this study, it can be seen that considering some identical cost factors the overall logistics cost can be reduced significantly.
1 INTRODUCTION Optimization means maximizing the return at a given risk level or risk is minimized for a given expected return [1]. To be successful in today's highly competitive marketplaces, companies must strive for greatest efficiency in all of their activities and completely utilize any possible opportunity to gain a competitive advantage over other firms. Among many possible activities, cost reduction in logistics is regarded as one of the core areas presenting enormous opportunities [2]. The Council of Supply Chain Management Professionals (CSCMP) defines logistics management as-“[The] part of supply chain management that plans, implements, and controls the efficient, effective forward and reverses flow1 and storage of goods, services and related information between the point of origin and the point of consumption in order to meet customers’ requirement’’[3]. The majority of prior research on logistics costs can be grouped into two streams. One stream focuses on strategic aspects of the logistics costs, and the other deals with optimized cost-effective logistics decisions. As reported by Richardson (1995) and later stressed by Gilmore (2002), logistics controls a significant amount of assets and has direct impact on cash flow and the bottom line, adds value through continuous productivity and service improvements, and possesses a strong relationship with a firm’s customer
service level and revenues. Numerous factors can drive up logistics costs substantially, which may offset the benefits of doing business with the international suppliers. The techniques utilized to analyze the logistics cost can be summarized into four categories: recurrence-based, regression-based, activity-based, and optimization-based [4]. Over the decade logistics has become a key strategic function for the retailers (Bourlakis and Bourlakis, 2001) [5]. Because of the retail revolution logistics becomes retailer driven. Co-ordination between warehouse and transport activities is very important. Re-engineering the entire supply chain plays a major role in logistics performance. In this way, logistics becomes increasingly important in large retailers value chain (Norek, 1997) [6]. According to Parkan and Dubey (2009), significant modernization of logistics is required in Indian manufacturing and services industry. The paper also argues that with increased FDI in agricultural and retail sectors will drive the growth of Indian logistics sector. Organized retail in India has achieved rapid growth at a significant cost [7]. According to Dröge et al (1991), logistics is becoming an increasingly important part of overall retail strategy because it provides opportunities for enhanced profit, market growth and sustainable competitive advantage. The factors which have impact on retail logistics are warehousing/transportation,supplier performance/communication, internal information systems, activity leveling and inventory/cost reduction [8]. According to Olavson et al (2010), in today’s volatile economy, one supply chain design is probably not enough. What’s really needed is a portfolio of supply chains that at once enables you to be cost effective and yet agile and highly responsive in situations where those competencies are called for [9]. Tracey (2004) stated that transportation is often ignored as a source of competitive advantage. The work stated that transportation performance depends upon the terms like delivery schedules, product quality, satisfactory delivery service and acceptable overall performance [10]. Luo (2007) provided the insight that the delays in transporting, sorting, grading and disposition only serve to reduce the value remaining in the product [11]. Zeng and Rossetti (2003) classified the key logistics cost elements into six categories, namely transportation, inventory holding, administration, customs charges, risk and handling and packaging costs. Transportation cost has been a very common topic of
International Research Journal of Engineering and Technology (IRJET) e-ISSN: 2395 -0056
research. Examples of these include the routing of transportation (Eilon et al.,1971), minimization of transportation cost (Bodin et al., 1983), etc. believed that the transportation cost should relate to the travel distance between the warehouse and destination, and such cost should include the driver’s wages, equipment cost and in-transit inventory cost [12] [13] [14]. This paper focuses on analyzing the cost factors and present cost model of single bulk carrying vehicle used by LSC. It tries to show a pathway to optimize the costs by developing an Excel model based on some cost factors. Thus the specific research questions are as follows:
1. To get insight of logistics at LSC 2. To analyze logistics cost factors 3. To analyze previous logistics cost model at LSC 4. To develop a logistics cost optimization model 5. To recommend the best practice for logistics
operation
2 COMPANY OVERVIEW Lafarge Surma Cement Ltd. is a joint venture of Lafarge, a world leader in building materials and CementosMolins, a Spanish Company with strong global presence. The Group portfolio of businesses is as follows: Cement: 63.5%, aggregates and concrete: 35.9%, other: 0.6%. The hierarchy of LSC’s supply chain:
Figure 1 Supply chain hierarchy of LSC
3 METHODOLOGY Many past studies have been dedicated to determining how to achieve the lowest possible transportation cost. For example, McCann [15] addressed two interrelated questions: the optimum size of a vehicle or vessel and the structure of transportation costs with respect to haulage distance. C. Pilot and S. Pilot [16] focused on minimizing the total costs involved in a transportation problem. Jha et al. [17] considered a joint-location inventory problem and minimized the transportation cost involved in a joint inventory location model by using a modified adaptive different evolution algorithm. Chanas and Kuchta [18]
proposed what they see as an optimal solution to the transportation problem, which makes use of fuzzy cost coefficients and an algorithm determining the nature of the solution. As exploration of transportation problems has developed, multiobjective transportation cost problems have emerged. For instance, Prakash et al. [19] drew attention to a cost-time trade-off bulk transportation problem, which they solve by using Pareto optimal solutions. Ojha et al. [20] formulated a multiobjective transportation solution, with fuzzy relations under fuzzy logic. The objectives of their model are the minimization of the total transportation cost and total time for transportation required for the system. Sahyouni et al. (2007) developed three generic facility location models for the integrated distribution and collection of products. The models quantified the value of integrated decision making in the design of logistics networks by focusing on facility and transportation costs throughout different stages of a product’s life cycle. The trucks used in distribution network can either be owned by retailer or can be rented from 3rd Party Logistics provider. The fixed costs involved in transportation are time related cost. Capital costs (vehicle cost), vehicle taxation, vehicle insurance, driver salary and overhead cost fall under fixed costs. The variable costs involved in transportation are running costs. Fuel cost, oil & lubricants cost, vehicle repair and maintenance, tires & tubes cost, trip allowance to crew, loading and unloading personnel cost, other operating cost [21]. In this work, only transportation related costs (Bulk carrying vehicle) of LSC are considered for optimization. Interviewing as a method of qualitative research has done by face to face meeting with logistics department of LSC. After sorting and analyzing data, four promising cost factors are found which might reduce the cost significantly and they are- Carrying capacity utilization, Trip per day utilization, Fuel economy, and Fuel price. Finally, an evaluation of the present supply chain performance on the basis of existing logistics fixed costs, variable costs, and grand total costs is done. In this study, rental of single bulk carrying vehicle is considered. Microsoft Excel is used to develop the simulation model.
4 PROBLEM STATEMENT This section starts with analyzing the scope of the problem which is followed by an extended description through a case provided by the company. The problem is to determine the percentage of cost reduction and total savings in BDT using four identified cost factors in comparison with the present cost model to show a pathway to reduce overall logistics cost.
International Research Journal of Engineering and Technology (IRJET) e-ISSN: 2395 -0056
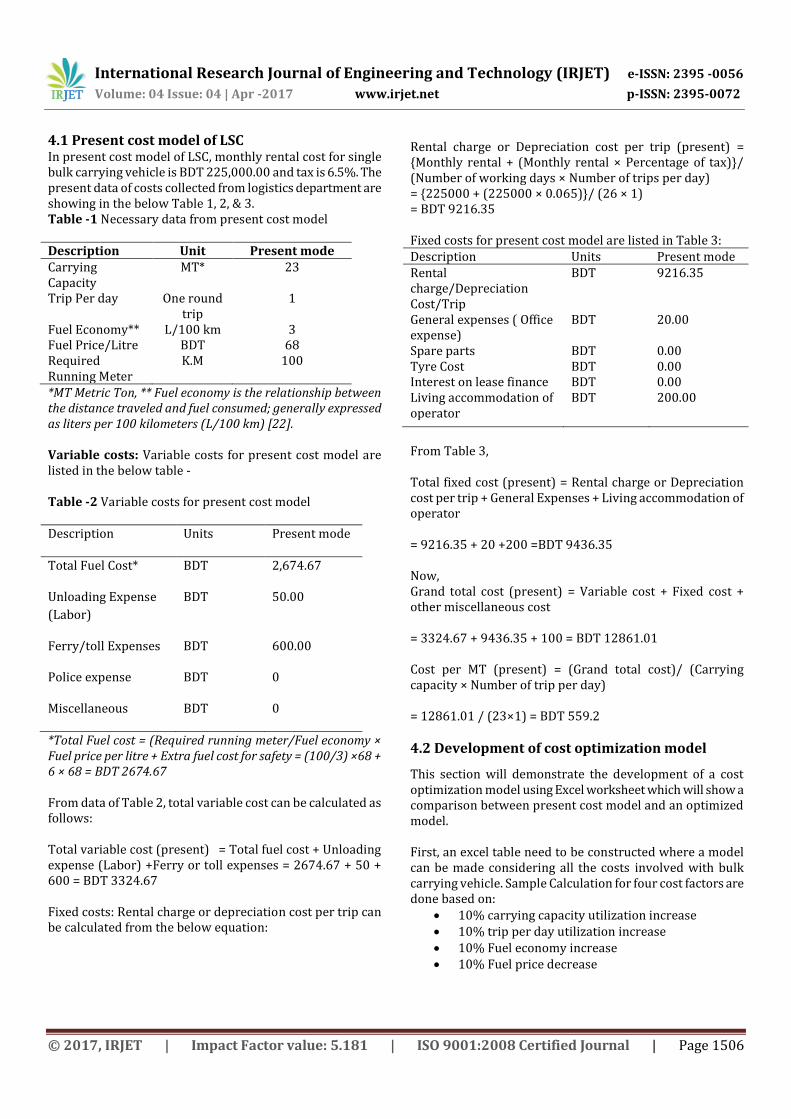
4.1 Present cost model of LSC In present cost model of LSC, monthly rental cost for single bulk carrying vehicle is BDT 225,000.00 and tax is 6.5%. The present data of costs collected from logistics department are showing in the below Table 1, 2, & 3. Table -1 Necessary data from present cost model Description Unit Present mode Carrying Capacity
MT* 23
Trip Per day One round trip
1
Fuel Economy** L/100 km 3 Fuel Price/Litre BDT 68 Required Running Meter
K.M 100
*MT Metric Ton, ** Fuel economy is the relationship between the distance traveled and fuel consumed; generally expressed as liters per 100 kilometers (L/100 km) [22]. Variable costs: Variable costs for present cost model are listed in the below table - Table -2 Variable costs for present cost model Description Units Present mode
Total Fuel Cost* BDT 2,674.67
Unloading Expense
(Labor)
BDT 50.00
Ferry/toll Expenses BDT 600.00
Police expense BDT 0
Miscellaneous BDT 0
*Total Fuel cost = (Required running meter/Fuel economy × Fuel price per litre + Extra fuel cost for safety = (100/3) ×68 + 6 × 68 = BDT 2674.67 From data of Table 2, total variable cost can be calculated as follows: Total variable cost (present) = Total fuel cost + Unloading expense (Labor) +Ferry or toll expenses = 2674.67 + 50 + 600 = BDT 3324.67 Fixed costs: Rental charge or depreciation cost per trip can be calculated from the below equation:
BDT 9216.35
General expenses ( Office expense)
BDT 20.00
Spare parts BDT 0.00 Tyre Cost BDT 0.00 Interest on lease finance BDT 0.00 Living accommodation of operator
BDT 200.00
From Table 3, Total fixed cost (present) = Rental charge or Depreciation cost per trip + General Expenses + Living accommodation of operator = 9216.35 + 20 +200 =BDT 9436.35 Now, Grand total cost (present) = Variable cost + Fixed cost + other miscellaneous cost = 3324.67 + 9436.35 + 100 = BDT 12861.01 Cost per MT (present) = (Grand total cost)/ (Carrying capacity × Number of trip per day) = 12861.01 / (23×1) = BDT 559.2
4.2 Development of cost optimization model This section will demonstrate the development of a cost optimization model using Excel worksheet which will show a comparison between present cost model and an optimized model. First, an excel table need to be constructed where a model can be made considering all the costs involved with bulk carrying vehicle. Sample Calculation for four cost factors are done based on:
10% carrying capacity utilization increase 10% trip per day utilization increase 10% Fuel economy increase 10% Fuel price decrease
Rental charge or Depreciation cost per trip (present) = {Monthly rental + (Monthly rental × Percentage of tax)}/ (Number of working days × Number of trips per day) = {225000 + (225000 × 0.065)}/ (26 × 1) = BDT 9216.35 Fixed costs for present cost model are listed in Table 3: Description Units Present mode Rental charge/Depreciation Cost/Trip
International Research Journal of Engineering and Technology (IRJET) e-ISSN: 2395 -0056
4.2.1 Considering 1st factor (Carrying capacity of vehicle)
If 10% carrying capacity is increased then,
New carrying capacity of vehicle = Previous carrying capacity + (Previous carrying capacity × percentage of increase) =23 + (23×10%) = 25.3 MT
The changes due to 10% increase of carrying capacity are shown in Table 4.
Now, from the values of Table 4, Grand Total Cost and Cost per MT can be calculated as follows:
Grand total cost (optimized) = Variable cost + Fixed cost + other miscellaneous cost
= 3324.67 + 9436.35 + 100 = BDT 12861.01
Cost per MT (optimized) = (Grand total cost)/ (New carrying capacity × Number of trip per day)
=12861.01/ (25.3 × 1) = BDT 508.3
Results considering 1st factor (Carrying capacity of vehicle):
% of cost reduction = ((Optimized cost per MT)/ (Present cost per MT)) – 1=
(508.3/559.2)– 1 = -9%
BDT per ton savings = Cost per MT before optimization – Cost per MT after optimization = 559.2 – 508.3 = BDT 50.83
If 2000 MT volume carried then- Total savings in BDT = 2000 × BDT per ton savings = 2000 × 50.83 = BDT 101668.1 Total savings in million BDT = (Total savings in BDT)/1000000=101668.1/100000= 0.10
Table -4 Changes in optimized mode for 10% increase of carrying capacity
Description Units Present Mode Optimized Mode Carrying Capacity MT 23 25.3 Trip Per day One round trip 1.00 1.00 Fuel Economy L/100 km 3.00 3.00 Fuel Price/Litre BDT 68.00 68.00 Required Running Meter K.M 100 100 Variable Cost Total Fuel Cost BDT 2,674.67 2,674.67 Unloading Expense (Labor) BDT 50.00 50.00 Ferry/toll Expenses BDT 600.00 600.00 Police expense BDT 0.00 0.00 Misc. BDT 0.00 0.00 Total Variable cost BDT 3,324.67 3,324.67 Fixed Cost Rental charge/Depreciation Cost/Trip BDT 9216.35 9216.35 General expenses ( Office expense) BDT 20.00 20.00 Spare parts BDT 0.00 0.00 Tyre Cost BDT 0.00 0.00 Interest on lease finance BDT 0.00 0.00 Living accommodation of operator BDT 200.00 200.00
Total Fixed Cost BDT 9436.35 9436.35
2.2 Considering 2nd factor (Trip utilization) If increase of 10% trip per day is considered then the changes are shown in the below table:
International Research Journal of Engineering and Technology (IRJET) e-ISSN: 2395 -0056
Table -5 Changes in optimized mode for 10% increase of trip per day Description Units Present Mode Optimized Mode Carrying Capacity MT 23 23 Trip Per day One round trip 1.00 1.1 Fuel Economy L/100 km 3.00 3 Fuel Price/Litre BDT 68.00 68 Required Running Meter K.M 100 110* Variable Costs Total Fuel Cost BDT 2,674.67 2,901.33 Unloading Expense (Labor) BDT 50.00 50.00 Ferry/toll Expenses BDT 600.00 600.00 Police expense BDT 0.00 0.00 Misc. BDT 0.00 0.00 Total Variable cost BDT 3,324.67 3,551.33 Fixed Costs Rental charge/Depreciation Cost/Trip
BDT 9216.35 8378.50
General expenses ( Office expense) BDT 20.00 20.00 Spare parts BDT 0.00 0.00 Tyre Cost BDT 0.00 0.00 Interest on lease finance BDT 0.00 0.00 Living accommodation of operator BDT 200.00 200.00 Total Fixed Cost BDT 9436.35 8598.50 Grand Total Cost BDT 12,861.01 12249.83 Cost per MT BDT 559.2 484.2 *Required running meter = Previous running meter × New trip per day = 100× (1×10%) = 110 KM Results for 10% increase of trip per day are listed in the following table: Table -6 Results (Considering 2nd factor)
Cost Optimization Factors/tools Results
% of Cost Reduction -13% Carrying capacity utilization 0% BDT/ton Savings 74.99 Trip per day utilization 10% Volume Carried (MT) 2000 Fuel Economy 0% Total Savings BDT 149,982.9 Fuel Price 0% Total Savings in mln BDT 0.15
4.2.3 Considering 3rd factor (Fuel economy) If increase of 10% fuel economy is considered then the changes are shown in table 7. Results for considering 10% increase of fuel economy are listed in the following table: Table -8 Results (Considering 3rd factor)
Cost Optimization Factors/tools Results
% of Cost Reduction -2% Carrying capacity utilization 0% BDT/ton Savings 8.96 Trip per day utilization 0% Volume Carried (MT) 2000 Fuel Economy 10% Total Savings BDT 17,918.3 Fuel Price 0% Total Savings in mln BDT 0.02
International Research Journal of Engineering and Technology (IRJET) e-ISSN: 2395 -0056
Table -7 Changes in optimized mode for 10% increase of fuel economy Description Units Present Mode Optimized Mode Carrying Capacity MT 23 23 Trip Per day one round trip 1.00 1 Fuel Economy L/100 km 3.00 3.3 Fuel Price/Litre BDT 68.00 68 Required Running Meter K.M 100 100 Variable Cost Total Fuel Cost BDT 2,674.67 2,468.61 Unloading Expense (Labor) BDT 50.00 50.00 Ferry/toll Expenses BDT 600.00 600.00 Police expense BDT 0.00 0.00 Misc. BDT 0.00 0.00 Total Variable cost BDT 3,324.67 3,118.61 Fixed Cost Rental charge/Depreciation Cost/Trip BDT 9216.35 9216.35 General expenses ( Office expense) BDT 20.00 20.00 Spare parts BDT 0.00 0.00 Tyre Cost BDT 0.00 0.00 Interest on lease finance BDT 0.00 0.00 Living accommodation of operator BDT 200.00 200.00 Total Fixed Cost BDT 9436.35 9436.35 Grand Total Cost BDT 12,861.01 12654.95 Cost per MT BDT 559.2 550.2
4.2.4 Considering 4th factor (Fuel price) Although fuel price is not under control of any company still it has an impact on the total logistics cost. If 10% fuel price is decreased then- New Fuel price per litre = Previous fuel price + (Previous fuel price × percentage of decrease) = 68 - (68×10%) = BDT 61.2 Variable Cost: Total fuel cost = ((Required running meter)/ (Fuel economy)) × Fuel price per litre + Extra fuel cost for safety = (100/3) ×61.2 + 6 × 61.2= BDT 2407.2 Unloading expense (Labor) = BDT 50 Ferry/toll expenses = BDT 600 Total variable cost = Total fuel cost + Unloading expense (Labor) + Ferry or toll expenses = 2407.2 + 50 + 600 = BDT 3057.2 Fixed Cost: Rental charge/Depreciation cost per trip = BDT 9216.35 General expense (Office expense) = BDT 20 Living accommodation of operator = BDT 200 Total fixed cost = Rental charge or Depreciation cost per trip + General expense + Living accommodation of operator = 9216.35 + 20 +200 = BDT 9436.35
Now, Grand total = Variable cost + Fixed cost + other miscellaneous cost = 3057.2 + 9436.35 + 100 = BDT 12593.55 Cost per MT = (Grand total cost)/ (Carrying capacity × Number of trip per day) =12593.55/ (23×1) = BDT 547.5 Results for considering 10% decrease of fuel price are listed in the following table:
Table 9 Results (Considering 4th factor)
Cost Optimization Factors/tools
Results
% of Cost Reduction
-2%
Carrying capacity utilization
0% BDT/ton Savings
11.63
Trip per day utilization
0% Volume Carried (MT)
2000
Fuel Economy 0% Total Savings BDT
23,258.0
Fuel Price 10% Total Savings in mln BDT
0.02
International Research Journal of Engineering and Technology (IRJET) e-ISSN: 2395 -0056
The above optimization tool shows, if 10% carrying capacity is increased then cost per MT is reduced (from BDT 559.2 to BDT 508.3) while Grand Total Cost (GTC) remain unchanged (BDT 12861.01). On the other hand, increase of 10% trip per day is increasing total variable cost but fixed cost is decreasing hence both GTC (from BDT 12,861.01 to BDT 12249.83) and cost per MT (from BDT 559.2 to BDT 484.2) is reduced. Now, increase of 10% fuel economy is reducing total variable cost while fixed cost remain same as before hence GTC (From BDT 12,861.01 to BDT 12654.95) and cost per MT (From BDT 559.2 to BDT 550.2) is reduced. Lastly, 10% decrease of fuel price is reducing total variable cost although fixed cost will remain unchanged hence GTC (from BDT 12,861.01 to BDT 12593.55) and cost per MT (from BDT 559.2 to BDT 547.5) is reduced. Generally, no company has control over fuel price but if the fuel price is decreased then overall logistics cost would be reduced significantly. Now, the percentage of cost reduction and total savings in BDT of four cost factors are listed in Table 10. Table 10 The % of cost reduction and total savings in BDT of four cost factors
Cost Factors % of cost reduction
Total savings in
BDT Carrying capacity utilization
9% 101,668.1
Trip per day utilization 13% 149,982.9 Fuel Economy 2% 17,918.3 Fuel Price 2% 23,258.0 Comparison between four cost factors on the basis of percentage of cost reduction and total savings in BDT shows in the plot of Fig 2 that among four cost factors- trip per day utilization is providing highest percentage of cost reduction and total savings in BDT for 10% increase. Also carrying capacity utilization is causing a significant amount of cost reduction for 10% increase.
Figure 2 Comparison plot of four cost factors
5.2 Discussion In this study, some key findings has come out as real fact with respect to industry practices and theoretical aspects of logistics. Full capacity utilizations of vehicles ensure low carrying/distribution cost. For example, if a vehicle with thousand kg capacity can carry exactly thousand kg goods and per trip cost is BDT 1000 then per unit carrying cost is BDT 1.00. Whereas, if it carries 800kg (less capacity utilization) then per unit cost will be BDT 1.25 which is 25% higher. So, ensuring capacity utilization is also a key factor to ensure optimization of logistics cost. LSC generally uses vehicle of 23 MT carrying capacity. If they use higher carrying capacity vehicle like 30-35 MT, they could transport higher amount of bulk cement. Besides, it will reduce the number of trips which consequently reduce the overall logistics cost. General cement carrying vehicle’s fuel economy is about 3 L/100 km. If LSC uses higher carrying capacity vehicle it will reduce the fuel cost as well as overall logistics cost. Trip utilization is one of the major factor for higher efficiency and higher responsiveness of logistics. LSC allows one trip per day as per policy. By proper scheduling and managing the obstacles they could increase the number of trips per day.
International Research Journal of Engineering and Technology (IRJET) e-ISSN: 2395 -0056
6 CONCLUSION This paper tried to show a comparison based pathway using optimization tools and techniques that a company can reduce overall logistics costs by identifying the cost factors and utilizing them properly. It is clear that carrying capacity utilization and trip per day utilization is having a tremendous impact on overall logistics cost. Also fuel economy and fuel price plays an important role on overall logistics cost. According to this study, among all four factors trip utilization is the most feasible solution for LSC. Although, Scheduling and routing optimization was not considered in this research. In future, with proper scheduling and proper route optimization, trip utilization could be achieved more effectively.
7 FURTHER RESEARCH DIRECTION This optimization model is developed based on four cost factors. In future, more cost factors might be included. This model is developed for single rented bulk carrying vehicle. Owned vehicle might also be taken into account. In this study, Microsoft Excel is used to develop the model which may also be done in Matlab optimization tools. All four cost factors were not considered all together as it is not easy for a company to achieve control over all the four factors together at a time. Further research might be conducted on that. REFERENCES [1] Pragnya Parimita Mishra, Kunal Sharma, “Inventory and Logistics Cost Optimization in Automobile Industry”, International Journal of Engineering Research and Applications (IJERA), ISSN: 2248-9622, Vol. 3, Issue 4, Jul-Aug 2013, pp.1632-1635. [2] Muztoba Ahmad Khan, “Transportation Cost Optimization Using Linear Programming”, International Conference on Mechanical, Industrial and Energy Engineering 2014, ICMIEE-PI-140224. [3] CSCMP’s Definition of Logistics Management retrieved September 17, 2016, from http://cscmp.org/aboutcscmp/definitions.asp [4] Amy Z. Zeng, Christian Rossetti, “Developing a framework for evaluating the logistics costs in global sourcing processes An implementation and insights”, International Journal of Physical, Distribution & Logistics Management, Vol. 33 No. 9, 2003, pp. 785-803. [5] Bourlakis, C., & Bourlakis, M. (2005). Information technology safeguards, logistics asset specifi city and fourth-party logistics network creation in the food retail chain. Journal of Business & Industrial Marketing, 20(2), 88-98. [6] Norek, C. D. (1997). Mass merchant discounters: drivers of logistics change. Journal of Business Logistics, 18, 1-18. [7] Parkan, C., & Dubey, R. (2009). Recent developments in the practice of supply chain management and logistics In India. Portuguese Journal of Management Studies, 14(1), 71-88.
[8] Dröge, C., Germain, R., & Stock, J. R. (1991). Dimensions underlying retail logistics and their relationship to supplier evaluation criteria. International Journal of Logistics Management, The, 2(1), 19-25. [9] Olavson, T., Lee, H., & DeNyse, G. (2010). A portfolio approach to supply chain design. Supply Chain Management Review, 14(4). [10] Tracey, M. (2004). Transportation effectiveness and manufacturing firm performance. International Journal of Logistics Management. 15(2), 31-50. [11] Jayaraman, V., & Luo, Y. (2007). Creating competitive advantages through new value creation: a reverse logistics perspective. The Academy of Management Perspectives, 21(2), 56-73. [12] Zeng, A. Z., & Rossetti, C. (2003).Developing a framework for evaluating the logistics costs in global sourcing processes: An implementation and insights. International Journal of Physical Distribution & Logistics Management, 33(9), 785-803. [13] Eilon, S., Watson-Gandy, C. D. T., & Christofi des, N. Distribution management: mathematical modelling and practical analysis. 1971. Griffi n, London. [14] Bodin, L.D., Golden, B.L., Assad, A.A., and Ball, M.O. (1983), "Routing and scheduling of vehicles and crews. The state of the art", Computers and Operations Research 10, 69-211. [15] P. McCann, “A proof of the relationship between optimal vehicle size, haulage length and the structure of distance-transport costs,” Transportation Research Part A: Policy and Practice, vol. 35, no. 8, pp. 671–693, 2001. View at Publisher · View at Google Scholar · View at Scopus [16] C. Pilot and S. Pilot, “A model for allocated versus actual costs in assignment and transportation problems,” European Journal of Operational Research, vol. 112, no. 3, pp. 570–581, 1999. View at Publisher · View at Google Scholar · View at Zentralblatt MATH · View at Scopus [17] A. Jha, K. Somani, M. K. Tiwari, F. T. S. Chan, and K. J. Fernandes, “Minimizing transportation cost of a joint inventory location model using modified adaptive differential evolution algorithm,” International Journal of Advanced Manufacturing Technology, vol. 60, no. 1–4, pp. 329–341, 2012. View at Publisher · View at Google Scholar · View at Scopus [18] S. Chanas and D. Kuchta, “A concept of the optimal solution of the transportation problem with fuzzy cost coefficients,” Fuzzy Sets and Systems, vol. 82, no. 3, pp. 299–305, 1996. View at Publisher · View at Google Scholar · View at MathSciNet [19] S. Prakash, P. Kumar, B. V. N. S. Prasad, and A. Gupta, “Pareto optimal solutions of a cost-time trade-off bulk transportation problem,” European Journal of Operational Research, vol. 188, no. 1, pp. 85–100, 2008. View at Publisher · View at Google Scholar · View at MathSciNet · View at Scopus [20] A. Ojha, S. K. Mondal, and M. Maiti, “Transportation policies for single and multi-objective transportation problem using fuzzy logic,” Mathematical and Computer
International Research Journal of Engineering and Technology (IRJET) e-ISSN: 2395 -0056
Modelling, vol. 53, no. 9-10, pp. 1637–1646, 2011. View at Publisher · View at Google Scholar · View at Zentralblatt MATH · View at Scopus [21] Sahyouni, K., Savaskan, R. C., & Daskin, M. S. (2007). A facility location model for bidirectional fl ows. Transportation Science, 41(4), 484-499. [22] Wikipedia’s definition of Fuel economy retrieved September 17, 2016, from https://en.wikipedia.org/wiki/Fuel_economy_in_automobiles
BIOGRAPHIES
Amit Das is M.Sc. Final year student of IPE department at BUET, Bangladesh
Tasminur Mannan Adnan is M.Sc. Final year student of IEM department at University of Oulu, Finland
Md. Sajid Hasan is an Assistant Engineer at Walton Group
Kazi Mushfiqur Rahman is Deputy General Manager at PRAN-RFL Group