Abstract As information processing applications take greater roles in our everydaylife, database management systems (DBMSs) are growing in importance. DBMSs havetraditionally exhibited poor cache performance and large memory footprints, there-fore performing only at a fraction of their ideal execution and exhibiting low processorutilization. Previous research has studied the memory system of DBMSs on research-based simultaneous multithreading (SMT) processors. Recently, several differenceshave been noted between the real hyper-threaded architecture implemented by the IntelPentium 4 and the earlier SMT research architectures. This paper characterizes theperformance of a prototype open-source DBMS running TPC-equivalent benchmarkqueries on an Intel Pentium 4 Hyper-Threading processor. We use hardware countersprovided by the Pentium 4 to evaluate the micro-architecture and study the memorysystem behavior of each query running on the DBMS. Our results show a performanceimprovement of up to 1.16 in TPC-C-equivalent and 1.26 in TPC-H-equivalent queriesdue to hyperthreading.
Keywords Performance · Data management systems · Hyper-threadedarchitectures · Databases · Simultaneous multithreading
W. M. Hassanein (B) · L. K. RashidDepartment of Electrical and Computer Engineering, University of Calgary, Calgary, AB, Canadae-mail: [email protected]
M. A. HammadDepartment of Computer Science, University of Calgary, Calgary, AB, Canadae-mail: [email protected]
123
Int J Parallel Prog (2008) 36:206–225 207
1 Introduction
Information Management Systems are gaining importance as various types of dataacquisition and information processing applications play larger roles in our everydaylife. A database management system (DBMS) is a typical information managementsystem that continuously evolves to meet the new application demands and hardwarecapabilities. Therefore, re-evaluating the DBMS’s performance is significant to boththe computer architecture and database communities. Previous studies have shownthat DBMS exhibits high cache miss rates and low CPU utilization [1]. SimultaneousMultithreading (SMT) [2] is a form of hardware multithreading, where a single physi-cal multithreaded processor can execute multiple threads concurrently. The resourcesof a multithreaded processor are either shared among the threads, duplicated for eachthread, or partitioned between the two threads compared to a non-multithreaded pro-cessor. Recently, SMT microprocessors have appeared in commercial machines (e.g.,the IBM� Power 5, the Intel� Xeon, and the Intel� Pentium� 4 Hyper-threadingprocessor, a dual thread general purpose SMT processor). This has allowed SMTresearch to move from simulation-based studies to real hardware studies. Further-more, the availability of real SMT processors allows for validating previous simulationresults against new experimental results on real hardware. At the data managementside, recent studies in hardware-aware data management focus on specific data oper-ations such as sorting [3], data mining algorithms [4], and query pipelines [5]. Thesestudies provide interesting technologies to improve various data management com-ponents by utilizing new hardware features. However, to the best of our knowledge,no characterization study exists of a complete DBMS system using SMT processors.Such study is inevitable to realistically evaluate a sophisticated and an integral systemas DBMS.
In conventional DBMSs the implementation support of database workloads (e.g.,concurrent database transactions) is inherently multithreaded. In this implementationa thread is created for each client’s transaction.1 The intuition is to improve perfor-mance by utilizing the underlying thread mechanism provided by the operating system.This is further improved by using symmetric multi-processors (SMP) architectures.SMP provides a means to scale up DBMS to support an increased number of con-current transactions. Alternatively, SMT architectures introduce a novel opportunityto achieve scalability by sharing resources (e.g., a CPU-pipeline and Caches). Eitherused with or without SMP, SMT is expected to improve performance for applicationsthat inherently support sharing techniques. DBMS currently supports several formsof sharing; for example, sharing index structures such as B+-trees among concurrentuser accesses [6]. However, sharing in conventional DBMSs focuses largely on themain-memory system. Moreover, exploiting hardware sharing, which is now providedby SMT architectures, using software sharing approaches is not adequately studied inthe literature. An essential approach of this study is to first characterize the perfor-mance of database concurrent workloads such as TPC-C [http://www.tpc.org/tpcc/]and TPC-H [http://www.tpc.org/tpch/] on a real SMT processor.
1 Parallel databases provide intra-transaction forms of parallelism, which are beyond the scope of thispaper.
This paper focuses on studying the performance of an open source DBMS usingTPC-C-equivalent and TPC-H-equivalent benchmarks on the Intel Pentium 4 Hyper-threading processor. We analyze and compare the performance of a TPC-C micro-benchmark, namely uTPC-C [7], and a TPC-H micro-benchmark, namely uTPC-H[7] on the PostgreSQL DBMS [8]. We compare the effects of hyperthreading on theDBMS performance by switching the hyper-threading feature of the processor on andoff through the BIOS. The rest of the paper is organized as follows: Section 2 discussesrelated work. Section 3 describes the experimental methodology. In Sect. 4 we pres-ent the uTPC-C experimental results. In Sect. 5 we present the uTPC-H experimentalresults. Finally, conclusions are provided in Sect. 6.
2 Related Work
This section presents an overview of several related work on workload characteriza-tion of DBMSs, as well as characterization studies of the Pentium 4 processor and theSMT architecture using various applications.
The behavior of Oracle DBMS using OLTP and DSS has been studied by Lo et al.[9] on a simulated SMT processor. They conclude that severe cache conflicts occurusing conventional virtual memory management and propose a new page placementpolicy. Further research [1,9,10] shows that 50–80% of the execution time in databaseworkloads is wasted waiting for instructions and data. Several papers have character-ized DBMS on SMP architectures such as the Pentium pro SMP systems [1,11]. Incontrast, this paper addresses the performance of DBMS on a real SMT architecture.
Unfortunately, the study of a data management system is hindered by several fac-tors. First, TPC benchmarks for most state-of-the-art database systems are not readilyavailable for researchers. Second, OLTP and DSS workloads are difficult to configurerequiring fine tuning of configuration parameters. Third, most TPC workloads usedin architecture simulation studies are scaled down versions of TPC-C and TPC-H thatfit the working set in memory to eliminate disk I/Os. These factors have led to severalstudies proposing TPC equivalent benchmarks. Keeton and Patterson [12] proposea technique for evaluating database workloads “micro-benchmark”. Recent research[7] proposes micro-benchmarks for TPC-C (uTPC-C) and TPC-H (uTPC-H). Shaoet al. [7] compare the uTPC-C and uTPC-H performance characteristics to a full scaleTPC-C and TPC-H from IBM, respectively and verify that the performance charac-teristics of the uTPC-C and the TPC-C are equivalent as well as the uTPC-H andTPC-H. This study uses the Pentium III and Pentium 4 machines while varying theselectivity (filtering capability) of the database queries. The authors conclude that at a0.1% selectivity uTPC-C gives the most representative performance when comparedto full scale TPC-C. uTPC-H is composed of two benchmark queries uSS and uNJwith 10% and 20% selectivity, respectively as the most representative performance.Hankins et al. [13] study the scaling of database OLTP workloads while varying thenumber of processors in an SMP, and the number of clients and warehouses of theOLTP benchmark. The study shows that on small scale multiprocessors the L3 cachemisses represent the largest impediment to performance. Due to the unavailability ofreliable TPC-C and TPC-H benchmarks for the PostgreSQL database, and to allow
123
Int J Parallel Prog (2008) 36:206–225 209
for detailed analysis by reducing the TPC-C and TPC-H complexity, we have chosento use the uTPC-C with 0.1% selectivity and uTPC-H (uSS with 10% selectivity anduNJ with 20% selectivity) for our workload characterization.
Although several characterization studies have been done on the Pentium 4 pro-cessor [14–17], none of them has addressed DBMSs. Tuch et al. [17] measure theperformance of SPEC2000 on the Intel Pentium 4 processor. Their results show aspeedup of 1.2 on the multi-programmed SPEC2000 and a speedup of 1.24 on aparallel workload. A related work [15] confirms the SPEC2000 results [17] and com-pares SMT to SMP SPEC2000 performance, showing a better throughput for SMPas expected. Wei Haung et al. [16] characterize the performance of Java applicationson Intel Pentium 4 hyper-threading processors. Blackburn study the performance ofgarbage collection on multithreading by using some of the Pentium 4 performancecounters [14].
Other characterization studies include; Chen et al. [18] evaluate the performance ofmulti-media applications on SMT processors and compare SMT versus SMP systems.The impact of SMT on network servers using the Intel Xeon processor [19] showsthat enabling SMT produces only slight performance gains and can sometimes leadto performance loss. A characterization of SMT in the IBM Power 5 machine [20]shows that the biggest single factor affecting SMT gain is the effect of load and storeactivities. Workloads with high load latencies tend to have low SMT gain. To the bestof our knowledge no previous work has characterized a benchmark database workloadon a real Hyper-threaded Pentium 4 processor.
3 Experimental Methodology
3.1 Experimental Platform
All experiments are run on a single 3.4 GHz Pentium 4 Hyper-threading processorwith a 2 MB on chip L2 cache, and a 1 GB 533 MHz DDR2 SDRAM memory. Theoperating system used is the Scientific Linux version 4.1 (Based on Redhat LinuxEnterprise version 4.0) and running the Linux 2.6.14 kernel. The Pentium 4 uses a12 K micro-operation (uops) L1 instruction trace cache, and a 64 KB L1 data cache.The machine has an 800 MHz front side bus and a 160 GB SATA, 7200 RPM hard diskdrive.
The Pentium 4 Hyper-threading processor is a deeply pipelined out-of-order proces-sor capable of running two threads concurrently. The L1 instruction trace cache (TC)is an 8-way set associative cache, with a least recently used (LRU) replacement policy,and a 6 micro-operations (uops) line size. The L1 TC is shared among the two threads,and is accessed in an alternating fashion (round-robin). The instruction decoder is alsoshared and accessed in a similar manner. Per cycle, 3 uops can be fetched from thetrace cache, 6 uops can be executed, and 3 uops can be retired. The pipeline is 20 stagesdeep. The re-order buffer (ROB) and the load and store buffer are statically divided inhalf between the two threads. This allows program order to be tracked separately perthread. However, it reduces the single thread performance. The branch history bufferis duplicated, while the global history array is shared. The branch predictor has a
123
210 Int J Parallel Prog (2008) 36:206–225
misprediction penalty of 20 cycles. The ITLB is duplicated while the DTLB is shared.The two threads share most of the other resources including the caches, the execu-tion units, and the buses. Hyperthreading is turned on/off through the system BIOS.Turning hyperthreading off allows the single thread to use all processor resources thatwould otherwise be available to the two Hyper-threaded threads. Using the LMbenchtool [21], we measure the memory hierarchy latencies to be 1.18 ns, 8.26 ns, 137.9 nsfor L1 cache, L2 cache, and memory latencies, respectively.
3.2 Benchmarks
All experiments are run on the PostgreSQL open-source DBMS version 8.1.3 and usingthe uTPC-C (OLTP) Benchmark [7] and the uTPC-H (DSS) Benchmark [7]. Specif-ically, we use PostgreSQL for the following two main reasons: First, PostgreSQLincludes optimized implementations of various data management functionalities suchas query processor, index manager, buffer manager, and storage manager. Furthermore,PostgreSQL SQL (Structured Query Language) implementation strongly conforms tothe ANSI-SQL 92/99 standards, which is the latest SQL standard that is currentlyimplemented in industrial-strength DBMSs. Second, being an open-source systemfacilitates problem tracking, identification, and resolution at both the architecture anddata management sides, and therefore opens opportunities for future research.
We use a TPC-C equivalent workload (uTPC-C) as presented by Shao et al. [7]. TheSQL representation of the query is shown in Fig. 1a. This query takes a file as an inputand produces a file as an output. The input file is T1 that stores one million records.Each record in T1 consists of multiple fields such as a1, a2, a3, etc. The output filefrom the query is RESULT. The query includes a database selection operation thatfilters the scanned records from T1 and returns only records that satisfy the predicate(WHERE Lo<a2<Hi). The percentage of output records to input records is referredto as the selectivity of the predicate. This query uses a 0.1% selectivity, which givesthe highest accuracy by Shao et al. [7]. Before storing the output, the query calculatesthe average of the a3 field across all records that satisfy the predicate condition. Thisfinal average is stored in the output file RESULT.
Figure 1a gives the SQL query and Fig. 1b gives its physical implementation. Thephysical implementation of this query by DBMS is a pipeline of physical operations.For example, one physical implementation of the benchmark query is as a pipelineof a SCAN operation (to scan T1), a selection operation (to apply the predicate andproduce qualifying records), an aggregate operation (to calculate average over quali-fied records), and a final write operation to the output file (that writes the average toRESULT). In most DBMS a data structure is used to speed up scanning and selectingfrom a file. This data structure is referred to as INDEX and is used by PostgreSQLto access T1. Therefore, the physical implementation of the query by PostgreSQLincludes the following operations: (1) an operator (BITMAP INDEX SCAN), Op1, thatscans the INDEX to find records in T1 that satisfy the predicate and return references(i.e., pointers) of these records. (2) An operator (BITMAP HEAP SCAN), Op2, thataccepts as input the references from Op1 and retrieves the referenced records. (3)An operator (AGGREGATE), Op3, that accepts as input the referenced records and
calculates the average over a2. (4) Finally, an operator (SELECT), Op4, that storesthe final average in RESULT. The lock/storage managers in Fig. 1b manage the com-munication among the physical query operations and the stored files and indexes.For example, the lock/storage managers provide locks over input files during queryexecution to prevent other users from updating the files.
Although widely-adopted in benchmarking online transaction processing (OLTP)applications, the TPC-C benchmark represents a workload with limited data access.To explore workloads with complex data access patterns, we use concurrent queriesfrom decision support systems (DSS). TPC-H is a typical benchmark of DSS andwe use TPC-H equivalent workloads queries (uTPC-H) as presented by Shao et al.[7]. uTPC-H contains two query workloads, uSS and uNJ. Figure 2 gives the SQLrepresentations and the physical execution plans of uSS and uNJ, respectively.
The uSS query produces a set (i.e., no duplicates) of records that satisfy a filteringcondition. uSS includes FILE SCAN, SORT, and DUPLICATE-ELIMINATION opera-tions. The FILE SCAN operation scans a file of size 1 million records and selects onlytuples with a2 between 9,999 and 12,000 (these values are chosen to achieve 10% selec-tivity and to maintain the TPC-H equivalence [7]. The SORT operation is required tospeed-up the parent operation in the execution pipeline (i.e., the DUPLICATE-ELIM-INATION operation). The DUPLICATE-ELIMINATION operation guarantees that theoutput records are not repeated in the final result. Since no indexes are used for uSS,the expectation is that the FILE SCAN operation, which sequentially scans one millionrecords, will experience the longest delay. The DUPLICATE-ELIMINATION opera-tion will block waiting for the SORT operation to finish sorting 10% of the recordsor 100,000 records. Next, the DUPLICATE-ELIMINATION operation will scan thesorted records and will release a record, say r, if r is firstly scanned.
The uNJ query correlates two tables (i.e., T1 and T2) to find records that satisfy bothof the following conditions: (1) a record from T1 must have a value of the field a1 that
123
212 Int J Parallel Prog (2008) 36:206–225
(a)
AGGREGATE
NESTED JOIN
Index
Lock/Storage Managers
INDEX SCAN
T2: 1M Records
DUPLICATE-ELIMINATION
SORT
FILE SCAN
Lock/Storage Managers
1M Records
INSERT INTO Result SELECT distinct (a3) FROM T1 WHERE Lo < a2 < Hi ORDER BY a3
FILE SCAN
T1: 1M Records
INSERT INTO Result SELECT avg (T1.a3) FROM T1, T2 WHERE T1.a1=T2.a1 AND Lo < T1.a2 < Hi
(b)
Fig. 2 (a) uSS SQL query and its implementation. (b) uNJ SQL query and its implementation
is similar to the value of the field a1 in a record from T2; (2) a record from T1 must sat-isfy a selection condition. Next, uNJ calculates the average over the correlated-records.The execution plan of uNJ includes the following operations: a FILE SCAN operationover T1, an INDEX SCAN operation over T2, a NESTED JOIN operation, and finallyan AVERAGE operation. FILE SCAN and INDEX SCAN are similar to the correspond-ing operations in uSS and µTPC-C, respectively. The NESTED JOIN operation scans,for every output record from the FILE SCAN operation, all records produced by theINDEX SCAN operation, which have similar values. Finally, the AVERAGE operationwill calculate the average over all output records from the NESTED JOIN operation.
In the experiments we vary the concurrency of workload queries between 1 and 10in intervals of 2. As pointed out in previous research [5,22], modern DBMSs manageto hide I/O latency by various approaches such as partitioning data on multiple disksand perfecting records in memory-space. In our experiments we use a warm-up queryto hide disk I/O latency. Therefore, our reported results represent only the CPU andmemory overhead.
3.3 Tools for Performance Measurements
The Pentium 4 is equipped with 18 performance counters that allow us to monitor48 events at the architecture level. These events include cache misses, TLB misses,branch mispredictions, etc. We use the Intel Vtune performance analyzer for Linux[23] to take our measurements unless otherwise noted. We use the Event-Based Sam-pling feature of the Vtune performance analyzer to collect our data. We use the systemBIOS to turn hyperthreading on and off.
123
Int J Parallel Prog (2008) 36:206–225 213
4 uTPC-C Results
This section examines the effects of hyperthreading on the performance of the uTPC-Cdatabase benchmark running on the PostgreSQL database. The Linux operating systemconsiders a hyper-threaded machine with hyperthreading turned on as a two processormachine. Therefore, a single hyperthreaded (dual threads) SMT physical processor isconsidered by the Linux operating system as two logical processors (P0 and P1). Ina hyperthreaded-off machine the physical processor is seen as only a single logicalprocessor.
PostgreSQL generates a new postgres process for each query run. This postgresprocess contains several modules, including the postgres module, as well as otheroperating system modules such as vmlinux, etc. To measure the effects of the bench-mark query apart from other factors in the operating system, the results presented inthis paper are of the postgres module within the postgres process.
We achieve concurrent execution by running several versions of the uTPC-C bench-mark query in parallel and thus representing several clients connecting to PostgreSQL.PostgreSQL generates a thread for each client.
To increase our accuracy and reduce variations per run we use 100 uTPC-C queryruns and take the average for each measurement. The GNU time command in additionto Vtune is used to measure the time of each run. Vtune results are obtained by run-ning the 100 uTPC-C query five times, eliminating the outliers and taking the average.The details of the operators used in the query and their timing is obtained using theEXPLAIN ANALYZE command of PostgreSQL.
The uTPC-C benchmark query exhibits a CPI (cycles per instruction) of 1.81 anda non-halted CPI of 1.54. The Pentium 4 decodes each instruction into several micro-operations (uops). The ratio of uops to instructions in the uTPC-C benchmark is 1.6uops/instruction. Table 1 gives the instruction mix of the uTPC-C benchmark. Memoryinstructions constitute 57% of all instructions.
4.1 Speedup
Figure 3a gives the actual run time of the benchmark queries at various concurrencylevels. The run time is measured using the GNU time command. For each measure-ment we run a 100 uTPC-C query ten times and take the average. We compare the runtime when hyperthreading is turned on (HT) versus turned off (O). Our results showa performance improvement due to hyperthreading up to 1.16. We increase concur-rency by running more threads (where the number 10 refers to 10 threads in parallel).
Fig. 3 (a) Speedup due to hyprethreading (O = HT-off, HT = HT-on). (b) Instruction distribution betweenthe two threads in hyprethreading (O = HT-off, HT-P0 = HT-on logical processor 0, HT-P1 = HT-on logicalprocessor 1)
Although, for HT, a slight performance improvement is seen when running a singlethread (on average) the standard deviation interval of both HT and O overlaps for asingle thread. Thus indicating that either a slight improvement or a slight slow downis possible using a single thread. As we increase the concurrency, HT achieves a clearperformance improvement over O.
4.2 Instruction Distribution
Figure 3b gives the instruction distribution per logical processor. The total number ofinstructions of O vs. HT is approximately the same, with a slight increase in the num-ber of retired instructions in some of the HT cases with a maximum of 2%. Our resultsshow that in HT the instructions are divided between the two threads almost equally(with the exception of concurrency 2), with an increase in the number of instructionsgiven to P0 in all cases.
4.3 Cache Behavior
In SMT architectures the cache hierarchy is shared among all the thread contexts. Thisis also the case in the Intel Pentium 4 hyper-threaded architecture, where both threadsshare the L1 instruction trace cache, the L1 data cache, and the unified L2 cache.This sharing can be either beneficial, if for example one thread prefetches data forthe other, or detrimental, if one thread conflicts with the other causing a large numberof cache misses. Lo et al. [9] show that SMT introduces severe cache conflicts forOn-line transaction processing (OLTP) database queries using conventional virtualmemory management. Both beneficial and detrimental patterns have been reported onthe Intel Pentium 4 hyper-threaded processor L1 and L2 caches for Java Applications[16]. Beneficial patterns for L2 cache and detrimental patterns for L1 cache in networkservers [19] have been reported on the Intel Xeon hyper-threaded processor. Figure 4agives the L1 data cache miss rate for load instructions. We compare the miss rates withhyperthreading turned on versus off. We can see that we exhibit a detrimental effect
123
Int J Parallel Prog (2008) 36:206–225 215
L1-D$ Load Miss Rate
0%1%2%3%4%5%6%7%8%9%
10%
1Concurrency
O HT L2$ Load Miss Rate
0%2%4%6%8%
10%12%14%16%18%20%
O HT
2 4 6 8 10 1Concurrency
2 4 6 8 10
(a) (b)
Fig. 4 (a) L1 load data cache miss rate (O = HT-off, HT = HT-on). (b) L2 cache load miss rate (O = HT-off,HT = HT-on)
L1-I Trace Cache Miss Rate
0.0%
0.1%
0.2%
0.3%0.4%
0.5%0.6%
0.7%0.8%
0.9%
1Concurrency
O HT O HTITLB Miss Rate
0%
5%
10%
15%
20%
25%
2 4 6 8 10 1Concurrency
2 4 6 8 10
(a) (b)
Fig. 5 (a) L1 instruction trace cache miss rate (O = HT-off, HT = HT-on). (b) ITLB miss rates (O = HT-off,HT = HT-on)
at the L1 data cache level. This result is similar to those seen on network servers onthe Xeon processor [19]. The increase in the L1 data cache load miss rate ranges from3.5% to 5.4% (excluding the single thread case).
Figure 4b gives the L2 load cache miss rates. Our results show that hyperthread-ing reduces the L2$ load data miss rates significantly, sometimes up to 66%. Thisindicates that sharing data occurs at the L2$ level. Moreover, the L2$ read miss rates(instruction and data) are also reduced sometimes by over 67%. This is potentiallydue to our large L2 cache (2MB) that could reduce potential conflicts amongthreads. This reduction in the L2 $ miss rates is the major contributor of the hyper-threading speedup. Figure 5a gives the L1 instruction trace cache miss rates. The IntelPentium 4 processor has a 12Kuops instruction trace cache. Our results show that turn-ing hyperthreading on increases the instruction trace cache miss rates. Although theabsolute values of the trace cache misses are small, this result conflicts with previousdatabase studies [9] showing a reduction in the instruction cache miss rates by up to35% due to SMT sharing. The difference in results is due to the differences in theSMT architectures, while previous studies [9] use an SMT simulator with 8 contextsand no trace cache, we use a real 2 context hyper-threaded architecture with a tracecache as the L1 instruction cache.
123
216 Int J Parallel Prog (2008) 36:206–225
DTLB Load Miss Rate
0.0%
0.5%
1.0%
1.5%
2.0%
2.5%
3.0%
3.5%
4.0%
4.5%(a) (b)
1Concurrency
O HT O HT
Branch Misprediction Rate
0.0%
0.5%
1.0%
1.5%
2.0%
2.5%
3.0%
3.5%
2 4 6 8 10 1Concurrency
2 4 6 8 10
Fig. 6 (a) DTLB miss rates (O = HT-off, HT = HT-on). (b) Branch misprediction rates (O = HT-off,HT = HT-on)
4.4 TLB Misses
The Data TLB (DTLB) is used to translate the data logical addresses into physicaladdresses. The DTLB is shared between the two threads in the Intel Pentium 4. TheInstruction TLB (ITLB) is accessed on an instruction trace cache miss so as to trans-late the instruction logical addresses into physical addresses to access the L2 cache.Figures 5b and 6a give the ITLB miss rates and the DTLB miss rates, respectively.Our results show that hyperthreading increases the DTLB miss rates, while it reducesITLB miss rates. This is because the DTLB is shared among threads while the ITLBis duplicated and therefore reduces conflicts.
4.5 Branch Mispredictions
Figure 6b gives the branch misprediction rates. Our results show a slight increase in thebranch misprediction rates due to hyperthreading (0.34% maximum). In the Pentium4 hyper-threaded architecture the branch history buffer is duplicated, while the globalhistory array is shared. A mispredicted branch has a 20 cycle penalty.
4.6 Performance Impact
To further understand the importance of the different processor parts on the perfor-mance of uTPC-C, we plot the non-overlapped CPI stall component in Fig. 7a. Thisstall component represents the non-overlapped stall cycles per instruction and does nottake into account cycle overlapping during execution, which can affect the measuredperformance. Each stall component is computed by multiplying the cycles per missby the miss per instruction. Our results show that the major stall cycle componentsare those of the L2 cache misses followed by the L1 data cache. ITLB has almost noeffect while DTLB, L1 instruction trace cache, and branch mispredictions have smalleffects. Using HT reduces the L2 cache stall component which is the major cause ofthe speedup.
123
Int J Parallel Prog (2008) 36:206–225 217
0
0.2
0.4
0.6
0.8
1
1.2
1.4
1.6
1.8
(a) (b)
O
1 2 4 6 8 10
L1-D L2-D ITLB DTLB L1-I Br MispExecution Time
0.0E+00
5.0E+08
1.0E+09
1.5E+09
2.0E+09
2.5E+09
O-1
PinBuffer
HeapTupleSatisfiesSnapshot
tbm_comparator
tbm_iterate
LWLockAcquire
heap_release_fetch
hash_searchH0 H1 O H0 H1 O H0 H1 O H0 H1 O H0 H1 O H0 H1HT-1 O-10 HT-10
Fig. 7 (a) Non-overlapped CPI stall component (O = HT-off, H0 = HT-P0, H1 = HT-P1). (b) Executiontime of the seven most time consuming functions in uTPC-C (O-10 = HT-off 10-threads, HT-10 = HT-on 10threads)
4.7 Function Analysis
To further understand the functions responsible for the performance of uTPC-C, Fig. 7bgives the execution time distribution of the seven most time consuming functions whichare:
– hash_search: Hash tables are widely used by DBMS’s functions. This function isa hash search.
– heap_release_fetch: This function retrieves records from the storage memorybuffer.
– LWLockAcquire: To read a memory entry, DBMS must get a shared lock first,which is obtained by this function.
– tbm_iterate and tbm_comparator: handle bitmap heap and indexes.– HeapTupleSatisfiesSnapshot: used in logging and recovery.– PinBuffer: fixes a buffer in memory to avoid replacement by the buffer manager.
Our results show that the performance of several functions is improved due tohyperthreading including the heap_release_fetch and the LWLockAcquire functions.The heap_release_fetch function is the most critical function for L2 cache missescontributing 72% of all the L2 cache misses. The performance improvement of thisfunction is primarily due to the improvement of its L2 cache misses, which are reducedby 28% due to hyperthreading in a 10 thread concurrency. Although these functions arelinked to a specific DBMS implementation (i.e., PotgreSQL), the high level function-alities of these functions are the same in major industrial strength DBMSs. Therefore,the insights obtained from the performance of these functions during HT and O are ofsignificant importance to DBMS performance characterization.
5 uTPC-H Results
This section examines the effects of hyperthreading on the performance of the uTPC-Hdatabase benchmark running on the PostgreSQL database. The uTPC-H benchmark
123
218 Int J Parallel Prog (2008) 36:206–225
consists of two queries; a sequential scan query with sort (uSS) and a join query (uNJ).We use the same measurement techniques for uTPC-H as those used in uTPC-C.
The uSS benchmark query exhibits a CPI (cycles per instruction) of 1.55 and anon-halted CPI of 1.53 while the uNJ benchmark query exhibits a CPI of 2.04 and anon-halted CPI of 2.0. The ratio of uops to instructions in the uSS benchmark is 1.65uops/instruction and in the uNJ benchmark is 1.62 uops/instruction. Table 2 gives theinstruction mix of the uTPC-H benchmark. Memory instructions constitute 65% inuSS and 60% in uNJ of all instructions.
5.1 Speedup
Figure 8 gives the actual run time of the uSS and uNJ benchmark queries at variousconcurrency levels. The run time is measured using the GNU time command. For eachmeasurement we run a uSS or a uNJ query twenty to thirty times depending on thevariability and take the average. We compare the run time when hyperthreading isturned on (HT) versus turned off (O). Our results show a performance improvementdue to hyperthreading up to 1.10 in uSS and 1.26 in uNJ. We increase concurrency byrunning more threads (where the number 10 refers to 10 threads in parallel). For uSSHT, a slight performance degradation (3%) is seen when running a single thread. Aswe increase the concurrency, HT achieves a clear performance improvement over Oin both uSS and uNJ.
Table 2 uTPC-H (uSS anduNJ) instruction mix
Instruction type uSS instruction mix uNJ instruction mixpercentage (%) percentage (%)
Fig. 8 uTPC-H speedup due to hyprethreading (O = HT-off, HT = HT-on)
123
Int J Parallel Prog (2008) 36:206–225 219
Instructions
0.0E+00
2.0E+09
4.0E+096.0E+09
8.0E+09
1.0E+10
1.2E+101.4E+10
1.6E+10
1.8E+10(a) (b)
1Concurrency
O HT-P0 HT-P1 O HT-P0 HT-P1
Instructions
0.0E+00
5.0E+09
1.0E+10
1.5E+10
2.0E+10
2.5E+10
3.0E+10
3.5E+10
uSS uNJ
2 4 6 8 10 1Concurrency
2 4 6 8 10
Fig. 9 Instruction distribution between the two threads in hyprethreading (O = HT-off, HT-P0 = HT-onlogical processor 0, HT-P1 = HT-on logical processor 1)
L1-D$ Load Miss Rate
0%
1%
2%
3%
4%
5%
6%
(a) (b)
1
Concurrency
O HT O HTL1-D$ Load Miss Rate
0%
1%2%
3%4%
5%
6%7%
8%9%
10%
uSS uNJ
2 4 6 8 10 1Concurrency
2 4 6 8 10
Fig. 10 L1 load data cache miss rate (O = HT-off, HT = HT-on)
5.2 Instruction Distribution
Figure 9 gives the instruction distribution per logical processor. The total number ofinstructions of O vs. HT is approximately the same, with a slight increase in the num-ber of retired instructions in some of the HT cases with a maximum of 2% in uSS and4% in uNJ. Our results show that in HT the instructions are divided between the twothreads almost equally.
5.3 Cache Behavior
Figure 10 gives the L1 data cache miss rate for load instructions. We compare the missrates with hyperthreading turned on versus off. We can see that we exhibit a detrimen-tal effect at the L1 data cache level in both uSS and uNJ. This result is similar to thoseof uTPC-C. The increase in the L1 data cache load miss rate ranges from 2.3% to 3%(excluding the single thread case) in uSS and from 3.2% to 4.5% in uNJ.
Figure 11 gives the L2 load cache miss rates. Our results show that hyperthreadingreduces the L2$ load data miss rates, up to 19% in uSS and up to 42% in uNJ. The
123
220 Int J Parallel Prog (2008) 36:206–225
L2$ Load Miss Rate
0%
1%
2%
3%
4%
5%
6%
7%
8%
(a) (b)
1Concurrency
O HT O HTL2$ Load Miss Rate
0%
2%
4%
6%
8%
10%
12%
14%
uSS uNJ
2 4 6 8 10 1Concurrency
2 4 6 8 10
Fig. 11 L2 cache load miss rate (O = HT-off, HT = HT-on)
L1-I Trace Cache Miss Rate
0.0%
0.1%
0.2%
0.3%
0.4%
0.5%
0.6%(a) (b)O HT O HTL1-I Trace Cache Miss Rate
0.0%
0.1%
0.2%
0.3%
0.4%
0.5%
0.6%
0.7%
0.8%
1
Concurrency
uSS uNJ
2 4 6 8 10 1
Concurrency
2 4 6 8 10
Fig. 12 L1 instruction trace cache miss rate (O = HT-off, HT = HT-on)
larger decrease in L2 $ miss rates by uNJ over uSS explains the better performanceimprovement seen in uNJ over uSS. This indicates that sharing data occurs at the L2$level and agrees with prior uTPC-C data. This reduction in the L2$ miss rates is a majorcontributor of the hyper-threading speedup. The increase in the L2$ load data missrates in concurrency one of uSS explains the slight performance degradation due tohyperthreading seen at this concurrency. Figure 12 gives the L1 instruction trace cachemiss rates. Our results show that turning hyperthreading on increases the instructiontrace cache miss rates, which agrees with the results of uTPC-C. The absolute valuesof the trace cache misses are small and uSS gives a larger increase in the L1 instructiontrace cache misses compared to uNJ.
5.4 TLB Misses
Figures 13 and 14 give the DTLB miss rates and the ITLB miss rates, respectively.Our results show that hyperthreading increases the DTLB miss rates in both uSS anduNJ, while it reduces ITLB miss rates in uSS and increases it in uNJ.
Figure 15 gives the branch misprediction rates. Our results show an increase in thebranch misprediction rates due to hyperthreading in both uSS and uNJ with a maxi-mum increase of 1.3% in both queries.
123
222 Int J Parallel Prog (2008) 36:206–225
0
0.1
0.2
0.3
0.4
0.5
0.6
0.7
0.8
0.9
1
1
L1-D L2-D ITLB DTLB L1-I Br Misp
0
0.5
1
1.5
2
2.5 L1-D L2-D ITLB DTLB L1-I Br Misp
O H0 H1 O H0 H1 O H0 H1 O H0 H1 O H0 H1 O H0 H1 O H0 H1 O H0 H1 O H0 H1 O H0 H1 O H0 H1 O H0 H1
To further understand the importance of the different processor parts on the perfor-mance of uTPC-H, we plot the non-overlapped CPI stall component in Fig. 16. Thisstall component represents the non-overlapped stall cycles per instruction and does nottake into account cycle overlapping during execution, which can affect the measuredperformance. Each stall component is computed by multiplying the cycles per missby the miss per instruction. Our results show that the major stall cycle componentsare those of the L2 cache misses followed by the L1 data cache. In uSS, the DTLBstall component is almost as large as the L1 data cache stall component and therefore,plays a significant role. In HT, the uSS DTLB stall component is divided between boththreads thus yielding much smaller DTLB stalls per thread. A similar effect is seenin uNJ L2 cache stalls. ITLB stalls have almost no effect while DTLB, L1 instructiontrace cache, and branch misprediction stalls have small effects. Therefore, HT uNJbenefits from the reduction of its L2 cache stall component, while HT uSS benefitsfrom both L2 cache and DTLB stall components which are the major causes of speedupin these queries.
5.7 uSS Function Analysis
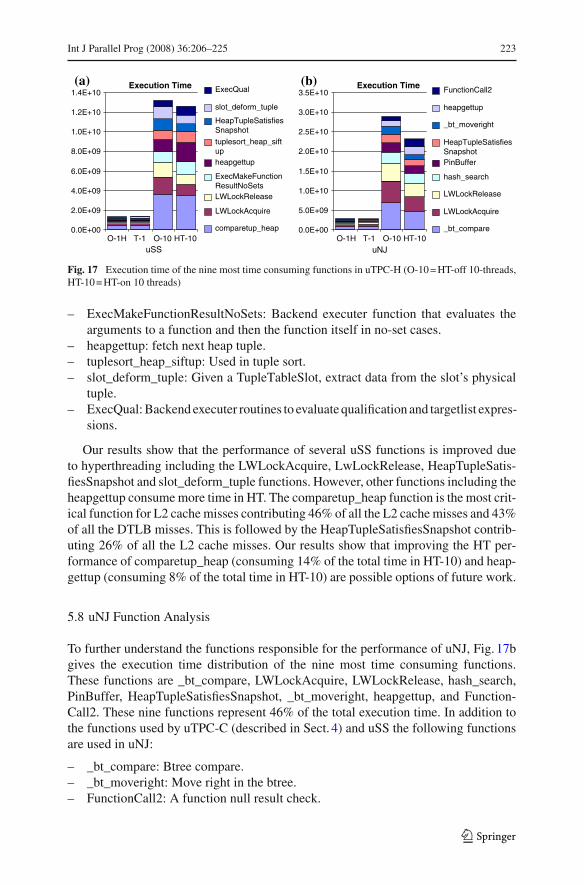
To further understand the functions responsible for the performance of uSS, Fig. 17agives the execution time distribution of the nine most time consuming functions.These functions are comparetup_heap, LWLockAcquire, LWLockRelease, ExecMakeFunctionResultNoSets, heapgettup, tuplesort_heap_siftup, HeapTupleSatisfiesSnap-shot, slot_deform_tuple, and ExecQual. These nine functions represent 56% of the totalexecution time. In addition to the functions used by uTPC-C (described in Sect. 4) thefollowing functions are used in uSS:
Fig. 17 Execution time of the nine most time consuming functions in uTPC-H (O-10 = HT-off 10-threads,HT-10 = HT-on 10 threads)
– ExecMakeFunctionResultNoSets: Backend executer function that evaluates thearguments to a function and then the function itself in no-set cases.
– heapgettup: fetch next heap tuple.– tuplesort_heap_siftup: Used in tuple sort.– slot_deform_tuple: Given a TupleTableSlot, extract data from the slot’s physical
tuple.– ExecQual: Backend executer routines to evaluate qualification and targetlist expres-
sions.
Our results show that the performance of several uSS functions is improved dueto hyperthreading including the LWLockAcquire, LwLockRelease, HeapTupleSatis-fiesSnapshot and slot_deform_tuple functions. However, other functions including theheapgettup consume more time in HT. The comparetup_heap function is the most crit-ical function for L2 cache misses contributing 46% of all the L2 cache misses and 43%of all the DTLB misses. This is followed by the HeapTupleSatisfiesSnapshot contrib-uting 26% of all the L2 cache misses. Our results show that improving the HT per-formance of comparetup_heap (consuming 14% of the total time in HT-10) and heap-gettup (consuming 8% of the total time in HT-10) are possible options of future work.
5.8 uNJ Function Analysis
To further understand the functions responsible for the performance of uNJ, Fig. 17bgives the execution time distribution of the nine most time consuming functions.These functions are _bt_compare, LWLockAcquire, LWLockRelease, hash_search,PinBuffer, HeapTupleSatisfiesSnapshot, _bt_moveright, heapgettup, and Function-Call2. These nine functions represent 46% of the total execution time. In addition tothe functions used by uTPC-C (described in Sect. 4) and uSS the following functionsare used in uNJ:
– _bt_compare: Btree compare.– _bt_moveright: Move right in the btree.– FunctionCall2: A function null result check.
123
224 Int J Parallel Prog (2008) 36:206–225
Our results show that the performance of most functions is improved due tohyperthreading in uNJ including the _bt_compare, LWLockAcquire, LwLockReleaseand HeapTupleSatisfiesSnapshot functions. However, similar to uSS, the heapgettupconsumes more time in HT. In contrast to uSS, the heapgettup in uNJ only consumes3.5% of the total time in HT-10. The _bt_compare function is the most critical functionfor L2 cache misses contributing 32% of all the L2 cache misses. This is followedby the HeapTupleSatisfiesSnapshot contributing 19% of all the L2 cache misses. Ourresults show that _bt_compare and LWLockAcquire are the most time consumingfunctions in uNJ and both benefit from HT.
6 Conclusion
In this paper we characterized the performance of an open-source DBMS on an IntelPentium 4 Hyper-Threading processor. The presented performance characterization isbased on real measurements of TPC-C equivalent and TPC-H equivalent benchmarks.The detailed performance study focused primarily on the effect of hyperthreading onthe total execution time of the benchmarkqueries and the effect of concurrency runningmultiple clients in parallel. Our results show that hyper-threading results in a perfor-mance speedup of up to 1.16 in TPC-C equivalent and up to 1.26 in TPC-H equivalentbenchmarks. This speedup is a result of a reduction in the L2 cache miss rates. At theL1 cache level thread conflicts increase both the L1 data cache and the L1 instructiontrace cache miss rates. To the best of our knowledge no other characterization studyhas analyzed DBMS on real SMT processors and only a limited amount of work hasstudied various data management operations generally on SMT architectures.
Acknowledgements This work is supported in part by the Natural Sciences and Engineering ResearchCouncil (NSERC) of Canada under DG 73-2259, and a URGC 73-2780 grant. Moustafa A. Hammad’sresearch is supported in part by the Natural Sciences and Engineering Research Council (NSERC) ofCanada under DG 73-2276, NSERC-CRD, and GEOIDE under SII#43.
References
1. Keeton, K., Patterson, D., He, Y., Raphael, R., Baker, W.: Performance characterization of a QuadPentium pro SMP using OLTP workloads. In: Proceedings of the 25th International Symposium onComputer Architecture (ISCA)
2. Tullsen, D., Eggers, S., Levy, H.: Simultaneous multithreading: maximizing on-chip parallelism. In:Proceedings of the 22th International Symposium on Computer Architecture (ISCA) (1995)
3. Garcia, P., Korth, H.: Multithreaded architectures and the sort benchmark. In: Proceedings of the FirstInternational Workshop on Data Management on New Hardware, June 2005
4. Ghoting, A., Buehrer, G., Parthasarathy, S., Kim, D., Chen, Y., Nguyen, A., Dubey, P.: Cache-con-scious frequent pattern mining on a modern processor. In: Proceedings of the International Conferenceon Very Large Data Bases (VLDB) (2005)
5. Zhou, J., Cieslewicz, J., Ross, K.A., Shah, M.: Improving database performance on simultaneousmultithreading processors. In: Proceedings of the International Conference on Very Large Data Bases(VLDB) (2005)
6. Lehman P.L., Bing Yao S.: Efficient locking for concurrent operations on B-trees. ACM Trans. Data-base Syst. 6(4), 650–670 (1981)
123
Int J Parallel Prog (2008) 36:206–225 225
7. Shao, M., Ailamaki, A., Falsafi, B.: DBmbench: Fast and accurate database workload representationon modern microarchitecture. In: International Centers for Advanced Studies Conference (CASCON)(2005)
8. http://www.postgresql.org9. Lo, J., Barroso, L., Eggers, S., Gharachorloo, K., Levy, H., Parekh, S.: An analysis of database work-
load performance on simultaneous multithreaded processors. In: Proceedings of the 25th InternationalSymposium on Computer Architecture (ISCA), Barcelona, Spain, June 1998
10. Ailamaki, A., DeWitt, D.J., Hill, M.D., Wood, D.A.: DBMSs on a modern processor: where doestime go? In: Proceedings of International Conference on Very Large Databases (VLDB), pp. 266–277(1999)
11. Bhandarkar, D., Ding, J.: Performance characterization of the Pentium pro processor. In: Proceedingsof the 3rd IEEE Symp. on High-Performance Computer Architecture (HPCA) ’97, Feb. 1997
12. Keeton, K., Patterson, D.: Towards a simplified database workload for computer architecture eval-uations, presented at the workshop on workload characterization, Austin, Texas, October 1999. In:John L.K., Maynard A.M. (eds.) Workload Characterization for Computer System Design. KluwerAcademic Publishers, 2000, ISBN 0-7923-7777-x
13. Hankins, R., Diep, T., Annavaram, M., Hirano, B., Eri, H., Nueckel, H., Shen, J.P.: Scaling and char-acterizing database workloads: bridging the gap between research and practice. In: Proceedings of theInternational Symposium on Microarchitecture (MICRO), December 2003
14. Blackburn, S., Cheng, P., McKinley, K.: Myths and realities: the performance impact of garbagecollection. In: Proceedings of the SIGMETRICS ’04, June 2004
15. Bulpin, J.R., Pratt, I.A.: Multiprogramming performance of the Pentium 4 with hyper-threading. In:Proceedings of the 3rd Annual Workshop on Duplicating, Deconstructing, and Debunking (WDDD),Munich, Germany, June 2004
16. Huang, W., Lin, J., Zhang, Z., Chang J.M.: Performance characterization of Java applications on SMTprocessors. International Symposium on Performance Analysis of Systems and Software (ISPASS),March 2005
17. Tuckm, N., Tullsen, D.: Initial observations of a simultaneous multithreading processor. In: 12th Intl.Conf. on Parallel Architectures and Compilation Techniques (PACT’)03, Sept. 2003
18. Chen, Y.K., Debes, E., Lienhart, R., Holliman, M., Yeung, M.: Evaluating and improving perfor-mance of multimedia applications on simultaneous multi-threading. In: 9th Intl. Conf. on Parallel andDistributed Systems, Dec. 2002
19. Ruan, Y., Pai, V.S., Nahum, E., Tracey, J.M.: Evaluating the impact of simultaneous multithreadingon network servers using real hardware. In: Proceedings of the SIGMETRICS ’05, June 2005
20. Mathis, H.M., Mericas, A.E., McCalpin, J.D., Eickemeyer, R.J., Kunkel, S.R.: Characterization ofsimultaneous multithreading (SMT) efficiency in Power5. IBM J. Res. Dev. 49(4/5), 555–564 (2005)