47
Manuel M. Godinho Analyzing the evidence of a IPR take-off in China and India 8th Ph.D. School on Innovation and Economic Development Rio de Janeiro: 20th August – 31st August, 2012

Manuel M. Godinho
Analyzing the evidenceof a IPR take-off in China and India
8th Ph.D. School on Innovation and Economic Development
Rio de Janeiro: 20th August – 31st August, 2012

Outline
1. The legal structure of IPRs2. A brief panorama of global IPR demand3. IPR take off in China and India
3 is based on Godinho and Ferreira, Analyzing the evidence of a IPRtake-off in China and India, published in Research Policy, Feb. 2012.
4. Further research on Chinese patentinginstitutions
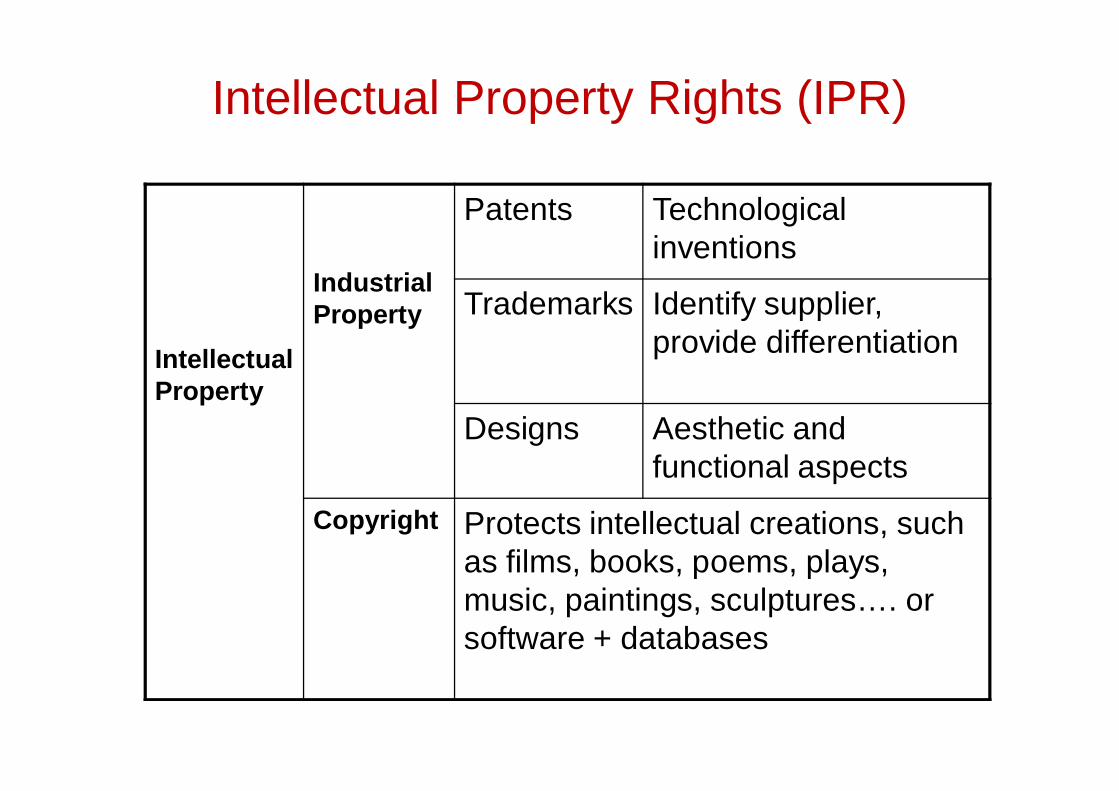
Intellectual Property Rights (IPR)
IntellectualProperty
IndustrialProperty
Patents Technologicalinventions
Trademarks Identify supplier,provide differentiation
Designs Aesthetic andfunctional aspects
Copyright Protects intellectual creations, suchas films, books, poems, plays,music, paintings, sculptures…. orsoftware + databases
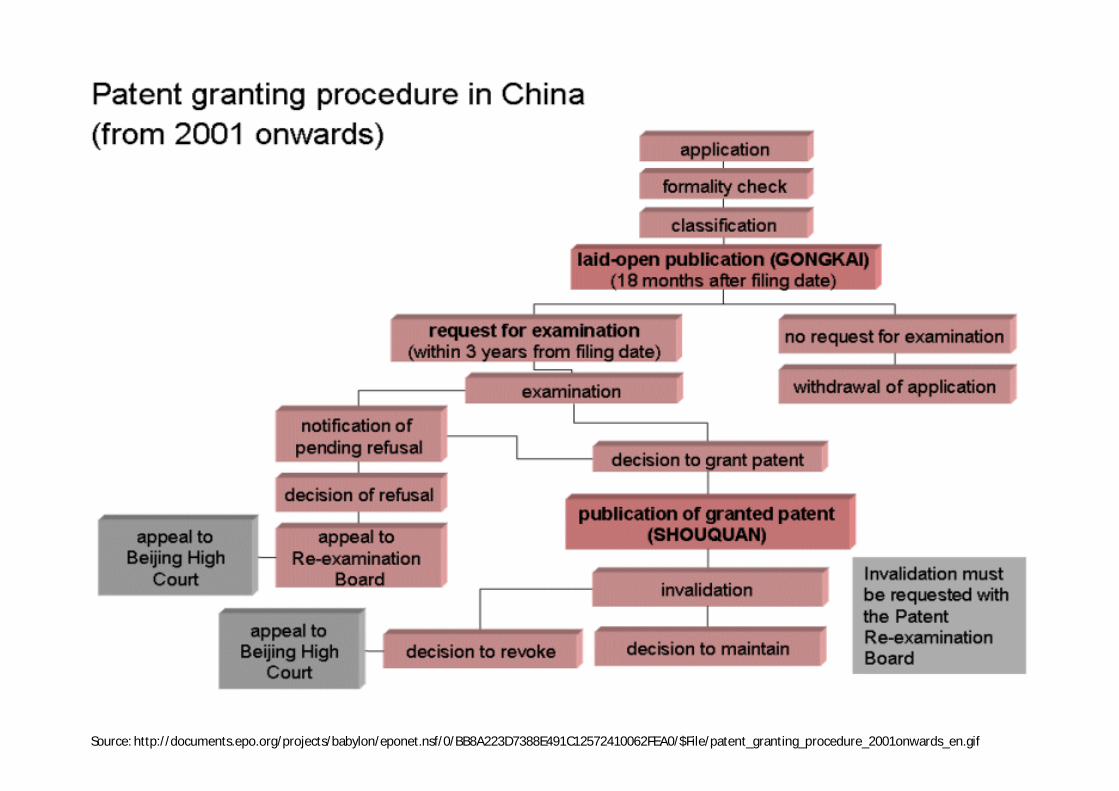
Source: http://documents.epo.org/projects/babylon/eponet.nsf/0/BB8A223D7388E491C12572410062FEA0/$File/patent_granting_procedure_2001onwards_en.gif

Patentability criteria
• Novelty - An invention is new if it is notpart of the “state of the art”.
• Utility (or “industrial application”) - Theinvention should be useful in order to bepatented .
• Non-obviousness (or “inventive step”) -The invention shall not be obvious tosomeone familiar with the patentablesubject matter.

The “priority”• The priority right is triggered by the first
filing of an application for a patent.• The priority period is usually 12 months.• The priority right allows an applicant to
file subsequent applications in othercountries for the same invention.
Patent duration: 20 years
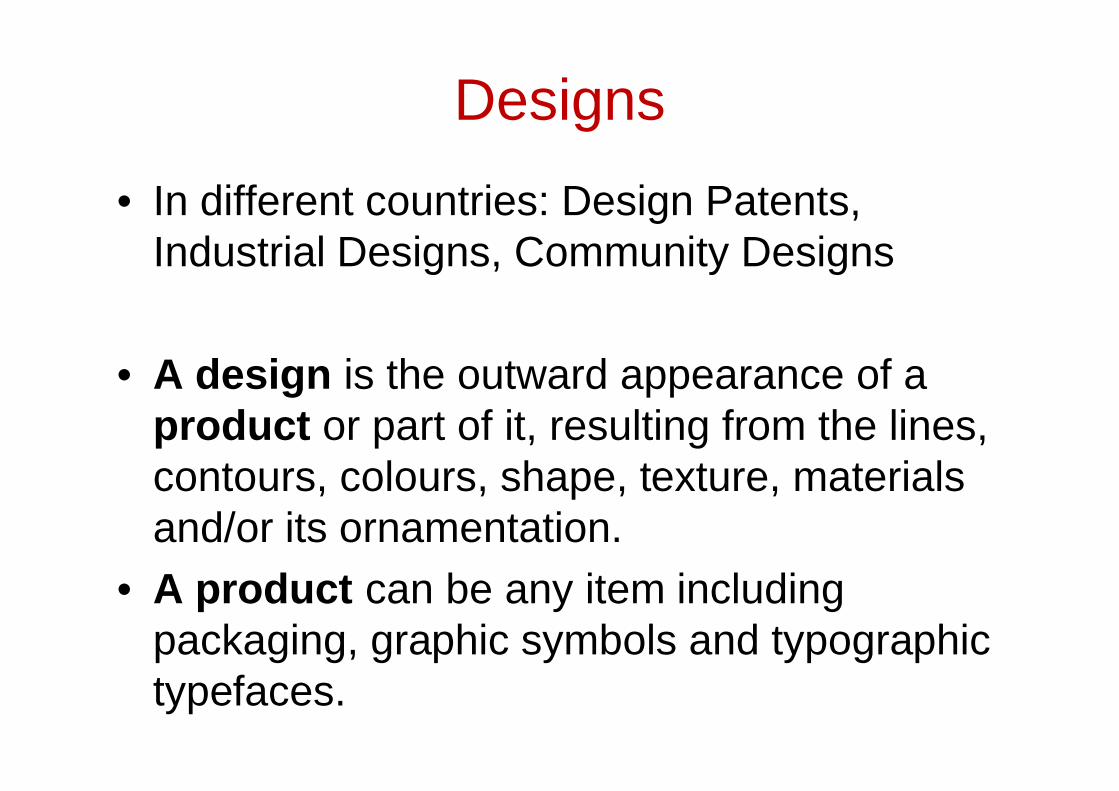
Designs• In different countries: Design Patents,
Industrial Designs, Community Designs
• A design is the outward appearance of aproduct or part of it, resulting from the lines,contours, colours, shape, texture, materialsand/or its ornamentation.
• A product can be any item includingpackaging, graphic symbols and typographictypefaces.

Trademarks
• Distinctive signs which identify certain goodsor services as those provided by a specificsupplier.
• Differentiation and information function:TMs help consumers to identify a product orservice and help suppliers to differentiate theirproducts
• Protection function: TMs ensure their ownersthe exclusive right to use it or authorize othersto use it in return for payment.

What kinds of TMs can be registered?
TMs may be one or a combination of words,letters, and numerals, and they consist of:
• Drawings• Symbols• 3-D designs such as the shape and
packaging of goods• Audible signs such as music or vocal sounds• Fragrances• Colors used as distinguishing features
TM: Duration
• The period of protection varies, but atrademark can be renewed indefinitelybeyond the time limit on payment ofadditional fees.

Copyright
• Exclusive rights granted to the authors oforiginal works, including the right to copy,distribute and adapt the work.
• Some exceptions under ‘fair use’.• Rights enforceable for a specific period of time
(most jurisdictions: life + 70 years), after whichthe work is said to enter the public domain.
• In many countries: no registration requirement

Legal FrameworkEach individual country• National IP laws
Patents• Paris Convention (1883)• Patent Convention Treaty (PCT) (1970) (‘International Patent’)• European Patent Convention (1973)
Trademarks• Paris Convention (1883)• Madrid Agreement(1891) (‘International Trademark’)• Community Trademark (1996)
Copyright• Bern Convention (1886)
Wider legal framework: TRIPS (1994)

TRIPS - trade-related aspects of intellectual property rights
• Annex to the 1994 WTO founding treaty• All WTO members deemed to respect TRIPS• Harmonization of IP law worldwide• Integration of the principles of the Paris and
Bern conventions on industrial property andcopyrights
• Part of the deal to liberalize trade worldwide:access to richer markets by DCs + globalenforceability of IPR

What the possibilities are?
• National Patents, TMs, or IndustrialDesigns (Country X, Country Y etc.)
• International Patent or International TMsystems (WIPO) (common applicationprocedure, one examination, granting bynational offices)
• Regional systems (Europe; Africa…)
• Which choice??

1. The legal structure of IPRs2. A brief panorama of global IPR
demand3. IPR take off in China and India4. Further research on Chinese patenting
institutions

As much as three-quarters of the value ofpublicly traded companies in Americacomes from intangible assets, up fromaround 40% in the early 1980s.
(The Economist, 20 Oct. 2005)

• Grandstrand, O., 1999. The Economicsand Management of Intellectual Property:Towards Intellectual Capitalism. EdwardElgar Publishing Limited, London.
• Hall, B., 2005. Exploring the PatentExplosion. The Journal of TechnologyTransfer 302_2, 35-48, 01.

‘Patent boom’à USPTO: 1963-2009(10^3)
0
50
100
150
200
250
1960 1970 1980 1990 2000 2010
Utility PatentApplications,U.S. Origin
Utility PatentApplications,ForeignOrigin

‘Patent boom’
• New science-intensive sectors• University patenting• Strategic use of patents

Source: WIPO - World Intellectual Property Indicators 2011


1. The legal structure of IPRs2. A brief panorama of global IPR demand3. IPR take off in China and India4. Further research on Chinese patenting
institutions

Questions addressed
• What are the causes behind IPR “take-off”?
• The same as those behind the “patentexplosion” in the US etc. since the 1980s?
• Is there a relationship between such “IPRtake-off” and innovation in China andIndia?
• Questions of sustainability and NIS“fitness”

Observation of the “IPR Take-off”
• Demand on National PTOs– National Patents– National Trademarks
• Demand on Other Systems


Domestic Demand for Patents in national PTOs, 1979-2008
100
1.000
10.000
100.000
1.000.000
1978
1980
1982
1984
1986
1988
1990
1992
1994
1996
1998
2000
2002
2004
2006
2008
2010
China India Japan USA Skorea

1.000
10.000
100.000
1.000.000
1964
1966
1968
1970
1972
1974
1976
1978
1980
1982
1984
1986
1988
1990
1992
1994
1996
1998
2000
2002
2004
2006
2008
ChinaIndiaJapanU.S.Euro 6
Total trademarks demand (residents and non-residents) in eachPTO, 1964-2008

Demand on “other systems”
• International PCT Patents• National systems: USPTO, JPO, CPO,
IPO + EPO• International trademarks• National systems + EU CTM system
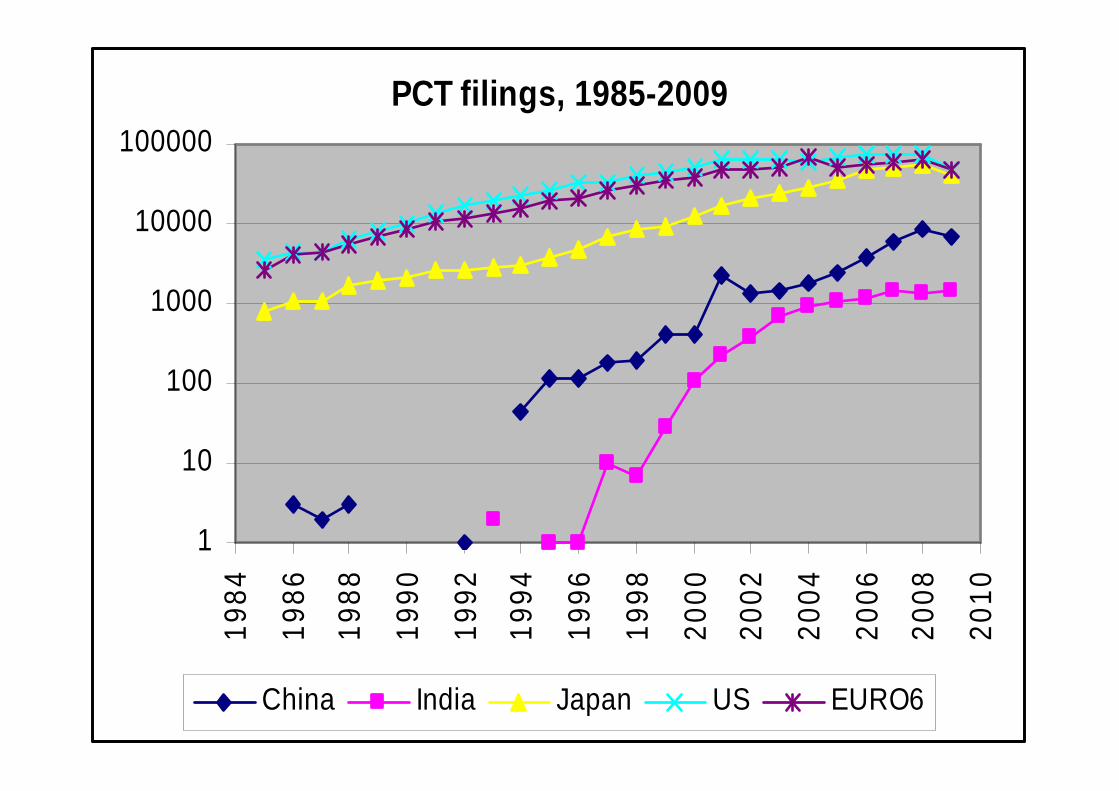
PCT filings, 1985-2009
1
10
100
1000
10000
100000
1984
1986
1988
1990
1992
1994
1996
1998
2000
2002
2004
2006
2008
2010
China India Japan US EURO6

1
10
100
1000
10000
100000
1996 1997 1998 1999 2000 2001 2002 2003 2004 2005 2006 2007
USJapanChinaIndiaEuro 6
Total trademarks demand in the EU CTM system, 1996-2007
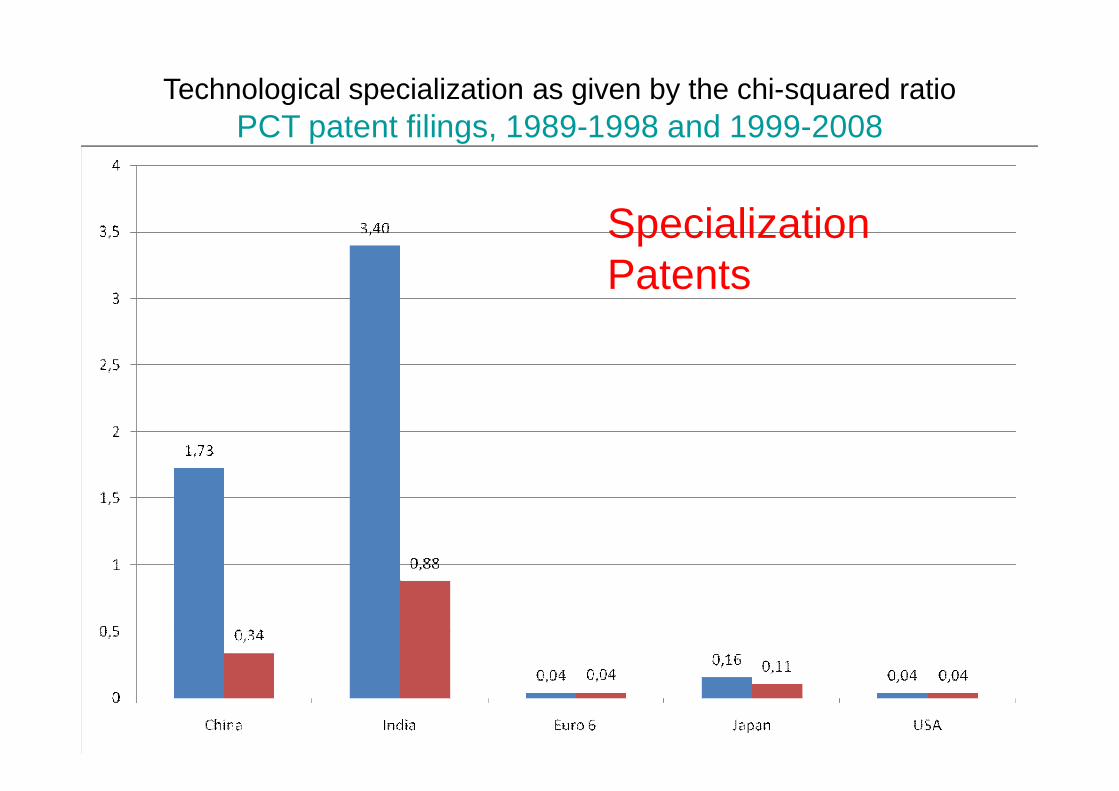
Technological specialization as given by the chi-squared ratioPCT patent filings, 1989-1998 and 1999-2008
SpecializationPatents

Trademark specialization as given by the chi-squared ratioEU CTM system, 1996-1999 and 2000-2007
SpecializationTrademarks

4. Further research on Chinesepatenting institutions

Top PCT Applicants (applicants with more than 10 PCT applications)Source: WIPO Statistics Database January 2012Note: Counts are based on publication date and first-named applicant
APPLICANT'S NAME COUNTRY OFORIGIN
2011 PCTAPPLICATIONS
ZTE CORPORATION CN 2,826PANASONIC CORPORATION JP 2,463HUAWEI TECHNOLOGIES CO., LTD. CN 1,831SHARP KABUSHIKI KAISHA JP 1,755ROBERT BOSCH CORPORATION DE 1,518QUALCOMM INCORPORATED US 1,494TOYOTA JIDOSHA KABUSHIKI KAISHA JP 1,417LG ELECTRONICS INC. KR 1,336KONINKLIJKE PHILIPS ELECTRONICS N.V. NL 1,148TELEFONAKTIEBOLAGET LM ERICSSON (PUBL) SE 1,116NEC CORPORATION JP 1,056SIEMENS AKTIENGESELLSCHAFT DE 1,039MITSUBISHI ELECTRIC CORPORATION JP 834BASF SE DE 773SAMSUNG ELECTRONICS CO., LTD. KR 757NOKIA CORPORATION FI 698INTERNATIONAL BUSINESS MACHINES CORPORATION US 661HEWLETT-PACKARD DEVELOPMENT COMPANY, L.P. US 5913M INNOVATIVE PROPERTIES COMPANY US 563HITACHI, LTD. JP 547

Top 100 Chinese Patenting Institutions
EPO + USPTO + PCT
2009 + 2010 +2011
(based on published applications)

Type of Institution SCORE1 HUAWEI TECHNOLOGIES CO. LTD.* Corporation 100,00%2 ZTE CORPORATION* Corporation 66,51%3 TSINGHUA UNIVERSITY* University 6,50%4 BYD COMPANY LIMITED Corporation 3,88%5 TENCENT TECHNOLOGY (SHENZHEN) COMPANY LIMITED Corporation 3,67%6 LENOVO* Corporation 3,35%7 CHINA ACADEMY OF TELECOMMUNICATIONS
TECHNOLOGYR. Institute / Academy 2,74%
8 CHINA IWNCOMM CO. LTD. Corporation 2,12%9 TCL CORPORATION* Corporation 2,10%10 SEMICONDUCTOR MFG INT SHANGHAI Corporation 2,06%11 CHINA MOBILE COMMUNICATIONS CORPORATION Corporation 1,84%12 BEIJING BOE OPTOELECTRONICS TECHNOLOGY CO., LTD. Corporation 1,75%13 PEKING UNIVERSITY* University 1,71%14 NUCTECH COMPANY LIMITED Corporation 1,61%15 TSANN KUEN ENTERPRISE CO. LTD. Corporation 1,34%16 CHINA PETROLEUM & CHEMICAL CORPORATION
(SINOPEC)Corporation 1,18%
17 XIAMEN SOLEX HIGH-TECH INDUSTRIES CO. LTD Corporation 1,13%18 CHERY AUTOMOBILE CO. LTD. Corporation 1,10%19 INSTITUTE OF MICROELECTRONICS, CHINESE ACADEMY
OF SCIENCESR. Institute / Academy 1,07%
20 DA TANG MOBILE COMMUNICATIONS EQUIPMENT CO.,LTD.
Corporation 1,07%
Top 20 Chinese Patenting Institutions (Scoreß USPTO, EPO, PCT)

Score Business University Res.Institute
/Academy
ofSc.
Total
>10 2 0 0 22-10 6 1 1 81-2 8 1 1 10<1 57 16 7 80N 73 18 9 100

3TSINGHUA UNIVERSITY* University 6.513PEKING UNIVERSITY* University 1.7121NANJING UNIVERSITY University 0.9426ZHEJIANG UNIVERSITY University 0.8637FUDAN UNIVERSITY University 0.5746BEIJING UNIVERSITY OF CHEMICAL TECHNOLOGY University 0.4151EAST CHINA UNIVERSITY OF SCIENCE AND TECHNOLOGY University 0.3654SOUTHEAST UNIVERSITY University 0.3256SUN YAT-SEN UNIVERSITY University 0.359DALIAN UNIVERSITY OF TECHNOLOGY University 0.2860UNIV NORTHEASTERN University 0.2673SOUTH CHINA UNIVERSITY OF TECHNOLOGY University 0.2175SHENYANG PHARMACEUTICAL UNIVERSITY University 0.2178SHANGHAI JIAOTONG UNIVERSITY University 0.281HUAZHONG AGRICULTURAL UNIVERSITY University 0.289XIAMEN UNIVERSITY University 0.1790UNIV PLA 2ND MILITARY MEDICAL (Second Military Medical University) University 0.1792JIANGSU UNIVERSITY University 0.177CHINA ACADEMY OF TELECOMMUNICATIONS TECHNOLOGY R. Institute / Academy 2.74
19INSTITUTE OF MICROELECTRONICS. CHINESE ACADEMY OF SCIENCES R. Institute / Academy 1.0725SHANGHAI INSTITUTE OF MATERIA MEDICA CHINESE ACADEMY OF SCIENCES R. Institute / Academy 0.89
32DALIAN INSTITUTE OF CHEMICAL PHYSICS. CHINESE ACADEMY OF SCIENCES R. Institute / Academy 0.65
33INSTITUTE OF PHARMACOLOGY AND TOXICOLOGY ACADEMY OF MILITARY MEDICALSCIENCES P.L.A. CHINA R. Institute / Academy 0.59
45SHANGHAI INSTITUTE OF MICROSYSTEM AND INFORMATION TECHNOLOGY CHINESEACADEMY OF SCIENCES R. Institute / Academy 0.41
49SHANGHAI INSTITUTES FOR BIOLOGICAL SCIENCES. CHINESE ACADEMY OF SCIENCES R. Institute / Academy 0.3785CHINA ELECTRIC POWER RESEARCH INSTITUTE R. Institute / Academy 0.1987CHONGQING PHARMACEUTICAL RESEARCH INSTITUTE CO.. LTD. R. Institute / Academy 0.18
Top patenting Chinese Universities and Research Institutes / Academies ofScience
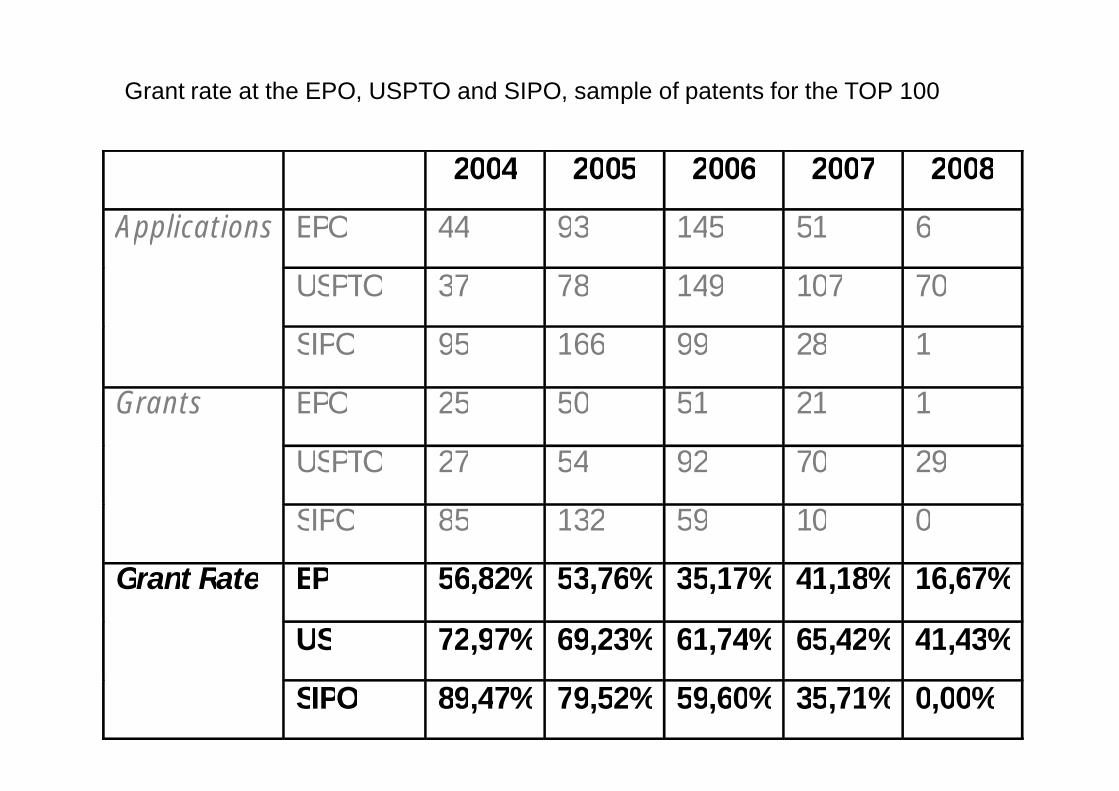
2004 2005 2006 2007 2008
Applications EPO 44 93 145 51 6
USPTO 37 78 149 107 70
SIPO 95 166 99 28 1
Grants EPO 25 50 51 21 1
USPTO 27 54 92 70 29
SIPO 85 132 59 10 0
Grant Rate EP 56,82% 53,76% 35,17% 41,18% 16,67%
US 72,97% 69,23% 61,74% 65,42% 41,43%
SIPO 89,47% 79,52% 59,60% 35,71% 0,00%
Grant rate at the EPO, USPTO and SIPO, sample of patents for the TOP 100
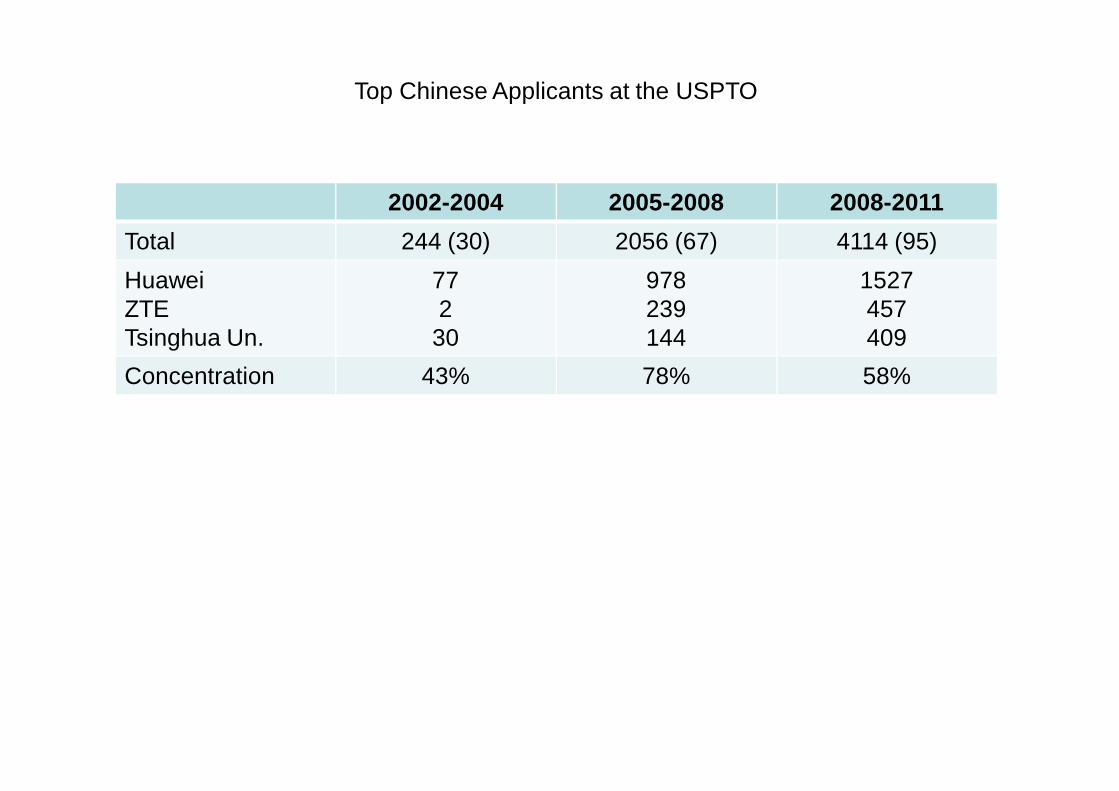
2002-2004 2005-2008 2008-2011Total 244 (30) 2056 (67) 4114 (95)HuaweiZTETsinghua Un.
772
30
978239144
1527457409
Concentration 43% 78% 58%
Top Chinese Applicants at the USPTO

Huawei Technologies PCT*
0
200
400
600
800
1000
1200
1400
1600
1800
2000
2000 2001 2002 2003 2004 2005 2006 2007 2008 2009 2010 2011
G10L - Speech Analysis or Synthesis
H04J - Multiplex Communication
H04Q - Selecting (Arrangements)
G06F - Eletrical Digital Data Processing
H04M - Telephonic Communication
H04N - Pictorial Communication
Outros
H04B - Transmission
H04W - Wireless Communication Networks
H04L - Transmission of Digital Information

ZTE Corporations PCT*
0
500
1000
1500
2000
2500
3000
3500
2002 2003 2004 2005 2006 2007 2008 2009 2010 2011
G06K - Recognition of Data
H04J - Multiplex Communication
H04Q - Selecting (Arrangements)
H04M - Telephonic Communication
H04N - Pictorial Communication
G06F - Eletrical Digital Data Processing
Outros
H04B - Transmission
H04L - Transmission of Digital Information
H04W - Wireless Communication Networks

Application to Grant – Huawei(USPTO+EPO+JPO+KIPO)
AP - GR 2006 2007 2008 2009 2010 2011 2012 TOTAL - G TOTAL - AP Grant Rate2004 0 0 4 2 2 1 0 9 12 75%2005 1 2 4 12 15 10 3 46 67 69%2006 0 1 2 18 29 14 5 69 141 49%2007 0 0 3 6 23 23 11 66 161 41%
2004 2005 2006 2007 2008 2009 2010 2011 2012TOTAL - G
TOTAL -AP
GrantRate
2004 0 0 0 0 0 1 7 5 1 14 33 42%2005 0 0 1 1 1 1 6 8 1 19 67 28%2006 0 0 0 1 0 2 3 10 2 18 54 33%2007 0 0 0 0 0 0 0 7 4 11 135 8%
Application to Grant – ZTE(USPTO+EPO+JPO+KIPO)

ConclusionsIPR take-off in China and India:1.Causes not 100% the same as those behind “patent
explosion” in US etc...; related to innovation but alsopart of a “proprietary rush”
2. Innovation becoming central to India and China growth(patents + TMs = innovation) (quality concern)
3.This might guarantee continued economic growth4.Catch-up in volume but overall not yet per capita5.Problems of NIS cohesion as certain regions
(Shanghai, Pearl River Delta, Bengalore, Mumbai)might catch up with advanced economies over thenext 2-3 decades while others left behind
6.Eventually “quality problem”

Thank You !


