ANALYZING THE PROPERTY CRIME PATTERNS IN PENINSULAR MALAYSIA: ESDA APPROACH
(ANALISIS CORAK JENAYAH HARTA BENDA DI SEMENANJUNG MALAYSIA: PENDEKATAN ESDA)
SYERRINA ZAKARIA*1 AND NUZLINDA ABD. RAHMAN2
1School of Informatics and Applied Mathematics, Universiti Malaysia Terenganu, Terengganu. 2School of Mathematical Sciences, Universiti Sains Malaysia, Pulau Pinang.
Abstract: The objective of this study is to analyze the spatial cluster of crime cases in Peninsular Malaysia by using the exploratory spatial data analysis (ESDA). In order to identify and measure the spatial autocorrelation (cluster), Moran’s I index were used. Based on the cluster analyses, the hot spots of the property crime occurrence were mapped. The maps were constructed by overlaying the hot spots of property crime rate for the year 2001, 2005 and 2009. Meanwhile, the maps of hot spots for population density and unemployment rates factors were constructed based on data obtained from the census report published in the year 2000. As a result, the hypothesis of spatial randomness is rejected indicating cluster effect exists in the study area. The findings revealed that crime was distributed non-randomly, suggestive of positive spatial autocorrelation. The findings of this study can be used by the government, policy makers and responsible agencies to take related actions in terms of crime prevention, human resource allocation and law enforcement in order to reduce crimes in the future.
KEYWORDS: Property crime, population density, unemployment rate, Moran’I index, hot spot mapping.
Abstrak: Tujuan kajian ini adalah untuk menganalisis pengelompokan reruang kes-kes jenayah di Semenanjung Malaysia dengan menggunakan analisis data ruang penerokaan (ESDA). Dalam usaha untuk mengenal pasti dan mengukur autokorelasi reruang (pengelompokan), indeks Moran’I telah digunakan. Berdasarkan analisis pengelompokan berkenaan kawasan panas kejadian jenayah harta benda telah dipetakan. Peta berdasarkan gabungan kawasan panas kadar jenayah harta benda bagi tahun 2001, 2005 dan 2009 telah dirangka. Sementara itu, peta kawasan panas bagi faktor kepadatan penduduk dan kadar pengangguran telah dibina berdasarkan data yang diperoleh daripada laporan banci yang diterbitkan pada tahun 2000. Hasilnya, hipotesis rawak reruang adalah ditolak dan menunjukkan kesan kelompok wujud di kawasan kajian. Kajian menunjukkan bahawa jenayah tidak bertabur secara rawak, menandakan wujud autokorelasi reruang yang positif. Hasil kajian ini boleh digunakan oleh pihak kerajaan, pembuat dasar dan agensi yang bertanggungjawab untuk mengambil tindakan yang berkaitan dari segi pencegahan jenayah, peruntukan sumber manusia dan penguatkuasaan undang-undang dalam usaha untuk mengurangkan jenayah di masa depan.
KATA KUNCI: Jenayah harta benda, kepadatan penduduk, kadar pengangguran, Indeks Moran’I, pemetaan kawasan panas.
IntroductionCriminal activities are the inevitable social problem that has been faced by most of the countries in this world. Various plans and suitable
strategies have been taken by law enforcement bodies and local government in addressing this problem. This problem can give a large impact on countries around the world whether in the developed, developing or undeveloped
13. Analyzing the Property.indd 104 3/11/14 5:00 PM
Journal of Business and Social Development Volume 2(1) 2014: 104-113
ANALYZING THE PROPERTY CRIME PATTERNS IN PENINSULAR MALAYSIA 105
countries. In order to take appropriate actions in dealing with crime problems, the studies on crime situations and their distribution should be carried out.
There are a number of previous studies done related to crime issues in various countries. Dutt & Venugopal (1983) studied the crime patterns in India by using data of 14 different types of crime for 99 cities in India. They used standard correlation methods to analyze the relationship between types of crime and the spatial patterns. They reported that the occurrences of one crime are associated with other types of crimes or crimes that inspire others. They also found that crime rates are higher in cities than in rural areas. Meanwhile, Tsushima (1996) studied the impact of economic structure on crime (1986-1988) in 47 prefectures of Japan by using multiple regression analysis. They found that unemployment rates have a positive relation with homicide and robbery, while the degree of inequality has positive correlation with larceny. Another study is done by Appiahene-gyamfi (1998) which investigated the robbery trends and patterns in Ghana from 1982 until 1993. In order to discuss the trends and patterns, the author used descriptive statistics based on total crime, total robbery, total population and the rate of robbery per 100,000 people. Based on the analysis the author concluded that many robbery cases occurred in the central of socio-economic activities such as in cities and urban areas.
In Malaysia, Sidhu (2005) studied the crime situation from 1980 to 2004 by looking at the overall pattern of crime, also property crime and violent crime by using descriptive statistics analysis. He analyzed the crime situation based on rate of crime and then discussed the factors that are believed to give impact on crime situation. In 2006, Sidhu extended his work by studying the crime situation using the same data set. He found that, crime situation was also affected by global economic situation i.e. when the economic downturn or recession happened, the unemployment rate increased and people faced difficulties in finding higher paying jobs. This scenario increased the crime rate. The author also made projection of crime rate starting from 2002 onwards based on the population growth
rate. Another study on crime issue was done by Cole & Gramajo (2009). The authors explored the relationship between homicide rates in 91 countries and several types of factors which influenced it such as socio-economic, culture and institution factors. In order to examine this relationship, the regression analysis was employed, and the authors found that the higher level of cultural and ethnic heterogeneity will increase the rate of homicide. They also reported that education level was significantly associated with homicide rates.
The pattern of crime can be detected differently based on specific types of environments. It is believed that crime was higher in the most developed and densely populated area such as in large cities, town or urban areas compared to undeveloped areas such as in rural areas. This situation happened because of several factors such as environmental characteristic, economics, social, political and demographics (Appiahene-Gyamfi, 2002; Perreault, Savoie & Bedard, 2008.; Savoie, Bedard & Collins, 2006). The result of a study done by Appiahene-Gyamfi (2002) was parallel with this perception, where the author reported that crime was highest in southern Ghana where it is the most developed and densely populated region. In addition, crime cases increased from the northern to southern Ghana, with a heavy concentration in Ashanti, the most populous region. Savoie et al., (2006) also found that the property crime highly happened in the city centre of the Island of Montreal. Meanwhile, Perreault et al., (2008) reported that youth crime is distributed over many small hot spots across the entire island of Montreal.
In Malaysia, limited studies have been done on crime data using statistical method. Most of the studies done were mainly focused on expert opinion or knowledge and discussed the causes and effects of crime. Examples are studies done by Kanyo and Norizan (2007), Sidhu (2005) and Sidhu (2006). The investigation of the crime situation will become more significant if using the combination of qualitative and quantitative techniques. In order to understand crime occurrence, it is important to observe the surrounding circumstances and to measure
13. Analyzing the Property.indd 105 3/11/14 5:00 PM
Journal of Business and Social Development Volume 2(1) 2014: 104-113
Syerrina Zakaria and Nuzlinda Abd. Rahman 106
the similarities with neighbouring districts in the study area. It is believed that geographical and socio-economic characteristic of local and neighbourhood area have an impact on crime. In order to overcome this problem, the objective of this study was to analyze the spatial cluster of property crime cases in Peninsular Malaysia by using the ESDA. The global Moran’s I index was used to measure the global spatial autocorrelation to identify the existence of autocorrelation in the study area. Meanwhile, the local Moran’s I index was employed to detect the individual locations of spatial autocorrelation by taking into consideration the effect of the neighboring regions or districts.
Introduction to Spatial AnalysisRecently, the opportunities for using social science data (i.e. crime data (Rogerson & Sun, 2001), disease data (Vieira, Webster, Weinberg, & Aschengrau, 2009) and accident data (Erdogan, 2009) to estimate spatial patterns and relationships increased rapidly because of the development in tools and methods in spatial analysis field. Spatial analysis is a method that is widely used to study an issue related to space, place or geographical circumstances. In spatial analysis, the location where an event occurs may provide an indication to the reason why that particular event occurs. In the beginning, spatial analysis involves mapping methods, reviews and geographic location without formal techniques. Starting from the 21st century, spatial modern analyses were widely developed and focused on specific use of computer-based. Mapping is one of the most widely used techniques in spatial analysis (Chaikaew, Tripathi, & Souris, 2009; Berke, 2001).
The spatial analysis is typically used to identify and measure the nature of relationships that exist between variables. This is done by calculating statistics or estimating parameters with observations taken from different spatial units across a study area (Brunsdon, Fotheringham & Charlton, 1996). The importance of spatial analysis is the measurement of attributes and their relationships, taking
into account the space and location of the phenomenon or incident under study.
One of the techniques in spatial analysis is Exploratory Spatial Data Analysis (ESDA). ESDA was used as a descriptive technique before suggesting factors to explain the spatial patterns under study and before estimating and testing more complete regression models (Anselin, 2005) and it can reveal complex spatial phenomenon. The development of new methods of ESDA has stimulated and increased a number of research efforts (Andresen, 2011; Messner et al., 1999; Osei & Duker, 2008; Pacheco & Tyrrell, 2002; Pouliou & Elliott, 2009; Ye & Wu, 2011).
In crime studies, one of the important issues is spatial clustering, which it is very useful especially in identifying the relationship between exposure and the cases concerned. However, this technique can only be used in identifying cluster visually but not statistically. In order to overcome the lacking of this conventional mapping technique, several methods can be used to identify spatial clustering such as spatial scan statistics (Oliver et al., 2006), Getis’s G index (Getis & Ord, 1992), Geary c (Erdogan, 2009) and Tango’ C index (Oliver et al., 2006). Nonetheless, many previous research indicated that the most commonly index used is Moran’s I (Pacheco & Tyrrell, 2002; Sridharan, Tunstall, Lawder, & Mitchell, 2007; Holt & Lo, 2008; Zhang, Luo, Xu, & Ledwith, 2008; Osei & Duker, 2008; Erdogan, 2009; Ye & Wu, 2011).
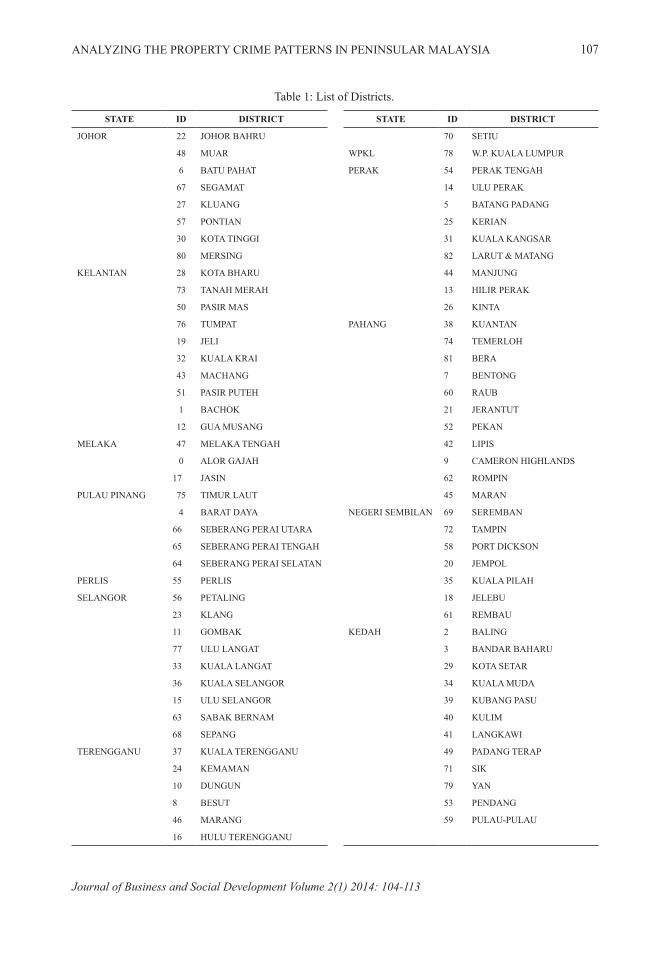
Data Malaysia comprises of Peninsular Malaysia and East Malaysia. According to 2000 census, Malaysia is divided into 14 states, 82 administrative districts in Peninsular Malaysia and 53 administrative in East Malaysia (Jabatan Perangkaan Malaysia, 2000). In this study, administrative district is used as the unit of analysis. Due to data availability, only twelve states located in Peninsular Malaysia consisting of 82 administrative districts were included in this study. The list of districts can be referred in Table 1.
13. Analyzing the Property.indd 106 3/11/14 5:00 PM
Journal of Business and Social Development Volume 2(1) 2014: 104-113
ANALYZING THE PROPERTY CRIME PATTERNS IN PENINSULAR MALAYSIA 107
Table 1: List of Districts.
STATE ID DISTRICT
JOHOR 22 JOHOR BAHRU
48 MUAR
6 BATU PAHAT
67 SEGAMAT
27 KLUANG
57 PONTIAN
30 KOTA TINGGI
80 MERSING
KELANTAN 28 KOTA BHARU
73 TANAH MERAH
50 PASIR MAS
76 TUMPAT
19 JELI
32 KUALA KRAI
43 MACHANG
51 PASIR PUTEH
1 BACHOK
12 GUA MUSANG
MELAKA 47 MELAKA TENGAH
0 ALOR GAJAH
17 JASIN
PULAU PINANG 75 TIMUR LAUT
4 BARAT DAYA
66 SEBERANG PERAI UTARA
65 SEBERANG PERAI TENGAH
64 SEBERANG PERAI SELATAN
PERLIS 55 PERLIS
SELANGOR 56 PETALING
23 KLANG
11 GOMBAK
77 ULU LANGAT
33 KUALA LANGAT
36 KUALA SELANGOR
15 ULU SELANGOR
63 SABAK BERNAM
68 SEPANG
TERENGGANU 37 KUALA TERENGGANU
24 KEMAMAN
10 DUNGUN
8 BESUT
46 MARANG
16 HULU TERENGGANU
STATE ID DISTRICT
70 SETIU
WPKL 78 W.P. KUALA LUMPUR
PERAK 54 PERAK TENGAH
14 ULU PERAK
5 BATANG PADANG
25 KERIAN
31 KUALA KANGSAR
82 LARUT & MATANG
44 MANJUNG
13 HILIR PERAK
26 KINTA
PAHANG 38 KUANTAN
74 TEMERLOH
81 BERA
7 BENTONG
60 RAUB
21 JERANTUT
52 PEKAN
42 LIPIS
9 CAMERON HIGHLANDS
62 ROMPIN
45 MARAN
NEGERI SEMBILAN 69 SEREMBAN
72 TAMPIN
58 PORT DICKSON
20 JEMPOL
35 KUALA PILAH
18 JELEBU
61 REMBAU
KEDAH 2 BALING
3 BANDAR BAHARU
29 KOTA SETAR
34 KUALA MUDA
39 KUBANG PASU
40 KULIM
41 LANGKAWI
49 PADANG TERAP
71 SIK
79 YAN
53 PENDANG
59 PULAU-PULAU
13. Analyzing the Property.indd 107 3/11/14 5:00 PM
Journal of Business and Social Development Volume 2(1) 2014: 104-113
Syerrina Zakaria and Nuzlinda Abd. Rahman 108
The data employed in this study is the number of crime cases, which were obtained from Royal Malaysia Police (PDRM). There are two categories of crime cases included in the index crime statistics known as violent and property crime. The definition of index crime statistics is the crimes that are reported with sufficient regularity and with sufficient significance to be meaningful as an index to the crime situation (Sidhu, 2005). This study only considered the type of crime that is included in index crime measurement which is property crime. The property crime included housebreaking and theft by day, housebreaking and theft by night, theft of lorries and van, theft of motor car, theft of motorcycles and scooters, snatch theft and other forms of theft.
Two independent variables were considered in this study known as population density and unemployment rate. These variables are obtained from population and housing census report in Malaysia for the year 2000 (Jabatan Perangkaan Malaysia, 2000). Population density was calculated by dividing the total population for each square kilometer area in each district. Meanwhile, unemployment rate was calculated by dividing the number of persons unemployed in the specified category for the number of persons in the labour force in the same category. These rates were obtained from the official website of the Department of Statistics, Malaysia. As only the state’s unemployment rate data is available, each district in the same state is given the same value of the unemployment rate based on the state unemployment rate.
Methodology Moran’s I index was used to identify and measure the spatial autocorrelation. Global autocorrelation is calculated using the formula:
(1)
where is the violent
crime rate value in area i and xj is the violent crime rate value in area j (j ≠ i) . is the average value of with the sample number of n. wij is a weight that measure connectivity in area i with neighbour area j. In this study, we used contiguity weight (sharing a common border) known as rook contiguity weight was used the formula:
if location i and j sharing boundry otherwise (2)
The range of possible values of I lies between -1 and 1, with positive values indicate that the location under study have similar values as its neighbour thus the pattern is clustered. Meanwhile, negative values indicate the pattern is dispersed and 0 value means no spatial autocorrelation existed indicating the pattern is random.
The global Moran’s I value is used to check the clustering of spatial pattern in the study area globally, but it does not show where the location of the cluster exist. In order to measure the local spatial correlation, the local Moran’s I was used (Anselin, 1995). The local Moran’s Ii was determined using the formula:
(3)
The spatial autocorrelation can be divided into four categories. A high positive value of indicates that the location under study is spatially clustered. A high-high cluster shows that a high value in a location is surrounded with a high value in the neighbours. Low-low cluster shows that a low value in a location is surrounded with a low value in the neighbours. Meanwhile, a high negative value of means that the location under study is spatially dispersed. High-low outlier means that a high value in a location is surrounded with a low value in the neighbours. Low-high outlier shows that a low value in a location is surrounded with a high value in the neighbours. Other areas are categorized as areas that do not have a significant clustering of crime.
13. Analyzing the Property.indd 108 3/11/14 5:00 PM
Journal of Business and Social Development Volume 2(1) 2014: 104-113
ANALYZING THE PROPERTY CRIME PATTERNS IN PENINSULAR MALAYSIA 109
To test the statistical significance of Moran’s index, the null hypothesis states that there is no spatial clustering of the values associated with the geographic features in the study area. According to Anselin (1995), the significance of I values can be tested by using the z-score
Under the total
permutation hypothesis, the expected value of I is
(4)
with variance (www.passagesoftware.net/manual.php):
(5)
where Wi is the sum of the weights connected
to location i, Wi = is the sum of the
squared weights connected to location i, Wi(2) =
and
(6)
Moran’s I, index maps will be constructed using the Geographic Information System, ArcGis 9.3 software (ESRI, U.S).
Result and DiscussionAs a preliminary analysis, Figure 1 shows the line graph of crime cases in Malaysia from the year 2000 to 2009. It shows that violent crime cases have remained along the same gradual growth from year 2000 until year 2005 and was slightly higher from year 2005 until 2009. On the other hand, property crime cases showed fluctuation trends throughout the study period. From year 2000 until 2001 and between years 2008 until 2009, the property crime cases showed the downward trend, whereas for year 2002 until 2007, it shows an upward trend. The figure also shows that property crime cases were the main contributor to the total crime since the patterns of this crime were very similar to the pattern of total crime cases. The violent crime cases have increased from 21561 in 2000 to 40738 in 2009. This is an increase of 88.9%. The property crime cases have increased by 15.9% in this period. Although the number of cases for violent crime was less than the number of cases for property crime, violent crime was growing at a faster rate compared to property crime. Overall, the total crime cases had increased about 25.3% from the year 2000 until 2009.
For the purpose of mapping, three year time points, 2001, 2005 and 2009 were selected based on the crime situation which represents the turning time point to different crime trends period (Figure 1).
Figure 1: Crime cases (violent crimes, property crime and total [violent and property crimes]) in Malaysia 2000 – 2009.
13. Analyzing the Property.indd 109 3/11/14 5:00 PM
Journal of Business and Social Development Volume 2(1) 2014: 104-113
Syerrina Zakaria and Nuzlinda Abd. Rahman 110
Table 2 shows the general trend of global spatial autocorrelation from the year 2000 until 2009. Based on the permutation approach applied in S-Plus software, the results showed that there were positive spatial autocorrelation with significant p-values in all the years throughout the study period. The variations of the log rate of property crime across space showed the presence of spatial pattern in the study area. For further analysis, local indicator spatial autocorrelation (LISA) was used to measure the local spatial cluster which can help to identify the existence of spatial autocorrelation in each location (district) known as local Moran’s .
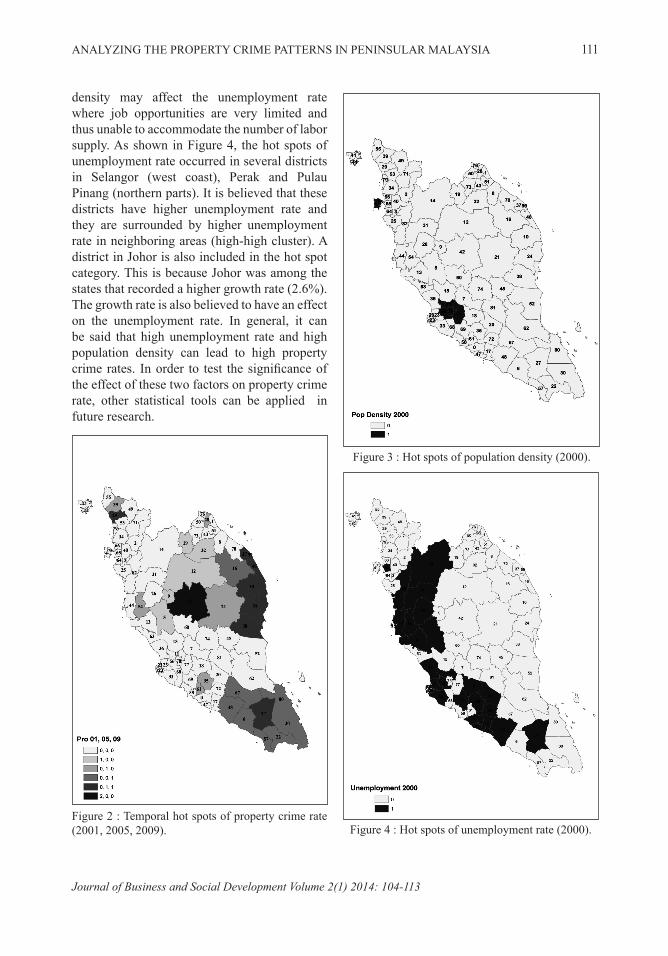
In this study, we defined hot spots as the area with positive and statistically significant . Hot spots area means area with high log rate of property crime tends to have high log rate of property crime (high-high cluster) or vice versa (low-low cluster). The map of hot spots were constructed by overlaying hot spots in 2001, 2005 and 2009 for the log rate of property crime, and the hot spots map in 2000 for population density and unemployment rates. Figure 2 shows the distribution of property crime hot spots with six categories of temporal hot spots for the log rate of property crime. A district is labelled as “1, 1, 1” if it is in hot spot category for all three years (2001, 2005, 2009). If the area is a hot spot for the log rate of property crime for 2005 and 2009 but not in 2001, it is labeled as “0, 1, 1”. Hence, the label of “0, 0, 0” suggests that the district has never been a hot spot for all the three years. While another category represent districts with the distribution of property crime rates that is statistically significant dispersed. That is, category “2, 0, 0” means that the rate of property crime is dispersed statistically significant in 2001 but not in 2005 and 2009.
From the maps, districts that are in a darker (except the darkest) color indicate that they are hot spots areas for more years as compared to
the districts with a brighter color. There are 26 districts in four categories of hot spots for property crime rate. Fifty five districts has never been a hot spot for property crime rates in three years. There are 5 districts in hot spot category “1, 0, 0”, 6 districts in the “0, 1, 0”, 8 districts in the “0, 0, 1” and the seven districts in the “0, 1, 1”. While one area fall in the category of “2, 0, 0”. There is no district in the hot spot category for all three years. Based on Figure 2, there are seven districts that fall in hot spot category in two years (2005, 2009). Five districts are located in the east coast parts of Peninsular Malaysia and two districts are located in the southern part. That means, the crime situation in this area is very similar to the crime situation in their neighboring areas either in the low-low or high-high clustering.
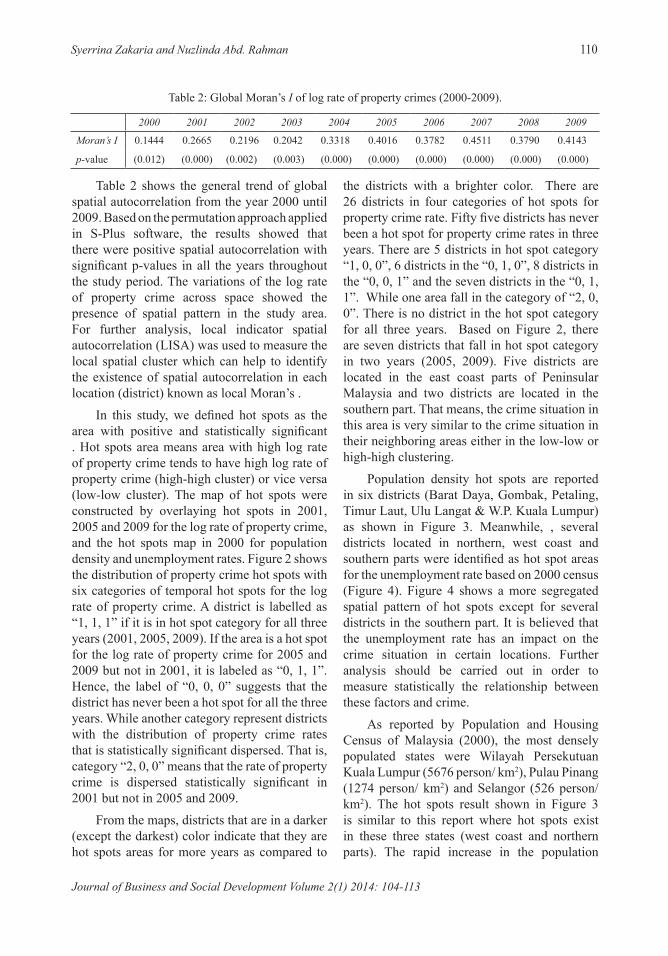
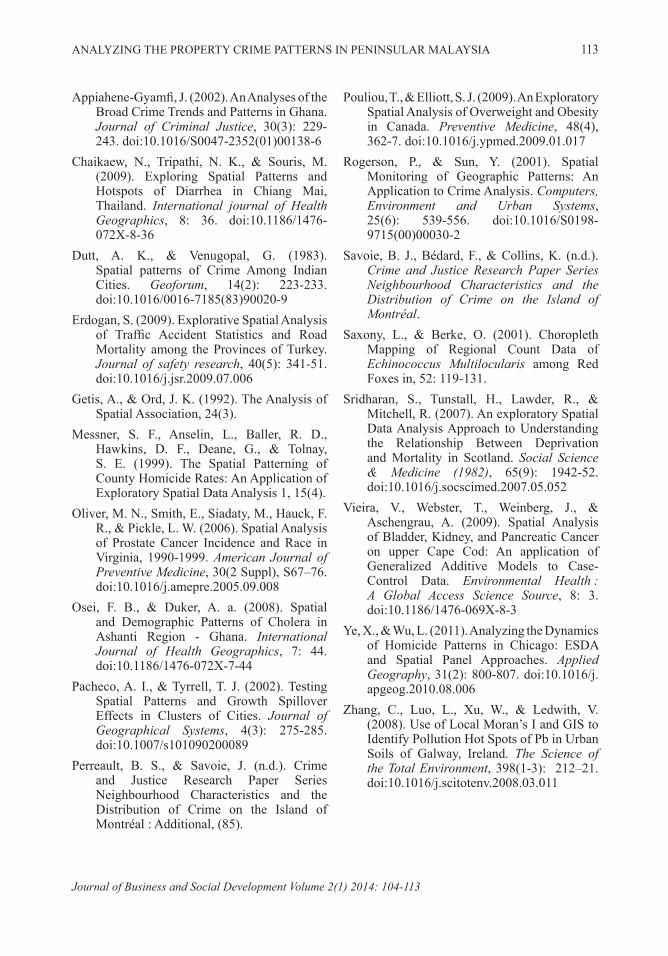
Population density hot spots are reported in six districts (Barat Daya, Gombak, Petaling, Timur Laut, Ulu Langat & W.P. Kuala Lumpur) as shown in Figure 3. Meanwhile, , several districts located in northern, west coast and southern parts were identified as hot spot areas for the unemployment rate based on 2000 census (Figure 4). Figure 4 shows a more segregated spatial pattern of hot spots except for several districts in the southern part. It is believed that the unemployment rate has an impact on the crime situation in certain locations. Further analysis should be carried out in order to measure statistically the relationship between these factors and crime.
As reported by Population and Housing Census of Malaysia (2000), the most densely populated states were Wilayah Persekutuan Kuala Lumpur (5676 person/ km2), Pulau Pinang (1274 person/ km2) and Selangor (526 person/ km2). The hot spots result shown in Figure 3 is similar to this report where hot spots exist in these three states (west coast and northern parts). The rapid increase in the population
Table 2: Global Moran’s I of log rate of property crimes (2000-2009).
13. Analyzing the Property.indd 110 3/11/14 5:00 PM
Journal of Business and Social Development Volume 2(1) 2014: 104-113
ANALYZING THE PROPERTY CRIME PATTERNS IN PENINSULAR MALAYSIA 111
density may affect the unemployment rate where job opportunities are very limited and thus unable to accommodate the number of labor supply. As shown in Figure 4, the hot spots of unemployment rate occurred in several districts in Selangor (west coast), Perak and Pulau Pinang (northern parts). It is believed that these districts have higher unemployment rate and they are surrounded by higher unemployment rate in neighboring areas (high-high cluster). A district in Johor is also included in the hot spot category. This is because Johor was among the states that recorded a higher growth rate (2.6%). The growth rate is also believed to have an effect on the unemployment rate. In general, it can be said that high unemployment rate and high population density can lead to high property crime rates. In order to test the significance of the effect of these two factors on property crime rate, other statistical tools can be applied in future research.
Figure 4 : Hot spots of unemployment rate (2000).Figure 2 : Temporal hot spots of property crime rate (2001, 2005, 2009).
Figure 3 : Hot spots of population density (2000).
13. Analyzing the Property.indd 111 3/11/14 5:00 PM
Journal of Business and Social Development Volume 2(1) 2014: 104-113
Syerrina Zakaria and Nuzlinda Abd. Rahman 112
ConclusionCrime is one of the major problems that have been faced by most of the countries in the world including Malaysia. This social problem will cause not only loss of property, lives and misery but it also gives a large impact on many aspects such as the psychological and economical aspects. Mass media plays an important role in the public’s perception on the incident of crimes. The sensational news of crime that is widely disseminated by the press and the media have caused more fear amongst the public compared to the official statistics reported by police.
This study has reported empirical findings on the spatial autocorrelation in the log of property crime rate according to districts in Peninsular Malaysia. By using ArcGIS and spatial statistic tools, the analysis and decision can be done at the regional level with regard to the problematic area and precautionary measures. The hot spot areas were identified and reported visually to give a clearer picture of property crime situation in Peninsular Malaysia. The neighborhood characteristics are important and should be considered in order to understand the pattern of crimes. Based on the maps for the two independent variables, there are relationships with the property crime rate in several districts. Thus, the study of these two factors in detail should be conducted in order to understand and measure their relationships with property crime rate. By using the spatial analysis, the true situation of property crime occurence can be detected in each unit of analysis (district) instead of in a global location (Peninsular Malaysia).
It is believed that a study on spatial and demographic patterns of crime will provide useful information for government, safety department and policy makers to make appropriate planning especially in resource allocation and to develop suitable strategies for future plan in order to overcome the crime problems. Actions or strategic planning in controlling and addressing the crime problem in the high risk areas not only has to consider the factors that influence crime in that particular
area, but also the situation of neighboring areas. Although there is no intelligence formula that can be used to reveal future crime situations, the forecast information of future trends by using past data is a valuable tool to policy makers to develop crime prevention programmes. These outcomes can be used by them in order to target particular populations and develop interventions so that actions are better adapted to the environmental and socio-economic setting. To have a better crime forecasts with a high degree of accuracy other factors such as socio-economics, demographics and environments should be considered. Therefore, a well-organized data collection and computer storage are very important. It could allow spatial pattern analysis over space and time become easier and effective.
This study, however, can be used as a preliminary analysis. In order to explore and measure the relationship between crime and the independent variables, some statistical modelling can be used. One of the possible methods is by using spatial regression model.
AcknowledgementThis research was supported by Short Term Grant offered by Universiti Sains Malaysia (304/PMATHS/6310041) and a postgraduate scholarship from the Ministry of Higher Education, Malaysia. The crime data were provided by Royal Malaysian Police (PDRM).
References
Anselin, L. (1995). Local Indicators of Spatial Association – LISA. Geographical Analysis, 27(2): 93-115.
Andresen, M. a. (2011). Estimating the probability of Local Crime Clusters: The Impact of Immediate Spatial Neighbors. Journal of Criminal Justice, 39(5): 394-404. doi:10.1016/j.jcrimjus.2011.05.005
Appiahene-gyamfi, J. (1998). Violent Crime in Ghana : The Case of Robbery, 26(5): 409-424.
13. Analyzing the Property.indd 112 3/11/14 5:00 PM
Journal of Business and Social Development Volume 2(1) 2014: 104-113
ANALYZING THE PROPERTY CRIME PATTERNS IN PENINSULAR MALAYSIA 113
Appiahene-Gyamfi, J. (2002). An Analyses of the Broad Crime Trends and Patterns in Ghana. Journal of Criminal Justice, 30(3): 229-243. doi:10.1016/S0047-2352(01)00138-6
Chaikaew, N., Tripathi, N. K., & Souris, M. (2009). Exploring Spatial Patterns and Hotspots of Diarrhea in Chiang Mai, Thailand. International journal of Health Geographics, 8: 36. doi:10.1186/1476-072X-8-36
Dutt, A. K., & Venugopal, G. (1983). Spatial patterns of Crime Among Indian Cities. Geoforum, 14(2): 223-233. doi:10.1016/0016-7185(83)90020-9
Erdogan, S. (2009). Explorative Spatial Analysis of Traffic Accident Statistics and Road Mortality among the Provinces of Turkey. Journal of safety research, 40(5): 341-51. doi:10.1016/j.jsr.2009.07.006
Getis, A., & Ord, J. K. (1992). The Analysis of Spatial Association, 24(3).
Messner, S. F., Anselin, L., Baller, R. D., Hawkins, D. F., Deane, G., & Tolnay, S. E. (1999). The Spatial Patterning of County Homicide Rates: An Application of Exploratory Spatial Data Analysis 1, 15(4).
Oliver, M. N., Smith, E., Siadaty, M., Hauck, F. R., & Pickle, L. W. (2006). Spatial Analysis of Prostate Cancer Incidence and Race in Virginia, 1990-1999. American Journal of Preventive Medicine, 30(2 Suppl), S67–76. doi:10.1016/j.amepre.2005.09.008
Osei, F. B., & Duker, A. a. (2008). Spatial and Demographic Patterns of Cholera in Ashanti Region - Ghana. International Journal of Health Geographics, 7: 44. doi:10.1186/1476-072X-7-44
Pacheco, A. I., & Tyrrell, T. J. (2002). Testing Spatial Patterns and Growth Spillover Effects in Clusters of Cities. Journal of Geographical Systems, 4(3): 275-285. doi:10.1007/s101090200089
Perreault, B. S., & Savoie, J. (n.d.). Crime and Justice Research Paper Series Neighbourhood Characteristics and the Distribution of Crime on the Island of Montréal : Additional, (85).
Pouliou, T., & Elliott, S. J. (2009). An Exploratory Spatial Analysis of Overweight and Obesity in Canada. Preventive Medicine, 48(4), 362-7. doi:10.1016/j.ypmed.2009.01.017
Rogerson, P., & Sun, Y. (2001). Spatial Monitoring of Geographic Patterns: An Application to Crime Analysis. Computers, Environment and Urban Systems, 25(6): 539-556. doi:10.1016/S0198-9715(00)00030-2
Savoie, B. J., Bédard, F., & Collins, K. (n.d.). Crime and Justice Research Paper Series Neighbourhood Characteristics and the Distribution of Crime on the Island of Montréal.
Saxony, L., & Berke, O. (2001). Choropleth Mapping of Regional Count Data of Echinococcus Multilocularis among Red Foxes in, 52: 119-131.
Sridharan, S., Tunstall, H., Lawder, R., & Mitchell, R. (2007). An exploratory Spatial Data Analysis Approach to Understanding the Relationship Between Deprivation and Mortality in Scotland. Social Science & Medicine (1982), 65(9): 1942-52. doi:10.1016/j.socscimed.2007.05.052
Vieira, V., Webster, T., Weinberg, J., & Aschengrau, A. (2009). Spatial Analysis of Bladder, Kidney, and Pancreatic Cancer on upper Cape Cod: An application of Generalized Additive Models to Case-Control Data. Environmental Health : A Global Access Science Source, 8: 3. doi:10.1186/1476-069X-8-3
Ye, X., & Wu, L. (2011). Analyzing the Dynamics of Homicide Patterns in Chicago: ESDA and Spatial Panel Approaches. Applied Geography, 31(2): 800-807. doi:10.1016/j.apgeog.2010.08.006
Zhang, C., Luo, L., Xu, W., & Ledwith, V. (2008). Use of Local Moran’s I and GIS to Identify Pollution Hot Spots of Pb in Urban Soils of Galway, Ireland. The Science of the Total Environment, 398(1-3): 212–21. doi:10.1016/j.scitotenv.2008.03.011
13. Analyzing the Property.indd 113 3/11/14 5:00 PM