Technical Report # 1203 Analyzing the Reliability of the easyCBM Reading Comprehension Measures: Grade 4 Bitnara Jasmine Park P. Shawn Irvin Julie Alonzo Cheng-Fei Lai Gerald Tindal University of Oregon
Transcript
Technical Report # 1203
Analyzing the Reliability of the easyCBM Reading
Comprehension Measures:
Grade 4
Bitnara Jasmine Park
P. Shawn Irvin
Julie Alonzo
Cheng-Fei Lai
Gerald Tindal
University of Oregon
Published by Behavioral Research and Teaching University of Oregon • 175 Education 5262 University of Oregon • Eugene, OR 97403-5262 Phone: 541-346-3535 • Fax: 541-346-5689 http://brt.uoregon.edu
Note: Funds for this data set used to generate this report come from a federal grant awarded to the UO from Reliability and Validity Evidence for Progress Measures in Reading. U.S. Department of Education, Institute for Education Sciences. R324A100014. June 2010 - June 2014.
The University of Oregon is committed to the policy that all persons shall have equal access to its programs, facilities, and employment without regard to race, color, creed, religion, national origin, sex, age, marital status, disability, public assistance status, veteran status, or sexual orientation. This document is available in alternative formats upon request.
Abstract
In this technical report, we present the results of a reliability study of the fourth-grade
multiple choice reading comprehension measures available on the easyCBM learning
system conducted in the spring of 2011. Analyses include split-half reliability, alternate
form reliability, person and item reliability as derived from Rasch analysis, top / bottom
reliability, and repeated measures analysis of variance (ANOVA). Results suggest
adequate reliability for the fourth-grade multiple choice reading comprehension
measures.
p.
1
Analyzing the Reliability of the easyCBM Reading Comprehension Measures: Grade 4
Curriculum-based measures (CBMs) are standardized assessments with a rich history of
use for screening students at risk for difficulty in reading as well as for tracking the progress
students make in gaining essential skills over the course of a school year (Alonzo, Ketterlin-
Geller, & Tindal, 2006). In recent years, the widespread adoption of Response to Intervention
(RTI) as a model for instructional delivery and school-wide improvement efforts has resulted in
renewed attention being given to CBMs and a greater emphasis being placed on their technical
adequacy for a variety of uses. One concern expressed by practitioners and researchers alike is
the degree to which the brief, individually-administered fluency-based probes most frequently
identified with CBM are appropriate for use with older students. As students move from
elementary to secondary school, there is some evidence to suggest that more complex CBMs,
designed to measure more challenging constructs, such as reading comprehension and
vocabulary in context may be more appropriate (Yovanoff, Duesbery, Alonzo, & Tindal, 2005).
In this technical report, we describe a study of the reliability of the easyCBM fourth-grade
multiple choice reading comprehension measures conducted in 2011.
Methods
In this section, we describe the methods used in conducting a study of the split-half and
top-bottom reliability, as well as Rasch analyses of grade 4 multiple-choice reading
comprehension (MCRC) measures from the easyCBM® assessment system.
Setting and Participants
The study was conducted in elementary and middle schools from two Pacific Northwest
public school districts in the spring of 2011. District A was diverse, and comprised of
approximately 8,900 students, of which approximately 56% were White, 11% Hispanic, 15%
p.
2
Asian-Pacific Islander, 11% Multiracial, 7% Black, and 1% American Indian-Alaskan Native
students. About 26% of students were eligible for free or reduced-priced meals. Students in
District A outperformed their peers in the state on the statewide reading assessment. On average,
more than 79% of students in grades 3-8 tested proficient on the statewide reading test, compared
to about 67% for the state. In all, 27 teachers (six in grade 2, four in grade 3, five in grade 4, six
in grade 5, and six in grade 6) and 715 students participated in the study from District A.
District B was a large and diverse school district, of approximately 14,000 students, with
a demographic make-up of approximately 56% White, 15% Hispanic, 11% Asian-Pacific
Islander, 11% Multiracial, 6% Black, and 2% American Indian-Alaskan Native students. About
34% of students in the district were eligible for free or reduced-priced meals. In 2010, students
from District B slightly outperformed their peers in the state on the statewide reading
assessment. On average, a little fewer than 69% of students in grades 3-8 tested proficient on the
state reading test, compared to about 67% for the state. Fourth grade showed the largest
difference between students scoring proficient for the district and state, 72% compared to 67%,
respectively. Six teachers (two in grades 3 and 7, one in grades 4 and 8) and 317 students
participated in the study from District B.
Because we wanted to investigate the reliability for the full grade range of easyCBM®
MCRC tests, we recruited participants from grades 2-8, with a goal of recruiting six teachers,
with a corresponding six classes of students, from each of these seven grades. We successfully
recruited six teachers for grades 2-6. Two teachers were recruited for grade 7 (seven total
classes of students), and one for grade 8 (three total classes). The average class size across all
grades was 27 students. Teachers were recruited at the district level and were compensated $150
for participating in the study. The three participating teachers in grades 7 and 8 were given
p.
3
additional stipend money because they administered comprehension measures to more than one
class of students. All students in attendance on the days the MCRC tests were administered
participated in the study.
Multiple-choice Reading Comprehension Measures
The reading comprehension measures on easyCBM® are designed for group
administration and are available for grades 2-8. Students first read an original work of narrative
fiction and then answer multiple-choice questions (12 questions on the grade 2 test, 20 questions
on each of the grade 3-8 tests) based on the story. Multiple-choice questions are designed to
assess literal and inferential comprehension on all grade level tests; evaluative comprehension is
also assessed on the grade 3-8 tests. Each question is comprised of the question stem and three
possible answer choices: the correct answer and two incorrect but plausible distractors. The
comprehension measures have a total of 12 points (grade 2) or 20 points (grades 3-8) possible;
students earn one point for every question they answer correctly.
We selected the format of the reading comprehension tests based on prior empirical work
with local school districts (Alonzo & Tindal, 2004a, 2004b, 2004c). In this work, teachers had
expressed their desire for tests that closely resembled the types of readings students regularly
encountered in their classes. At the same time, concerns about increasing the reliability, ease of
use, and cost-effectiveness of our measures prompted us to use selected response rather than
open-ended question types in our comprehension measures. Accordingly, we developed the
MCRC tests in a two-step process. First, we wrote the stories that were used as the basis for
each test. Then, we wrote the test items associated with each story. We embedded quality
control and content review processes in both these steps throughout instrument development.
Two people, selected for their expertise in instrument development and language arts,
p.
4
were principally involved with overseeing the creation of the MCRC tests. The first person
oversaw the creation and revision of the stories and test items earned her Bachelor of Arts degree
in Literature from Carleton College in 1990, worked for twelve years as an English teacher in
California public schools, was awarded National Board for Professional Teaching Standards
certification in Adolescent and Young Adulthood English Language Arts in 2002, and earned her
Ph.D. in the area of Learning Assessments/System Performance at the University of Oregon.
The second person hired to write the MCRC items earned his Ph.D. in education psychology,
measurement, and methodology from the University of Arizona. He has worked in education at
the elementary and middle school levels, as well as in higher education and at the state level. He
held a position as associate professor in the distance-learning program for Northern Arizona
University and served as director of assessment for a large metropolitan school district in
Phoenix, Arizona. In addition, he served as state Director of Assessment and Deputy Associate
Superintendent for Standards and Assessment at the Arizona Department of Education. He was
a test development manager for Harcourt Assessment and has broad experience in assessment
and test development.
Grade 4 test development. The two individuals hired to develop the grade 4 measures
worked together to create documentation for story-writers to use while creating their stories.
This written documentation was provided to increase the comparability of story structure and
reduce the likelihood of construct irrelevant variance related to variation in story type affecting
student performance on the different forms of the comprehension measures. Story creation
specifications provided information about the length of the stories (approximately 1500 words),
characters, settings, and plots. Stories, which were composed between December 2005 and
March 2006, were written by a variety of people who were either elementary and secondary
p.
5
school teachers or graduate students in the College of Education. In all, 28 stories were written
for grades 4; 8 did not pass the criteria required for use in the assessment system, leaving 20 to
be piloted.
The professional item writer we hired created 20 multiple-choice questions, each with 3
possible answer options, for each form of the grade 4 MCRC test. In all, he wrote 400 multiple-
choice questions at the grade 4 level. All fourth-grade questions were written in March and
April of 2006. For fourth-grade MCRC tests, we wrote seven questions targeting literal
comprehension, seven questions targeting inferential comprehension, and six questions targeting
evaluative comprehension, for a total of 20 items on each form of the test. Within each type of
comprehension, item-writing specifications called for a range of difficulty such that each form of
each test contained some easy, moderate, and difficult items in each of the types of
comprehension assessed on that test. Item-writing specifications also guided the ordering of the
items on each form of the MCRC test. In all cases, we followed a similar pattern of item
ordering, beginning with the easiest literal comprehension item and continuing with items of
increasing difficulty, ending with an item designed to be one of the most challenging, pulled
from the highest level of comprehension assessed in that grade level (evaluative comprehension
in grade 4). Once the multiple-choice items were written, the stories and item lists were
formatted into individual tests, each comprised of a story and 20 multiple-choice test items.
Alonzo, Liu and Tindal (2007) provided a detailed description of the development and technical
adequacy of the grade 4 MCRC test.
Grade 4 test selection and administration. We selected a subset of MCRC grade 4
forms (roughly 60% of those available through the easyCBM® assessment system) to use in this
study. We used forms 8, 9, 10, 11, 12, 13, 14, 15, and 16 in this study. We selected the grade 4
p.
6
forms because higher form numbers are typically used less in the classroom compared to the
lower-numbered assessment forms (e.g., forms 1-7) on which we have already completed earlier
research; thus, we deemed further understanding form and item-level reliability statistics of the
selected forms a priority.
Each student participated in the testing on three separate testing occasions in three
different sessions, roughly one week apart. Each comprehension measure was group
administered by the classroom teacher. In the first session, students completed a comprehension
form assigned by class. Roughly one week later, students completed an alternate form of the
comprehension measure. On the final testing occasion, students completed a third alternate
form. To reduce the possibility of the order of the forms completed adversely affecting testing
results, we assigned comprehension forms within a given grade at the class level based on a two-
group counterbalanced measure design. For instance, the first of the six participating grade 4
classes completed forms 11, 12, and 13, in that order, over the three testing occasions; the second
grade 4 class completed forms 13, 12 and 11 (the opposite order of the first). We used the same
counterbalanced measure design for all classes and all grades in the study.
Analysis
We used a variety of approaches to study the reliability of the easyCBM comprehension
assessments: repeated measures analysis of variance, split half reliability using the Guttman
formula, top/bottom reliability, and Rasch analysis. Each of these analytic approaches is
explained in more detail in the following section.
One-way repeated measures analysis of variance. To examine whether there was a
significant difference in difficulty across the forms, we conducted one-way repeated measures
analysis of variance (ANOVA). Each student completed three test forms in each grade. When
p.
7
there was a statistically significant within-subject effect, the mean differences among the three
forms were further analyzed to investigate where the significant within-subject difference
resided.
Split-half reliability. We conducted form and item-level reliability analyses for all
grades in this study. To assess overall reliability of the MCRC measure, we examined the
internal consistency among items within each selected test form using split-half reliability
coefficients calculated from the Guttman formula using SPSS 19 (SPSS Inc., 2010). We used
the Guttman formula to calculate split-half reliability coefficients because the Guttman formula
does not assume homogeneity of test halves and will not overestimate the full-form reliability
(Kerlinger & Lee, 2000). Thus, we felt the Guttman formula provided a more conservative and
reasonable estimate of full test form reliability.
Top-bottom reliability. We computed the total score based on the scored item-level
data, with unanswered items scored as incorrect (i.e., “0”). The possible total score for grade 4
forms is 20. Because easyCBM® progress monitoring measures were developed to target
students who are at-risk for academic failure, items should function differently for students who
are at or below the 23rd percentile (i.e., lower percentiles) and those who are at or above the 78th
percentile (i.e., higher percentiles). To evaluate the appropriateness of items, item functioning
was compared between the two aforementioned groups. The scores corresponding to the 23rd
and 78th percentiles were computed for each form. Then, the proportions of correct responses
for each item for the two groups were analyzed. Both groups should demonstrate high
proportions of correct responses for an easy item that functions appropriately. For a difficult
item that is functioning appropriately, the proportion of correct responses for the lower percentile
group should be lower than that for the higher percentile group. A higher proportion of correct
p.
8
responses for the lower percentile group indicates that the item may not be functioning
appropriately.
Rasch analyses. Data from the pilot testing of the MCRC measures were analyzed with
a one-parameter logistic Rasch analysis using the software Winsteps 3.68.2 (Linacre, 2009).
Unlike classical statistics, Rasch analyses consider patterns of responses across individuals,
providing information at a level of specificity in results unattainable with approaches based on
classical statistics used in the development of most CBMs. In a complex iterative process, a
Rasch analysis concurrently estimates the difficulty of individual test items and the ability level
of each individual test taker. The results, relevant to the discussion here, include an estimation
of the difficulty (referred to as the ‘measure’) of each item, the standard error of measure
associated with each item’s estimated difficulty, and the degree to which each item ‘fits’ the
measurement model (referred to as the ‘mean square outfit’). In addition, a Rasch analysis can
provide information about the average estimated ability of students who selected each of the
possible answer choices. All of this information must be considered when evaluating the
technical adequacy of the measures, as described below.
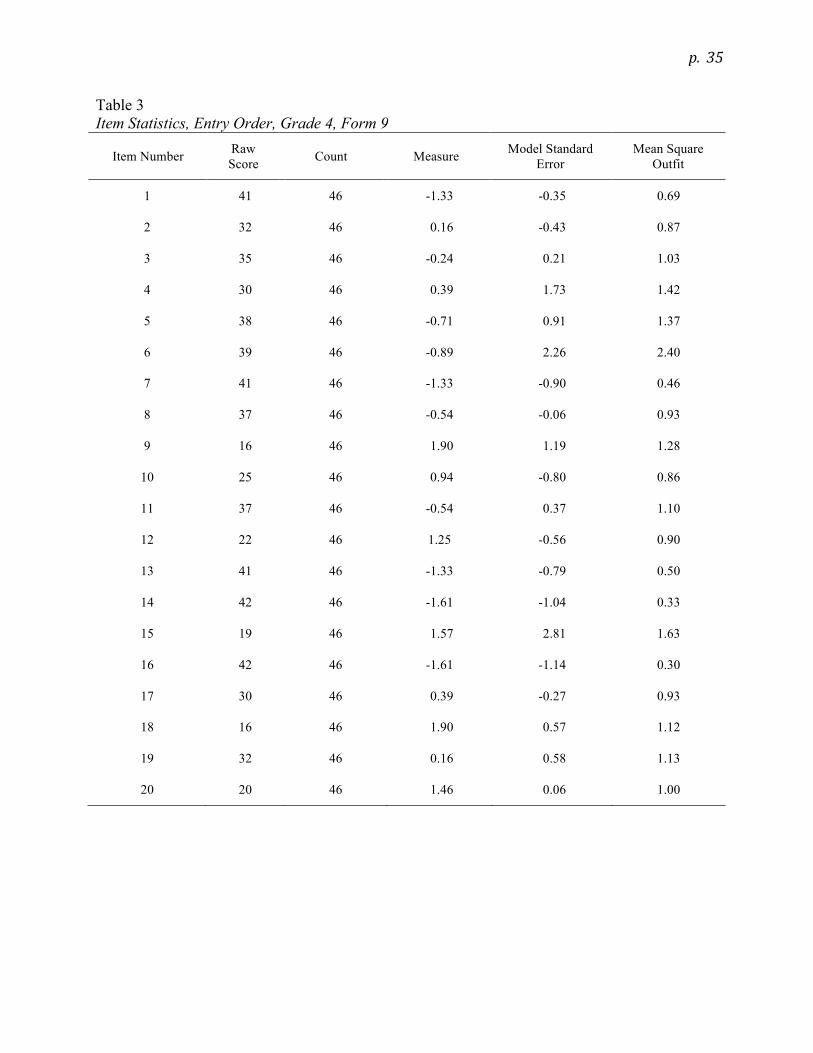
Considering item estimated difficulty. Rasch analyses, which examine each item’s
reliability, provide a more precise treatment of reliability than classical statistics, which examine
the issue from a global test level. The most reliable estimation of a test-taker’s ability can be
gained from tests comprised of items that represent the fullest range of difficulty possible for the
population for which the test is intended. Thus, to evaluate the technical adequacy of our MCRC
measures, we looked for items representing a range of difficulties. In Rasch analyses, this
information is gleaned from examining each item’s measure. Easy items will have measures
represented with negative numbers; difficult items will have measures represented with positive
p.
9
numbers. A measure of zero indicates an item that a person of average ability would be expected
to have a 50% chance of getting correct. Thus, we sought a full range of measure on every
MCRC test form.
Examining the standard error of measure. Rasch analyses also provide information
about the standard error of measure associated with the estimation of each item’s measure.
Generally, the smaller the standard error of measure, the more reliable the estimation is. We
sought small standard errors of measure for all items on our MCRC tests.
Using the mean square outfit to evaluate goodness of fit. An additional piece of
information used to evaluate technical adequacy in a Rasch model is the mean square outfit
associated with each item. Values in the range of 0.50 to 1.50 are considered acceptable fit.
Mean square outfits falling outside this acceptable range indicate the need for further evaluation
of item functioning. In general, items with a mean square outfit less than 0.50 are considered
less worrisome than items with mean square outfits higher than 1.50 because items falling into
the former category perform more consistently (e.g., every student regardless of ability gets the
item correct or incorrect) compared to items in the latter category that function more
inconsistently (e.g., students who perform poorly on all other items, always get the item correct)
(Linacre, 2002). In all cases, distractor analysis provides useful information to further evaluate
the technical adequacy of each item.
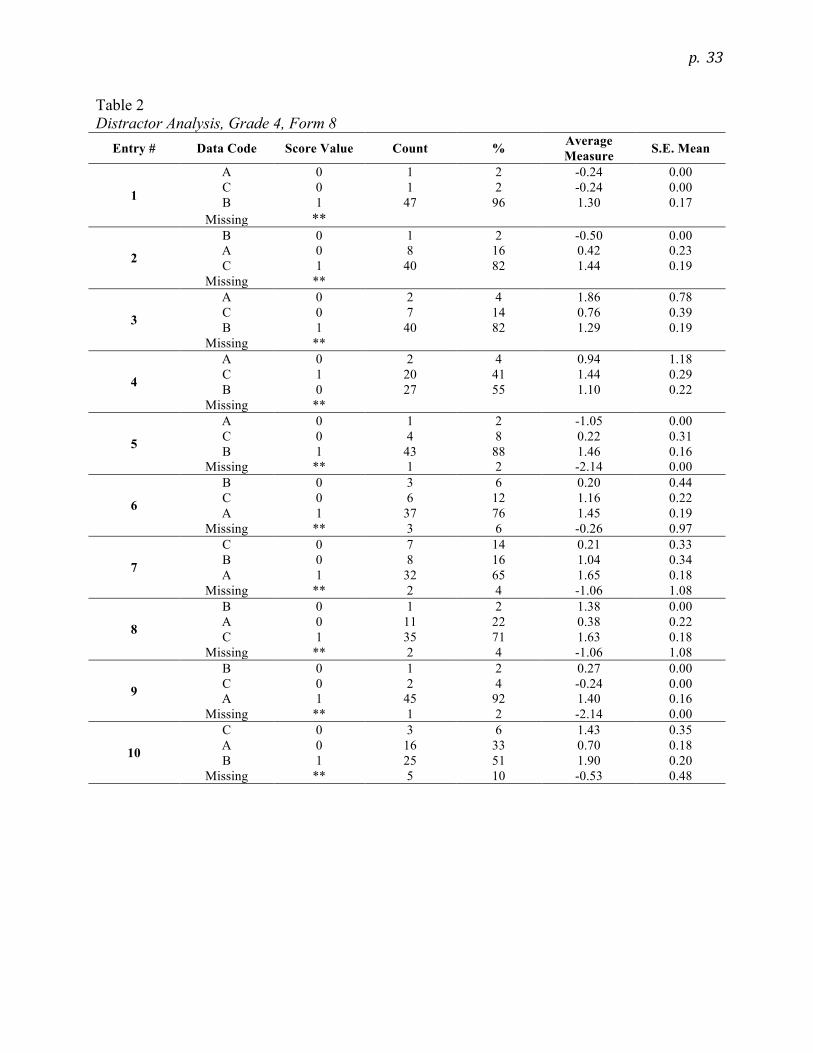
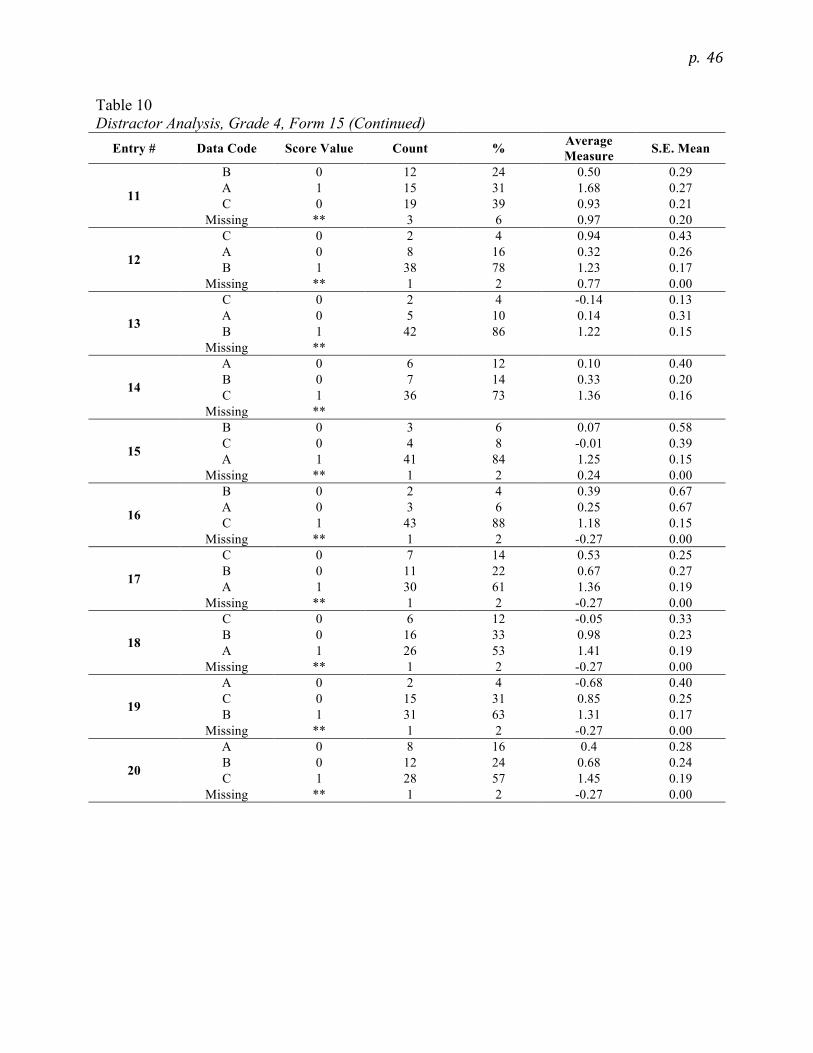
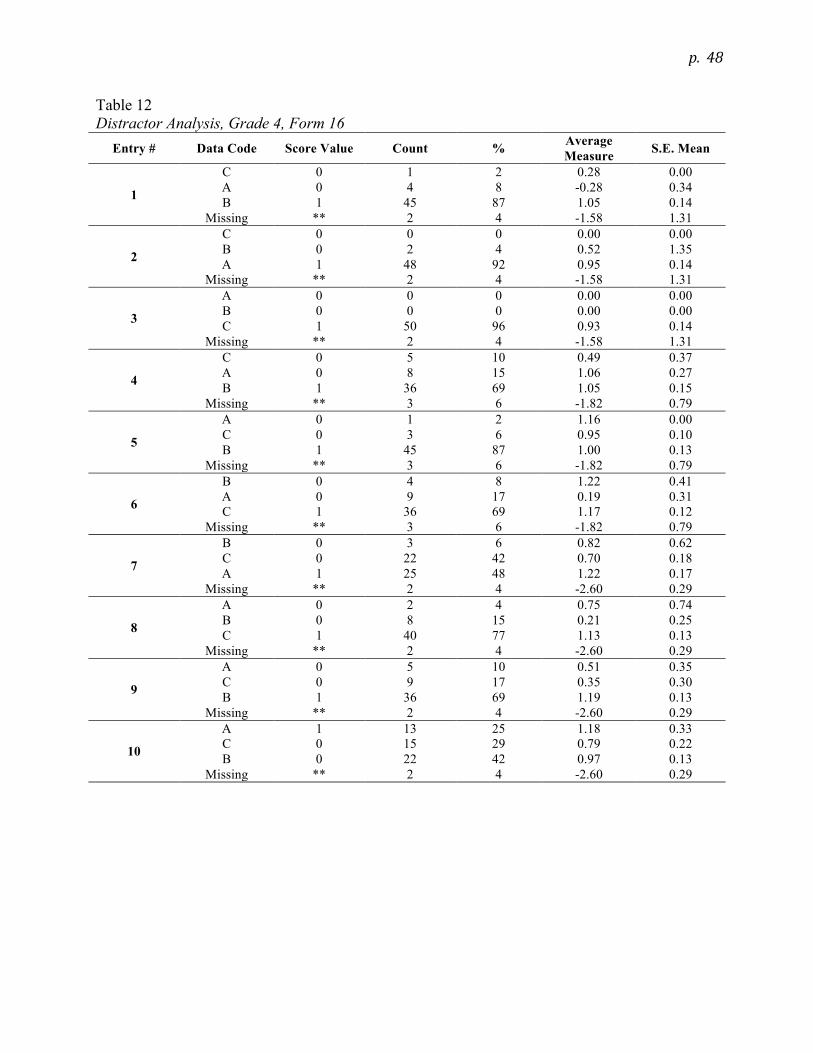
Analyzing distractor selection information. A distractor analysis provides information
on the average estimated ability of test takers who selected a particular distractor on a test. In
evaluating the technical adequacy of an assessment instrument, one hopes to see that the correct
answer is selected by test-takers with the highest average estimated ability and the remaining
distractors are selected by test-takers with lower estimated abilities. In addition, every distractor
p.
10
in a well-constructed measure will be selected by at least some test-takers. We considered all of
these features in evaluating the technical adequacy of the MCRC measures.
Analyzing person and item reliability. Rasch analyses report both the person and item
reliability. The person reliability is equivalent to the traditional test reliability. Low values
indicate a narrow range of person measures, or a small number of items. Therefore, testing
persons with more extreme abilities (high and low) or lengthening the measure would increase
the person reliability. Winsteps’ item reliability has no traditional equivalent. Low item
reliability values indicate a narrow range of item measures or a small sample. A larger sample of
persons would increase item reliability. Low item reliability means that the sample size is too
small to precisely locate the items on the latent variable (i.e., ability).
Results
In this section we report results from split-half and top-bottom reliability, as well as
Rasch analyses of grade 4 multiple-choice reading comprehension (MCRC) measures from the
easyCBM® assessment system. It should be noted that results from grade 4 MCRC forms 11, 12
and 13 were dropped because the sample size was too small (n = 25 for forms 11 and 13, n = 24
for form 12) for reliability and item-level Rasch analyses to be considered.
Grade 4 Equivalence by Form
In this section we report findings concerning the equivalence of MCRC forms. We used
one-way repeated measures ANOVA to evaluate equivalence of difficulty across the MCRC
forms. Because like groups of students took three MCRC forms, each roughly one week apart,
we evaluated the difficulty equivalence of each set of the three forms that were taken by the
same group of students. Mean differences between forms 8, 9, and 10 as well as forms 14, 15,
and 16 were not significantly different. Tables 1-4 in Appendix A display descriptive statistics
p.
11
and the complete results of repeated measures ANOVA, as well as post-hoc analyses conducted
to compare mean differences for the grade 4 MCRC measures used in the study.
Grade 4 Split-half Reliability
In this section we report overall reliability of the MCRC measure based on internal
consistency among items within each selected test form using split-half reliability coefficients
calculated with the Guttman formula. Split-half reliability coefficients were computed by
comparing the results from the first 10 items of the MCRC measure to the second 10 items for all
students in the sample taking each form. Some coefficients were calculated based on less than
20 items (e.g., form 16 in grade 4) if a given item did not have enough variance to calculate
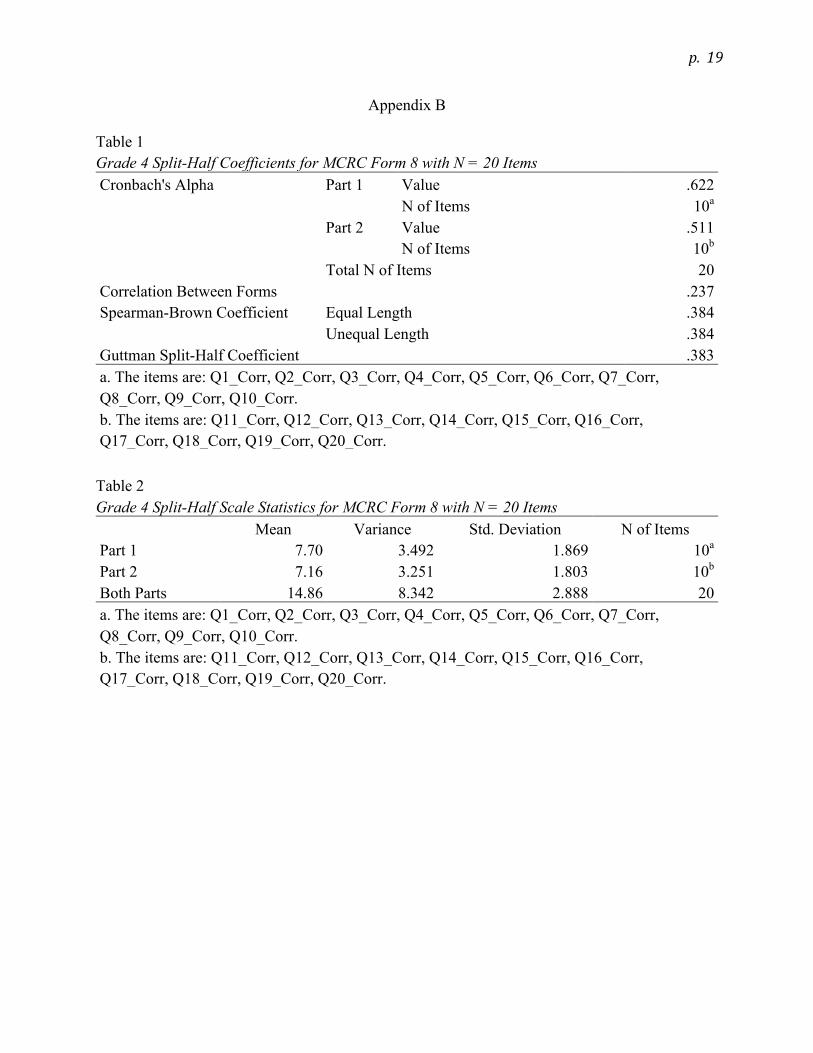
reliability. For grade 4 MCRC forms 8, 9, 10, 14, 15 and 16, Guttman split-half reliability
coefficients ranged from .38 to .67. Specifically, the split-half coefficient for form 8 was .38 (n
= 20 items); the split-half coefficient for form 9 was .57 (n = 20 items); the split-half coefficient
for form 10 was .67 (n = 20 items); the split-half coefficient for form 14 was .56 (n = 20 items);
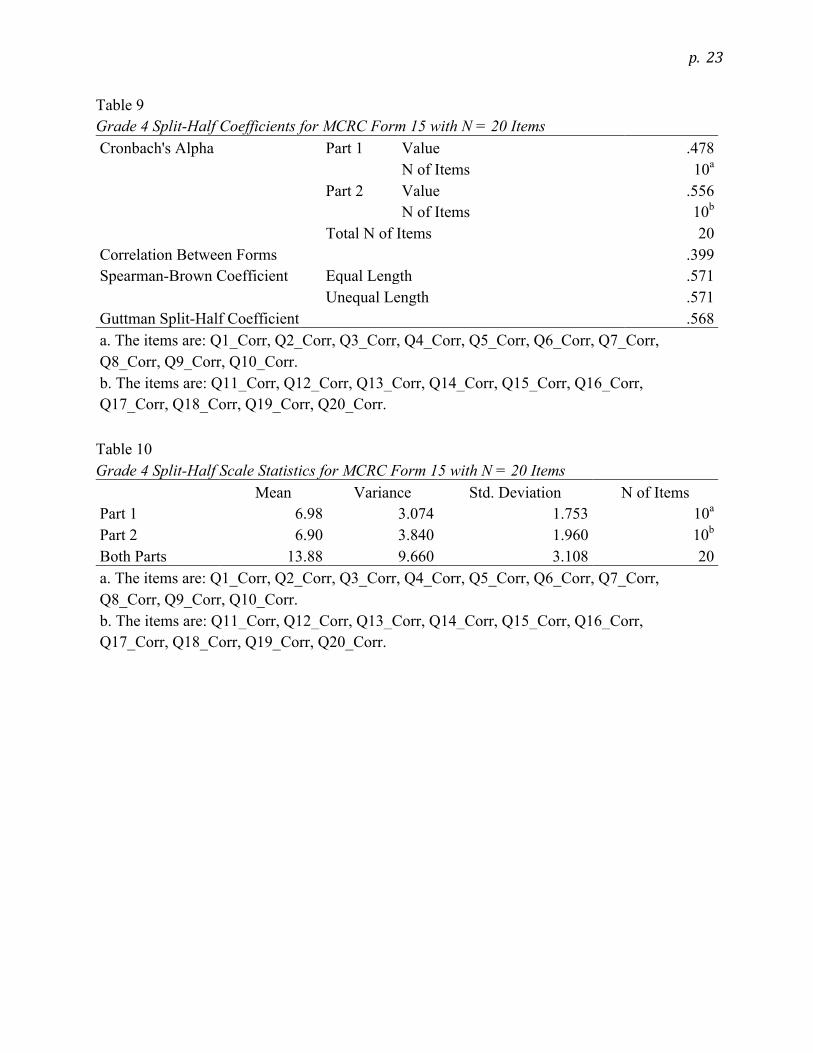
the split-half coefficient for form 15 was .57 (n = 20 items); the split-half coefficient for form 16
was .58 (n = 19 items). Tables 1-12 in Appendix B display descriptive statistics and complete
results of split-half reliability analyses by form for grade 4 MCRC measures used in this study.
Grade 4 Top-bottom Reliability
In this section we report results from top-bottom reliability analysis used to evaluate the
appropriateness of items. The proportion of correct responses of each item for low-performing
(at or below the 23rd percentile) and high-performing (at or above the 78th percentile) students
was evaluated from this analysis to examine the appropriateness of item functioning. For form 8,
all students in the low-performing group answered 1 out of 20 items correctly, and 1 out of
remaining 19 items incorrectly. The proportion of correct responses for the remaining 18 items
p.
12
ranged from .14 to .86. Every student in the high-performing group answered 9 out of 20 items
correctly, and the proportion of correct responses for the remaining 11 items ranged from .42 to
.92. For form 9, the proportion of correct responses ranged from .13 to .88 for the low-
performing students. Every student in the high-performing group answered 5 out of 20 items
correctly, and the proportion of correct responses for the remaining 15 items ranged from .50 to
.94. For form 10, the proportion of correct responses ranged from .11 to .89 for the low-
performing students. All students in the high-performing group answered 6 out of 20 items
correctly; the proportion of correct responses for the remaining 14 items ranged from .47 to .93.
For form 14, the proportion of correct responses ranged from .25 to .88 for the low-
performing students. All students in the high-performing group answered 8 out of 20 items
correctly, and the proportion of correct responses for the remaining 12 items ranged from .33 to
.93. The proportion of correct responses for item #9 was higher for the low-performing students
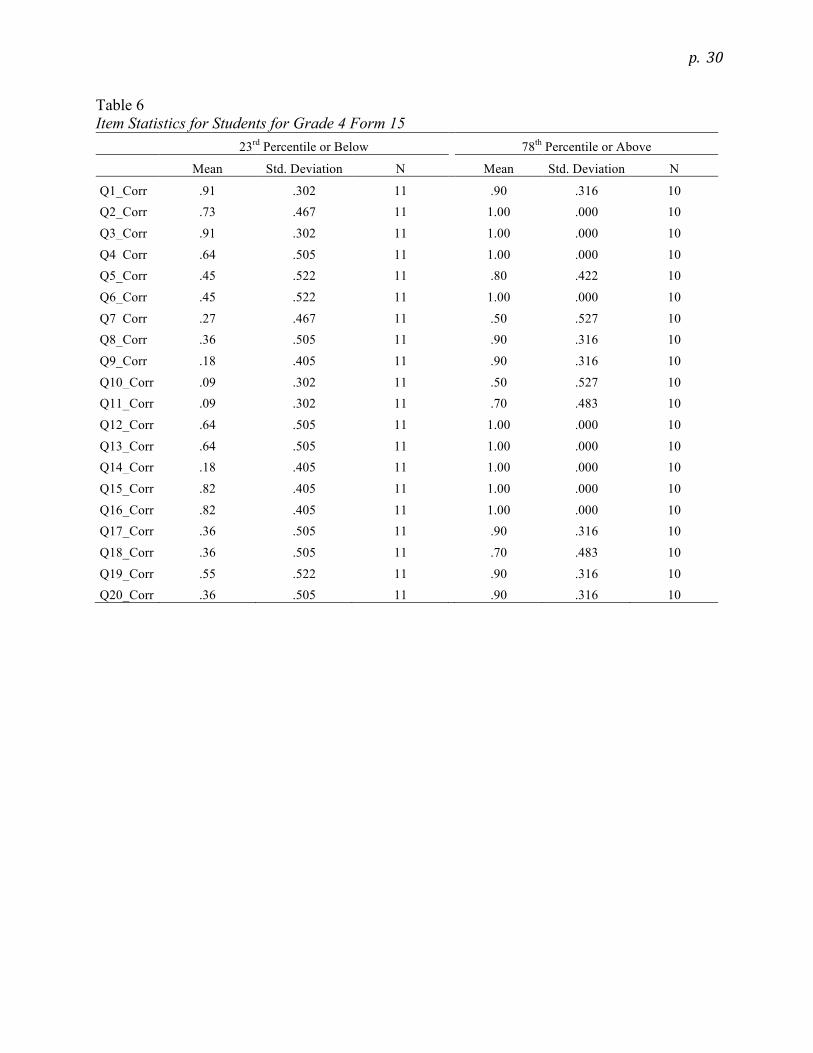
(.38) than the high-performing students (.35). For form 15, the proportion of correct responses
ranged from .18 to .91 for the low-performing students. All students in the high-performing
group answered 9 out of 20 items correctly, and the proportion of correct responses for the
remaining 11 items ranged from .50 to .90. The proportion of correct responses for item #1 was
higher for the low-performing students (.91) than the high-performing students (.90), though this
difference is deemed very small given the sample size. For form 16, all students in the low-
performing group answered 2 out of 20 items correctly, but 1 out of the remaining 18 items
incorrectly. The proportion of correct responses ranged from .14 to .86 for the remaining 17
items. Every student in the high-performing group answered 5 out of 20 items correctly, and the
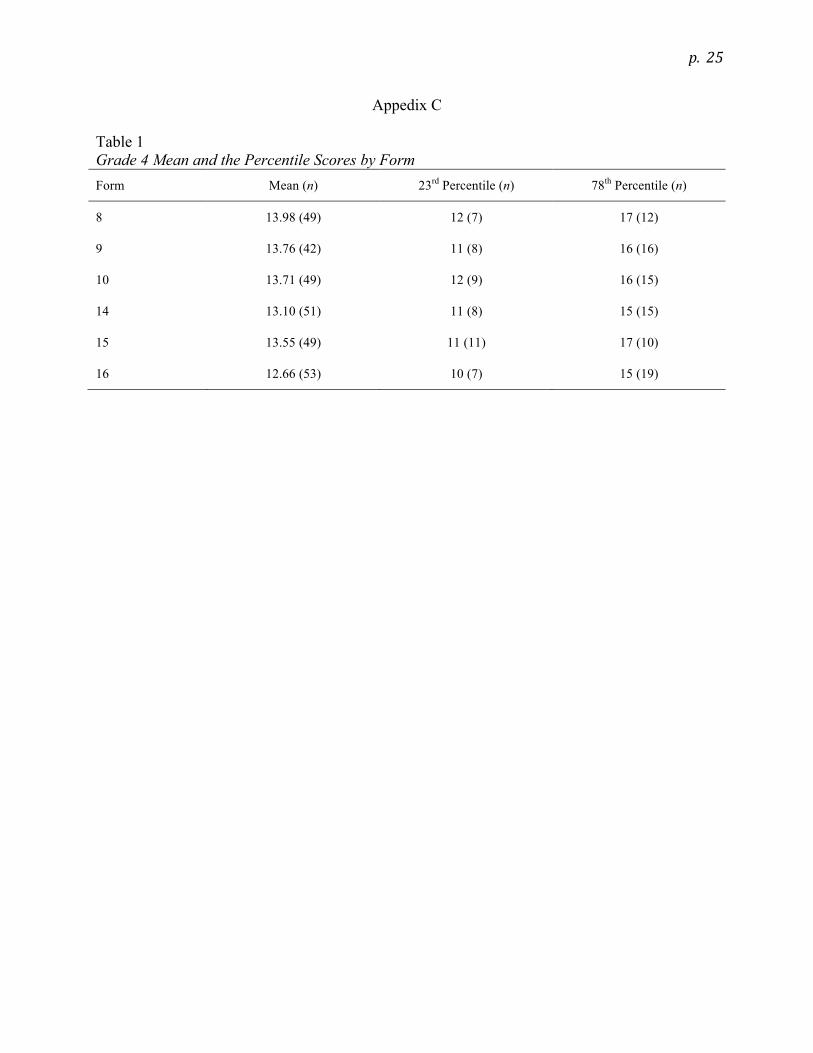
proportion of correct responses for the remaining 15 items ranged from .37 to .95. Tables 1-10
p.
13
in Appendix C display mean and percentile scores and the complete top-bottom reliability results
for the grade 4 MCRC forms used in this study.
Grade 4 Item-level Rasch Analyses
Almost all items on the grade 4 MCRC form 8 test form passed the model fit selection
criteria, falling within the mean square outfit range of 0.5 to 1.5. Items #3 and #4 exceeded the
model fit selection criteria with mean square outfit of 1.80 and 1.65, respectively. Items #1 and
#9 had mean square outfit of 0.46 and 0.41, falling below the criteria of 0.5. Distractor analysis
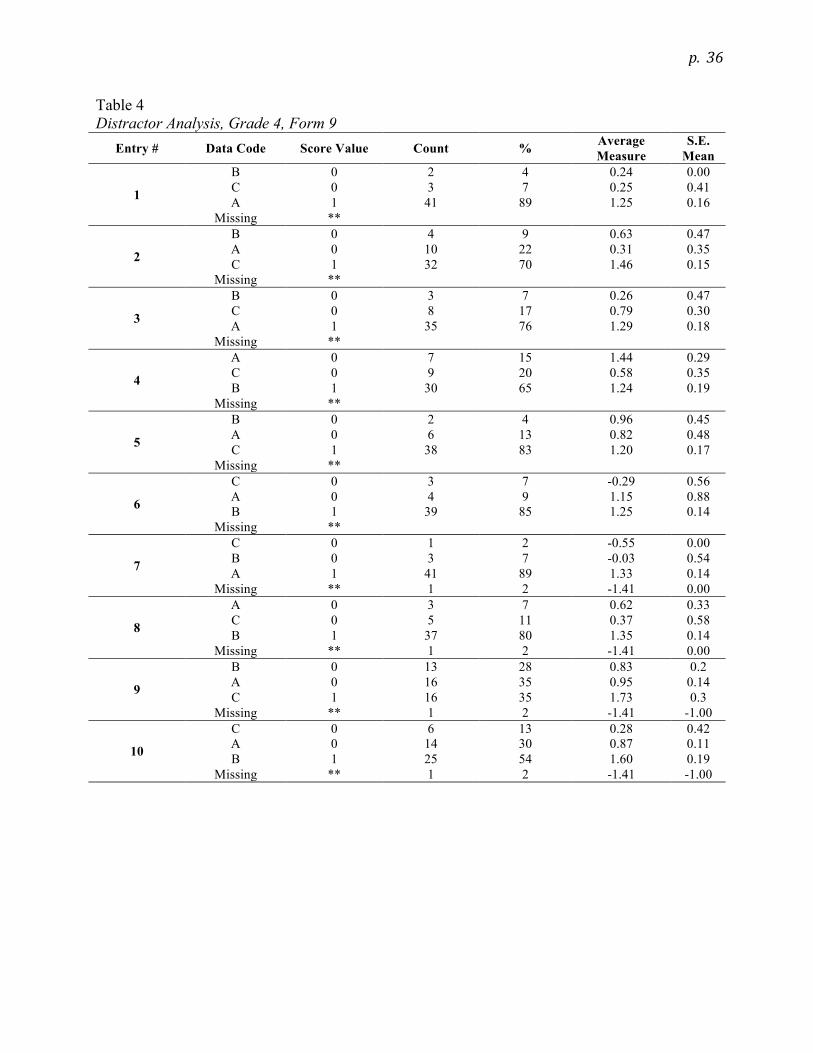
indicated that these four items were functioning appropriately. Most of the items on grade 4
MCRC form 9 were within the mean square outfit range of 0.5 to 1.50. Items #6 and #15 were
over-fit, with mean square outfit of 2.40 and 1.63, respectively. Items #7, #14 and #16 were
under-fit, with mean square outfit values of 0.46, 0.33, and 0.30, respectively. Analysis of the
distractors, however, indicated only item #15 was not functioning appropriately. On grade 4
MCRC form 10, item #11 was over-fit, with a mean square outfit of 1.67. Item #3 was under-fit,
with a mean square outfit value of 0.08. Analysis of the distractors indicated that both items
were not functioning appropriately.
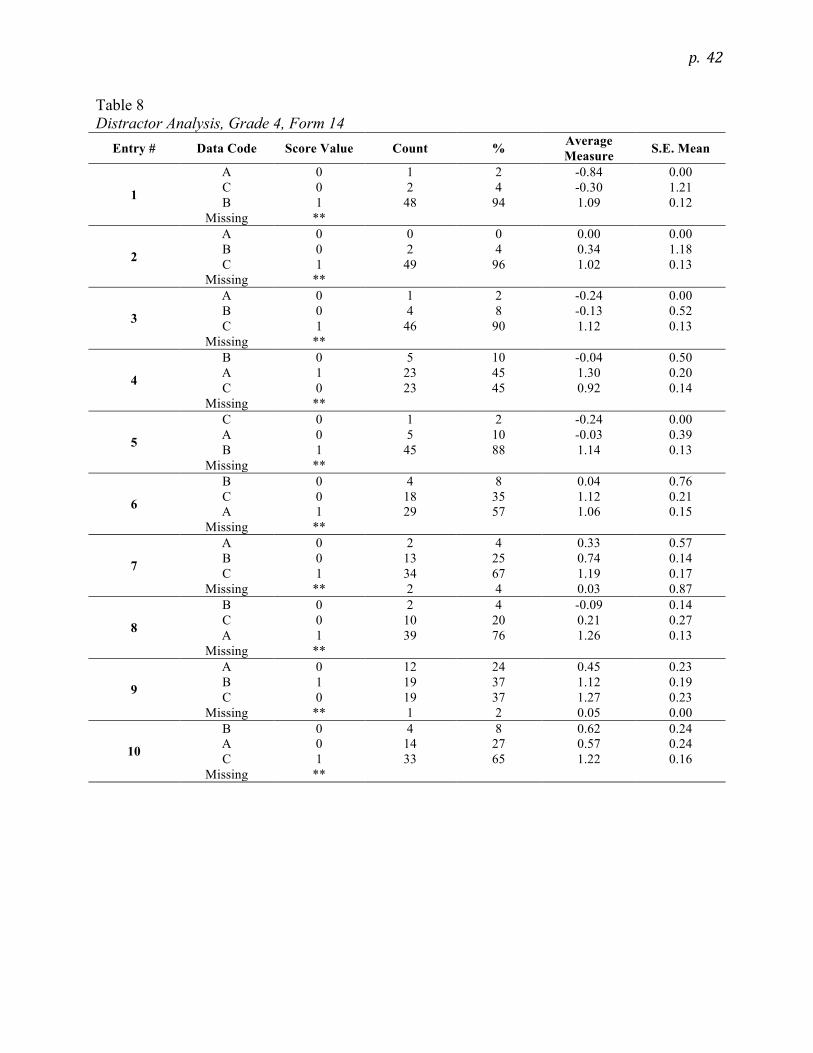
All items on the grade 4 MCRC form 14 had mean square outfit within the acceptable
criteria of 0.50 to 1.50, with the exception of item #8. Item #8 was over-fit, with a mean square
outfit of 1.55. Distractor analysis, however, indicated that item #8 was functioning
appropriately, though items #6 and #9 may not be. Almost all of the items on the grade 4 MCRC
form 15 had mean square outfit within the acceptable criteria of 0.50 to 1.50. Item #1 had a
mean square outfit of 2.00. Distractor analysis also suggested that this item was not functioning
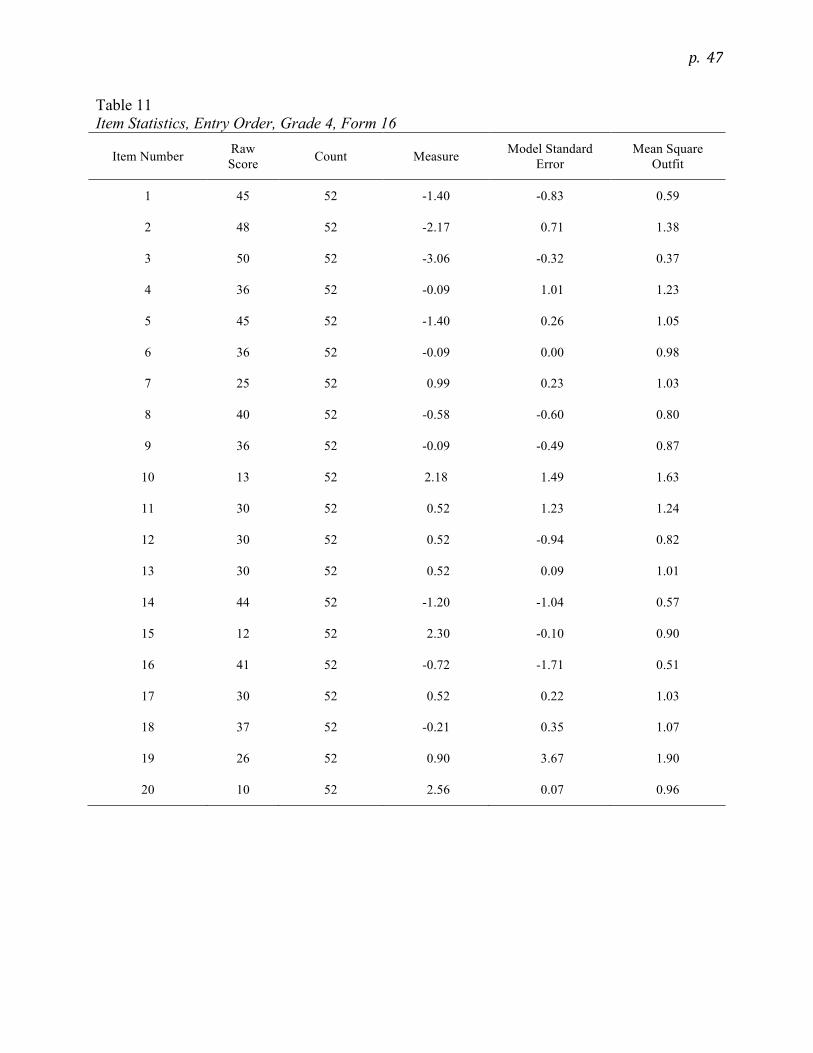
properly. On test form grade 4 MCRC form 16, three items did not meet the acceptable criteria
of mean square outfit of 0.50 to 1.50. The two items, #10 and #19, were over-fit, with mean
p.
14
square outfit of 1.63 and 1.90, respectively. Item #3 was under-fit, with a mean square outfit of
0.37. Results from the distractor analysis indicated that only item #3 was not functioning
appropriately.
Person reliability values were moderate overall, ranging from .56 to .67. Item reliability
was generally high, ranging from .86 to .92. Tables 1-12 in Appendix D display the item
measure, standard error of measure, mean square outfit, and complete distractor analyses for the
six grade 4 MCRC measures used in this study.
Discussion
Our findings in this study suggest that the grade 2 easyCBM multiple choice reading
comprehension measures have acceptable levels of reliability for the two purposes for which
they are intended: as one part of a battery of assessments administered in the fall, winter, and
spring to screen students at risk for reading difficulty, and as repeated measures over time as
used to monitor student progress in developing comprehension skill. Although we would have
preferred to have even higher alternate form reliability coefficients, it appears likely that our
results are dampened by two factors. First, sample sizes in our study were not as large as we
would have liked, due to challenges related to participant recruitment. Second, it appears as
though the test forms might have had a ceiling effect, with very little variation in scores for
students who were in the top third (reducing the power of the top / bottom reliability analyses).
Future research should address both these limitations.
p.
15
References
Alonzo, J., Ketterlin-Geller, L.R., & Tindal, G. (2006). Curriculum-based measurement in
reading and math: providing rigorous outcomes to support learning. In L. Florian (Ed.),
The Sage Handbook of Special Education (pp. 307-318). Thousand Oaks, CA: Sage.
Alonzo, J., Liu, K., & Tindal, G. (2007). Examining the technical adequacy of reading
comprehension measures in a progress monitoring assessment system (Technical Report
No. 41). Eugene, OR: Behavioral Research and Teaching, University of Oregon.
Alonzo, J., & Tindal, G. (2004a). Analysis of reading fluency and comprehension measures for
first-grade students (Technical Report No. 25). Eugene, OR: University of Oregon,
College of Education, Behavioral Research and Teaching.
Alonzo, J., & Tindal, G. (2004b). Analysis of reading fluency and comprehension measures for
fourth-grade students (Technical Report No. 27). Eugene, OR: University of Oregon,
College of Education, Behavioral Research and Teaching.
Alonzo, J., & Tindal, G. (2004c). Technical report: District reading assessments, spring 2004
administration (Technical Report No. 30). Eugene, OR: University of Oregon, College of
Education, Behavioral Research and Teaching.
Kerlinger, F. N., & Lee, H. B. (2000). Foundations of Behavioral Research (Fourth ed.). New
York: Thomspon Learning, Inc.
Linacre, J. M. (2002). What do infit and outfit, mean-square and standardized mean? Rasch
Measurement and Transactions, 16(2), 878.
Linacre, J. M. (2009). WINSTEPS Rasch measurement computer program: version 3.68.2.
SPSS Inc. (2010). SPSS for Macintosh License Agreement. Chicago, IL: SPSS Inc.
p.
16
Yovanoff, P., Duesbery, L., Alonzo, J., & Tindal, G. (2005). Grade level invariance of a
theoretical causal structure predicting reading comprehension with vocabulary and oral
reading fluency. Educational Measurement: Issues and Practice, 4 - 12.
p.
17
Appendix A
Table 1 Descriptive Statistics of Grade 4 Measures 8 to 10
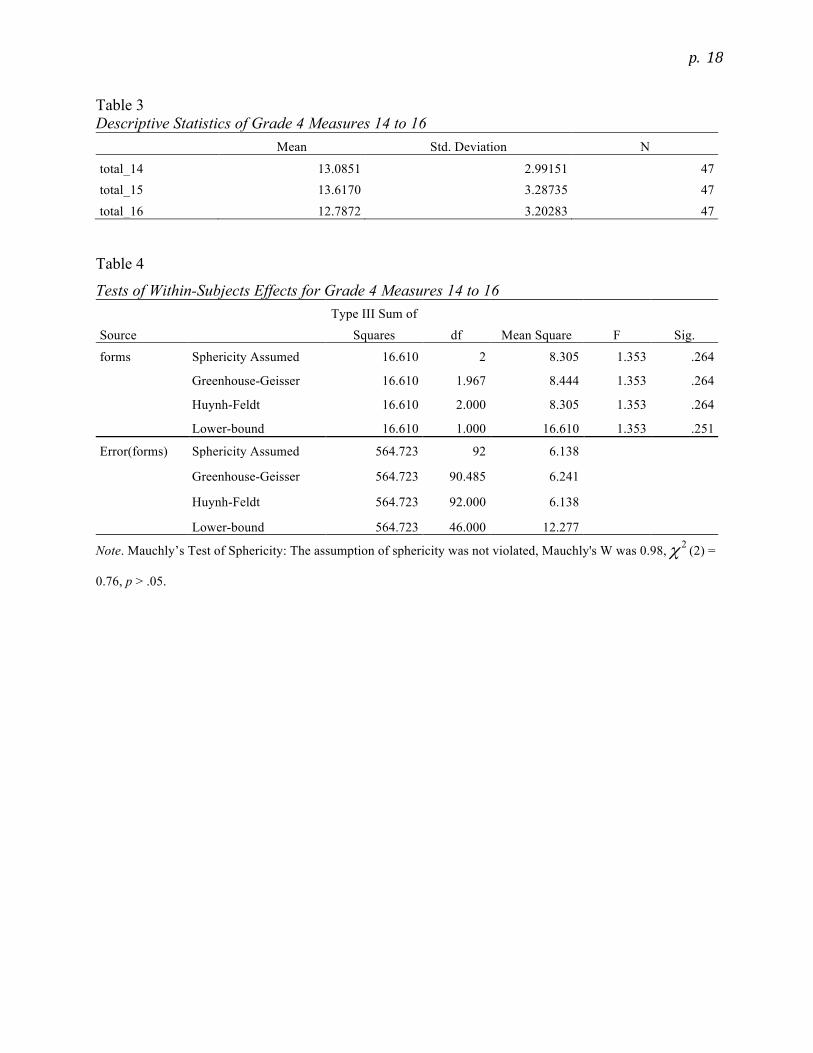
Tests of Within-Subjects Effects for Grade 4 Measures 14 to 16
Source Type III Sum of
Squares df Mean Square F Sig.
forms Sphericity Assumed 16.610 2 8.305 1.353 .264
Greenhouse-Geisser 16.610 1.967 8.444 1.353 .264
Huynh-Feldt 16.610 2.000 8.305 1.353 .264
Lower-bound 16.610 1.000 16.610 1.353 .251
Error(forms) Sphericity Assumed 564.723 92 6.138
Greenhouse-Geisser 564.723 90.485 6.241
Huynh-Feldt 564.723 92.000 6.138
Lower-bound 564.723 46.000 12.277
Note. Mauchly’s Test of Sphericity: The assumption of sphericity was not violated, Mauchly's W was 0.98, 2χ (2) =
0.76, p > .05.
p.
19
Appendix B
Table 1 Grade 4 Split-Half Coefficients for MCRC Form 8 with N = 20 Items Cronbach's Alpha Part 1 Value .622
N of Items 10a Part 2 Value .511
N of Items 10b Total N of Items 20
Correlation Between Forms .237 Spearman-Brown Coefficient Equal Length .384
Unequal Length .384 Guttman Split-Half Coefficient .383 a. The items are: Q1_Corr, Q2_Corr, Q3_Corr, Q4_Corr, Q5_Corr, Q6_Corr, Q7_Corr, Q8_Corr, Q9_Corr, Q10_Corr. b. The items are: Q11_Corr, Q12_Corr, Q13_Corr, Q14_Corr, Q15_Corr, Q16_Corr, Q17_Corr, Q18_Corr, Q19_Corr, Q20_Corr.
Table 2 Grade 4 Split-Half Scale Statistics for MCRC Form 8 with N = 20 Items
Mean Variance Std. Deviation N of Items Part 1 7.70 3.492 1.869 10a Part 2 7.16 3.251 1.803 10b Both Parts 14.86 8.342 2.888 20 a. The items are: Q1_Corr, Q2_Corr, Q3_Corr, Q4_Corr, Q5_Corr, Q6_Corr, Q7_Corr, Q8_Corr, Q9_Corr, Q10_Corr. b. The items are: Q11_Corr, Q12_Corr, Q13_Corr, Q14_Corr, Q15_Corr, Q16_Corr, Q17_Corr, Q18_Corr, Q19_Corr, Q20_Corr.
p.
20
Table 3 Grade 4 Split-Half Coefficients for MCRC Form 9 with N = 20 Items Cronbach's Alpha Part 1 Value .496
N of Items 10a Part 2 Value .366
N of Items 10b Total N of Items 20
Correlation Between Forms .404 Spearman-Brown Coefficient Equal Length .576
Unequal Length .576 Guttman Split-Half Coefficient .574 a. The items are: Q1_Corr, Q2_Corr, Q3_Corr, Q4_Corr, Q5_Corr, Q6_Corr, Q7_Corr, Q8_Corr, Q9_Corr, Q10_Corr. b. The items are: Q11_Corr, Q12_Corr, Q13_Corr, Q14_Corr, Q15_Corr, Q16_Corr, Q17_Corr, Q18_Corr, Q19_Corr, Q20_Corr.
Table 4 Grade 4 Split-Half Scale Statistics for MCRC Form 9 with N = 20 Items
Mean Variance Std. Deviation N of Items Part 1 7.34 3.067 1.751 10a Part 2 6.75 2.564 1.601 10b Both Parts 14.09 7.899 2.810 20 a. The items are: Q1_Corr, Q2_Corr, Q3_Corr, Q4_Corr, Q5_Corr, Q6_Corr, Q7_Corr, Q8_Corr, Q9_Corr, Q10_Corr. b. The items are: Q11_Corr, Q12_Corr, Q13_Corr, Q14_Corr, Q15_Corr, Q16_Corr, Q17_Corr, Q18_Corr, Q19_Corr, Q20_Corr.
p.
21
Table 5 Grade 4 Split-Half Coefficients for MCRC Form 10 with N = 20 Items Cronbach's Alpha Part 1 Value .486
N of Items 10a Part 2 Value .423
N of Items 10b Total N of Items 20
Correlation Between Forms .506 Spearman-Brown Coefficient Equal Length .672
Unequal Length .672 Guttman Split-Half Coefficient .672 a. The items are: Q1_Corr, Q2_Corr, Q3_Corr, Q4_Corr, Q5_Corr, Q6_Corr, Q7_Corr, Q8_Corr, Q9_Corr, Q10_Corr. b. The items are: Q11_Corr, Q12_Corr, Q13_Corr, Q14_Corr, Q15_Corr, Q16_Corr, Q17_Corr, Q18_Corr, Q19_Corr, Q20_Corr.
Table 6 Grade 4 Split-Half Scale Statistics for MCRC Form 10 with N = 20 Items
Mean Variance Std. Deviation N of Items Part 1 7.15 3.186 1.785 10a Part 2 7.18 3.046 1.745 10b Both Parts 14.33 9.386 3.064 20 a. The items are: Q1_Corr, Q2_Corr, Q3_Corr, Q4_Corr, Q5_Corr, Q6_Corr, Q7_Corr, Q8_Corr, Q9_Corr, Q10_Corr. b. The items are: Q11_Corr, Q12_Corr, Q13_Corr, Q14_Corr, Q15_Corr, Q16_Corr, Q17_Corr, Q18_Corr, Q19_Corr, Q20_Corr.
p.
22
Table 7 Grade 4 Split-Half Coefficients for MCRC Form 14 with N = 20 Items Cronbach's Alpha Part 1 Value .318
N of Items 10a Part 2 Value .465
N of Items 10b Total N of Items 20
Correlation Between Forms .391 Spearman-Brown Coefficient Equal Length .562
Unequal Length .562 Guttman Split-Half Coefficient .557 a. The items are: Q1_Corr, Q2_Corr, Q3_Corr, Q4_Corr, Q5_Corr, Q6_Corr, Q7_Corr, Q8_Corr, Q9_Corr, Q10_Corr. b. The items are: Q11_Corr, Q12_Corr, Q13_Corr, Q14_Corr, Q15_Corr, Q16_Corr, Q17_Corr, Q18_Corr, Q19_Corr, Q20_Corr.
Table 8 Grade 4 Split-Half Scale Statistics for MCRC Form 14 with N = 20 Items
Mean Variance Std. Deviation N of Items Part 1 7.24 2.371 1.540 10a Part 2 6.20 3.255 1.804 10b Both Parts 13.44 7.798 2.792 20 a. The items are: Q1_Corr, Q2_Corr, Q3_Corr, Q4_Corr, Q5_Corr, Q6_Corr, Q7_Corr, Q8_Corr, Q9_Corr, Q10_Corr. b. The items are: Q11_Corr, Q12_Corr, Q13_Corr, Q14_Corr, Q15_Corr, Q16_Corr, Q17_Corr, Q18_Corr, Q19_Corr, Q20_Corr.
p.
23
Table 9 Grade 4 Split-Half Coefficients for MCRC Form 15 with N = 20 Items Cronbach's Alpha Part 1 Value .478
N of Items 10a Part 2 Value .556
N of Items 10b Total N of Items 20
Correlation Between Forms .399 Spearman-Brown Coefficient Equal Length .571
Unequal Length .571 Guttman Split-Half Coefficient .568 a. The items are: Q1_Corr, Q2_Corr, Q3_Corr, Q4_Corr, Q5_Corr, Q6_Corr, Q7_Corr, Q8_Corr, Q9_Corr, Q10_Corr. b. The items are: Q11_Corr, Q12_Corr, Q13_Corr, Q14_Corr, Q15_Corr, Q16_Corr, Q17_Corr, Q18_Corr, Q19_Corr, Q20_Corr.
Table 10 Grade 4 Split-Half Scale Statistics for MCRC Form 15 with N = 20 Items
Mean Variance Std. Deviation N of Items Part 1 6.98 3.074 1.753 10a Part 2 6.90 3.840 1.960 10b Both Parts 13.88 9.660 3.108 20 a. The items are: Q1_Corr, Q2_Corr, Q3_Corr, Q4_Corr, Q5_Corr, Q6_Corr, Q7_Corr, Q8_Corr, Q9_Corr, Q10_Corr. b. The items are: Q11_Corr, Q12_Corr, Q13_Corr, Q14_Corr, Q15_Corr, Q16_Corr, Q17_Corr, Q18_Corr, Q19_Corr, Q20_Corr.
p.
24
Table 11 Grade 4 Split-Half Coefficients for MCRC Form 16 with N = 19 Items Cronbach's Alpha Part 1 Value .091
N of Items 9a Part 2 Value .308
N of Items 10b Total N of Items 19
Correlation Between Forms .431 Spearman-Brown Coefficient Equal Length .603
Unequal Length .603 Guttman Split-Half Coefficient .584 a. The items are: Q1_Corr, Q2_Corr, Q3_Corr, Q4_Corr, Q5_Corr, Q6_Corr, Q7_Corr, Q8_Corr, Q9_Corr. b. The items are: Q10_Corr, Q11_Corr, Q12_Corr, Q13_Corr, Q14_Corr, Q15_Corr, Q16_Corr, Q17_Corr, Q18_Corr, Q19_Corr.
Table 12 Grade 4 Split-Half Scale Statistics for MCRC Form 16 with N = 19 Items
Mean Variance Std. Deviation N of Items Part 1 6.55 1.513 1.230 9a Part 2 5.98 2.760 1.661 10b Both Parts 12.53 6.037 2.457 19 a. The items are: Q1_Corr, Q2_Corr, Q3_Corr, Q4_Corr, Q5_Corr, Q6_Corr, Q7_Corr, Q8_Corr, Q9_Corr. b. The items are: Q10_Corr, Q11_Corr, Q12_Corr, Q13_Corr, Q14_Corr, Q15_Corr, Q16_Corr, Q17_Corr, Q18_Corr, Q19_Corr.
p.
25
Appedix C
Table 1 Grade 4 Mean and the Percentile Scores by Form Form Mean (n) 23rd Percentile (n) 78th Percentile (n)
8 13.98 (49) 12 (7) 17 (12)
9 13.76 (42) 11 (8) 16 (16)
10 13.71 (49) 12 (9) 16 (15)
14 13.10 (51) 11 (8) 15 (15)
15 13.55 (49) 11 (11) 17 (10)
16 12.66 (53) 10 (7) 15 (19)
p.
26
Table 2 Item Statistics for Students for Grade 4 Form 8 23rd Percentile or Below 78th Percentile or Above Mean Std. Deviation N Mean Std. Deviation N