Page 1
ANALYZING THE SOLAR IRRADIATION
PATTERN OF BANGLADESH FOR
ELECTRICITY GENERATION
A Thesis paper submitted to the
Department of Electrical and Electronics Engineering
In partial fulfillment of the requirements for the Award of Degree of
Bachelor of Science in Electrical and Electronic Engineering
Submitted By
PRODIP CHANDRA PAL
ID: 153-33-3017
SHANTA ISLAM
ID: 153-33-2842
Supervised by
DR. M. SHAMSUL ALAM
Professor
Department of EEE
DAFFODIL INTERNATIONAL UNIVERSITY
December 2018
Page 2
Page | ii
©Daffodil International University
APPROVAL
This thesis titled “ANALYZING THE SOLAR IRRADIATION PATTERN OF
BANGLADESH FOR ELECTRICITY GENERATION”, submitted by Prodip Chandra Pal and Shanta Islam to the Department of Electrical and Electronics Engineering, Daffodil International University, has been accepted as satisfactory for the partial fulfillment of the requirements for the degree of B.Sc. in Electrical and electronics Engineering and approved as to its style and contents. The presentation has been held on.
BOARD OF EXAMINERS
Dr. M. Shamsul Alam
Professor
Department of EEE
Faculty of Engineering
Daffodil International University
Page 3
Page | iii
©Daffodil International University
DECLARATION We hereby declare that, this thesis paper has been done by us under the supervision of Dr. M.
Shamsul Alam, Professor, Department of EEE, Faculty of Engineering, and Daffodil
International University. We also declare that neither this thesis paper nor any part of this thesis
paper has been submitted elsewhere for award of any degree or diploma.
Supervised by:
Dr. M. Shamsul Alam,
Professor
Department of EEE
Faculty of Engineering
Daffodil International University
Submitted by:
Name: Prodip Chandra Pal
ID: 153-33-3017
Name: Shanta Islam
ID: 153-33-2842
Page 4
Page | iv
©Daffodil International University
CONTENTS
List of Tables X
List of Figures VIII
List of Abbreviations XI
Acknowledgment XIII
Abstract XIV
Chapter 1: INTRODUCTION
1-10
1.1 Introduction 1
1.2 Energy Crisis in Bangladesh 3
1.3 Problem Statement 3
1.4 Renewable Energy 4
1.5 Renewable energy sources 5
1.5.1 Solar Energy 5
1.5.2 Hydro-power 6
1.5.3 Wind energy 6
1.5.4 Biomass energy 6
1.5.5 Geothermal energy 6
1.6 Importance of Solar energy 7
1.7 Top ten countries using solar power 8
Page 5
Page | v
©Daffodil International University
1.8 Objectives of the research 9
1.9 Significance of this research 9
1.10 Outline of the study 10
Chapter 2: LITERATURE REVIEWS 11-16
2.1 Introduction 11
2.2 Socio-Economic of SHS 13
2.3 Solar Energy for Rural Electrification in Bangladesh 13
2.4 Solar home system in Bangladesh 15
2.5 Progression of Worldwide SHS Dissemination 16
Chapter 3:
SOLAR PV EQUIPMENT
17-29
3.1 Introduction 17
3.2 Photovoltaic technology 17
3.3 Solar cells 17
3.4 Design of modules 18
3.5 Types of Solar panel 19
3.5.1 Monocrystalline Cells 20
3.5.2 Polycrystalline Cells 21
3.5.3 Amorphous Cells 21
3.6 Charge controller 22
3.7 Function of Charge controller 23
3.8 Battery storage 24
Page 6
Page | vi
©Daffodil International University
3.9 Inverter 25
3.9.1 String inverter 26
3.9.2 Power plant inverter 27
3.9.3 Grid-tie inverter 27
3.10 Solar home system 28
3.10.1 Why Suitable Technology for Our Country 28
3.10.2 Components of Solar Home System 28
3.10.3 Off-grid solar system 29
Chapter 4: METHODOLOGY 30-40
4.1 Introduction 30
4.2 Site selection 30
4.3 Satellite view 31
4.4 System design 31
4.5 Research Machineries & Tools 32
4.5.1 100W solar panel 32
4.5.1.1 Electrical specifications 32
4.5.2 I-V 400W 33
4.5.2.1 Electrical specifications of I-V 400W 34
4.5.2.2 General specifications of I-V 400W 34
4.5.3 Temperature sensor 35
4.5.4 Irradiation Sensor (HT304N) 36
4.5.4.1 Technical specifications of irradiance sensor 36
4.5.4.2 General specifications 36
Page 7
Page | vii
©Daffodil International University
4.6 Flow chart 37
4.7 I-V 400 W Calibration 38
4.8 Data measurement technique 39
Chapter 5:
ANALYSIS OF THE DATA & RESULTS
41-54
5.1 Introduction 41
5.2 Solar data analysis 41
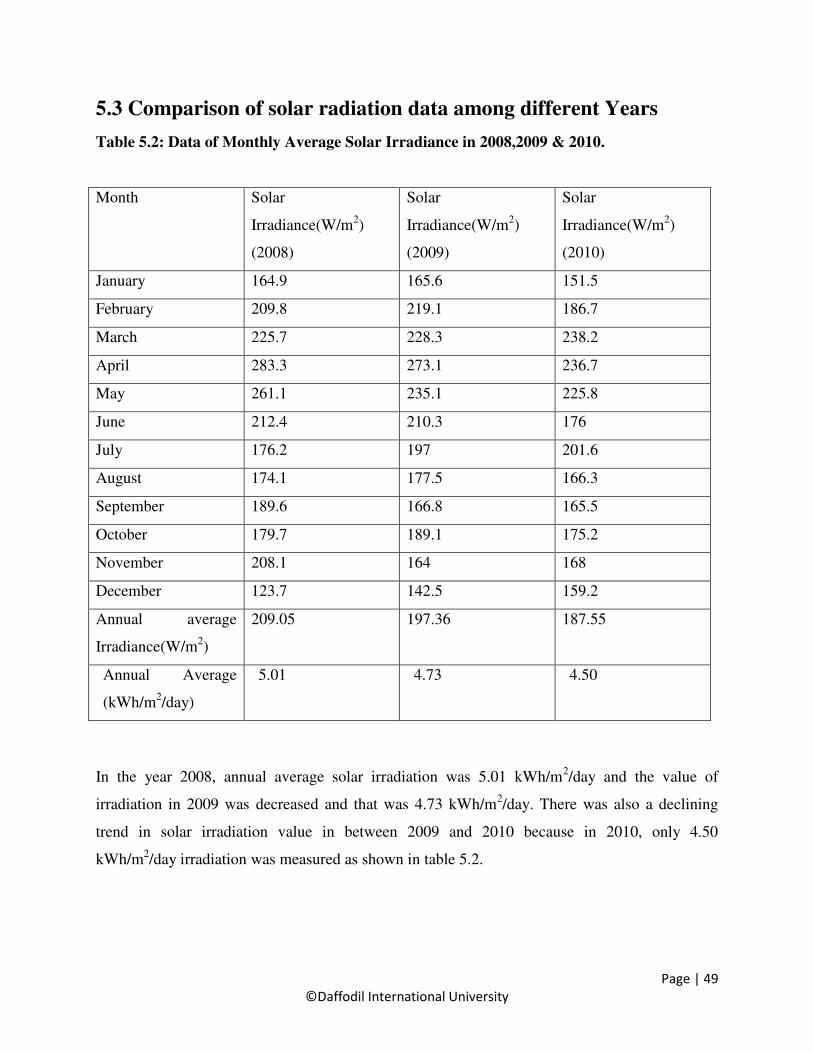
5.3 Comparison of solar radiation data among different years 49
Chapter 6: CONCLUSIONS 53-54
6.1 Conclusion 53
6.2 Future scope 54
References 55
Page 8
Page | viii
©Daffodil International University
LIST OF FIGURES
Figure Figure Caption Page
1.1 Power Generation in Bangladesh 5
1.2 CO2 Emissions from Fossil Fuel Combustion 7
1.3 Generation top ten solar country 9
2.1 SHS Installation in Bangladesh 15
3.1 Solar Cell 18
3.2 Cell to array 19
3.3 Single-crystalline Cells 19
3.4 Polycrystalline Cells 19
3.5 Amorphous cell 20
3.6 Monocrystalline Cells 20
3.7 Polycrystalline Cells 21
3.8 Amorphous cell 22
3.9 Charge controller 23
3.10 12-volt, 100 Ah solar battery & 2-volt, 200 Ah Industrial battery 24
3.11 Battery (a) External & (b) Internal 25
3.12 Inverter designed to provide 115 VAC from the 12 VDC source
provided in an automobile
26
3.13 String inverter 26
3.14 Power plant inverter 27
3.15 Inverter for grid connected PV 28
3.16 Solar Home System 28
Page 9
Page | ix
©Daffodil International University
3.17 Solar Off-Grid 29
4.1 Off & On Grid Solar System on Rooftop of Daffodil International
University
30
4.2 Satellite View 31
4.3 System Design 31
4.4 Solar Panel (100W) 32
4.5 I-V 400 W Photovoltaic Panel Analyzer 33
4.6 Temperature Sensor 35
4.7 Irradiation Sensor 36
4.8 Flow Chart 37
4.9 Data Measuring 39
5.1 Solar Irradiance, July 2018 42
5.2 Maximum power,July 2018 43
5.3 Sunny and rainy day of Power,August 2018 44
5.4 Sunny and rainy day of Irradiance and Power, August 2018 44
5.5 Only Rainy-Day Irradiance, August 2018 45
5.6 Only Rainy-Day Maximum Power, July 2018 46
5.7 Solar Irradiance, August 2018 46
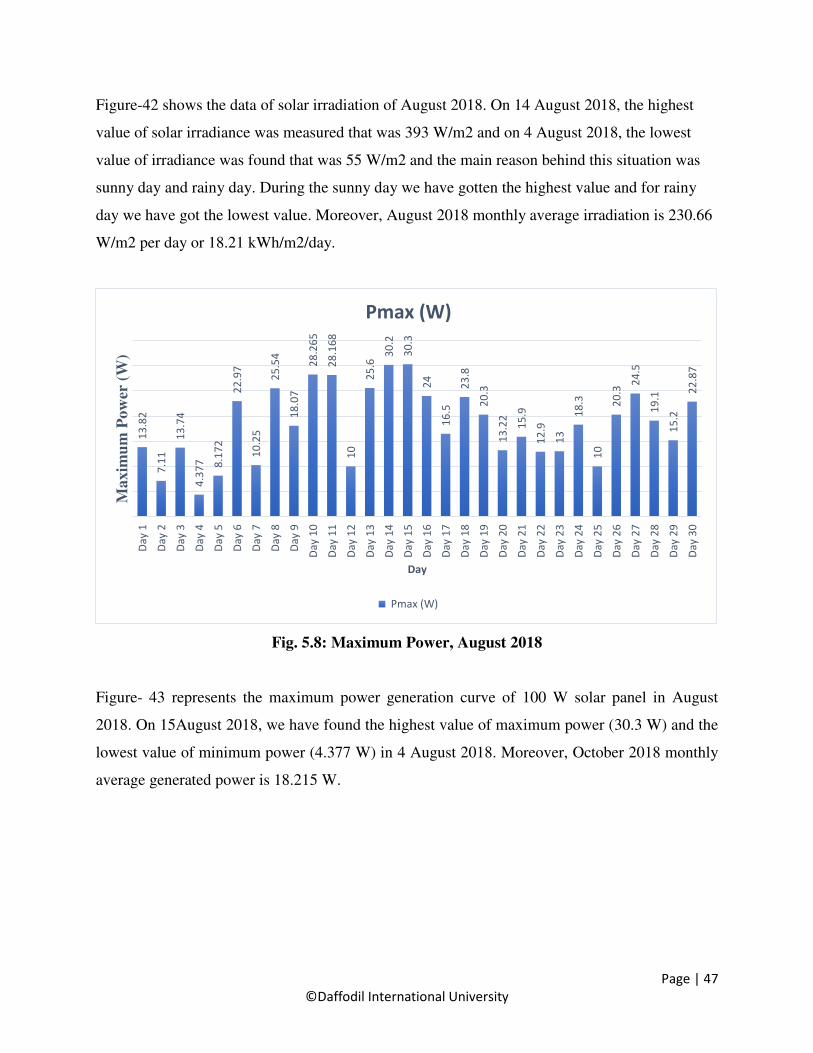
5.8 Maximum Power, August 2018 47
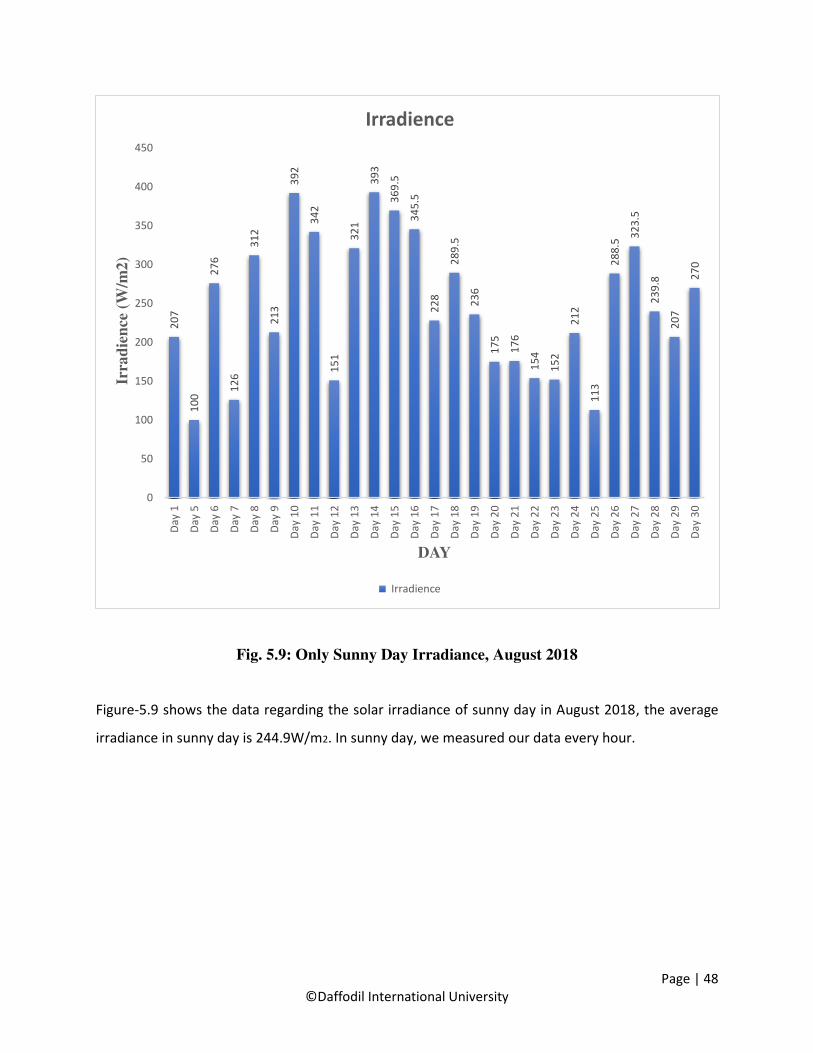
5.9 Only Sunny Day Irradiance, August 2018 48
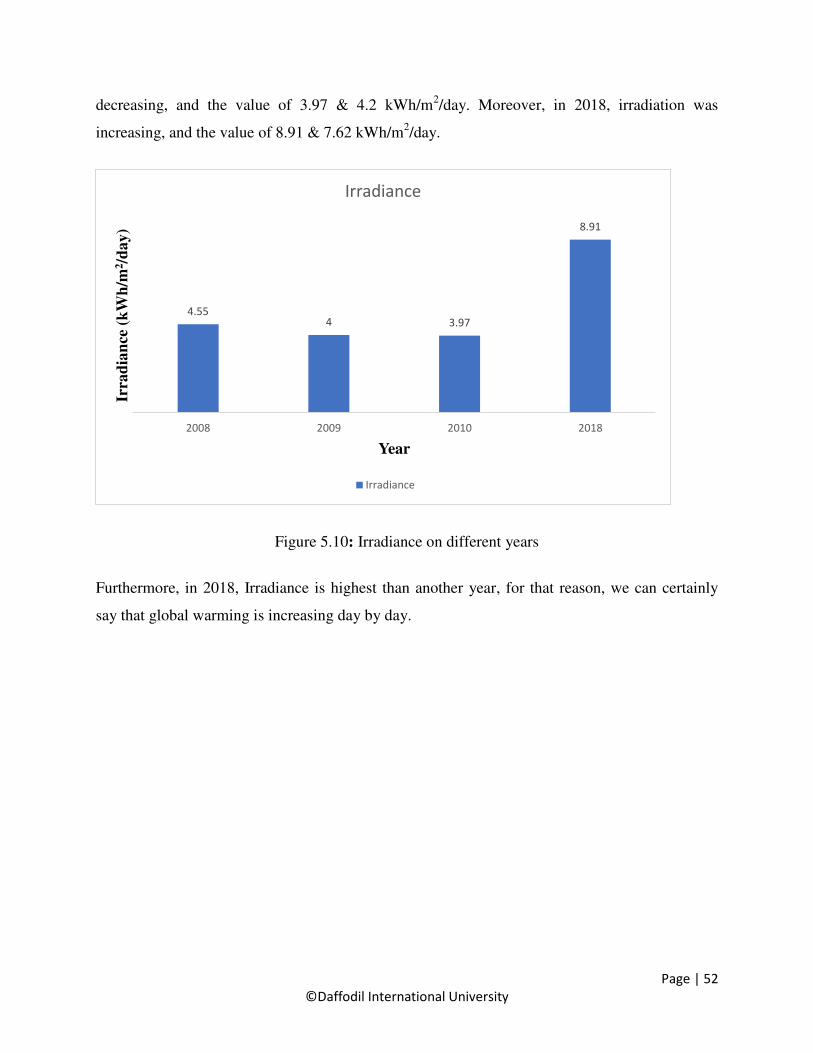
5.10 Irradiance on different years 52
Page 10
Page | x
©Daffodil International University
LIST OF TABLES
Table Table Caption Page
1.1 Top ten solar countries 8
4.1
4.2
Range and Accuracy of Photovoltaic Solar Panel Analyzer (I-V 400 W)
Range & accuracy of irradiation sensor
34
36
4.3 I-V 400 W Calibration 38
4.4 Measured Data of Solar System on 5 July 2018 40
5.1 Represents Single Day (01 September 2018) Solar Irradiance,
Equivalent Power and Generated Power. 42
5.2 Data of Monthly Average Solar Irradiance in 2008,2009 & 2010 49
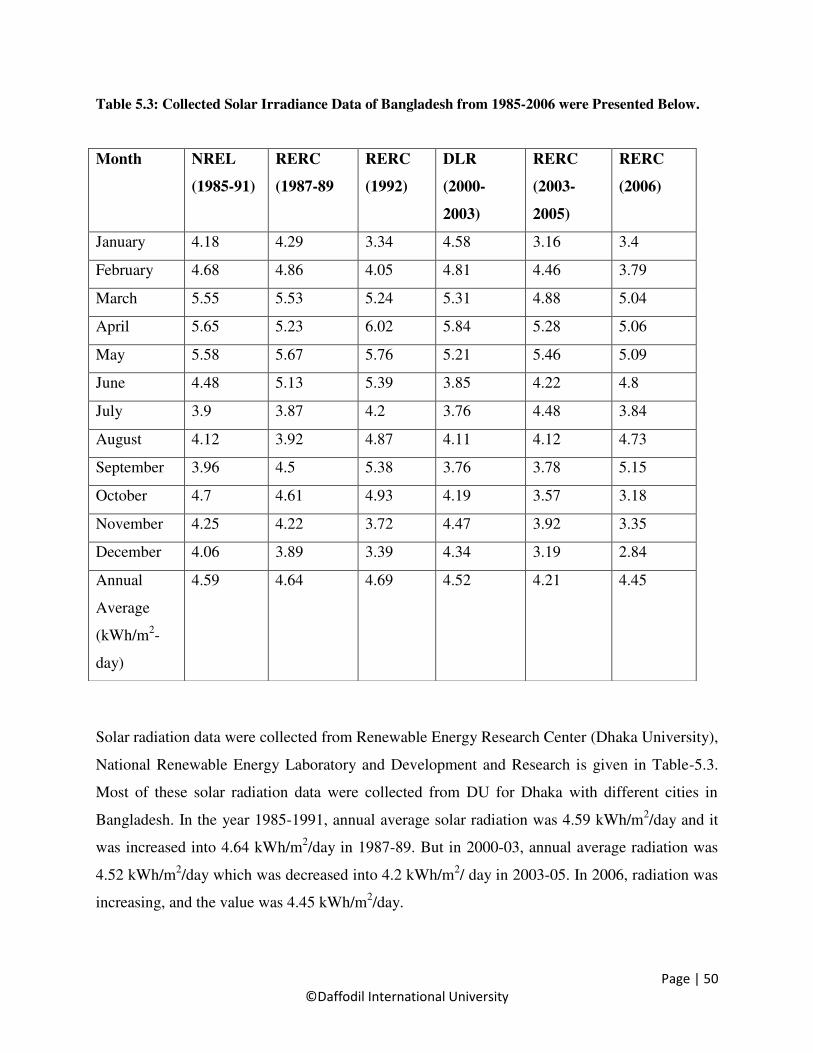
5.3 Collected Solar Irradiance Data of Bangladesh from 1985-2006
were Presented Below 50
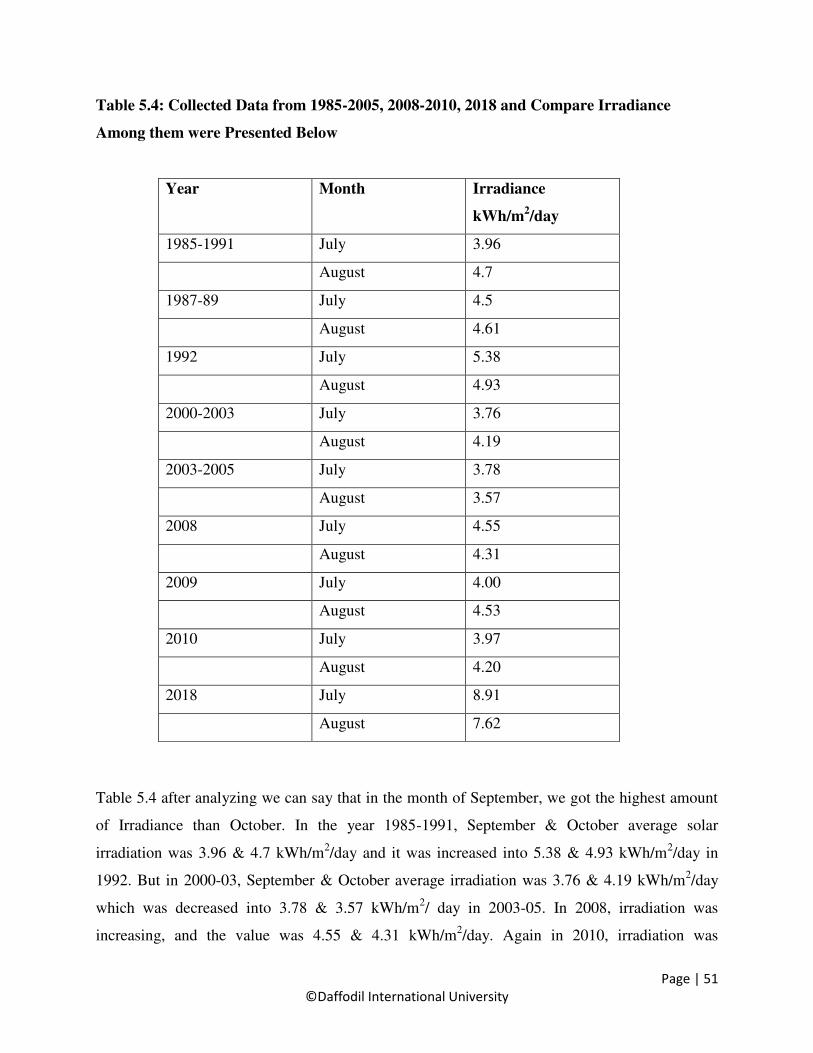
5.4 Collected Data from 1985-2005, 2008-2010, 2018 and Compare
Irradiance Among them were Presented Below 51
Page 11
Page | xi
©Daffodil International University
List of Abbreviations
PV Photovoltaic
DC Direct Current
AC Alternating Current
KWh Kilowatt Hour
MW Megawatt
CO Carbon Monoxide
IFRD International Financial Reporting Standards
IDCOL
Infrastructure Development Company Limited
SHS Solar Home System
NGO Non-Governmental Organization
BPDB Bangladesh power development board
TV Television
RERC Renewable Energy Research Centre
AGM Absorbed Glass Mat
GTI Grid-tie inverter
STC Standard Test Condition
LCD Liquid crystal display
Page 12
Page | xii
©Daffodil International University
USB Universal Serial Bus
RF Radio Frequency
OPC Operational Condition
Page 13
Page | xiii
©Daffodil International University
ACKNOWLEDGEMENT
First, we express our heartiest thanks and gratefulness to the Almighty GOD for his divine
blessing to make us possible to complete this project successfully.
It is our great opportunity to convey the deepest and veneration to our honorable thesis
supervisor, Dr. M. Shamsul Alam, Professor, Department of EEE, Faculty of Engineering,
Daffodil International University (DIU), for engaging me in such an important research. He was
always there to share his absolute experience and valuable time. It was his constant supervision,
helpful suggestions, constructive criticism and endless patience throughout development of this
thesis.
I am also grateful to the respondents of my research questionnaire, without which the thesis
would remain incomplete. Apart from that, I would like to thank our entire friends for sharing
knowledge; information and helping us in making this thesis a success.
Finally, I beg pardon for our unidirectional errors and omission if any.
Page 14
Page | xiv
©Daffodil International University
ABSTRACT
Now a days, the increasing demand of electric power and shortage of present energy resources
lead today’s engineers and scientists to think about the alternative sources of energy. The
sunlight is a potential source for producing electric power. In recent years, this solar system
gains its popularity more and more. In home system applications, the use of solar energy is also
attractive. Moreover, solar home systems require very little maintenance and need no fuel. Other
advantages of a PV system are reliable power, free source of power, flexibility and quick
installation. For socio-economic development a reliable, affordable and secure supply of energy
is significant. The following research paper is based on analyzing the solar irradiation pattern of
Bangladesh for electricity generation. Irradiation and power are discussed with their optimum
capacity. Power is one of the most important factors in developing country and for sustainable
economy. Like the rest of the countries of the planet, in Bangladesh the demand for power is
increasing day by day. The main aim of our research is to find out the irradiation of sun in
Dhaka city in the month of July and August so that the power production by the solar panel can
be estimated and, we collect the solar irradiation and the maximum power data in Dhaka for
(July&August) two months and analyze the data to get average irradiation and find the
relationship between solar irradiation and power and by using this data we can easily understand
the electricity production by solar home system and create a standard form of power production
of solar home system in 2018.
Page 15
Page | 1
©Daffodil International University
CHAPTER 1
INTRODUCTION
1.1 Introduction
Bangladesh is mostly densely populated countries which have not adequate supply of energy. In
Bangladesh, nearly 80% of the people live in the village and only 32% of total population is
connected to grid electricity [1]. Considering the present demand for electricity; by 2020 the
energy mix will be changed considerably from what it is today. The opportunities of using solar
power are already being tested and will mostly increase. But still, most households meet their
daily requirements with biomass fuel. With only 60% of Bangladeshis having access to
electricity, the per capita energy consumption is only 292 kWh per annum [1]. Solar power
systems are contributing a huge amount of energy so that it can mitigate the present energy
crisis, especially in rural areas of Bangladesh. Moreover, 30 organizations in Bangladesh are
conducting solar energy businesses [2]. Bangladesh is located between 20.30 – 26.38 degrees
north latitude and 88.04 – 92.44 degrees east longitude. Daily average solar irradiation rate is 4
to 6.5 kWh per square meter. Maximum amount of radiation is available on the month of March-
April (6.5 hour/day) and minimum on December-January (4 hour/day). At present, only 62%
(including renewable energy) of the total population in Bangladesh has access to electricity but
in rural area, they are deprived from electricity. Approximately 60 million people or 38% of the
population in Bangladesh have no access to electricity and they depend on kerosene and natural
sources. Bangladesh Rural Advancement Committee (BRAC), a Non-Government Organization
(NGO) started Solar Energy Program for sustainable development in 1997 [3,4]. The 3MW solar
power plant has been established at Sarishabari in Jamalpur by a local company, Engreen
Sharishabari Solar Plant Ltd [5]. Which is the first solar power plant in Bangladesh. Bangladesh
Power Development Board (BPDB) is getting 33/11 KV power from this sector. PV systems use
sunlight to generate electricity. In addition to the panels, a PV system usually contains an
inverter to convert solar power from DC to the AC of the utility grid power transmission and
Page 16
Page | 2
©Daffodil International University
distribution system. Beximco with the Chinese company is setting up a 200MW solar power
plant in Gaibandha [6]. Under the Hill Tracts Electrification Project BPDB, total of 173.81 kW,
Solar PV Systems has installed in Juraichori, Barkal and Thanchi Upazila of Rangamati District.
In Angoorpota and Dohogram Chitmohol BPDB implemented 1.06 kW solar PV systems in
2008-09. Moreover, BPDB implemented 20.16 KW solar PV system at the office of the prime
minister on December 2009 [7]. In Chittagong, a 7.4 MW solar power plant was established at
Kaptai hydropower station [8]. An 800MW solar power project will set up by Scatec Solar at
Chandpur in southern Bangladesh [9]. Solar home system plays a vital role for rural
electrification in Bangladesh and for this reason SHS is increasing day by day. According to
power and energy ministry data, 2.86% of all power produced in this country comes from
renewable energy, including solar power. On the other hand, Renewable energies like wind,
solar, bio-mass, geothermal, hydropower energy are environmentally friendly.
Now a day’s solar energy is very much popular in our country. Basically, wind energy power is
directly proportional to the velocity of the wind. Moreover, wind is an available renewable
energy source. Bangladesh Council of Scientific and Industrial Research (BCSIR), Institute of
Fuel Research and Development (IFRD) and Centre for Mass Education in Science (CMES)
worked together to make a low cost and light weight solar cooker and they have done it
successfully. But the manual sun tracking system is the only problem of the cooker. On a bright
sunny day, it will take about three hours to cook for 5–6 family members. IFST is working on a
sustainable Solar Dryer. They have promoted a cabinet dryer for drying fruits, vegetables etc.
IFRD designed it and solar radiation has absorbed by a coated flat plate and converts into heat,
after that it transfers the resulting heat to circulating water. This type of heater is suitable for
supplying low-grade thermal energy at temperatures below 90 °C [10].
On the other hand, other renewable like wind, biomass can be a great energy source for
Bangladesh. Wind energy is directly proportional to the velocity of the wind. Biomass energy
can be produced by burning organic material that comes from plants and animals. Wood is
biomass energy. Not only biomass is a renewable energy but also sustainable source of energy.
Moreover, hydro power is one of the oldest sources of energy to produce mechanical and
electrical energy. Moreover, Hydro power used thousands of years ago to turn paddle wheels to
help grind grain. Therefore, hydroelectric power is produced by moving water. Here, water is the
main source. Kaptai dam is the only hydroelectric power station which is situated in Bangladesh.
Page 17
Page | 3
©Daffodil International University
The maximum amount of power is generated by the Kaptai hydro-electric power station, which
is very close to the coastal area. In 2012, investments in solar technologies were only $3 million.
By 2015, that figure had increased to $158 million, growing to $223 million in 2016. The job
sector in the solar is rapidly rising. In the context of Bangladesh, the number of jobs in solar PV
rose 10% in 2016.The highest number of SHS have installed in Bangladesh and achieved top
position among a global list of countries [11].
1.2 Energy Crisis in Bangladesh
Bangladesh has long been suffering from energy starvation of 166 million population, in which
63.5% live in villages [12]. Bangladesh will face in near future a crisis in energy sector. Fire
wood, straws and cow dung are still the main source of energy in the villages. Natural gas
detection does not make any help to the villagers. Throughout the country trees are being fallen
randomly by the thousands to burn brick which may give rise to horrible scene of deforestation
and cause ecological imbalance in near future. With a view to solving the problems partially, it is
time to think of renewable sources of energy as a supplement to the existing traditional
resources. Nature provides us with several renewable sources of energy such as sunshine, wind
and tidal power. Unlike fossil fuel energy from these resources can be employed for ages.
Science came forward with the idea of trapping the vast energy that the sun floods the earth
every day. Several devices have been worked out for trapping and storing solar energy.
Utility and feasibility of the renewable sources of energy should be studied with due
consideration. It is compulsory because fear of shortage in conventional energy sources. This is
easily understood when we place a statistic on the energy resource availability, consumption and
dependence on import of fuel.
1.3 Problem Statement
Bangladesh is a most populated country and land is the biggest problem in Bangladesh. The non-
agriculture unused land is not available in Bangladesh. Acquiring land is the biggest problem for
rapid expansion of on-grid solar power system. Moreover, panel, charge controller and battery
quality are not good enough. In addition, the power factor of the loads does not take into
consideration. Fossil fuels massively use in Bangladesh. Most of the people in Bangladesh live in
Page 18
Page | 4
©Daffodil International University
rural area where they badly need of energy. We have a lack of research information in the solar
field. Recently some battery company has been established in Bangladesh. High efficiency
battery has not import in Bangladesh due to high cost. For low equipment, we can’t get sufficient
output. Dishonest businessman supplies low-quality equipment which badly impacts. The
equipment is costly and for that reason, sometimes it is impossible for the people to replace new
equipment.
1.4 Renewable Energy
Renewable energy is energy produced from natural resources—such as sunlight, wind, rain,
tides, and geothermal heat—which are renewable (naturally replenished). Hydroelectricity was
the next largest renewable source, 16.4 % of global electricity generation and providing 3.5 % of
global energy consumption [13]. Wind power is growing at the rate of 30% annually, with a
worldwide installed capacity of 121,000 MW in 2008 and is widely used in European countries
and the United States. The annual manufacturing output of the photo voltaic industry reached
6,900 MW in 2008, and PV power stations are popular in Germany and Spain. Solar thermal
power stations operate in the USA and Spain, and the largest of these is the 354 MW Solar
Electric Generating System (SEGS) power plant in the Mojave Desert. The world's largest
geothermal power installation is The Geysers in California which capacity of 750 MW. Brazil
has one of the largest renewable energy programs in the world which is involving production of
ethanol fuel from sugar cane, and ethanol now provides 18% of the country's automotive fuel.
Ethanol fuel is also broadly available in the USA. While most renewable energy projects and
generation is large-scale, renewable technologies are also suited to small off-grid applications,
sometimes in rural and remote areas, where energy is often crucial in human development.
Kenya has the world's maximum household solar ownership rate with roughly 30,000 small (20–
100 watt) solar power systems sold per year. Some renewable-energy technologies are criticized
for being intermittent or unsightly and the renewable-energy market continues to grow. Climate-
change anxieties, coupled with high oil prices, peak oil, and increasing government support, are
driving increasing renewable-energy legislation, incentives and commercialization.
Page 19
Page | 5
©Daffodil International University
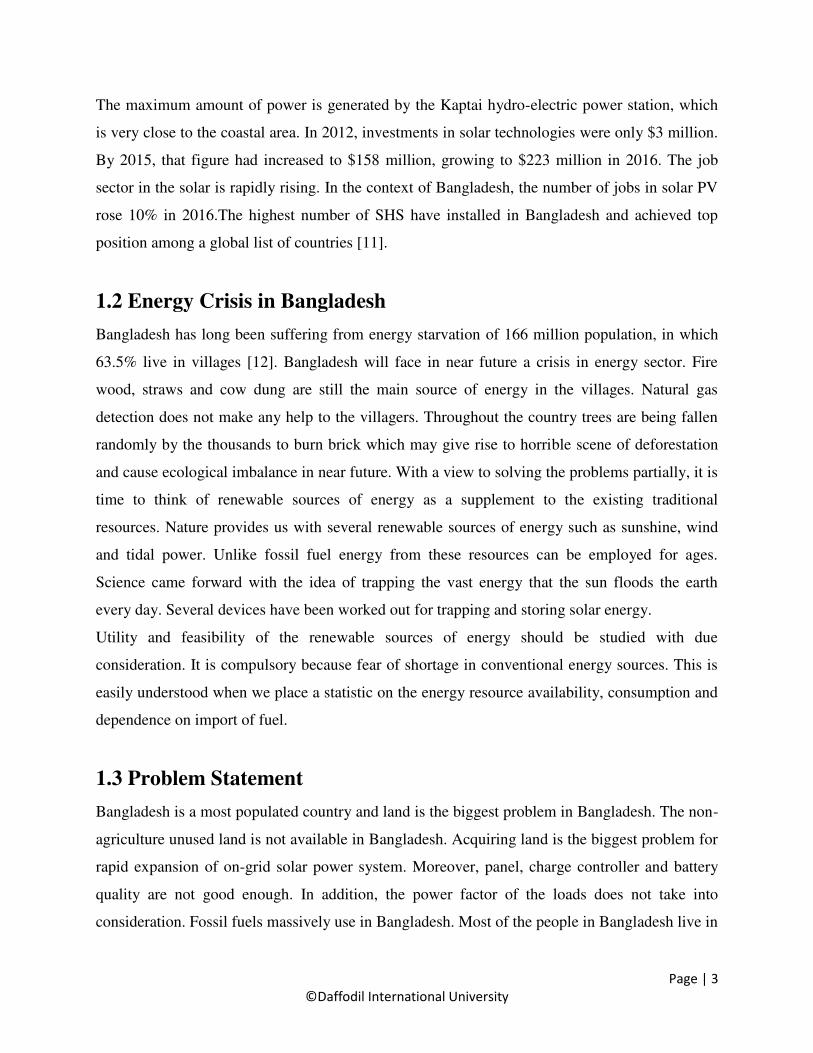
Fig 1.1: power generation in Bangladesh
From the Fig.1, we can analyze how much power generation from renewable energy in 2018.
Total generation power from solar energy is 325.82 MW which is the highest power generation
among other renewable energy. The lowest power generation is 0.40 MW from the biomass in
Bangladesh.
1.5 Renewable Energy Sources
1.5.1 Solar Energy
Solar power comes from thermonuclear reactions in the sun and is the ‘ultimate’ renewable
energy sources. PV systems use sunlight to generate electricity. In addition to the panels, a PV
system usually contains an inverter to convert solar power from DC to AC of the utility grid
power transmission and delivery system. 3 MW plant has established at Sarishabari in Jamalpur.
In our country, solar PV application primarily concentrates on rural home lighting system. Lack
of awareness at the ground level and absence of financing facilitators are the major barriers SHS
in Bangladesh. Besides, govt. Bureaucracy and damaging price consciousness of some
development agencies are also responsible. Rural Electrification Board (REB), Local
Government Engineering Department (LGED), Bangladesh Power Development Board (BPDB)
325.82
230
2.9 4.5 0.4 0
50
100
150
200
250
300
350
solar Hydro Wind Biomass to
Electricity
Biogas to Electricity
Po
we
r G
en
era
tio
n (
MW
)
Power Generation
Power Generation in Bangladesh
Power Generation in Bangladesh
Page 20
Page | 6
©Daffodil International University
And other agencies implementing solar energy program. There is a powerful potential for
alternative energy at intervals the country.
Solar Thermal Power/Concentrating Solar Power (CSP): The technology involves harnessing
radiation for generation of electricity through variety of steps finally generating mechanical
energy to run a generator. This technology needs to be disseminated within the country to
supplement the power supply.
1.5.2 Hydro-power
Hydro-power is one of the oldest sources of energy to produce mechanical and electrical energy.
Moreover, Hydro-power used thousands of years ago to turn paddle wheels to help grind grain.
Therefore, hydroelectric power is produced by moving water. Here water is the main source.
Kaptai dam is the only hydroelectric power with capacity 230 MW which is situated in
Bangladesh. The main disadvantage of a hydraulic power station is its high initial value and
longer authorization amount. But these disadvantages are offset by the low value of generation as
well as the management of floods and increased irrigation facilities.
1.5.3 Wind Energy
Now a day wind is an available renewable energy source. Every day, around the world, wind turbines
are converting it to electricity by capturing the wind’s power. This source of power generation plays
an increasingly significant role. In Bangladesh, Feni having a capacity of 0.9 MW and another one at
Kutubia Island with a capacity of 1 MW.
1.5.4 Biomass Energy
The energy which is released by burning and can be converted into biomass energy. We get this
energy by burning Organic material that comes from plants and animals. Wood is biomass energy.
Biomass is not only a renewable energy but also sustainable source of energy.
1.5.5 Geothermal Energy
The word geothermal comes from the Greek words where geo means earth and thermal means heat.
People use geothermal energy to generate electricity. Heat is continuously producing inside the earth,
Page 21
Page | 7
©Daffodil International University
for that reason, geothermal energy is a renewable energy source. In 2018, US installed geothermal
electric with capacity 3591 MW.
1.6 Importance of Solar Energy
The fossil fuels like gas, oil, coal and nuclear power plants are the main sources of the element to
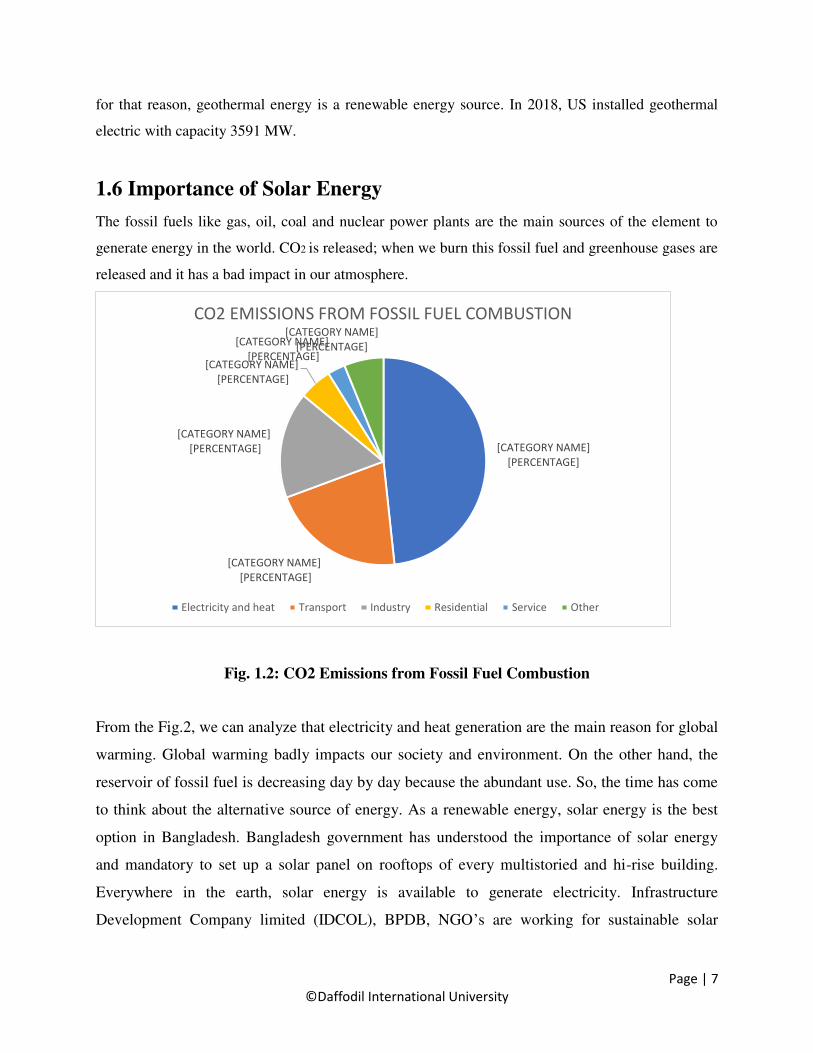
generate energy in the world. CO2 is released; when we burn this fossil fuel and greenhouse gases are
released and it has a bad impact in our atmosphere.
Fig. 1.2: CO2 Emissions from Fossil Fuel Combustion
From the Fig.2, we can analyze that electricity and heat generation are the main reason for global
warming. Global warming badly impacts our society and environment. On the other hand, the
reservoir of fossil fuel is decreasing day by day because the abundant use. So, the time has come
to think about the alternative source of energy. As a renewable energy, solar energy is the best
option in Bangladesh. Bangladesh government has understood the importance of solar energy
and mandatory to set up a solar panel on rooftops of every multistoried and hi-rise building.
Everywhere in the earth, solar energy is available to generate electricity. Infrastructure
Development Company limited (IDCOL), BPDB, NGO’s are working for sustainable solar
[CATEGORY NAME]
[PERCENTAGE]
[CATEGORY NAME]
[PERCENTAGE]
[CATEGORY NAME]
[PERCENTAGE]
[CATEGORY NAME]
[PERCENTAGE]
[CATEGORY NAME]
[PERCENTAGE]
[CATEGORY NAME]
[PERCENTAGE]
CO2 EMISSIONS FROM FOSSIL FUEL COMBUSTION
Electricity and heat Transport Industry Residential Service Other
Page 22
Page | 8
©Daffodil International University
energy in Bangladesh. The demand of energy is increasing because of the industrialization,
urbanization, food production. In the rural area, solar energy plays a vital role in their livelihood.
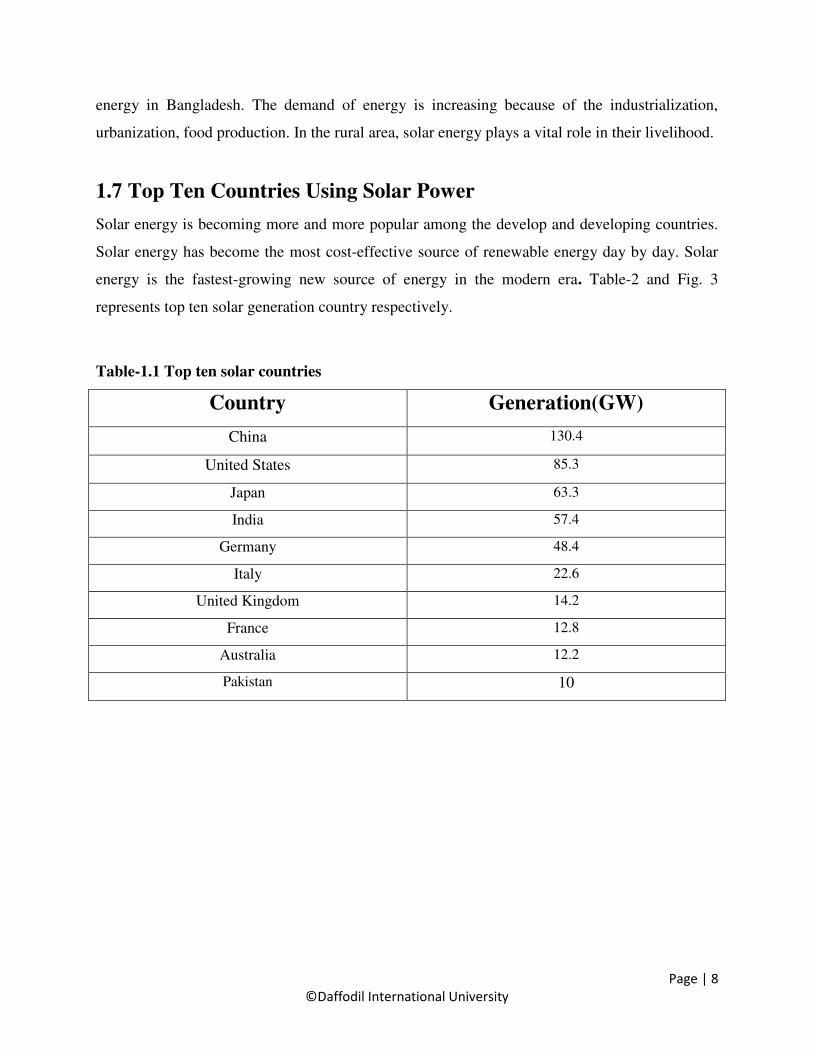
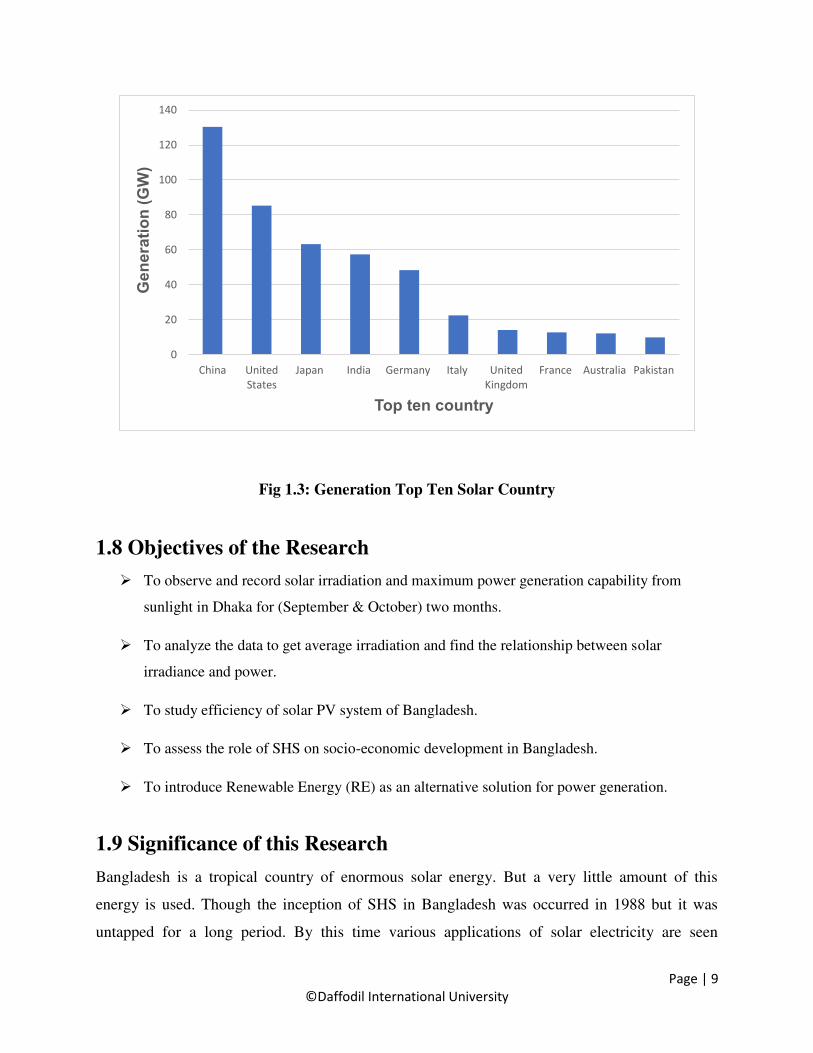
1.7 Top Ten Countries Using Solar Power
Solar energy is becoming more and more popular among the develop and developing countries.
Solar energy has become the most cost-effective source of renewable energy day by day. Solar
energy is the fastest-growing new source of energy in the modern era. Table-2 and Fig. 3
represents top ten solar generation country respectively.
Table-1.1 Top ten solar countries
Country Generation(GW)
China 130.4
United States 85.3
Japan 63.3
India 57.4
Germany 48.4
Italy 22.6
United Kingdom 14.2
France 12.8
Australia 12.2
Pakistan 10
Page 23
Page | 9
©Daffodil International University
Fig 1.3: Generation Top Ten Solar Country
1.8 Objectives of the Research
To observe and record solar irradiation and maximum power generation capability from
sunlight in Dhaka for (September & October) two months.
To analyze the data to get average irradiation and find the relationship between solar
irradiance and power.
To study efficiency of solar PV system of Bangladesh.
To assess the role of SHS on socio-economic development in Bangladesh.
To introduce Renewable Energy (RE) as an alternative solution for power generation.
1.9 Significance of this Research
Bangladesh is a tropical country of enormous solar energy. But a very little amount of this
energy is used. Though the inception of SHS in Bangladesh was occurred in 1988 but it was
untapped for a long period. By this time various applications of solar electricity are seen
0
20
40
60
80
100
120
140
China United
States
Japan India Germany Italy United
Kingdom
France Australia Pakistan
Ge
nera
tio
n (
GW
)
Top ten country
Page 24
Page | 10
©Daffodil International University
throughout the world. Solar irradiation of a specific place (DHAKA) is not still measured in
hourly basis in every day. So, the data of irradiation is not accurate and by this study, we will fill
up the research gap and get the accurate data of sun radiation of Dhaka and its corresponding
electric power. As of now there is very limited academic study on the socio-economic or
environmental impact of solar electricity in rural area. So, the study would assist the concern
policymakers and implementers to take necessary measures for sustainable rural development in
Bangladesh. Identifying the new innovative use of solar electricity in rural areas would help the
implementers for effective planning and undertaking programs. On the other hand, Now-a-days
Solar Panel provides electricity for solar vaccine refrigerator, solar water disinfection (SODIS),
solar food drier and solar pasteurization. This helps for reducing waterborne diseases. Solar
phone, solar Wi-Fi, solar radio increase rural communication, reduces transport cost and reduce
digital divide. Beside solar cooker and solar water heating, reliance on traditional fuels such as
wood or charcoal, reduces indoor pollution and carbon emission. This increases the quality of
life in rural areas, improve health and education, reduce oil dependency, increase local
employment and reduce deforestation. Solar power activities lead rural development. Due to lack
of information and study SHS is used only for household lighting in Bangladesh. Solar irrigation
technology is also getting popular in Bangladesh. As agriculture-based country, using solar
power irrigation system would be a major driving force for rural development. Government
organization, Academic institutions, NGOs and private companies are involved in renewable
energy sector in the country.Researcher, policy maker, development partner in Bangladesh
acknowledged the immense prospect of solar electricity for rural transformation. But there is no
integrated study of the prospect and scope of solar electricity for socio-economic development in
rural area of Bangladesh.
1.10 Outline of the Study
Following the introduction, the second chapter of this report will focus on review of selected
literature and conceptual overview of SHS in socio-economic development. In third chapter, it will
discuss the solar PV equipment. In fourth chapter, it will discuss the methodology of the research.
The fifth chapter contains the result of this thesis. The sixth chapter is conclusions.
Page 25
Page | 11
©Daffodil International University
CHAPTER 2
LITERATURE REVIEW
2.1 Introduction:
Duan, C., Wang, C., Li, Z., Chen, J., Wang, S., Snyder, A., & Jiang, C, [17] they mainly focus
on the balancing system such as solar, storage & charge balancing. Moreover, a battery
balancing system helps to run an electric vehicle. To verify the idea, they established a prototype
system which result verifies that every 13.2km battery energy can save 2.1%~3.3%. Moreover,
Commerell, W., Müller, R., & Shanmuganandam, V.,[18] research paper based on the
component and cost relations in SHS. Lifetime costs of solar home systems can minimize by
proper maintenance of charge controller and battery. To make components especially charge
controller, required highest technology, solid construction, well-designed electronics, elaborate
thermal management and mechanical stability.
Prodip Chandra Pal, Shanta Islam, Rasel ahmed, Najmul islam, Sanjoy kumar shill, Ashikur
Rahman munsi, Mim, M. S., Rafy, M. F., Pervej, M. S., & Ahad, A. R,[19] study to observe the
current condition of SHS, highlighting the limitations and finding the predictions of solar energy
in Bangladesh, after studying find out such as production cost, rainy season, shading, lack of
battery support etc..Moreover, Komatsu, S., Kaneko, S., & Ghosh, P. P, [20] they first recognize
the effect of SHS on the reduction and compare purchasing energy costs. The result of this
research examines the benefits of adopting and beside the micro-benefits form substantive
influence for dwelling in village households.
Cojocaru, E. G., Vasallo, M. J., Bravo, J. M., & Marín, D, [21] paper based on a simulator for a
concentrated solar power plant with thermal energy storage. This teaching tool has been built to
afford a clear image of the system and from the simulation, after they get setpoint profile of
generation, maximum power profile of SF and the initial values of the thermal energy storage
energy and turbine state. Moreover, Hua, C. C., Fang, Y. H., & Wong, C. J., [22] the context of
the paper to improve the solar system with point of maximum power tracking. The converter
controlled by a processor with digital signal. The low-power rating 12
Page 26
Page | 12
©Daffodil International University
Converter reduces the system cost. The empirical results display that the proposed PV system
can produce more output power with high efficiency.
Islam, T., & Awal, M. A., [23] context of the paper about solar powered home system lighting of
Bangladesh. They design a system which is capable in future to communicate remote control
station and service provider can observe remotely. In the rural area, people livelihood will
change due to the blessing of solar light. Deb, A., Bhuiyan, M. A., & Nasir, A.,[24] they observe
the prospects of solar energy from aspects of Bangladesh. Solar cooking helps to reduce fossil
fuel consumption. The off-grid DC solar system which helped to solve our irrigation problem
and keep our environment fresh for our future generation. Moreover, Biswas, W. K., Diesendorf,
M., & Bryce, P, [25] research paper base on the sustainable rural improvement and poverty
palliation in Bangladesh. Income-generating opportunities are created and improve of rural
people life for quality of Photovoltaic technologies. Grameen Bank and BRAC models help poor
people to provide micro-credit individuals.
Rebane, K. L., & Barham, B. L,[26] paper firstly they collect data in Nicaragua to investigate
characteristics so that they can predict the knowledge and adoption of a solar home system
among the rural population. After studying, they identify numerous determinants of solar home
systems information and adoption, offers several useful recommendations to project planners,
and affords an analytic framework for upcoming work in this policy-relevant field. Stated that
the application of demand characterized by very low levels or the procurement cost of fuel is
very high. However, with rising fuel prices SHS technologies may become more cost-efficient
than off-grid alternatives based on fossil fuels [27]. Photovoltaic sun powered power change is
that the immediate change of sunlight into power. A little electric flow delivers when sunlight
falls on the semiconductors of the cell. Panels consist of several cells connected to provide
voltages and currents high enough for practical use. More common in rural electrification
programs is 'Solar Home System' (SHS). The SHS is providing low load but can be sufficient for
powering of radios, lights, television sets and to refrigerate medicines at rural clinics. Though at
first glance SHS seems to be luxurious, it is cost-effective electricity at small scales in areas
without access to grid electricity. 13
Page 27
Page | 13
©Daffodil International University
2.2 Socio-Economic of SHS
Rural electrification SHS Programs are contributing a sustainable socio-economic growth of the
rural people in Bangladesh. Numerous jobs will create which helps to decrease the
unemployment rate. Moreover, socio-economic impacts include computer and internet
connections to remote areas. It's not only improvements in the standard of living of the people
like a better light for child education but also reduced indoor air pollution. Furthermore, studies
identify that burning fossil fuels helps naturalize global warming. On the other hand, solar
energy does not damage the atmosphere because solar panels emit a very low amount of
hazardous pollution into the air. Thus, solar energy is an abundant cleaner source of energy than
the burning of fossil fuels. Foreign oil dependence would be shortened if more companies and
households used solar energy to produce electricity instead of fossil fuels. With the help of SHSs
Businesses such as rice/sawmills, tailoring shops, restaurants, market etc. have increased their
revenue. In addition to these developments, women are enjoying hazard fewer lighting systems
in their daily life. After dusk, they are utilizing their time by sewing, poultry farming or set up
home-based industries to earn extra income. Two very successful applications of SHS are Micro-
utility model, SHS powered Polly-phone. In this way, a significant reduction of home or office
greenhouse gas emissions is possible. Installing a grid-connected system is also the perfect way
to meet rising building energy efficiency standards.
2.3 Solar Energy for Rural Electrification in Bangladesh
In 1971, the year of independence of Bangladesh, only 250 out of 87,928 villages had access to
electricity [28]. Government of Bangladesh (GOB) committed itself to develop a program for
providing electricity to rural areas. Article 16 of the Constitution of Bangladesh states: “The
State shall adopt effective measures to bring about a radical transformation in the rural areas
through the promotion of an agricultural uprising, the provision of rural electrification, the
growth of cottage and other industries and the improvement of education, communications and
public health, in those areas, so as progressively to remove the inequality within the standards of
living between the urban and also the rural areas” [29]. BPDB was formed to operate and expand
the electricity network, which mainly concentrated.
Page 28
Page | 14
©Daffodil International University
On electrification of urban centers. To increase rural electrification NRECA was commissioned
to conduct an extensive study. NRECA developed a master plan emphasizing on the provision of
electricity for agricultural mechanization, irrigation and rural industries. The master plan was
adopted in 1977, closely followed by the establishment of the REB in the following year [30]. By
January 2014, more than 50,194 villages had been electrified through the REB program serving
more than 84, 22, 246 domestic line and 53.34% people get access to electricity service and the
rest 46.66% depends on kerosene and other sources. The REB has defined an objective to bring
all towns of Bangladesh under electrification by 2020. However, it must be noted that the
electrification of a village does not necessarily mean that all households will immediately get a
connection, as affordability of the initial connection cost creates a problem for certain number of
households. Therefore, only a small minority (10%) of rural Bangladeshis have access to electric
power. Furthermore, the quality of supply is often unsatisfactory due to frequent load shedding
and voltage variability [31]. In more remote areas, distribution line setup is costlier due to its
landscape dominated by extensive areas of water, regular flooding, hilly and certain regions of
river islands. In this situation decentralized electricity supply with RETs might represent a viable
and cost-effective alternative to conventional grid-based electrification. Natural gas reserves
estimated to be exhausted very soon and Bangladesh’s petroleum consumption being totally
import-based, increased use of renewable energy sources seems to be a reasonable step for the
development of a sustainable long-term energy scenario [32]. Even though Bangladesh’s
physical landscape is shaped by enormous amounts of water, the potential for hydroelectric
power generation is quite limited. Country’s only hydroelectric plant, Karnafuli power plant, has
a total generating capacity of 230MW, accounting for about 5% of the total installed capacity of
electricity in the country. The construction of the dam and the reservoir for the Karnafuli power
plant led to severe negative environmental and social affects creating long drawn social unrest
among the local population. Again, electricity generation from wind power is also more limited
in Bangladesh for scarcity of usable wind speed. Besides, generation of electricity from biomass
such as animal waste or crop residues is still in the early stage of development and testing.
Bangladesh is geographically located in a favorable position for harnessing sunlight, available
abundantly for most of the year. Average daily radiation of solar energy is about 4.5 kWh per
square meter making it technically quite feasible to use photo voltaic energy for electrification
purposes [33].
Page 29
Page | 15
©Daffodil International University
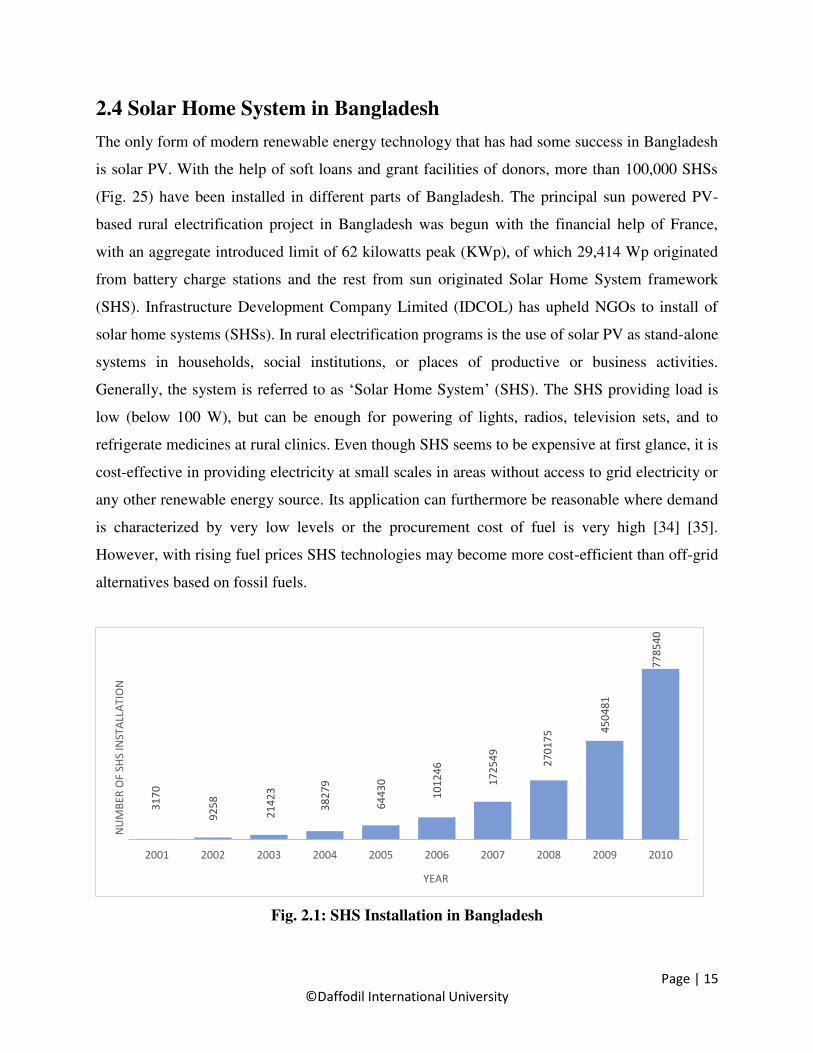
2.4 Solar Home System in Bangladesh
The only form of modern renewable energy technology that has had some success in Bangladesh
is solar PV. With the help of soft loans and grant facilities of donors, more than 100,000 SHSs
(Fig. 25) have been installed in different parts of Bangladesh. The principal sun powered PV-
based rural electrification project in Bangladesh was begun with the financial help of France,
with an aggregate introduced limit of 62 kilowatts peak (KWp), of which 29,414 Wp originated
from battery charge stations and the rest from sun originated Solar Home System framework
(SHS). Infrastructure Development Company Limited (IDCOL) has upheld NGOs to install of
solar home systems (SHSs). In rural electrification programs is the use of solar PV as stand-alone
systems in households, social institutions, or places of productive or business activities.
Generally, the system is referred to as ‘Solar Home System’ (SHS). The SHS providing load is
low (below 100 W), but can be enough for powering of lights, radios, television sets, and to
refrigerate medicines at rural clinics. Even though SHS seems to be expensive at first glance, it is
cost-effective in providing electricity at small scales in areas without access to grid electricity or
any other renewable energy source. Its application can furthermore be reasonable where demand
is characterized by very low levels or the procurement cost of fuel is very high [34] [35].
However, with rising fuel prices SHS technologies may become more cost-efficient than off-grid
alternatives based on fossil fuels.
Fig. 2.1: SHS Installation in Bangladesh
31
70
92
58
21
42
3
38
27
9
64
43
0
10
12
46
17
25
49
27
01
75
45
04
81
77
85
40
2001 2002 2003 2004 2005 2006 2007 2008 2009 2010
NU
MB
ER
OF
SH
S I
NS
TA
LLA
TIO
N
YEAR
Page 30
Page | 16
©Daffodil International University
2.5 Progression of Worldwide SHS Dissemination
The utilization of sunlight-based power expanded at the disclosure of photo voltaic cell in 1839 by
French physicist Edmond Becquerel. Successive researchers have developed cells with more
efficiency. The first interest in solar technologies for rural stand-alone electrification arose in the
1970s. The 1973 oil embargo and 1979 energy crisis caused a reform of energy policies around the
world and brought renewed attention to developing solar technologies. Between 1970 and 1983
photo voltaic installations grew rapidly but falling oil prices in the early 1980s moderated the growth
of solar photo volt from 1984 to 1996 [37].
Dissemination of SHS depends on afford ability. According to F. D. J. Nieuwenh out adequate
service infrastructure is required to make projects viable. Smaller systems sold for cash can be a good
alternative to credit systems by offering to increased affordability [38]. Depending on their size,
prices of SHS scan vary between US$ 100 and US$ 1,100. There are also important price variations
for various countries observable. Local prices depend on factors such as duties, taxes, and subsidies,
the scale of manufacturing and assembly processes, the scale and cost of marketing and other
services, the degree of competition, capacity utilization in manufacture, sales & servicing and the
cost of funds for working capital and capital costs. The other major issues to be considered are the
high initial costs, the formation of a responsive and sustainable infrastructure and the guaranteeing of
quality products and services. Reducing the market prices of SHSs by influencing the above factors
is an important strategy of many SHS dissemination programs [39]. As of late the vast majority of
the worldwide development in SHS deals has focused on a couple of Asian nations, to be specific
India, Sri Lanka, Nepal, Bangladesh, Thailand, and China. In these countries, the problem of afford
ability has been overcome either with micro-credit or by selling small systems for cash.
Page 31
Page | 17
©Daffodil International University
CHAPTER 3
SOLAR PV EQUIPMENT
3.1 Introduction
In this modern era people have taken solar energy as the alternate of grid electricity. Solar
Energy is a great source for resolving power crisis in Bangladesh. A solar PV system is a
significant emerging option to supply electricity with quality light, reliable service & long-term
sustainability.
3.2 Photovoltaic Technology
A more common term for photo voltaic cells is "solar cells", although the cells work with any
kind of light and not just sunlight.
A solar cell is a converter. It changes energy of light into electrical energy. A cell does not store
any energy, so when the source of light (typical the sun) is removed, there is no electrical current
from the cell. If electricity is needed during the night, some form of electrical storage (typical a
battery) must be included in the circuit.
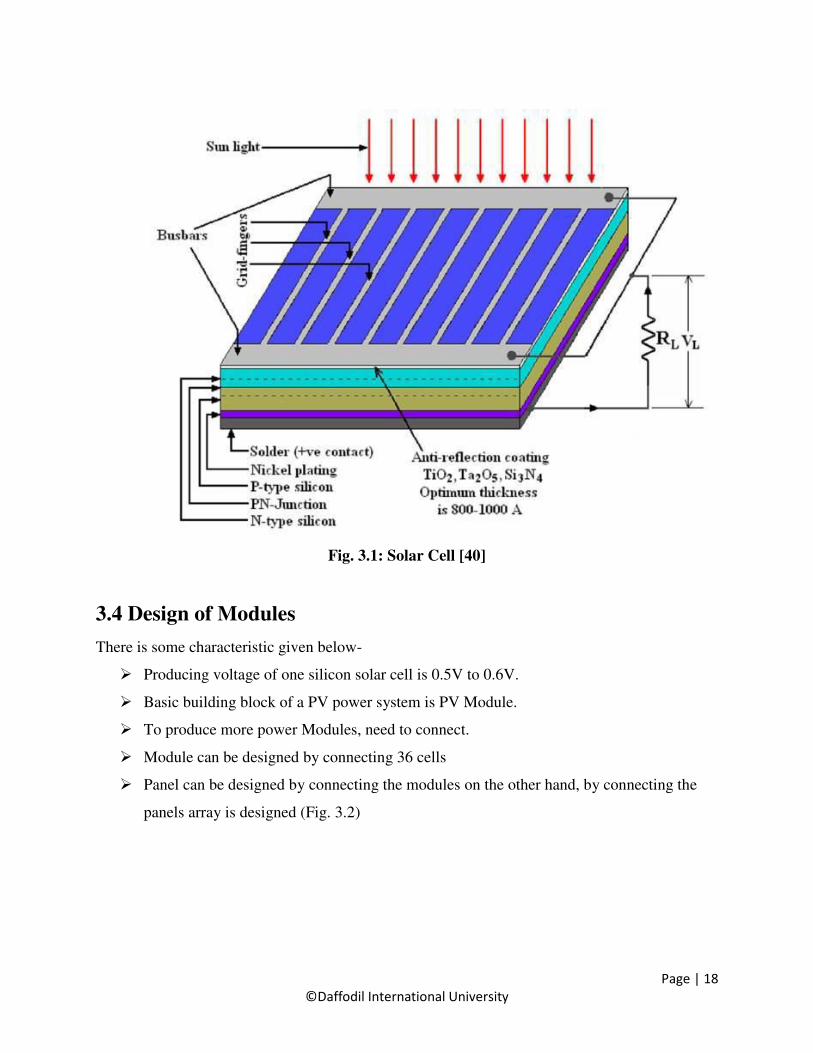
3.3 Solar Cells
PV or solar cells (Fig.3.1) are PN junction Semiconductor devices. It converts sun light into
direct electricity. Solar cells typically are distinguished by their sort of semiconductor junction-
(A) Homo junction (n + p layer is of the same material)
(B) Hetero junction (n + p layer is of different material)
(C) MIS (Metal -Isolator - Semiconductor)
(D) SIS (Semiconductor - Isolator - Semiconductor).
Page 32
Page | 18
©Daffodil International University
Fig. 3.1: Solar Cell [40]
3.4 Design of Modules
There is some characteristic given below-
Producing voltage of one silicon solar cell is 0.5V to 0.6V.
Basic building block of a PV power system is PV Module.
To produce more power Modules, need to connect.
Module can be designed by connecting 36 cells
Panel can be designed by connecting the modules on the other hand, by connecting the
panels array is designed (Fig. 3.2)
Page 33
Page | 19
©Daffodil International University
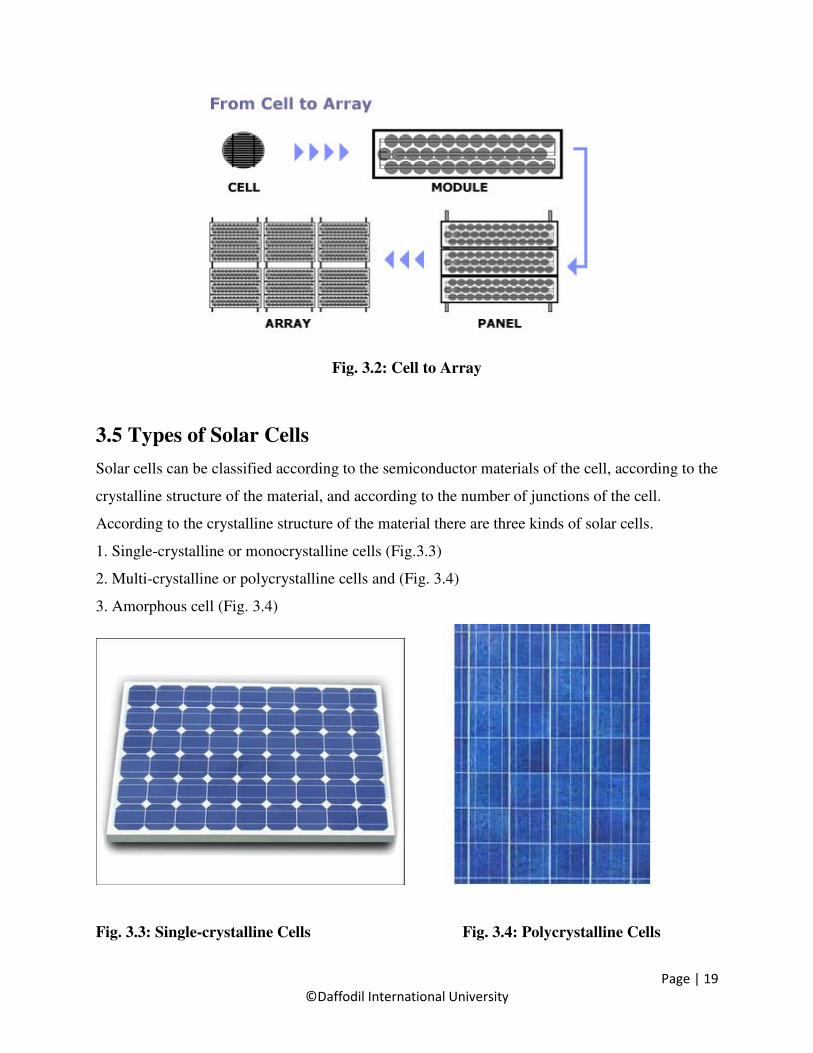
Fig. 3.2: Cell to Array
3.5 Types of Solar Cells
Solar cells can be classified according to the semiconductor materials of the cell, according to the
crystalline structure of the material, and according to the number of junctions of the cell.
According to the crystalline structure of the material there are three kinds of solar cells.
1. Single-crystalline or monocrystalline cells (Fig.3.3)
2. Multi-crystalline or polycrystalline cells and (Fig. 3.4)
3. Amorphous cell (Fig. 3.4)
Fig. 3.3: Single-crystalline Cells Fig. 3.4: Polycrystalline Cells
Page 34
Page | 20
©Daffodil International University
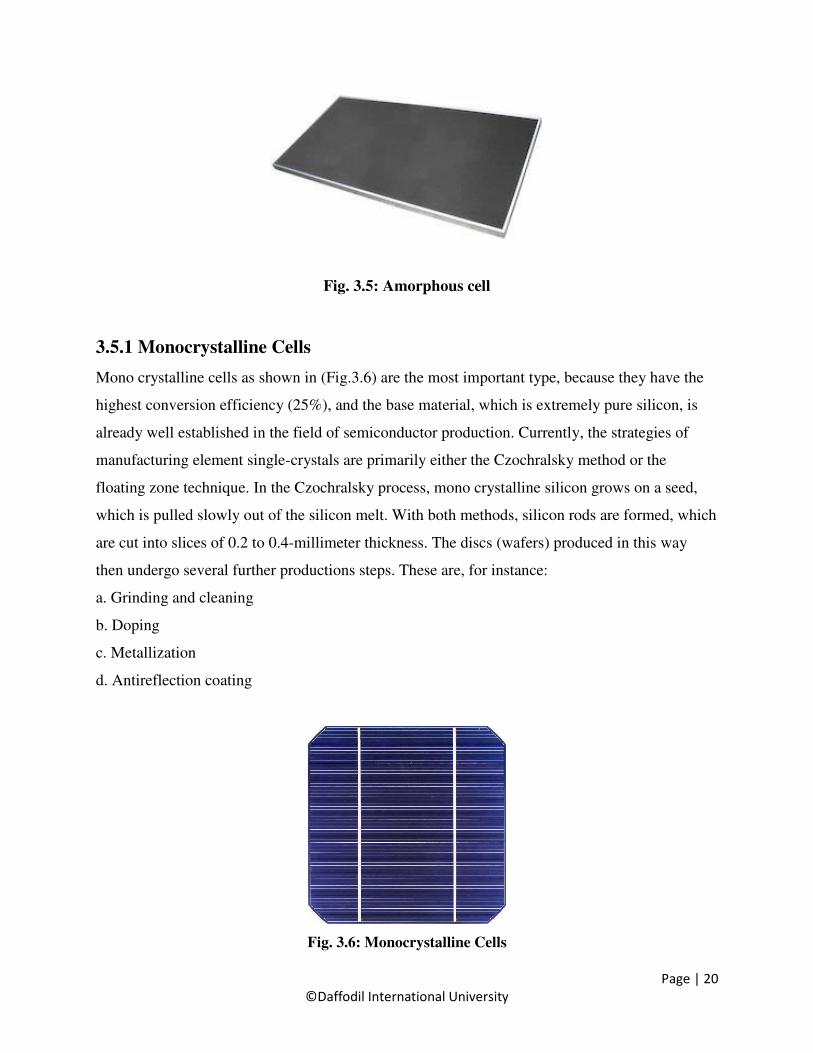
Fig. 3.5: Amorphous cell
3.5.1 Monocrystalline Cells
Mono crystalline cells as shown in (Fig.3.6) are the most important type, because they have the
highest conversion efficiency (25%), and the base material, which is extremely pure silicon, is
already well established in the field of semiconductor production. Currently, the strategies of
manufacturing element single-crystals are primarily either the Czochralsky method or the
floating zone technique. In the Czochralsky process, mono crystalline silicon grows on a seed,
which is pulled slowly out of the silicon melt. With both methods, silicon rods are formed, which
are cut into slices of 0.2 to 0.4-millimeter thickness. The discs (wafers) produced in this way
then undergo several further productions steps. These are, for instance:
a. Grinding and cleaning
b. Doping
c. Metallization
d. Antireflection coating
Fig. 3.6: Monocrystalline Cells
Page 35
Page | 21
©Daffodil International University
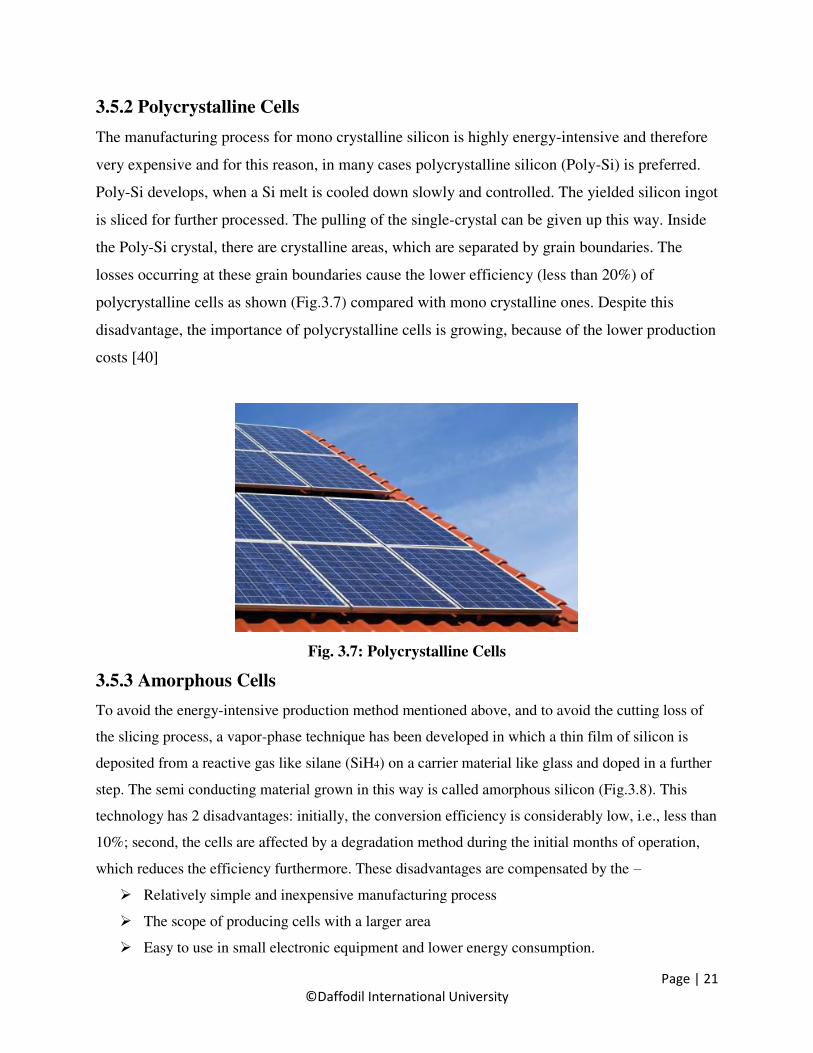
3.5.2 Polycrystalline Cells
The manufacturing process for mono crystalline silicon is highly energy-intensive and therefore
very expensive and for this reason, in many cases polycrystalline silicon (Poly-Si) is preferred.
Poly-Si develops, when a Si melt is cooled down slowly and controlled. The yielded silicon ingot
is sliced for further processed. The pulling of the single-crystal can be given up this way. Inside
the Poly-Si crystal, there are crystalline areas, which are separated by grain boundaries. The
losses occurring at these grain boundaries cause the lower efficiency (less than 20%) of
polycrystalline cells as shown (Fig.3.7) compared with mono crystalline ones. Despite this
disadvantage, the importance of polycrystalline cells is growing, because of the lower production
costs [40]
Fig. 3.7: Polycrystalline Cells
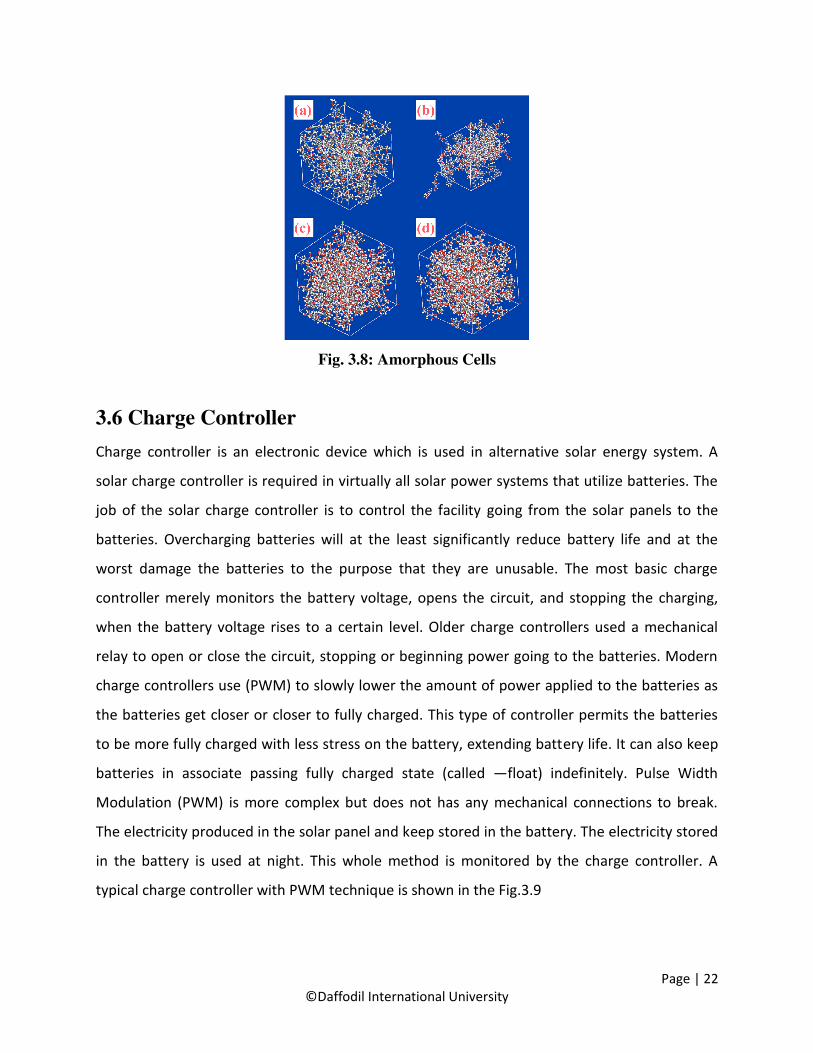
3.5.3 Amorphous Cells
To avoid the energy-intensive production method mentioned above, and to avoid the cutting loss of
the slicing process, a vapor-phase technique has been developed in which a thin film of silicon is
deposited from a reactive gas like silane (SiH4) on a carrier material like glass and doped in a further
step. The semi conducting material grown in this way is called amorphous silicon (Fig.3.8). This
technology has 2 disadvantages: initially, the conversion efficiency is considerably low, i.e., less than
10%; second, the cells are affected by a degradation method during the initial months of operation,
which reduces the efficiency furthermore. These disadvantages are compensated by the –
Relatively simple and inexpensive manufacturing process
The scope of producing cells with a larger area
Easy to use in small electronic equipment and lower energy consumption.
Page 36
Page | 22
©Daffodil International University
Fig. 3.8: Amorphous Cells
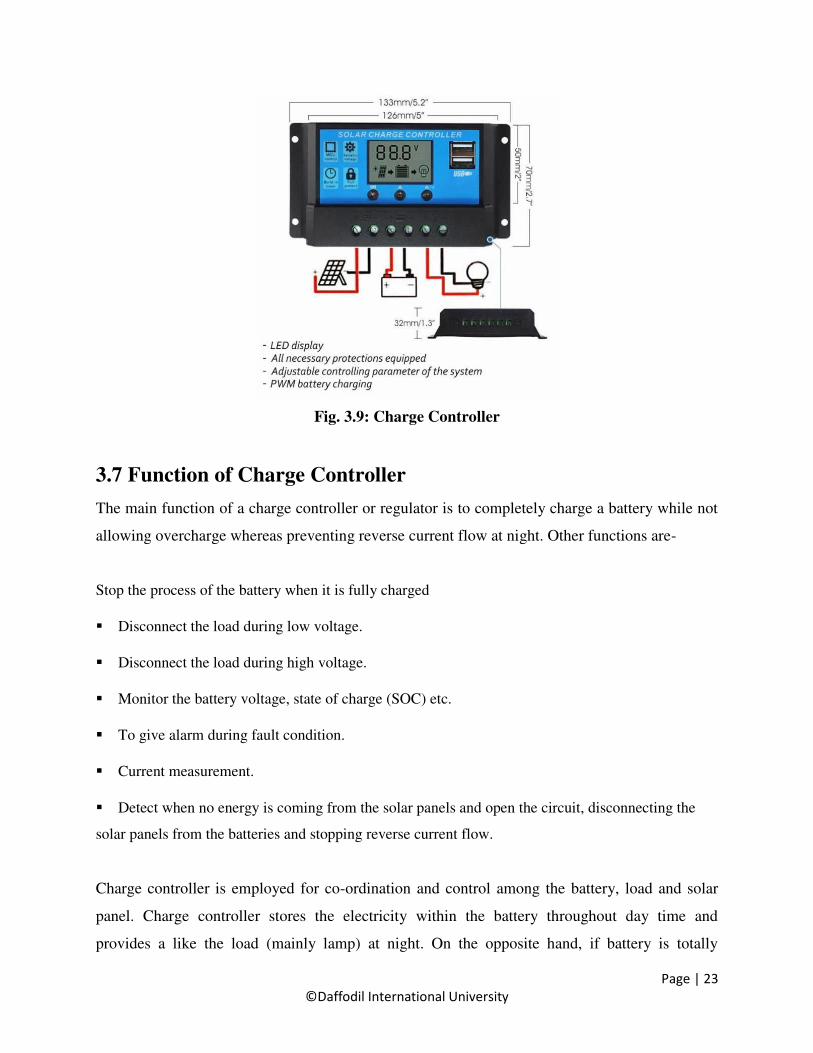
3.6 Charge Controller
Charge controller is an electronic device which is used in alternative solar energy system. A
solar charge controller is required in virtually all solar power systems that utilize batteries. The
job of the solar charge controller is to control the facility going from the solar panels to the
batteries. Overcharging batteries will at the least significantly reduce battery life and at the
worst damage the batteries to the purpose that they are unusable. The most basic charge
controller merely monitors the battery voltage, opens the circuit, and stopping the charging,
when the battery voltage rises to a certain level. Older charge controllers used a mechanical
relay to open or close the circuit, stopping or beginning power going to the batteries. Modern
charge controllers use (PWM) to slowly lower the amount of power applied to the batteries as
the batteries get closer or closer to fully charged. This type of controller permits the batteries
to be more fully charged with less stress on the battery, extending battery life. It can also keep
batteries in associate passing fully charged state (called ―float) indefinitely. Pulse Width
Modulation (PWM) is more complex but does not has any mechanical connections to break.
The electricity produced in the solar panel and keep stored in the battery. The electricity stored
in the battery is used at night. This whole method is monitored by the charge controller. A
typical charge controller with PWM technique is shown in the Fig.3.9
Page 37
Page | 23
©Daffodil International University
Fig. 3.9: Charge Controller
3.7 Function of Charge Controller
The main function of a charge controller or regulator is to completely charge a battery while not
allowing overcharge whereas preventing reverse current flow at night. Other functions are-
Stop the process of the battery when it is fully charged
Disconnect the load during low voltage.
Disconnect the load during high voltage.
Monitor the battery voltage, state of charge (SOC) etc.
To give alarm during fault condition.
Current measurement.
Detect when no energy is coming from the solar panels and open the circuit, disconnecting the
solar panels from the batteries and stopping reverse current flow.
Charge controller is employed for co-ordination and control among the battery, load and solar
panel. Charge controller stores the electricity within the battery throughout day time and
provides a like the load (mainly lamp) at night. On the opposite hand, if battery is totally
Page 38
Page | 24
©Daffodil International University
charged, then charge controller will directly provide electricity to the load (Fan, mobile charger
etc.) from the solar panel throughout day time. A charge regulator or charge controller is mainly
worked as a voltage regulator. Generally, it controls the current and voltage of the solar panel to save
in battery. Solar panel mainly produces 16 volts to 21 volt and 14 volts to 14.4 volt is required to
keep the battery in full charged state. The charge controller works as a buck converter to reduce
this voltage level. Charge controller is mainly a DC-AC or DC-DC converter. Buck converter is
usually used in the solar panel which converts the high-level DC voltage to the low-level DC
voltage [40].
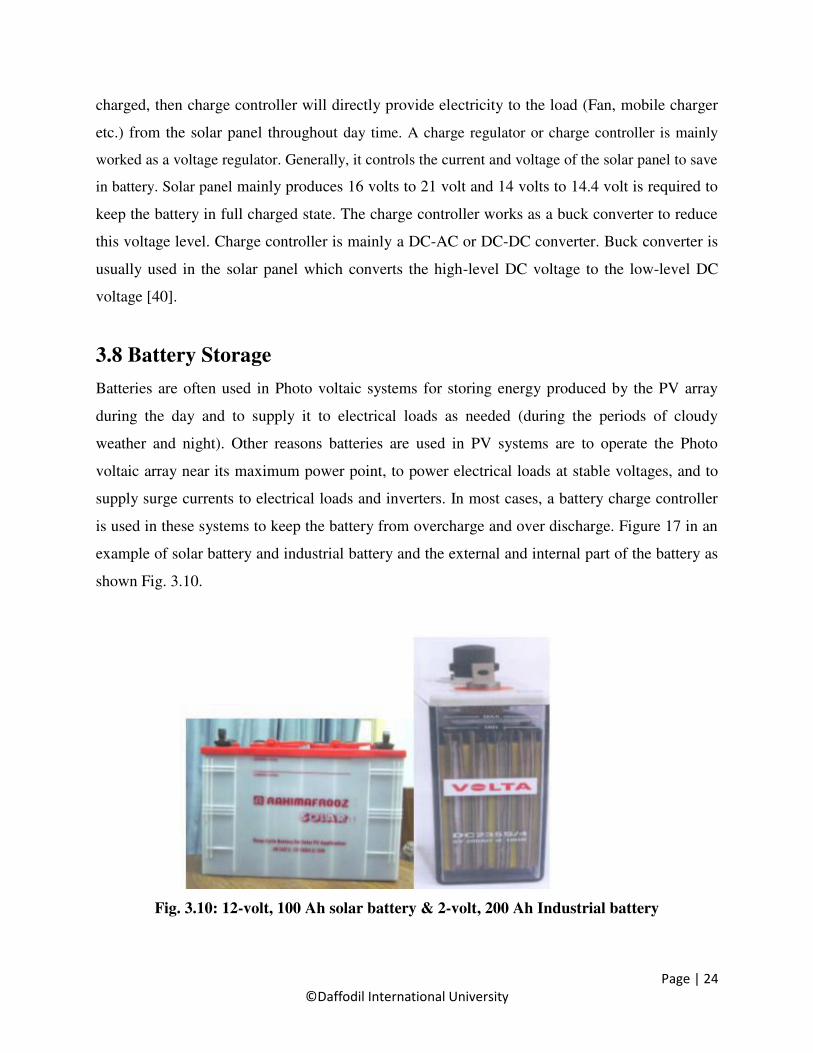
3.8 Battery Storage
Batteries are often used in Photo voltaic systems for storing energy produced by the PV array
during the day and to supply it to electrical loads as needed (during the periods of cloudy
weather and night). Other reasons batteries are used in PV systems are to operate the Photo
voltaic array near its maximum power point, to power electrical loads at stable voltages, and to
supply surge currents to electrical loads and inverters. In most cases, a battery charge controller
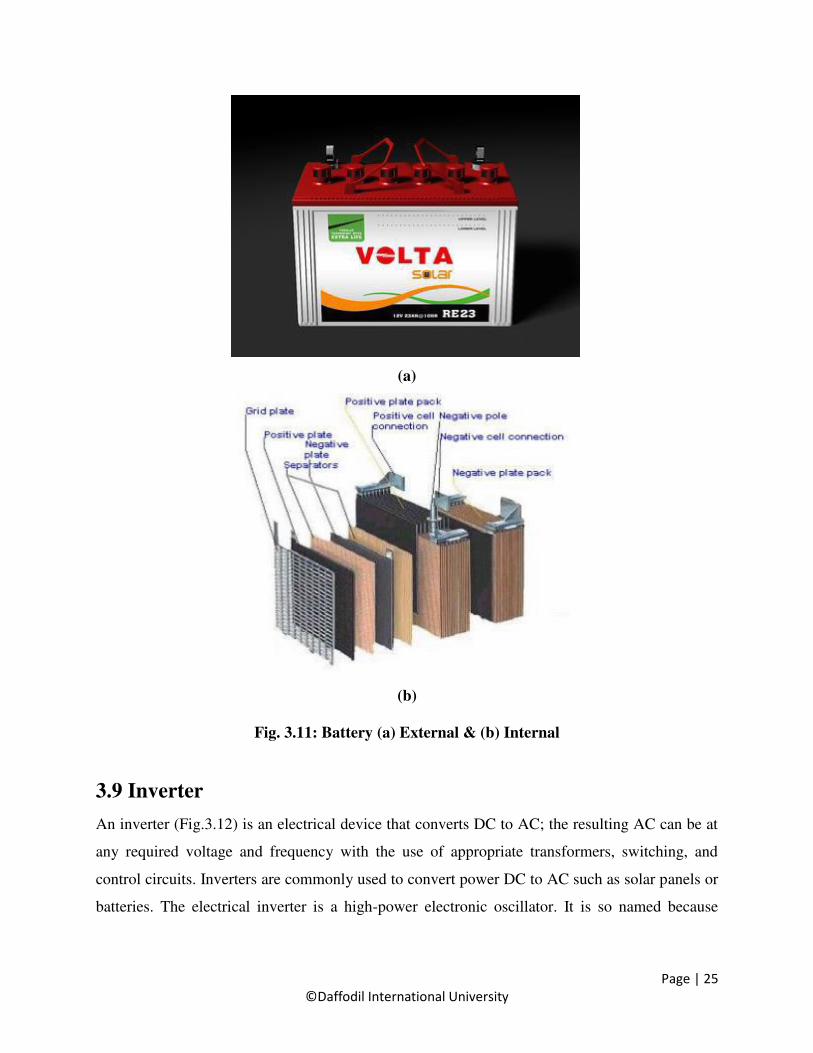
is used in these systems to keep the battery from overcharge and over discharge. Figure 17 in an
example of solar battery and industrial battery and the external and internal part of the battery as
shown Fig. 3.10.
Fig. 3.10: 12-volt, 100 Ah solar battery & 2-volt, 200 Ah Industrial battery
Page 39
Page | 25
©Daffodil International University
(a)
(b)
Fig. 3.11: Battery (a) External & (b) Internal
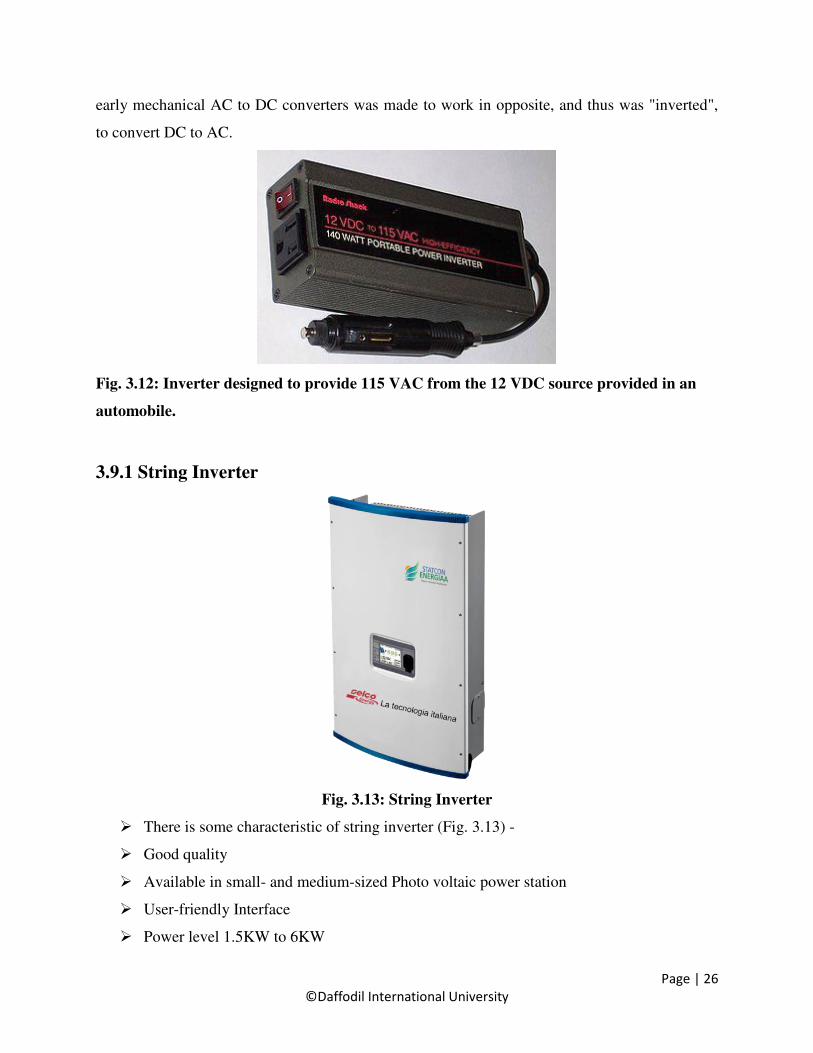
3.9 Inverter
An inverter (Fig.3.12) is an electrical device that converts DC to AC; the resulting AC can be at
any required voltage and frequency with the use of appropriate transformers, switching, and
control circuits. Inverters are commonly used to convert power DC to AC such as solar panels or
batteries. The electrical inverter is a high-power electronic oscillator. It is so named because
Page 40
Page | 26
©Daffodil International University
early mechanical AC to DC converters was made to work in opposite, and thus was "inverted",
to convert DC to AC.
Fig. 3.12: Inverter designed to provide 115 VAC from the 12 VDC source provided in an
automobile.
3.9.1 String Inverter
Fig. 3.13: String Inverter
There is some characteristic of string inverter (Fig. 3.13) -
Good quality
Available in small- and medium-sized Photo voltaic power station
User-friendly Interface
Power level 1.5KW to 6KW
Page 41
Page | 27
©Daffodil International University
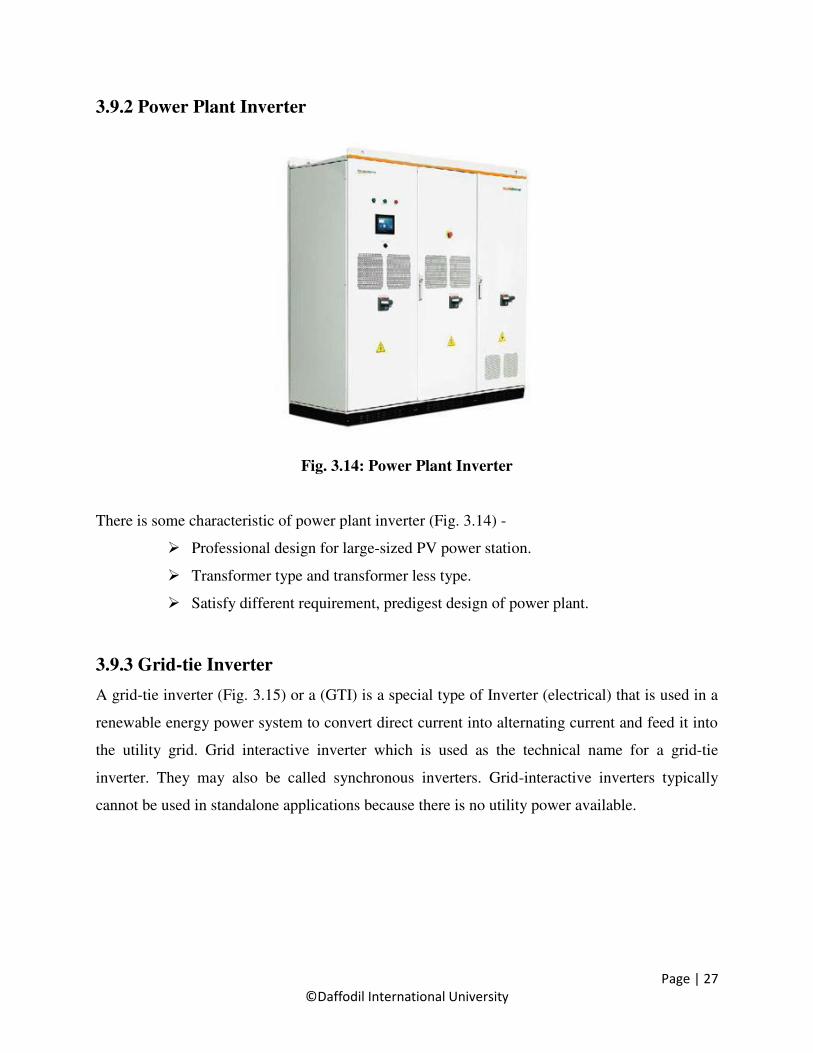
3.9.2 Power Plant Inverter
Fig. 3.14: Power Plant Inverter
There is some characteristic of power plant inverter (Fig. 3.14) -
Professional design for large-sized PV power station.
Transformer type and transformer less type.
Satisfy different requirement, predigest design of power plant.
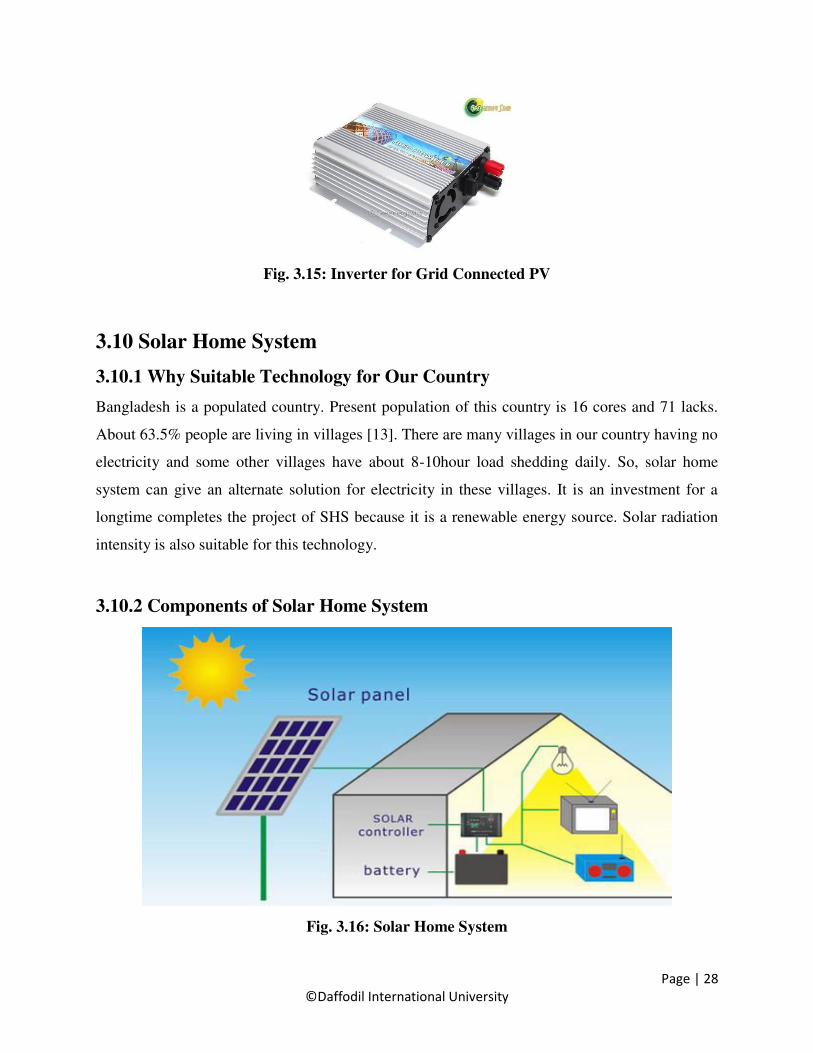
3.9.3 Grid-tie Inverter
A grid-tie inverter (Fig. 3.15) or a (GTI) is a special type of Inverter (electrical) that is used in a
renewable energy power system to convert direct current into alternating current and feed it into
the utility grid. Grid interactive inverter which is used as the technical name for a grid-tie
inverter. They may also be called synchronous inverters. Grid-interactive inverters typically
cannot be used in standalone applications because there is no utility power available.
Page 42
Page | 28
©Daffodil International University
Fig. 3.15: Inverter for Grid Connected PV
3.10 Solar Home System
3.10.1 Why Suitable Technology for Our Country
Bangladesh is a populated country. Present population of this country is 16 cores and 71 lacks.
About 63.5% people are living in villages [13]. There are many villages in our country having no
electricity and some other villages have about 8-10hour load shedding daily. So, solar home
system can give an alternate solution for electricity in these villages. It is an investment for a
longtime completes the project of SHS because it is a renewable energy source. Solar radiation
intensity is also suitable for this technology.
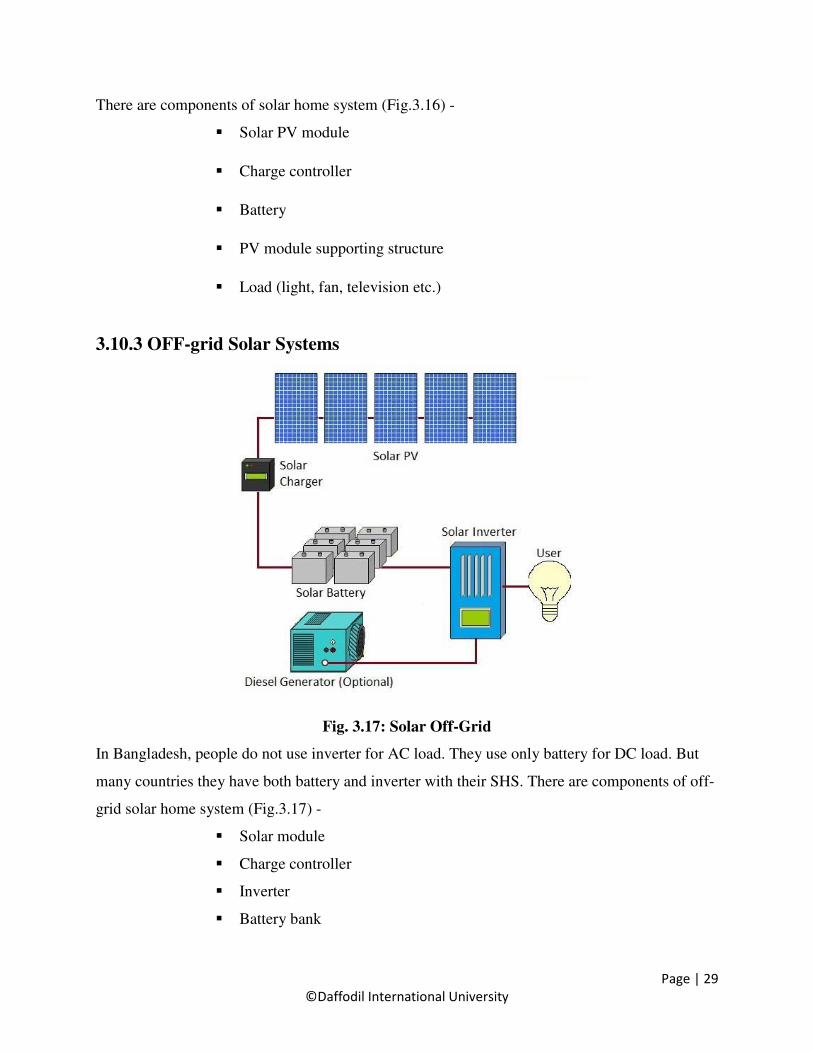
3.10.2 Components of Solar Home System
Fig. 3.16: Solar Home System
Page 43
Page | 29
©Daffodil International University
There are components of solar home system (Fig.3.16) -
Solar PV module
Charge controller
Battery
PV module supporting structure
Load (light, fan, television etc.)
3.10.3 OFF-grid Solar Systems
Fig. 3.17: Solar Off-Grid
In Bangladesh, people do not use inverter for AC load. They use only battery for DC load. But
many countries they have both battery and inverter with their SHS. There are components of off-
grid solar home system (Fig.3.17) -
Solar module
Charge controller
Inverter
Battery bank
Page 44
Page | 30
©Daffodil International University
CHAPTER 4
METHODOLOGY
4.1 Introduction
In this section, we will discuss the process of data collection method and research tools. The
primary data that we have collected from our study area and secondary data we have collected
from various paper.
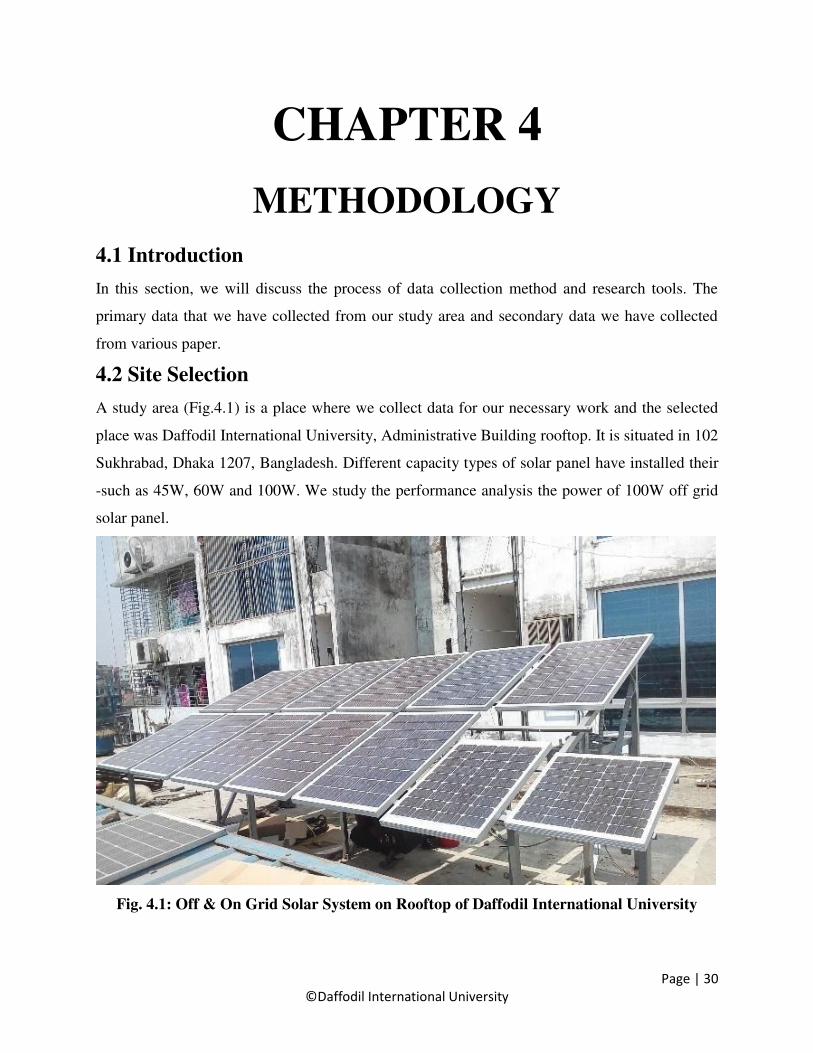
4.2 Site Selection
A study area (Fig.4.1) is a place where we collect data for our necessary work and the selected
place was Daffodil International University, Administrative Building rooftop. It is situated in 102
Sukhrabad, Dhaka 1207, Bangladesh. Different capacity types of solar panel have installed their
-such as 45W, 60W and 100W. We study the performance analysis the power of 100W off grid
solar panel.
Fig. 4.1: Off & On Grid Solar System on Rooftop of Daffodil International University
Page 45
Page | 31
©Daffodil International University
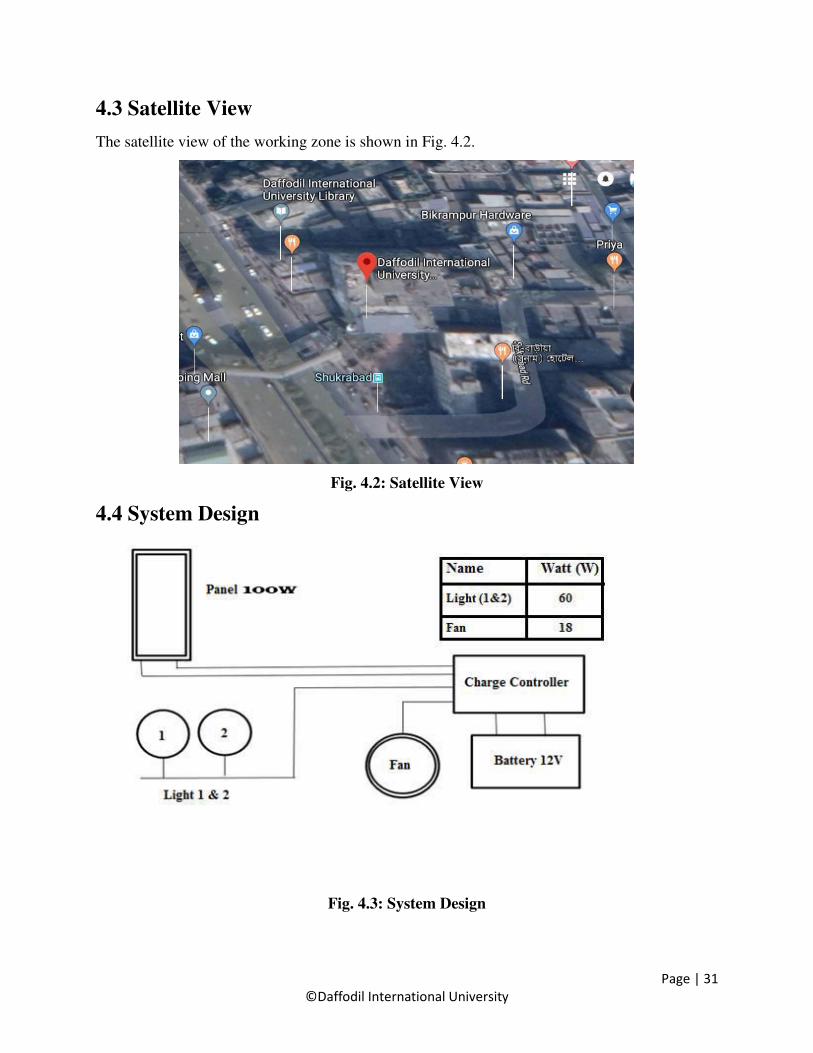
4.3 Satellite View
The satellite view of the working zone is shown in Fig. 4.2.
Fig. 4.2: Satellite View
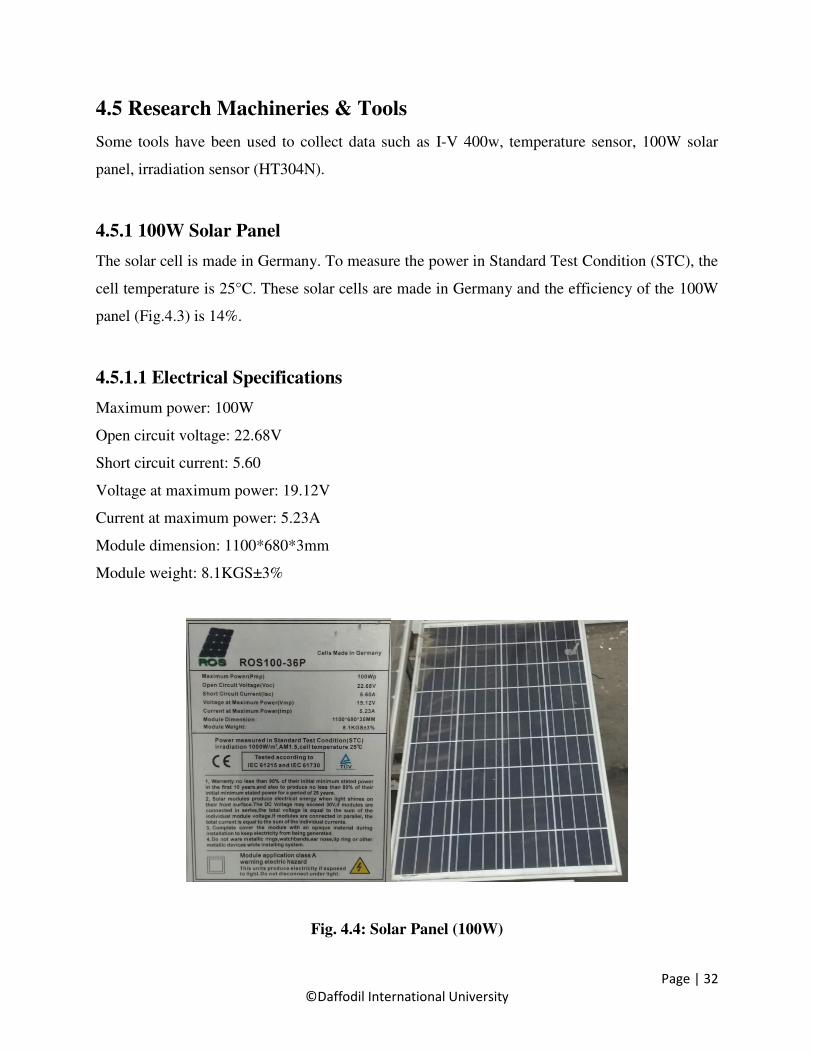
4.4 System Design
Fig. 4.3: System Design
Page 46
Page | 32
©Daffodil International University
4.5 Research Machineries & Tools
Some tools have been used to collect data such as I-V 400w, temperature sensor, 100W solar
panel, irradiation sensor (HT304N).
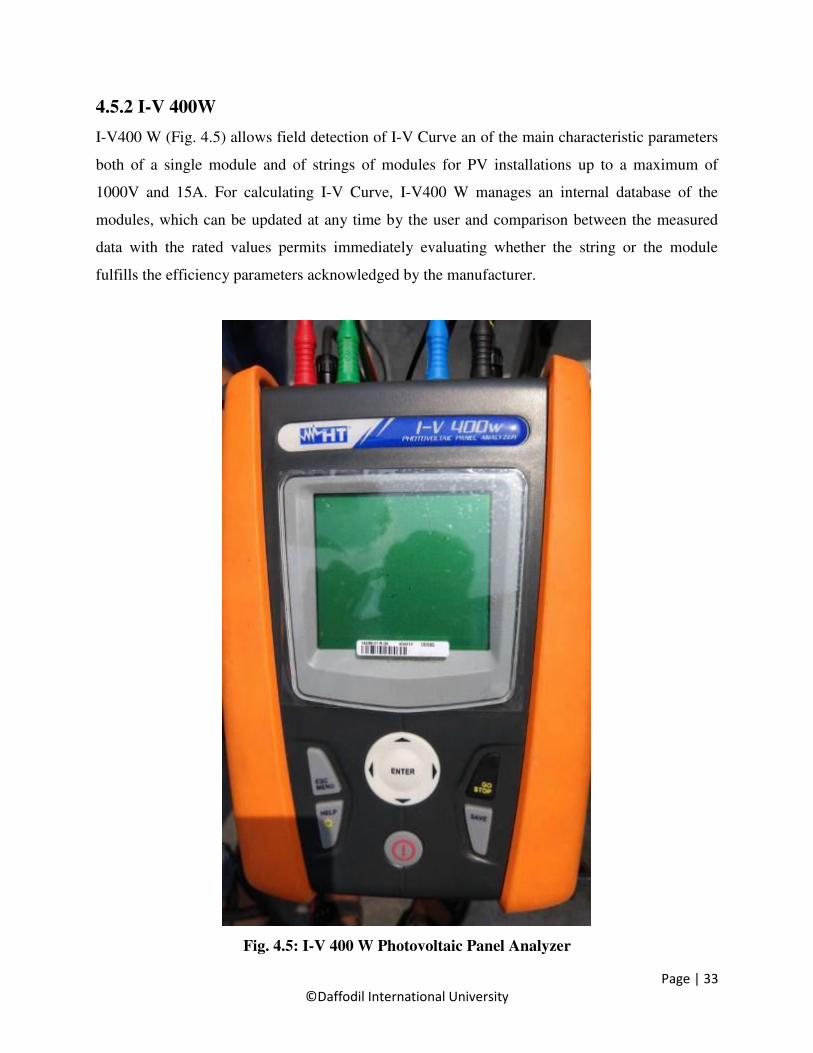
4.5.1 100W Solar Panel
The solar cell is made in Germany. To measure the power in Standard Test Condition (STC), the
cell temperature is 25°C. These solar cells are made in Germany and the efficiency of the 100W
panel (Fig.4.3) is 14%.
4.5.1.1 Electrical Specifications
Maximum power: 100W
Open circuit voltage: 22.68V
Short circuit current: 5.60
Voltage at maximum power: 19.12V
Current at maximum power: 5.23A
Module dimension: 1100*680*3mm
Module weight: 8.1KGS±3%
Fig. 4.4: Solar Panel (100W)
Page 47
Page | 33
©Daffodil International University
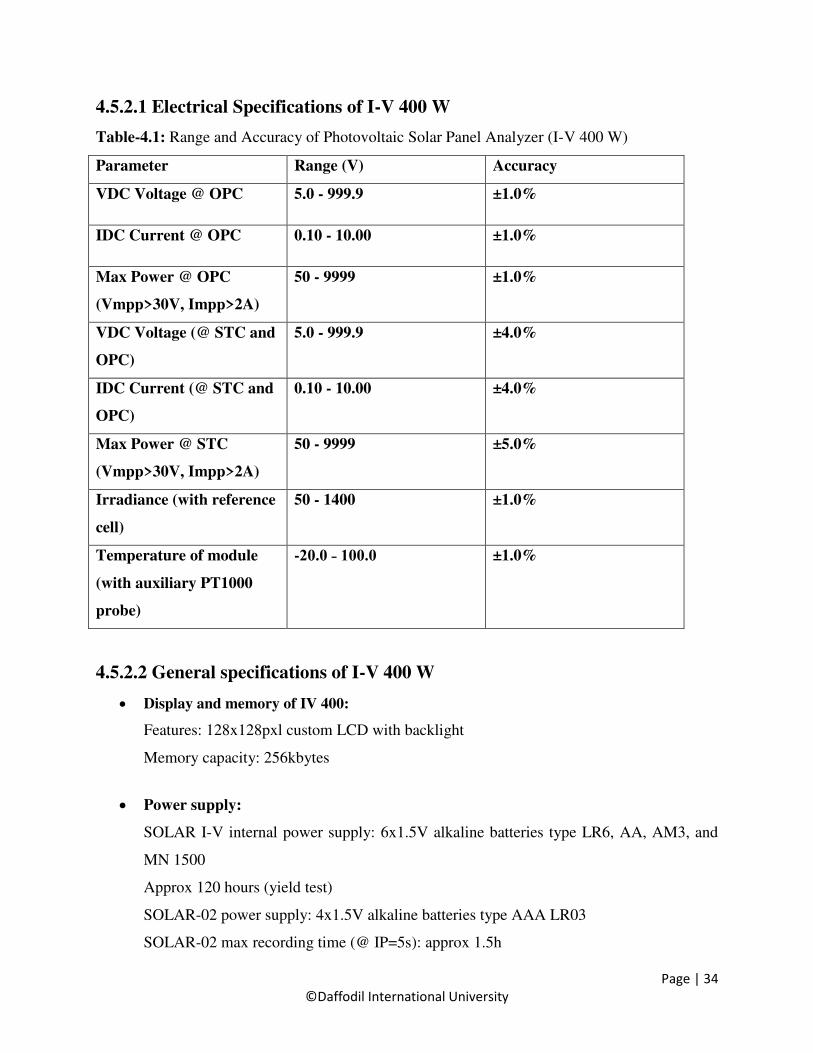
4.5.2 I-V 400W
I-V400 W (Fig. 4.5) allows field detection of I-V Curve an of the main characteristic parameters
both of a single module and of strings of modules for PV installations up to a maximum of
1000V and 15A. For calculating I-V Curve, I-V400 W manages an internal database of the
modules, which can be updated at any time by the user and comparison between the measured
data with the rated values permits immediately evaluating whether the string or the module
fulfills the efficiency parameters acknowledged by the manufacturer.
Fig. 4.5: I-V 400 W Photovoltaic Panel Analyzer
Page 48
Page | 34
©Daffodil International University
4.5.2.1 Electrical Specifications of I-V 400 W
Table-4.1: Range and Accuracy of Photovoltaic Solar Panel Analyzer (I-V 400 W)
Parameter Range (V) Accuracy
VDC Voltage @ OPC 5.0 - 999.9 ±1.0%
IDC Current @ OPC 0.10 - 10.00 ±1.0%
Max Power @ OPC
(Vmpp>30V, Impp>2A)
50 - 9999 ±1.0%
VDC Voltage (@ STC and
OPC)
5.0 - 999.9 ±4.0%
IDC Current (@ STC and
OPC)
0.10 - 10.00 ±4.0%
Max Power @ STC
(Vmpp>30V, Impp>2A)
50 - 9999 ±5.0%
Irradiance (with reference
cell)
50 - 1400 ±1.0%
Temperature of module
(with auxiliary PT1000
probe)
-20.0 ˗ 100.0 ±1.0%
4.5.2.2 General specifications of I-V 400 W
Display and memory of IV 400:
Features: 128x128pxl custom LCD with backlight
Memory capacity: 256kbytes
Power supply:
SOLAR I-V internal power supply: 6x1.5V alkaline batteries type LR6, AA, AM3, and
MN 1500
Approx 120 hours (yield test)
SOLAR-02 power supply: 4x1.5V alkaline batteries type AAA LR03
SOLAR-02 max recording time (@ IP=5s): approx 1.5h
Page 49
Page | 35
©Daffodil International University
Output interface
PC communication port: optical/USB
Interface with SOLAR-02: wireless RF communication (max distance 1m)
Mechanical features
Dimensions: 235 x 165 x 75mm
Weight (batteries included): 1.2kg
Environmental conditions:
Reference temperature: 23°C ± 5°C
Working temperature: 0° ÷ 40°C
Working humidity: <80% HR
Storage temperature (batt. not included): -10 ÷ 60°C
Storage humidity: <80%HR
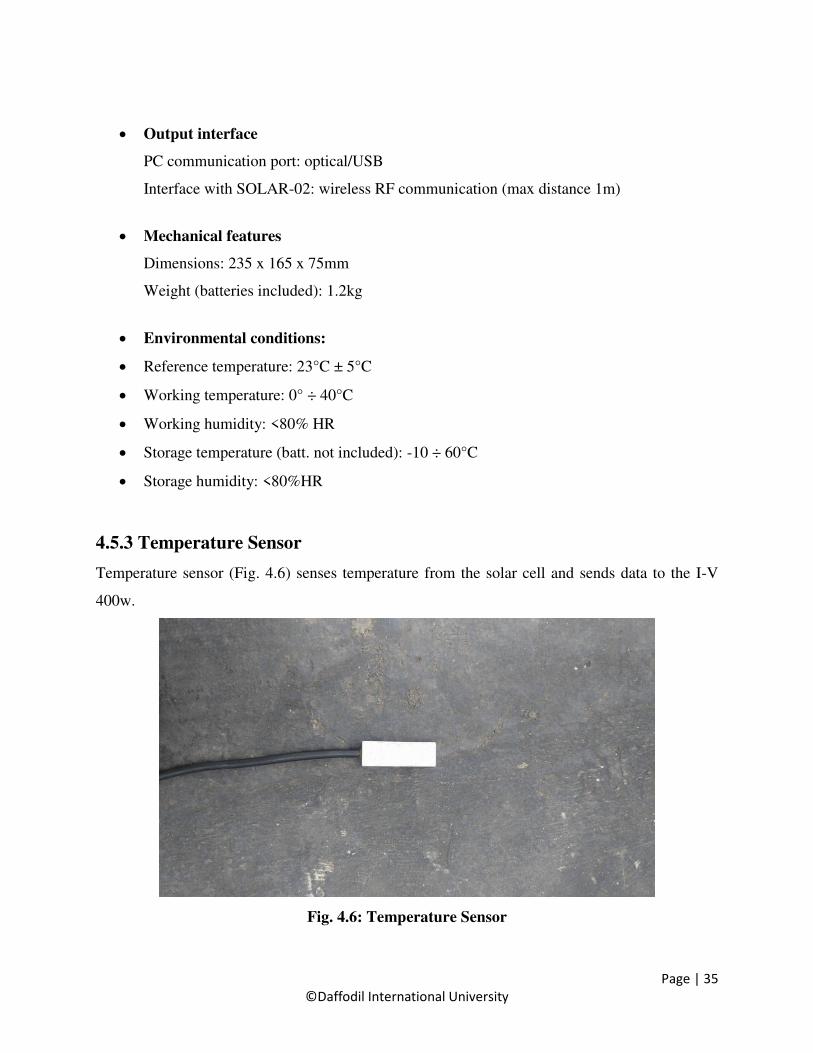
4.5.3 Temperature Sensor
Temperature sensor (Fig. 4.6) senses temperature from the solar cell and sends data to the I-V
400w.
Fig. 4.6: Temperature Sensor
Page 50
Page | 36
©Daffodil International University
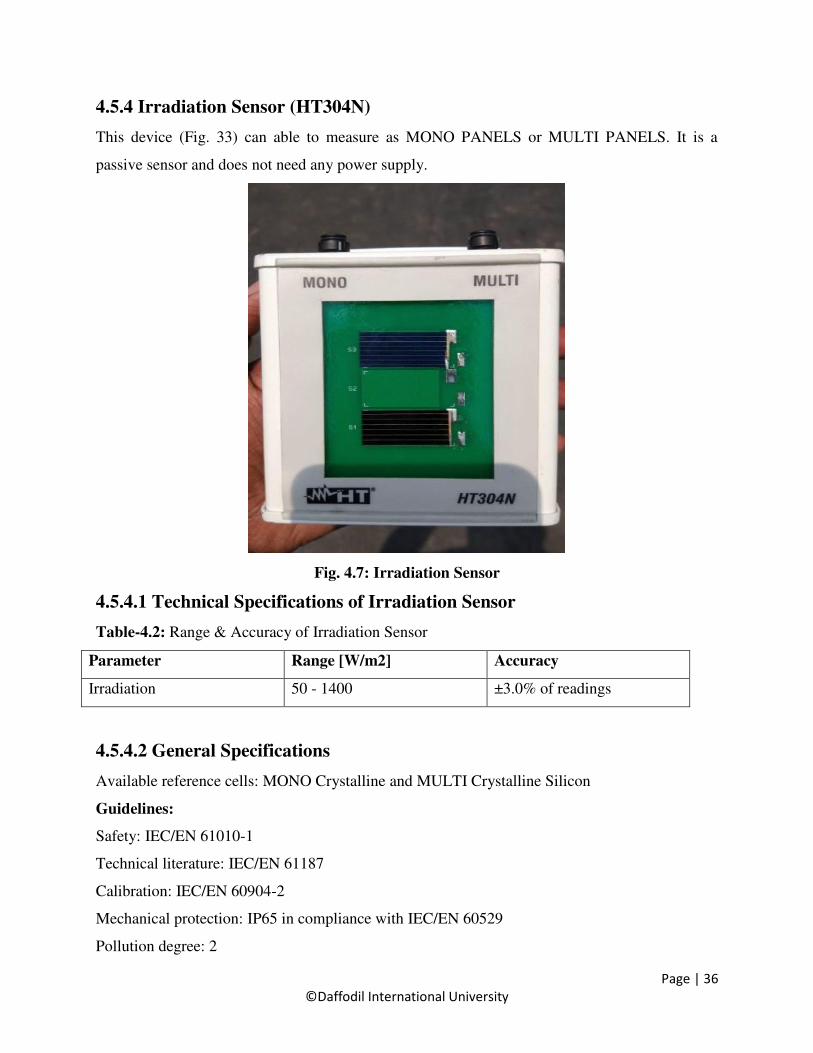
4.5.4 Irradiation Sensor (HT304N)
This device (Fig. 33) can able to measure as MONO PANELS or MULTI PANELS. It is a
passive sensor and does not need any power supply.
Fig. 4.7: Irradiation Sensor
4.5.4.1 Technical Specifications of Irradiation Sensor
Table-4.2: Range & Accuracy of Irradiation Sensor
Parameter Range [W/m2] Accuracy
Irradiation 50 - 1400 ±3.0% of readings
4.5.4.2 General Specifications
Available reference cells: MONO Crystalline and MULTI Crystalline Silicon
Guidelines:
Safety: IEC/EN 61010-1
Technical literature: IEC/EN 61187
Calibration: IEC/EN 60904-2
Mechanical protection: IP65 in compliance with IEC/EN 60529
Pollution degree: 2
Page 51
Page | 37
©Daffodil International University
Mechanical characteristics:
Dimensions (LxWxH): 120x85x40 mm
Weight: 260g
Environmental conditions:
Working temperature: -20°C ÷ 50°C
Storage temperature: -20°C ÷ 60°C
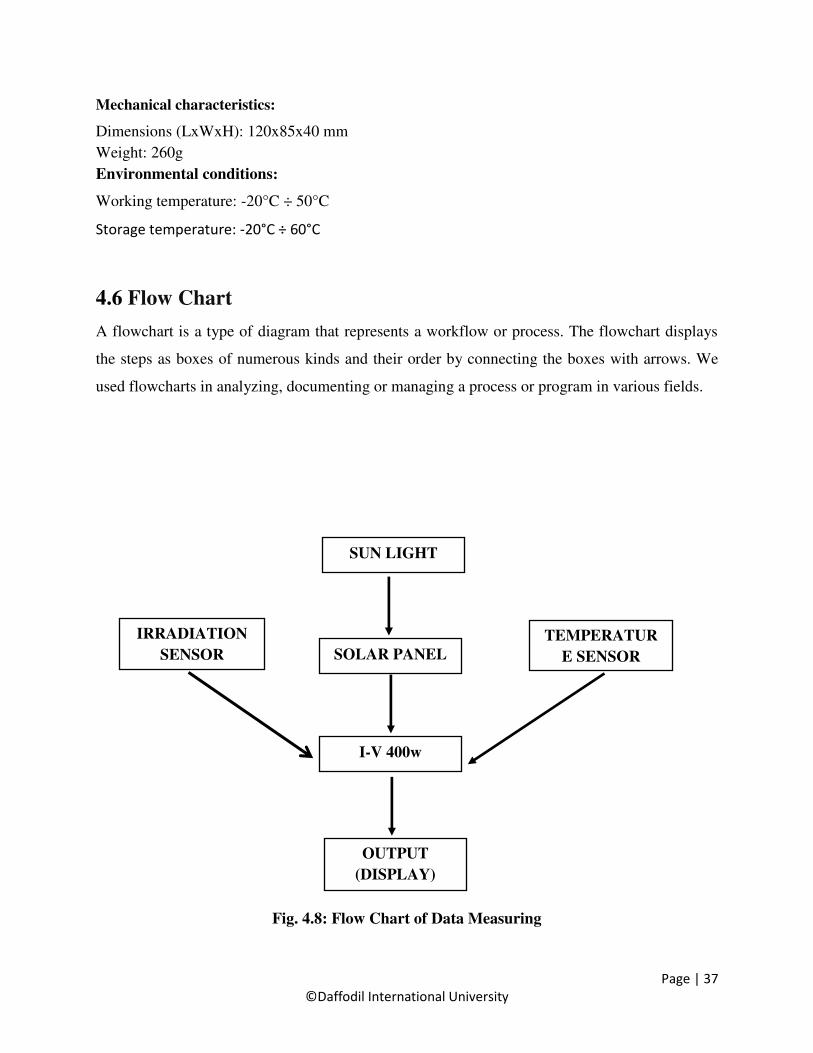
4.6 Flow Chart
A flowchart is a type of diagram that represents a workflow or process. The flowchart displays
the steps as boxes of numerous kinds and their order by connecting the boxes with arrows. We
used flowcharts in analyzing, documenting or managing a process or program in various fields.
Fig. 28 Flow Chart
Fig. 4.8: Flow Chart of Data Measuring
SUN LIGHT
IRRADIATION
SENSOR
TEMPERATUR
E SENSOR SOLAR PANEL
OUTPUT
(DISPLAY)
I-V 400w
Page 52
Page | 38
©Daffodil International University
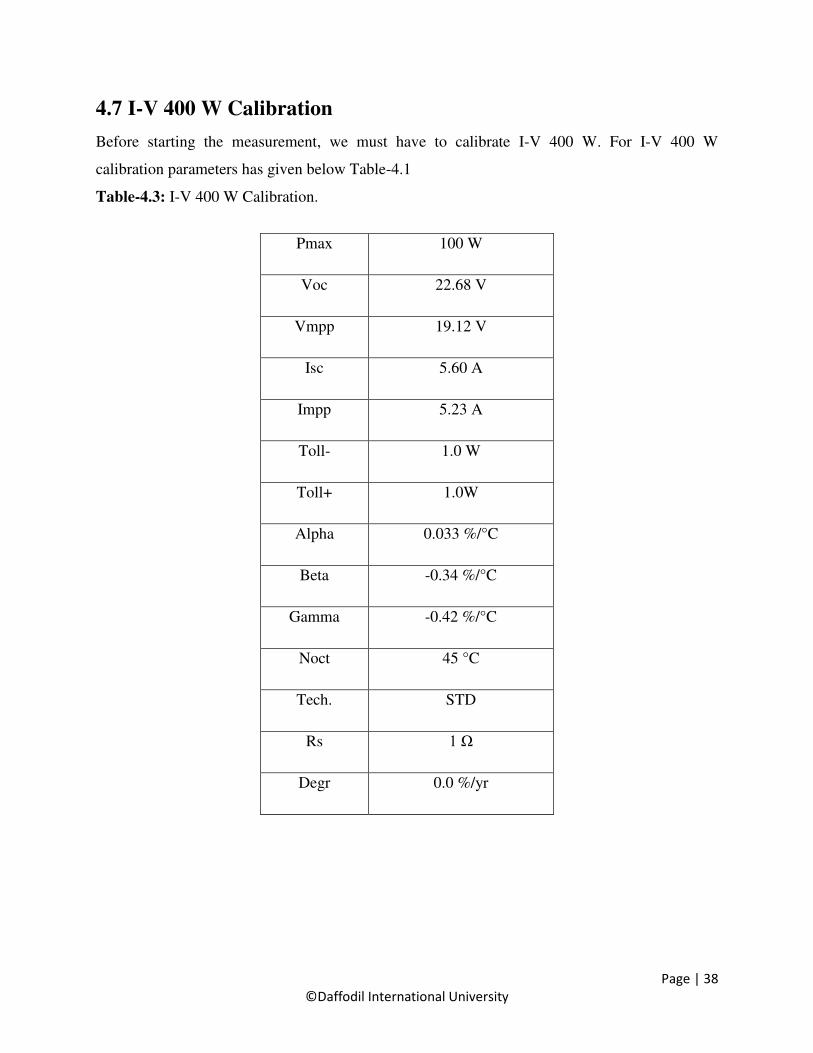
4.7 I-V 400 W Calibration
Before starting the measurement, we must have to calibrate I-V 400 W. For I-V 400 W
calibration parameters has given below Table-4.1
Table-4.3: I-V 400 W Calibration.
Pmax 100 W
Voc 22.68 V
Vmpp 19.12 V
Isc 5.60 A
Impp 5.23 A
Toll- 1.0 W
Toll+ 1.0W
Alpha 0.033 %/°C
Beta -0.34 %/°C
Gamma -0.42 %/°C
Noct 45 °C
Tech. STD
Rs 1 Ω
Degr 0.0 %/yr
Page 53
Page | 39
©Daffodil International University
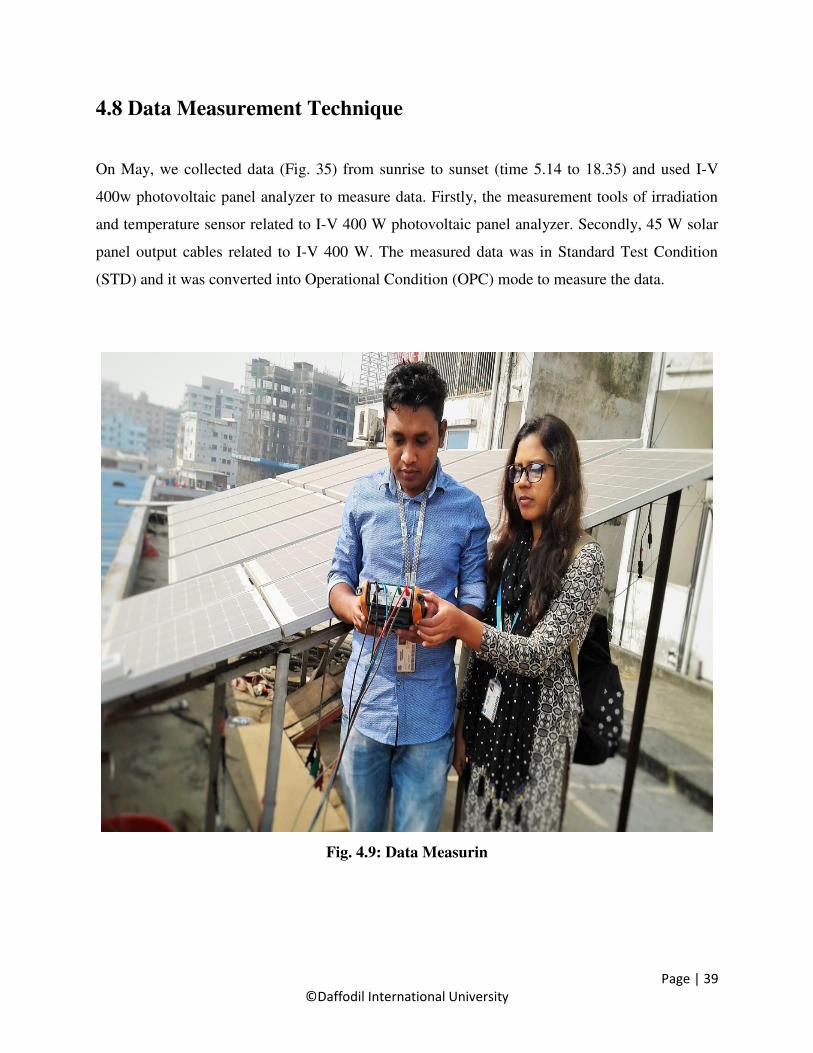
4.8 Data Measurement Technique
On May, we collected data (Fig. 35) from sunrise to sunset (time 5.14 to 18.35) and used I-V
400w photovoltaic panel analyzer to measure data. Firstly, the measurement tools of irradiation
and temperature sensor related to I-V 400 W photovoltaic panel analyzer. Secondly, 45 W solar
panel output cables related to I-V 400 W. The measured data was in Standard Test Condition
(STD) and it was converted into Operational Condition (OPC) mode to measure the data.
Fig. 4.9: Data Measurin
Page 54
Page | 40
©Daffodil International University
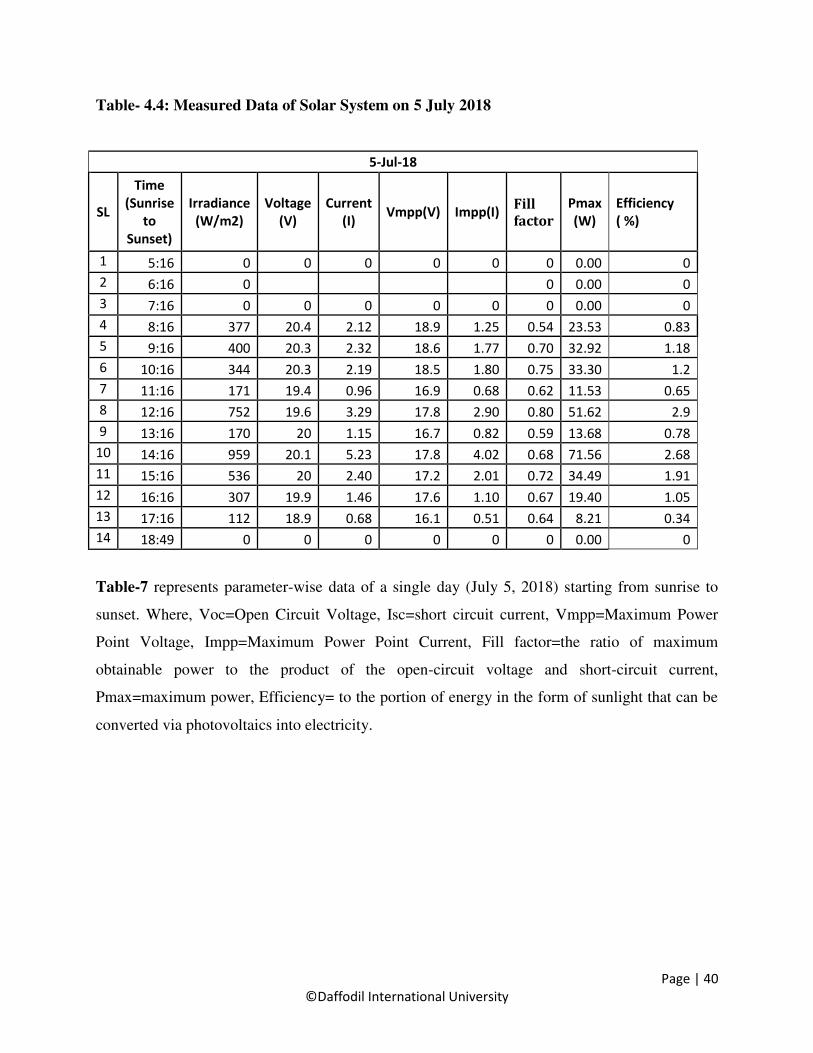
Table- 4.4: Measured Data of Solar System on 5 July 2018
5-Jul-18
SL
Time
(Sunrise
to
Sunset)
Irradiance
(W/m2)
Voltage
(V)
Current
(I) Vmpp(V) Impp(I)
Fill
factor
Pmax
(W)
Efficiency
( %)
1 5:16 0 0 0 0 0 0 0.00 0
2 6:16 0 0 0.00 0
3 7:16 0 0 0 0 0 0 0.00 0
4 8:16 377 20.4 2.12 18.9 1.25 0.54 23.53 0.83
5 9:16 400 20.3 2.32 18.6 1.77 0.70 32.92 1.18
6 10:16 344 20.3 2.19 18.5 1.80 0.75 33.30 1.2
7 11:16 171 19.4 0.96 16.9 0.68 0.62 11.53 0.65
8 12:16 752 19.6 3.29 17.8 2.90 0.80 51.62 2.9
9 13:16 170 20 1.15 16.7 0.82 0.59 13.68 0.78
10 14:16 959 20.1 5.23 17.8 4.02 0.68 71.56 2.68
11 15:16 536 20 2.40 17.2 2.01 0.72 34.49 1.91
12 16:16 307 19.9 1.46 17.6 1.10 0.67 19.40 1.05
13 17:16 112 18.9 0.68 16.1 0.51 0.64 8.21 0.34
14 18:49 0 0 0 0 0 0 0.00 0
Table-7 represents parameter-wise data of a single day (July 5, 2018) starting from sunrise to
sunset. Where, Voc=Open Circuit Voltage, Isc=short circuit current, Vmpp=Maximum Power
Point Voltage, Impp=Maximum Power Point Current, Fill factor=the ratio of maximum
obtainable power to the product of the open-circuit voltage and short-circuit current,
Pmax=maximum power, Efficiency= to the portion of energy in the form of sunlight that can be
converted via photovoltaics into electricity.
Page 55
Page | 41
©Daffodil International University
CHAPTER 5
DATA ANALYSIS & RESULTS
5.1 Introduction
Bangladesh receives an average daily solar irradiation of 4 - 6.5 kWh/m2. The focus of this
thesis is the measurement of solar irradiation, and the corresponding power generated by this
panel.
5.2 Solar Data Analysis
In our solar lab, 100-Watt Solar Panel has been established in the top floor of DIU and area is
0.75 m2. The focus of this thesis is the measurement of solar irradiation, and the corresponding
power generated by this panel. There are some parameters such as irradiance, Equivalent power,
Pmax. Equivalent power is the multiplication between irradiance and panel area. Furthermore,
Equivalent power is the input power of total solar panel (100W) & Pmax is the output generated
power (Table-8). We have measured the data by I-V 400W Photovoltaic Panel analyzer
(Operational Condition). The time duration of this experiment was 2 months (July and august
2018).
We can classification July and August between sunny and rainy day. This classification helps to
find out clear analysis between irradiance and power.
We have measured our required data (Table-8) from sunrise to sunset (time 5.23 to 18.27). In
time (514.) irradiance was zero and for the reason, we got maximum power zero. On the other
hand, time (6.14) irradiance was 70 W/m2 and maximum power generated 4.68 W. Because we
have got sunlight between time 5.14 and 6.14 that helps to produce irradiance. We collect our
data every one-hour.
The equation of power, P = V×I & efficiency, η= (Output/Input)× 100 %
Page 56
Page | 42
©Daffodil International University
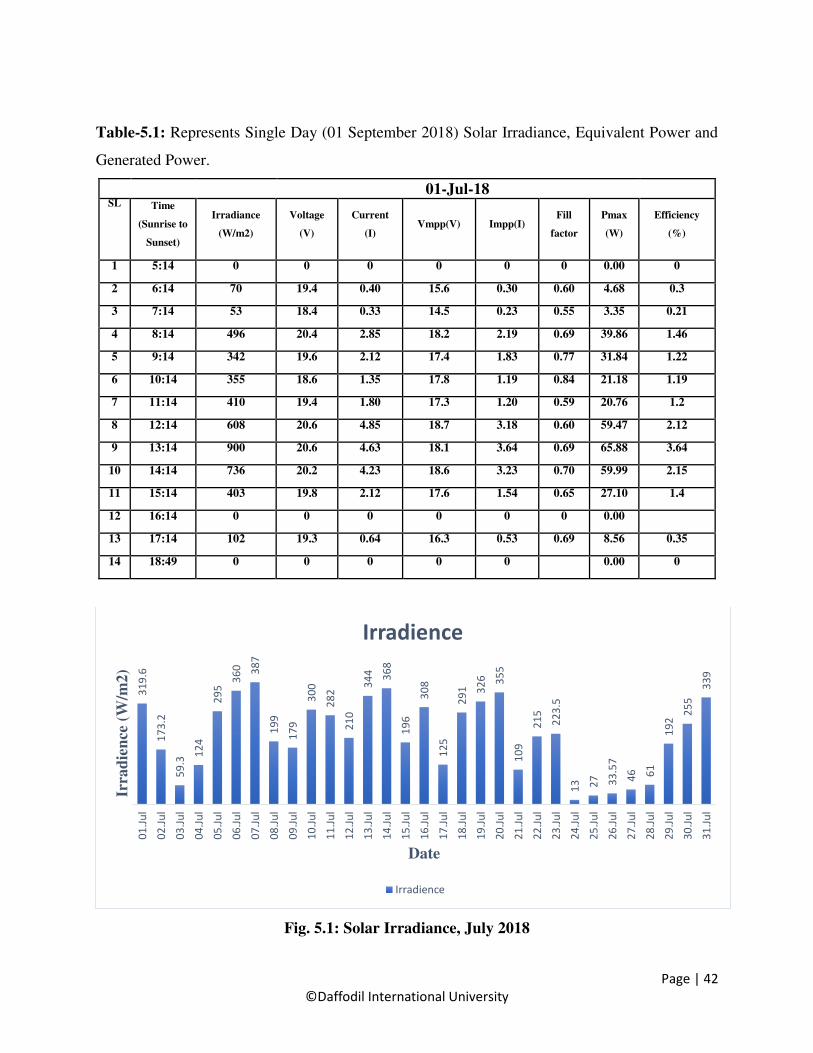
Table-5.1: Represents Single Day (01 September 2018) Solar Irradiance, Equivalent Power and
Generated Power.
01-Jul-18 SL Time
(Sunrise to
Sunset)
Irradiance
(W/m2)
Voltage
(V)
Current
(I) Vmpp(V) Impp(I)
Fill
factor
Pmax
(W)
Efficiency
(%)
1 5:14 0 0 0 0 0 0 0.00 0
2 6:14 70 19.4 0.40 15.6 0.30 0.60 4.68 0.3
3 7:14 53 18.4 0.33 14.5 0.23 0.55 3.35 0.21
4 8:14 496 20.4 2.85 18.2 2.19 0.69 39.86 1.46
5 9:14 342 19.6 2.12 17.4 1.83 0.77 31.84 1.22
6 10:14 355 18.6 1.35 17.8 1.19 0.84 21.18 1.19
7 11:14 410 19.4 1.80 17.3 1.20 0.59 20.76 1.2
8 12:14 608 20.6 4.85 18.7 3.18 0.60 59.47 2.12
9 13:14 900 20.6 4.63 18.1 3.64 0.69 65.88 3.64
10 14:14 736 20.2 4.23 18.6 3.23 0.70 59.99 2.15
11 15:14 403 19.8 2.12 17.6 1.54 0.65 27.10 1.4
12 16:14 0 0 0 0 0 0 0.00
13 17:14 102 19.3 0.64 16.3 0.53 0.69 8.56 0.35
14 18:49 0 0 0 0 0
0.00 0
Fig. 5.1: Solar Irradiance, July 2018
31
9.6
17
3.2
59
.3 12
4
29
5 3
60
38
7
19
9
17
9
30
0
28
2
21
0
34
4
36
8
19
6
30
8
12
5
29
1
32
6
35
5
10
9
21
5
22
3.5
13
27
33
.57
46
61
19
2 2
55
33
9
01
.Ju
l
02
.Ju
l
03
.Ju
l
04
.Ju
l
05
.Ju
l
06
.Ju
l
07
.Ju
l
08
.Ju
l
09
.Ju
l
10
.Ju
l
11
.Ju
l
12
.Ju
l
13
.Ju
l
14
.Ju
l
15
.Ju
l
16
.Ju
l
17
.Ju
l
18
.Ju
l
19
.Ju
l
20
.Ju
l
21
.Ju
l
22
.Ju
l
23
.Ju
l
24
.Ju
l
25
.Ju
l
26
.Ju
l
27
.Ju
l
28
.Ju
l
29
.Ju
l
30
.Ju
l
31
.Ju
l
Irra
die
nce
(W
/m2)
Date
Irradience
Irradience
Page 57
Page | 43
©Daffodil International University
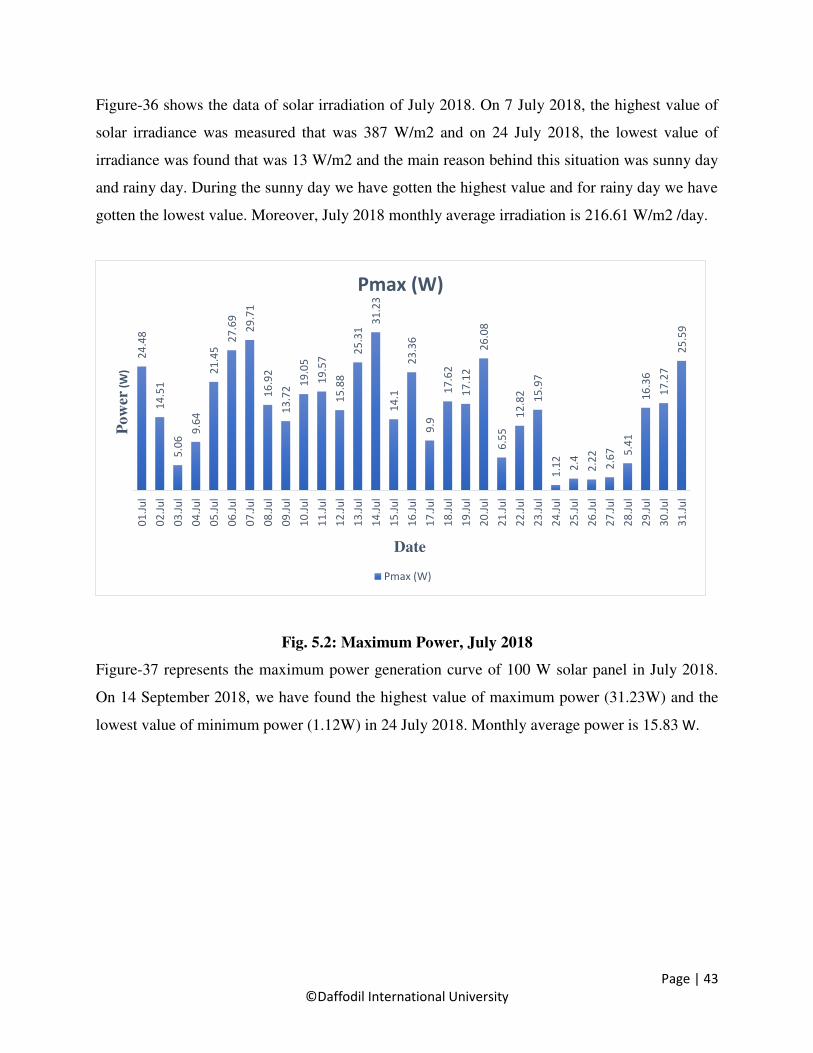
Figure-36 shows the data of solar irradiation of July 2018. On 7 July 2018, the highest value of
solar irradiance was measured that was 387 W/m2 and on 24 July 2018, the lowest value of
irradiance was found that was 13 W/m2 and the main reason behind this situation was sunny day
and rainy day. During the sunny day we have gotten the highest value and for rainy day we have
gotten the lowest value. Moreover, July 2018 monthly average irradiation is 216.61 W/m2 /day.
Fig. 5.2: Maximum Power, July 2018
Figure-37 represents the maximum power generation curve of 100 W solar panel in July 2018.
On 14 September 2018, we have found the highest value of maximum power (31.23W) and the
lowest value of minimum power (1.12W) in 24 July 2018. Monthly average power is 15.83 W.
24
.48
14
.51
5.0
6 9
.64
21
.45
27
.69
29
.71
16
.92
13
.72
19
.05
19
.57
15
.88
25
.31
31
.23
14
.1
23
.36
9.9
17
.62
17
.12
26
.08
6.5
5
12
.82
15
.97
1.1
2
2.4
2.2
2
2.6
7
5.4
1
16
.36
17
.27
25
.59
01
.Ju
l
02
.Ju
l
03
.Ju
l
04
.Ju
l
05
.Ju
l
06
.Ju
l
07
.Ju
l
08
.Ju
l
09
.Ju
l
10
.Ju
l
11
.Ju
l
12
.Ju
l
13
.Ju
l
14
.Ju
l
15
.Ju
l
16
.Ju
l
17
.Ju
l
18
.Ju
l
19
.Ju
l
20
.Ju
l
21
.Ju
l
22
.Ju
l
23
.Ju
l
24
.Ju
l
25
.Ju
l
26
.Ju
l
27
.Ju
l
28
.Ju
l
29
.Ju
l
30
.Ju
l
31
.Ju
l
Pow
er (
W)
Date
Pmax (W)
Pmax (W)
Page 58
Page | 44
©Daffodil International University
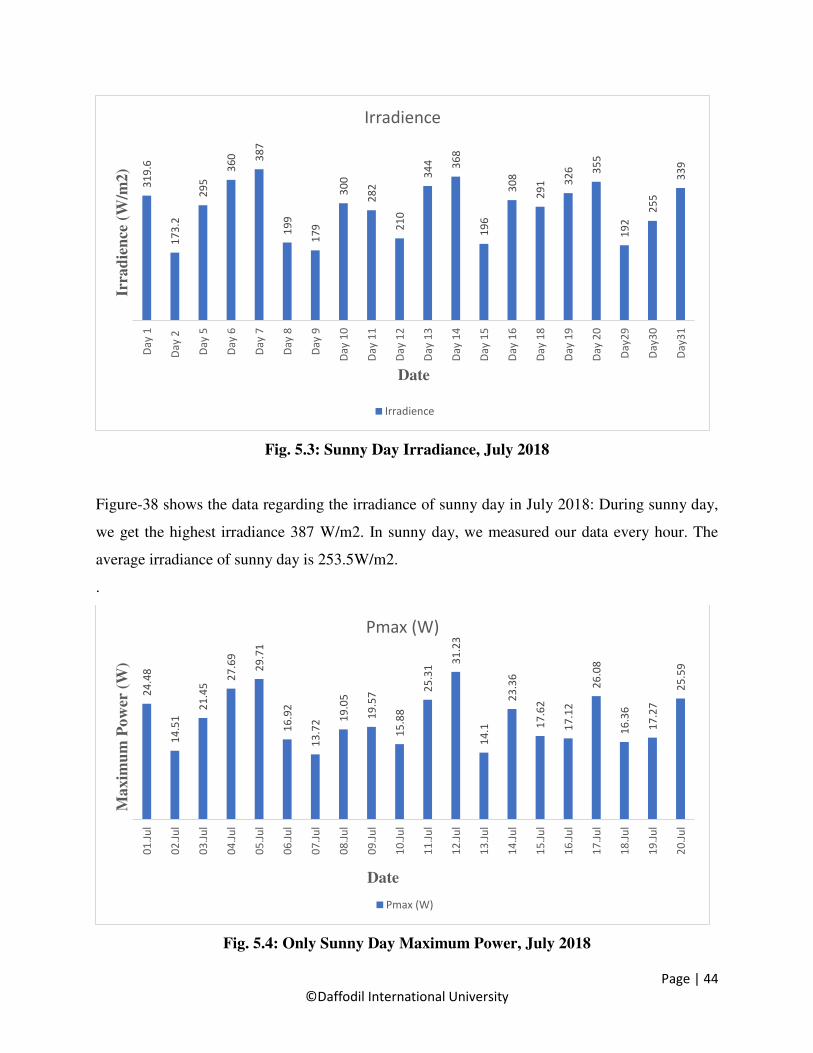
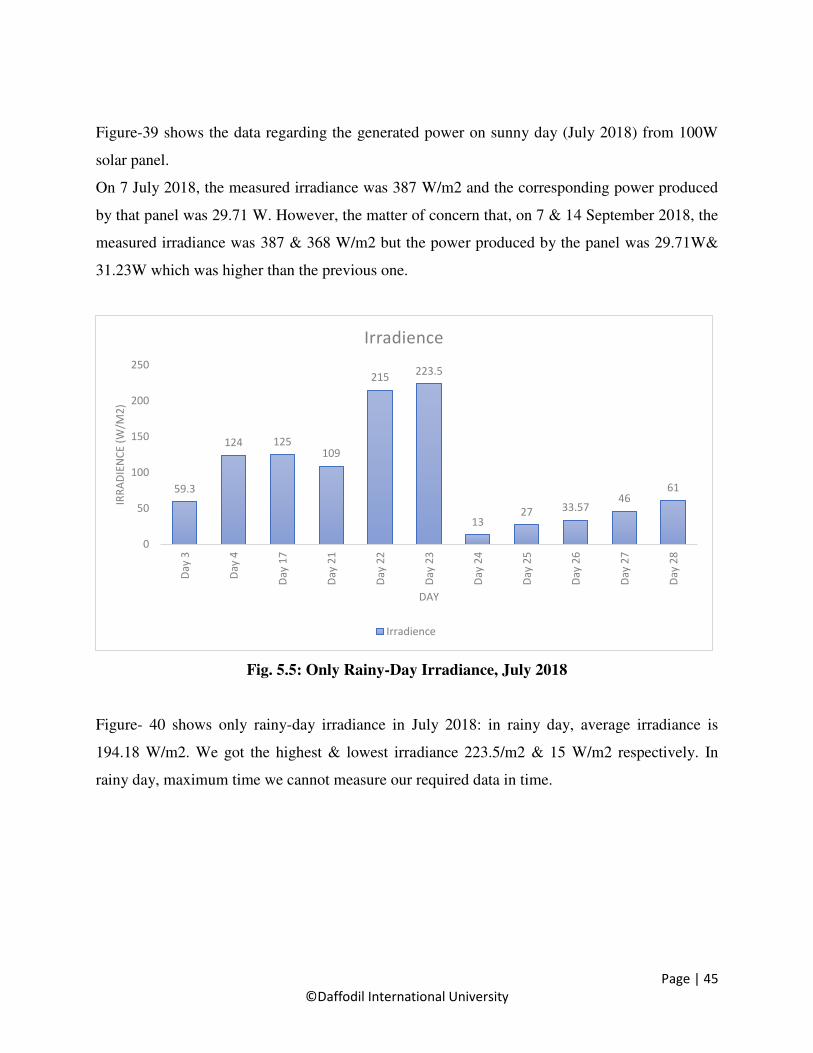
Fig. 5.3: Sunny Day Irradiance, July 2018
Figure-38 shows the data regarding the irradiance of sunny day in July 2018: During sunny day,
we get the highest irradiance 387 W/m2. In sunny day, we measured our data every hour. The
average irradiance of sunny day is 253.5W/m2.
.
Fig. 5.4: Only Sunny Day Maximum Power, July 2018
31
9.6
17
3.2
29
5
36
0
38
7
19
9
17
9
30
0
28
2
21
0
34
4
36
8
19
6
30
8
29
1 32
6
35
5
19
2
25
5
33
9
Da
y 1
Da
y 2
Da
y 5
Da
y 6
Da
y 7
Da
y 8
Da
y 9
Da
y 1
0
Da
y 1
1
Da
y 1
2
Da
y 1
3
Da
y 1
4
Da
y 1
5
Da
y 1
6
Da
y 1
8
Da
y 1
9
Da
y 2
0
Da
y2
9
Da
y3
0
Da
y3
1
Irra
die
nce
(W
/m2)
Date
Irradience
Irradience
24
.48
14
.51
21
.45
27
.69
29
.71
16
.92
13
.72
19
.05
19
.57
15
.88
25
.31
31
.23
14
.1
23
.36
17
.62
17
.12
26
.08
16
.36
17
.27
25
.59
01
.Ju
l
02
.Ju
l
03
.Ju
l
04
.Ju
l
05
.Ju
l
06
.Ju
l
07
.Ju
l
08
.Ju
l
09
.Ju
l
10
.Ju
l
11
.Ju
l
12
.Ju
l
13
.Ju
l
14
.Ju
l
15
.Ju
l
16
.Ju
l
17
.Ju
l
18
.Ju
l
19
.Ju
l
20
.Ju
l
Max
imu
m P
ow
er (
W)
Date
Pmax (W)
Pmax (W)
Page 59
Page | 45
©Daffodil International University
Figure-39 shows the data regarding the generated power on sunny day (July 2018) from 100W
solar panel.
On 7 July 2018, the measured irradiance was 387 W/m2 and the corresponding power produced
by that panel was 29.71 W. However, the matter of concern that, on 7 & 14 September 2018, the
measured irradiance was 387 & 368 W/m2 but the power produced by the panel was 29.71W&
31.23W which was higher than the previous one.
Fig. 5.5: Only Rainy-Day Irradiance, July 2018
Figure- 40 shows only rainy-day irradiance in July 2018: in rainy day, average irradiance is
194.18 W/m2. We got the highest & lowest irradiance 223.5/m2 & 15 W/m2 respectively. In
rainy day, maximum time we cannot measure our required data in time.
59.3
124 125 109
215 223.5
13 27 33.57
46 61
0
50
100
150
200
250
Da
y 3
Da
y 4
Da
y 1
7
Da
y 2
1
Da
y 2
2
Da
y 2
3
Da
y 2
4
Da
y 2
5
Da
y 2
6
Da
y 2
7
Da
y 2
8
IRR
AD
IEN
CE
(W
/M2
)
DAY
Irradience
Irradience
Page 60
Page | 46
©Daffodil International University
Fig. 5.6: Only Rainy-Day Maximum Power, July 2018
Figure- 41 shows. On 23 July 2018, we have found the highest value of maximum power (15.97W)
and the lowest value of minimum power (1.12W) in 24 July 2018.
Fig. 5.7: Solar Irradiance, August 2018
5.06
9.64 9.9
6.55
12.82
15.97
1.12 2.4 2.22 2.67
5.41
day 3 day 4 day 17 day 21 day 22 day 23 day 24 day 25 day 26 day 27 day 28
Maxim
um
Pow
er (
W)
Date
Maximum Power
Maximum Power
20
7
82
.5
17
0
55
10
0
27
6
12
6
31
2
21
3
39
2
34
2
15
1
32
1
39
3
36
9.5
34
5.5
22
8
28
9.5
23
6
17
5
17
6
15
4
15
2
21
2
11
3
28
8.5
32
3.5
23
9.8
20
7
27
0
01
.Au
g
02
.Au
g
03
.Au
g
04
.Au
g
05
.Au
g
06
.Au
g
07
.Au
g
08
.Au
g
09
.Au
g
10
.Au
g
11
.Au
g
12
.Au
g
13
.Au
g
14
.Au
g
15
.Au
g
16
.Au
g
17
.Au
g
18
.Au
g
19
.Au
g
20
.Au
g
21
.Au
g
22
.Au
g
23
.Au
g
24
.Au
g
25
.Au
g
26
.Au
g
27
.Au
g
28
.Au
g
29
.Au
g
30
.Au
g
Irr
ad
ien
ce (
W/m
2)
Date
Irradience
Irradience
Page 61
Page | 47
©Daffodil International University
Figure-42 shows the data of solar irradiation of August 2018. On 14 August 2018, the highest
value of solar irradiance was measured that was 393 W/m2 and on 4 August 2018, the lowest
value of irradiance was found that was 55 W/m2 and the main reason behind this situation was
sunny day and rainy day. During the sunny day we have gotten the highest value and for rainy
day we have got the lowest value. Moreover, August 2018 monthly average irradiation is 230.66
W/m2 per day or 18.21 kWh/m2/day.
Fig. 5.8: Maximum Power, August 2018
Figure- 43 represents the maximum power generation curve of 100 W solar panel in August
2018. On 15August 2018, we have found the highest value of maximum power (30.3 W) and the
lowest value of minimum power (4.377 W) in 4 August 2018. Moreover, October 2018 monthly
average generated power is 18.215 W.
13
.82
7.1
1
13
.74
4.3
77
8.1
72
22
.97
10
.25
25
.54
18
.07
28
.26
5
28
.16
8
10
25
.6 3
0.2
30
.3
24
16
.5
23
.8
20
.3
13
.22
15
.9
12
.9
13
18
.3
10
20
.3 2
4.5
19
.1
15
.2
22
.87
Da
y 1
Da
y 2
Da
y 3
Da
y 4
Da
y 5
Da
y 6
Da
y 7
Da
y 8
Da
y 9
Da
y 1
0
Da
y 1
1
Da
y 1
2
Da
y 1
3
Da
y 1
4
Da
y 1
5
Da
y 1
6
Da
y 1
7
Da
y 1
8
Da
y 1
9
Da
y 2
0
Da
y 2
1
Da
y 2
2
Da
y 2
3
Da
y 2
4
Da
y 2
5
Da
y 2
6
Da
y 2
7
Da
y 2
8
Da
y 2
9
Da
y 3
0
Maxim
um
Pow
er (
W)
Day
Pmax (W)
Pmax (W)
Page 62
Page | 48
©Daffodil International University
Fig. 5.9: Only Sunny Day Irradiance, August 2018
Figure-5.9 shows the data regarding the solar irradiance of sunny day in August 2018, the average
irradiance in sunny day is 244.9W/m2. In sunny day, we measured our data every hour.
20
7
10
0
27
6
12
6
31
2
21
3
39
2
34
2
15
1
32
1
39
3
36
9.5
34
5.5
22
8
28
9.5
23
6
17
5
17
6
15
4
15
2
21
2
11
3
28
8.5
32
3.5
23
9.8
20
7
27
0
0
50
100
150
200
250
300
350
400
450
Da
y 1
Da
y 5
Da
y 6
Da
y 7
Da
y 8
Da
y 9
Da
y 1
0
Da
y 1
1
Da
y 1
2
Da
y 1
3
Da
y 1
4
Da
y 1
5
Da
y 1
6
Da
y 1
7
Da
y 1
8
Da
y 1
9
Da
y 2
0
Da
y 2
1
Da
y 2
2
Da
y 2
3
Da
y 2
4
Da
y 2
5
Da
y 2
6
Da
y 2
7
Da
y 2
8
Da
y 2
9
Da
y 3
0
Irr
ad
ien
ce (
W/m
2)
DAY
Irradience
Irradience
Page 63
Page | 49
©Daffodil International University
5.3 Comparison of solar radiation data among different Years
Table 5.2: Data of Monthly Average Solar Irradiance in 2008,2009 & 2010.
Month
Solar
Irradiance(W/m2)
(2008)
Solar
Irradiance(W/m2)
(2009)
Solar
Irradiance(W/m2)
(2010)
January 164.9 165.6 151.5
February 209.8 219.1 186.7
March 225.7 228.3 238.2
April 283.3 273.1 236.7
May 261.1 235.1 225.8
June 212.4 210.3 176
July 176.2 197 201.6
August 174.1 177.5 166.3
September 189.6 166.8 165.5
October 179.7 189.1 175.2
November 208.1 164 168
December 123.7 142.5 159.2
Annual average
Irradiance(W/m2)
209.05 197.36 187.55
Annual Average
(kWh/m2/day)
5.01 4.73 4.50
In the year 2008, annual average solar irradiation was 5.01 kWh/m2/day and the value of
irradiation in 2009 was decreased and that was 4.73 kWh/m2/day. There was also a declining
trend in solar irradiation value in between 2009 and 2010 because in 2010, only 4.50
kWh/m2/day irradiation was measured as shown in table 5.2.
Page 64
Page | 50
©Daffodil International University
Table 5.3: Collected Solar Irradiance Data of Bangladesh from 1985-2006 were Presented Below.
Solar radiation data were collected from Renewable Energy Research Center (Dhaka University),
National Renewable Energy Laboratory and Development and Research is given in Table-5.3.
Most of these solar radiation data were collected from DU for Dhaka with different cities in
Bangladesh. In the year 1985-1991, annual average solar radiation was 4.59 kWh/m2/day and it
was increased into 4.64 kWh/m2/day in 1987-89. But in 2000-03, annual average radiation was
4.52 kWh/m2/day which was decreased into 4.2 kWh/m2/ day in 2003-05. In 2006, radiation was
increasing, and the value was 4.45 kWh/m2/day.
Month NREL
(1985-91)
RERC
(1987-89
RERC
(1992)
DLR
(2000-
2003)
RERC
(2003-
2005)
RERC
(2006)
January 4.18 4.29 3.34 4.58 3.16 3.4
February 4.68 4.86 4.05 4.81 4.46 3.79
March 5.55 5.53 5.24 5.31 4.88 5.04
April 5.65 5.23 6.02 5.84 5.28 5.06
May 5.58 5.67 5.76 5.21 5.46 5.09
June 4.48 5.13 5.39 3.85 4.22 4.8
July 3.9 3.87 4.2 3.76 4.48 3.84
August 4.12 3.92 4.87 4.11 4.12 4.73
September 3.96 4.5 5.38 3.76 3.78 5.15
October 4.7 4.61 4.93 4.19 3.57 3.18
November 4.25 4.22 3.72 4.47 3.92 3.35
December 4.06 3.89 3.39 4.34 3.19 2.84
Annual
Average
(kWh/m2-
day)
4.59 4.64 4.69 4.52 4.21 4.45
Page 65
Page | 51
©Daffodil International University
Table 5.4: Collected Data from 1985-2005, 2008-2010, 2018 and Compare Irradiance
Among them were Presented Below
Year Month Irradiance
kWh/m2/day
1985-1991 July 3.96
August 4.7
1987-89 July 4.5
August 4.61
1992 July 5.38
August 4.93
2000-2003 July 3.76
August 4.19
2003-2005 July 3.78
August 3.57
2008 July 4.55
August 4.31
2009 July 4.00
August 4.53
2010 July 3.97
August 4.20
2018 July 8.91
August 7.62
Table 5.4 after analyzing we can say that in the month of September, we got the highest amount
of Irradiance than October. In the year 1985-1991, September & October average solar
irradiation was 3.96 & 4.7 kWh/m2/day and it was increased into 5.38 & 4.93 kWh/m2/day in
1992. But in 2000-03, September & October average irradiation was 3.76 & 4.19 kWh/m2/day
which was decreased into 3.78 & 3.57 kWh/m2/ day in 2003-05. In 2008, irradiation was
increasing, and the value was 4.55 & 4.31 kWh/m2/day. Again in 2010, irradiation was
Page 66
Page | 52
©Daffodil International University
decreasing, and the value of 3.97 & 4.2 kWh/m2/day. Moreover, in 2018, irradiation was
increasing, and the value of 8.91 & 7.62 kWh/m2/day.
Figure 5.10: Irradiance on different years
Furthermore, in 2018, Irradiance is highest than another year, for that reason, we can certainly
say that global warming is increasing day by day.
4.55 4 3.97
8.91
2008 2009 2010 2018
Irra
dia
nce
(k
Wh
/m2/d
ay)
Year
Irradiance
Irradiance
Page 67
Page | 53
©Daffodil International University
CHAPTER 6
CONCLUSIONS
6.1 Conclusion
For utilizing the solar power more effectively, it is very important to measure the irradiation of
that country time to time because the sun radiation is changed over time. In this thesis, our main
aim was to find out the irradiation of sun in Dhaka city in the month of September and October
so that the power production by the solar panel can be estimated and by using this data we can
easily understand the electricity production by SHS and create a standard form of power
production of SHS in 2018. Here we find that the average irradiation of May 255.44 W/m2 and
June was 236.24 W/m2. And corresponding power produced by 60W solar panel was 7.29 W and
7.11 W respectively.
The summary of this paper exhibits that, there is a considerable opportunity to meet the future
power demand of Bangladesh by SHS technology. Bangladesh is situated between 20.30 - 26.38
degrees north latitude and 88.04 - 92.44 degrees east latitude which is a good location for solar
energy utilization. Daily average solar irradiation varies between 4 to 6.5 kWh per square meter.
Most extreme measure of radiation is accessible in the long stretch of April-May and least in
December-January.
Solar energy sources discussed above can help Bangladesh to produce more power to reduce
Load-shedding problem. Time has come to look forward and work with these renewable energy
fields to generate electricity rather than depending wholly on conventional method. Already SHS
established in our country. Now-a-days the momentum, dynamics and sustainability of a
civilization depend on energy. Hence, a country can be considered as civilized one if it has
enough access to energy as required for the industrial, agricultural and economic growth. There
are lots of sectors to use solar electricity in rural area of Bangladesh
Page 68
Page | 54
©Daffodil International University
6.2 Future scope
In this research, we try to clarify that how much power can be produced in the month of May &
June 2018 from a solar system. We have worked only for two months but in future we can
measure power and irradiation throughout the year along with the analysis of panel efficiency.
Innovation in solar technology continues to improve efficiency, size and cost, making it more
pervasive throughout society. The trend is leaning toward incorporating solar into more buildings
beyond panels placed upon the roof. Cool applications include: solar shingles, solar film, solar
roadways, and solar windows.
Other innovations being explored are: the solar orb, solar cars (commercially available), solar
balloons, nanowires, and working with the infrared spectrum. As the manager of the Green
Mountain Energy Sun Club, I’m excited about these advances in solar technology and the
growing part this pollution-free resource will provide in our lives. A solar future is closer than
you may think!
Page 69
Page | 55
©Daffodil International University
REFERENCES
[1]http://citeseerx.ist.psu.edu/viewdoc/download;jsessionid=8A305DC0E2D69CCAEAACE562
C3A0ADB0?doi=10.1.1.685.1465&rep=rep1&type on 12 August 2018.
[2] Bahauddin KM, Salahuddin TM. Prospect and trend of renewable energy and its technology
towards climate change mitigation and sustainable development in Bangladesh. Int J Adv Renew
Energy Res 2012; 1:158.
[3] Biswas WK. Empowering rural poor through renewable energy technologies in Bangladesh,
(unpublished Ph.D. thesis). NSW, Sydney, Australia: University of Technology; 2002.
[4] Islam MR, Baksi BK, Momotaz SN. Prospects of renewable energy in Bangladesh focus on
biomass plant. J Bus Res 2002; 4:1–18.
[5]https://www.dhakatribune.com/bangladesh/power-energy/2017/08/31/first-ever-solar-plant-
connects-national-grid/ on 15 August 2018.
[6]https://www.dhakatribune.com/bangladesh/power-energy/2017/10/27/beximco-set-200mw-
solar-power-plant-gaibandha-chinese-company/ on 17 August 2018.
[7] http://www.bpdb.gov.bd/bpdb/index.php?option=com_content&view=article&id=26 on 17
August 2018.
[8]http://www.daily-sun.com/arcprint/details/239333/PDB-in-deal-with-China-firm-for-solar-
power-plant-at-Kaptai/ on 17 August 2018.
[9] https://cleantechnica.com/2018/02/27/scatec-solar-plans-800-megawatt-solar-project-
bangladesh/ on 21 August 2018.
[10] Rasel MAI, Siraj S, Rahman KM. Prospect of renewable energy as the solution of the
existing energy crisis of Bangladesh. Int J Sci Eng Res 2012; 3:3–5.
[11] https://www.thedailystar.net/frontpage/bangladesh-leads-clean-energy-use-1418806.On 21
August 2018.
[12] http://www.worldometers.info/world-population/bangladesh-population/ on 7 November
2018.
[13] https://en.wikipedia.org/wiki/World_energy_consumption on 7 November 2018.
[14] Source: http://www.sreda.gov.bd on 21 August 2018.
Page 70
Page | 56
©Daffodil International University
[15]http://www.iea.org/publications/freepublications/publication/CO2EmissionsFromFuelComb
ustion2017Overview.pdf on 22 August 2018.
[16]http://www.powerdivision.gov.bd/user/brec/50/91 on 22 August 2018.
[17] Duan, C., Wang, C., Li, Z., Chen, J., Wang, S., Snyder, A., & Jiang, C. (2018, June). A
Solar Power-Assisted Battery Balancing System for Electric Vehicles. IEEE Transactions on
Transportation Electrification, 4(2), pp. 432-443. doi:10.1109/TTE.2018.2817123.
[18] Commerell, W., Müller, R., & Shan uganandam, V. (2014). Life time costs in solar home
systems. 2014 3rd International Conference on the Developments in Renewable Energy
Technology (ICDRET), pp. 1-5. Doi: https://doi.org/10.1109/ICDRET.2014.6861700. 60
[19] Islam, T., & Awal, M. A. (2014). Efficient load and charging method for solar powered
home lighting system of Bangladesh. 2014 3rd International Conference on the Developments in
Renewable Energy Technology (ICDRET), Dhaka, Bangladesh, pp.1-3. doi:
https://doi.org/10.1109/ICDRET.2014.6861666.
[20] Deb, A., Bhuiyan, M. A., & Nasir, A. (2013, Jan. - Feb.). Prospects of Solar Energy in
Bangladesh. IOSR Journal of Electrical and Electronics Engineering (IOSR-JEEE), 4(5), PP 46-
57.Retrievedfrom http://www.iosrjournals.org/iosr-jeee/Papers/Vol4-issue5/H0454657.pdf. On
23 August 2018.
[21] Biswas, W. K., Diesendorf, M., & Bryce, P. (2004, July). Can photovoltaic technologies
help attain sustainable rural development in Bangladesh? Energy Policy, 32(10), pp. 1199-1207.
Retrieved from https://www.sciencedirect.com/science/article/pii/S0301421503000831.
[22] Rebane, K. L., & Barham, B. L. (2011, June). Knowledge and adoption of solar home
systems in rural Nicaragua. Energy Policy, 39(6), pp. 3064–3075. doi:
https://doi.org/10.1016/j.enpol.2011.02.005.
[23] GOLDEMBERG, J. (2000): Rural Energy in Developing Countries. In: GOLDEMBERG, J.
(Ed.): World Energy Assessment: Energy and the Challenge of Sustainability. New York: 367-
389.
[24] BARKAT, A. (2004): Bangladesh Rural Electrification Program: A Success Story of
Poverty Reduction through Electricity. Dhaka.
[25] Government of Bangladesh (GOB) (2004): The Constitution of the People’s Republic of
Bangladesh. Internet: http://www.pmo.gov.bd/constitution/index.htm (02.03.2007).
Page 71
Page | 57
©Daffodil International University
[26] BARNES, D.F. (Ed., 2005): Meeting the Challenge of Rural Electrification in the
Developing World: The Experience from Successful Programs. Washington, D.C.
[27] MIYAN, M. and John RICHARDS (2004): Energy Policy for Bangladesh.
[28] ISLAM, K. (2004): The “Road Map to Renewable” for Bangladesh. Bangladesh Renewable
Energy Newsletter. Enlarged Issue. Vol. 4 (1&2); Vol. 5 (1&2). 3-30.
[29] ISLAM, K. (2005): Photovoltaic (PV) Market Potential in Bangladesh. Constraints, Future
Potential Diversification. In: EUSUF, M. (Ed.): Solar Photovoltaic Systems in Bangladesh.
Experiences and Opportunities. Dhaka. 75-84. 61