FINAL REPORT AnchoragePortModernizationProgramTestPileProgramReportofFindingsPrepared for MunicipalityofAnchorage/PortofAnchorage1980AnchoragePortRoadAnchorage,Alaska99501October17,2016CH2MEngineers,Inc.Anchorage,Alaska
Transcript
F I N A L R E P O R T
Anchorage Port Modernization Program Test Pile Program Report of Findings
Prepared for
Municipality of Anchorage/Port of Anchorage
1980 Anchorage Port Road Anchorage, Alaska 99501
October 17, 2016
CH2M Engineers, Inc. Anchorage, Alaska
This page intentionally left blank.
CN‐RPT‐001‐FINALRPTOFFINDINGS.DOCX I
Executive Summary Introduction and Project Purpose
The Port of Anchorage (POA) is identifying and updating plans for modernizing its facilities through the Anchorage Port Modernization Program (APMP). An initial step in the APMP was implementation of a Test Pile Program (TPP), which involved a geotechnical investigation and the installation of 10 48‐inch indicator pipe piles (IPs) in the area of future APMP development. This Report of Findings summarizes information from these TPP investigations and provides recommendations for future APMP permitting, design, and construction.
The project replicated the concept pile design and marine permit conditions. The geotechnical investigation provided detailed soil characterization in the near‐shore marine soils. Pile installation validated the concept pile design assumptions by collecting information on design capacity, pile drivability, and other variables in proximity to the planned APMP wharf structures; collecting data on noise levels produced during pile installation in the waters of Knik Arm; and testing noise attenuation systems (NASs) to reduce in‐water noise levels.
Project Scope
Geotechnical investigation involved the drilling, sampling, and analysis of data from five boreholes and monitoring of pore‐water pressures within the soil at two of the borehole locations.
Pile installation included four general pile locations, three hammer types, and two NASs. After penetration due to self‐weight, a vibratory hammer was used for the first 50 feet (15.2 meters) of installation for each pile. Once a pile was advanced with the vibratory hammer, it was driven with either a hydraulic or diesel impact hammer to the pile termination depth. Two different NASs, designed to reduce water‐borne noise levels caused by pile installation, were employed. Two piles were installed with no attenuation to establish baseline water‐borne noise levels.
Two attenuation systems were tested, a confined air bubble curtain and a resonator system. The confined air bubble curtain NAS was used on four piles. The air bubble curtain NAS consisted of a telescoping, steel pipe surrounding the pile through which compressed air was pumped. The passive Helmholtz resonator NAS (AdBm Technologies, 2014) was used on four other piles. This system used thousands of inverted cylinders placed in a metal framework surrounding the pile from the sea floor to the water surface.
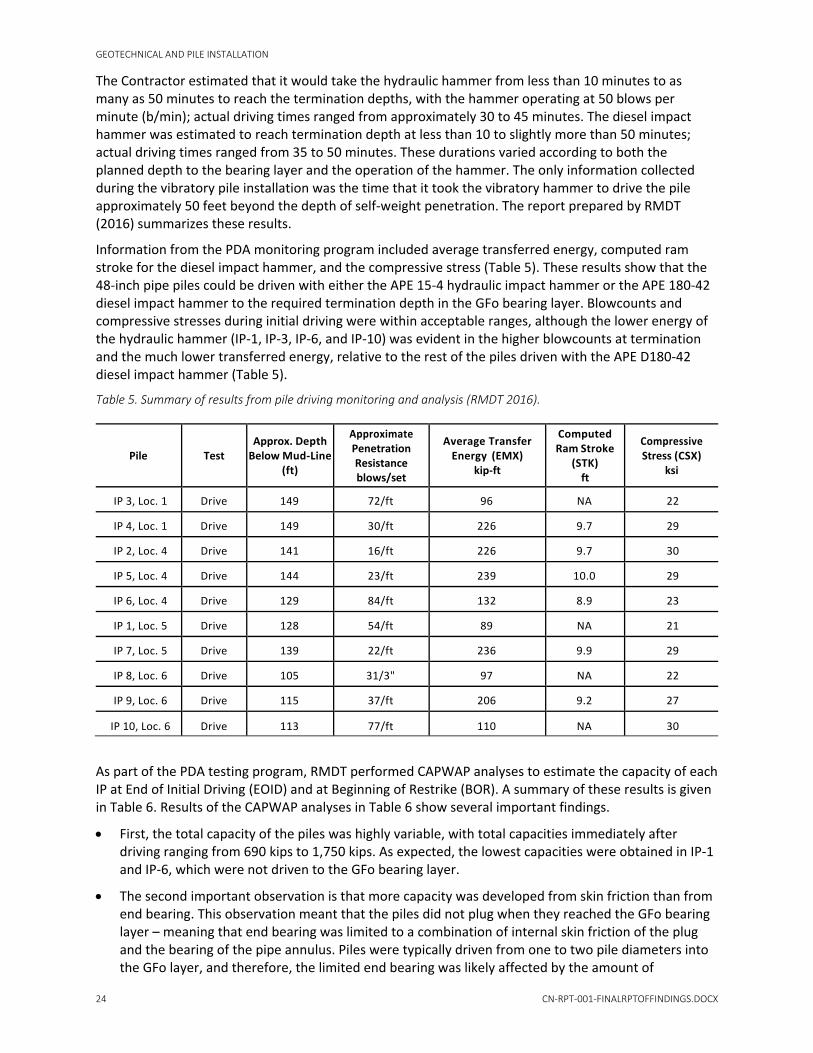
A PDA testing program was employed on all piles. Dynamic measurements were collected on each pile during initial driving and restrike using strain sensors and accelerometers attached to the piles approximately 15 to 18 feet below the pile top. Ram stroke, average transferred energy, compressive stress, and impact hammer blow counts were computed.
A marine mammal monitoring program was implemented in accordance with the project’s permits and authorizations. The sizes of the marine mammal monitoring zones were established during the authorization process with the National Marine Fisheries Service (NMFS). The established monitoring zones varied by type of installation (vibratory or impact pile hammer), type of marine mammal (pinniped, beluga whale, or other cetacean) and whether a pile was installed with a NAS.
Authorized Level B take for Cook Inlet beluga whales was 26 individuals. Authorized take numbers for other species were 8 killer whales, 31 harbor porpoises, 6 Steller sea lions, and 62 harbor seals. No Level A take was requested.
Hydroacoustic monitoring data collection and analysis for the TPP were compliant with NMFS’ 2012 guidance. Autonomous sound recorders were deployed at nominal distances of 10 meters (m) and 1 kilometer (km) from each pile during installation, and a mobile hydrophone system drifted during
II CN‐RPT‐001‐FINALRPTOFFINDINGS.DOCX
measurements to target data collection at ranges corresponding to marine mammal disturbance thresholds. Ambient sound recordings were measured at two locations during a 3‐day break in pile installation activities.
Goals of the hydroacoustic monitoring program included quantifying underwater sound pressure levels (SPLs) during ambient conditions and during vibratory and impact hammer pile installation. Sound transmission loss (TL) was characterized, and distances to marine mammal disturbance thresholds were verified. The effectiveness of the two NASs was assessed by determining the degree to which each reduced noise levels near the source and at 1‐km, and by comparing distances to the marine mammal disturbance thresholds. The relative sound levels for each hammer type were also compared.
Key Findings and Recommendations
Constructability
During all components of the TPP, it was critical that ship berths remained available for port calls and that the Contractor worked around POA operations without interference. The TPP was successfully accomplished without impact to POA operations and no delay claims were submitted for the work.
On two occasions during the TPP, pile installation was delayed until high tide. Deeper water elevated the barge and template to a higher location on the pile, so that the pile could be released with adequate stability in a vertical position with the vibratory hammer attached. A longer template or shore‐based construction would mitigate this issue during production pile installation for future APMP phases.
Installation of production piles for the APMP will likely require a larger template than that used in the TPP. The production template will likely need to be designed such that it registers multiple piles in a bent for the trestle piles. Another template configuration for dolphin piles will also need to be developed. The templates will have to be solidly fixed to provide the accuracy needed for production piles. Installation and extraction of temporary template support piles may be required for each template itself when it is moved to a new location.
Similar to the TPP, NASs for the APMP will be attached to the template and will need to accommodate variable water depths and tide stages. Production operations may benefit from a larger NAS that encompasses a group of piles, to avoid setting up the system for each individual pile. Effectiveness and feasibility of such a NAS is unknown and warrants further investigation.
Geotechnical
The geotechnical program for the TPP involved (1) conducting a series of geotechnical explorations to evaluate soil conditions at each test pile location and (2) monitoring response of each test pile during initial installation and 13 to 38 days after initial pile installation. The second set of measurements was made to quantify increases in pile capacity with time. Results of the test pile monitoring program demonstrated that pile capacities required by the APMP terminals can generally be met with the planned 48‐inch steel pipe piles, subject to loads and design methodologies selected by the Designer of Record (DOR) for final design. Additional key findings from the exploration and test pile monitoring programs are summarized below.
Geotechnical Exploration completed by Golder Associates, Inc. (Golder) successfully defined geotechnical information for the TPP. The benefits of the exploration program included the following:
o Provided geotechnical information necessary for the Contractor to select appropriate pile hammer sizes and plan logistics for installation. Information included occurrence of interlayers comprised of sands and gravels. This information allowed the Contractor to develop a soil model for computer simulations of pile drivability.
CN‐RPT‐001‐FINALRPTOFFINDINGS.DOCX III
o Obtained information about effects of tide height changes on hydrostatic conditions below the mudline. The hydrostatic pressure change information showed a decreasing effect with depth, as well as lag times. This information will be of interest when interpreting results of the TPP.
o Confirmed existence of artesian conditions in some sand layers and helped resolve the location of the pile bearing layer, referred to as the Older Glaciofluvial (GFo) soil unit. These results also further refined the model of subsurface geology between the new Petroleum Cement Terminal (PCT) and Terminal 2. This information was used to refine soil analyses conducted during preliminary design, and will provide the DOR with improved information needed for final design.
o Increased soil properties database (e.g., strength and compressibility) with results of the laboratory testing program conducted on samples recovered from the TPP explorations. These laboratory results filled in missing information about strength conditions. The information will benefit the DOR when interpreting results of the TPP and during final design and construction planning for production work.
o Provided information that can be used by the DOR to interpret TPP results relative to final design, including extrapolation of TPP information for different pile sizes.
Test Pile Monitoring component of the TPP, conducted by Robert Miner Dynamic Testing of Alaska, Inc. (RMDT), met the original objectives of the program by providing the following conclusions regarding pile installation, capacity, and setup:
o Confirmed the size of hammer required for production work. The APE 15‐4 hydraulic impact hammer was too small; the APE D180‐42 diesel impact hammer was sufficient for initial installation and restriking of the test piles. This information will help the contractor for production pile installation to optimize hammer selection.
o Established the range of side friction and end bearing values that must be considered for final design. These results show that average capacities from the TPP are generally consistent with capacities developed previously during conceptual design.
o Identified increase in pile capacity from pile setup. These results show significant setup (average setup factor of nearly 2.5) within the Upper Glaciolacustrine Silt and Clay (SC) layer, also referred to as the Bootlegger Cove Formation (BCF) clay. This information is critical for interpreting production pile driving.
o Confirmed that the required axial pile capacities could be developed by driving into the GFo bearing layer, as long as pile setup was considered. While most of the measured capacity of each test pile resulted from side friction, extra end bearing when driving into the GFo layer was sufficient to meet preliminary design needs with greater confidence. These results suggest that stopping above the GFO layer may be possible, but this decision will depend on the loads and design strategy followed by the DOR.
o Determined that the internal bearing plate at approximately 80 feet from the toe of the pile did not contribute to additional end bearing in the BCF clay. Installation results also demonstrated that cutting shoes were not needed for successful pile installation. This information will help the DOR and installation contractor refine installation plans.
o Obtained pile drivability and PDA capacity data that can be used to further optimize production pile hammer selection and pile capacity evaluation carried out during final design by the DOR. When combined with the geotechnical information identified above, the DOR will be able to extrapolate TPP results to other hammer and pile sizes.
IV CN‐RPT‐001‐FINALRPTOFFINDINGS.DOCX
o Justified using higher resistance factors (i.e., from 0.45 to 0.65 – equivalent to reducing the factor of safety on capacity from 2.2 to 1.5) for preliminary design. This change supported the preliminary design approach that has piles embedded 1 to 2 pile diameters into the GFo layer.
Marine Mammal Monitoring
Monitoring for marine mammals was conducted from three locations, the southern and northern ends of POA property and from a single mobile observer (rover) stationed on the shore near pile installation. Four Marine Mammal Observers (MMOs) worked concurrently in rotating shifts from two of the stations to provide full coverage of monitoring zones. The design and locations of the observation stations met the TPP’s needs. The number and locations of observation stations for the APMP will depend on the sizes of the monitoring zones and the locations of in‐water work, which may be concentrated in a single location. This would reduce the need for more than a single observation station. A mobile platform could be re‐located as needed to maximize visibility of the monitoring zones and reduce the number of MMOs. A solo MMO is not recommended. All project‐associated events should be witnessed and reported on by more than one observer.
Communication among the MMOs, the hydroacoustic monitoring vessel, and the Contractor was achieved satisfactorily using hand‐held radios and cell phones.
The hydroacoustic monitoring crew was directed to call the construction supervisor immediately if a marine mammal was observed during hydroacoustic monitoring, but no marine mammals were sighted this way.
A total of 44 marine mammal sightings were documented during the TPP: 10 beluga whales, 6 Steller sea lions, and 28 harbor seals. There were nine Level B takes, including one beluga whale, one Steller sea lion, and seven harbor seals. All takes were within the allowable limits permitted in the Incidental Harassment Authorization (IHA).
A single shut‐down was recommended by the MMOs and implemented by the Contractor due to poor weather conditions and reduced visibility. No shut‐downs due to the presence of marine mammals were recommended during the TPP.
Numbers of beluga whales were low in May, and beluga whales were not observed in June. This is consistent with other years of marine mammal observations during POA construction activities. Harbor seals numbers increased during the TPP and were present in low but consistent numbers in June. Their movements were concentrated around the mouth of Ship Creek. Timing of APMP in‐water construction seasons should take marine mammal presence in the Knik Arm area into consideration.
Hydroacoustic Monitoring
Overall, the highest median Sound Pressure Level (SPL) was attributed to the hydraulic impact hammer at the 10‐meter range. The diesel impact hammer had the next highest median SPL, and the vibratory hammer generated the lowest median SPL at the 10‐meter range.
Median ambient noise levels, measured at two locations just offshore of pile Location 5 near the POA South Floating Dock and about 1‐km offshore, were 117.0 and 122.2 dB re 1 µPa, respectively.
Near‐source levels for unattenuated pile installation exceeded levels for all pile‐installation events with a NAS applied. On average, the air bubble curtain reduced near‐source levels more than the passive resonator; this trend was observed most strongly for the hydraulic impact hammer. The sound attenuation achieved by the passive resonator and the air bubble curtain was similar for the diesel impact hammer, and even more similar for the vibratory hammer. The passive resonator was variably effective for the diesel impact and vibratory hammers, but more consistently effective for the hydraulic impact hammer, while the bubble curtain was more effective at reducing near‐source levels of the hydraulic impact hammer than of the diesel impact hammer.
CN‐RPT‐001‐FINALRPTOFFINDINGS.DOCX V
When the bubble curtain was applied, median near‐source levels of the hydraulic impact hammer decreased by 12 dB on average, compared to an average 6 dB reduction when the passive resonator was applied. The bubble curtain decreased the diesel impact hammer near‐source levels by an average of 9 dB; the reduction was 6 dB on average when the passive resonator was applied. The bubble curtain and passive resonator both decreased the near‐source level for vibratory pile driving by nearly the same average amount, 9 and 8 dB, respectively.
TPP results indicate that a confined air bubble curtain system should be utilized for future APMP construction phases. The performance of the bubble curtain should be improved to match the documented performance of bubble curtain systems used for other pile installation projects. A possible improvement would be enlarging the annular space between the pile and the containment structure, in combination with increasing the air bubble flow rate, so that more air is contained. At this time, it is not recommended to pursue the AdBm system for future APMP construction phases based on TPP performance results.
The APMP will consider reducing vibratory pile installation as the regulated ensonified zones are significantly larger than those from impact installation. This is due to the difference in the regulatory thresholds used by NMFS for impulse versus continuous noise.
For future hydroacoustic monitoring at 1‐km distances, the APMP will consider placing hydrophones at two locations orthogonal to the pile. This would provide additional data at distances more closely representing the potential impact zones and help to identify cases of propagation abnormalities. This improvement recognizes that sound appears to propagate differently to the north compared to the west and southwest.
At the 10‐m locations, the APMP will consider using two depths (at least on occasion) to confirm that there is no significant depth dependence in noise propagation. This will verify or improve near‐source sound characterization.
Permitting
NMFS has identified reducing the threat of anthropogenic noise in Cook Inlet as one of its priority actions for promoting recovery of the endangered Cook Inlet beluga whale. As part of its MMPA authorization process, NMFS has generally authorized Level B take levels of 30 or fewer beluga whales per 12 months of a given activity in Cook Inlet. This number of beluga whale takes could be reached or exceeded during the construction phase of the APMP, placing project completion at risk. A single event, such as the approach of a pod of belugas, could result in take of multiple individuals at once. Detection of beluga whales to avoid take is particularly difficult during vibratory pile installation, when harassment zones can be very large.
In July 2016, NMFS released new technical guidance for assessing the effects of anthropogenic sound on marine mammal hearing (NMFS 2016d). It is anticipated that the isopleths for these thresholds will be greater distances from the construction activity than under the previous NMFS method. With the new guidance in place, project shutdowns could be triggered at greater distances, and hence become more common.
The APMP and the future DOR must therefore consider a combination of constraints: constructability concerns such as cost, schedule, design standards, and function; the likelihood of obtaining required permits and authorizations; and the likelihood of successfully completing project in‐water construction while remaining compliant with permit requirements.
Prior to moving forward with permitting Phase 1 of the APMP, a meeting will be scheduled with NMFS to discuss TPP results, including NAS performance, reestablishing baseline conditions (ambient noise levels, TL coefficients, and source noise levels) and application of the new NMFS technical guidance for assessing impacts of noise on marine mammals.
VI CN‐RPT‐001‐FINALRPTOFFINDINGS.DOCX
This page intentionally left blank.
CN‐RPT‐001‐FINALRPTOFFINDINGS.DOCX VII
Contents Section Page
Executive Summary .............................................................................................................................. i
Contents ............................................................................................................................................. vii
Acronyms and Abbreviations ............................................................................................................... x
1.3 Noise Attenuation Systems ................................................................................................. 8 1.3.1 Confined Air Bubble Curtain .................................................................................. 8 1.3.2 AdBm Resonance System .................................................................................... 10
1.4 Construction Issues ........................................................................................................... 11 1.4.1 Work Area ............................................................................................................ 11 1.4.2 Self‐weight Penetration ....................................................................................... 11 1.4.3 Repair Parts and Personnel and Stockpiled Materials ......................................... 11 1.4.4 Additional Coordination ....................................................................................... 12
Geotechnical and Pile Installation ..................................................................................................... 16 2.1 Methods ............................................................................................................................ 16
2.1.1 Geotechnical Exploration Program ...................................................................... 16 2.1.2 Pile Installation and Testing Program .................................................................. 18
Recommendations for Permitting ..................................................................................................... 53
Literature Cited ................................................................................................................................. 55
Tables Table 1. Vibratory hammer with performance characteristics. .................................................................... 6 Table 2. Diesel and hydraulic impact hammer specifications. ...................................................................... 7 Table 3. Noise attenuation system and hammer type used for each pile. ................................................... 8 Table 4. Borehole depth and location summary (Golder 2016). ................................................................ 16 Table 5. Summary of results from pile driving monitoring and analysis (RMDT 2016). ............................. 24 Table 6. Results of CAPWAP Analyses (RMDT 2016). ................................................................................. 25 Table 7. Summary of underwater acoustic criteria for exposure of marine mammals to noise from
continuous and pulsed sound sources. .......................................................................................... 30 Table 8. Distances to NMFS’ Level A injury and Level B harassment thresholds (isopleths) for a 48‐
inch‐diameter pile, assuming a 125‐dB background noise level and log 15 as the transmission loss value. ................................................................................................................. 30
Table 9. Marine mammal monitoring zones, Level A or shutdown zones, and Level B harassment zones authorized by NMFS for the TPP. ........................................................................................ 30
Table 10. Numbers of Level B takes for marine mammals authorized by NMFS for the TPP. ................... 31 Table 11. Ambient noise levels. .................................................................................................................. 37 Table 12. Median received RMS levels at 10 m for impact and vibratory pile driving, averaged over n
available data samples. .................................................................................................................. 37 Table 13. Reduction of the median received RMS levels at 10 m for impact and vibratory pile driving
compared to the un‐attenuated values, averaged over n available data samples. ...................... 38 Table 14. Median range to marine mammal RMS thresholds of 160 dB re 1 µPa for impact pile
driving and 125 dB re 1 µPa for vibratory pile driving, averaged over n data samples and excluding data from extrapolation of measured levels. ................................................................ 38
Table 15. Sound levels for impact driving of piles IP1 through IP10 with hammer type, NAS type, and distance. ......................................................................................................................................... 39
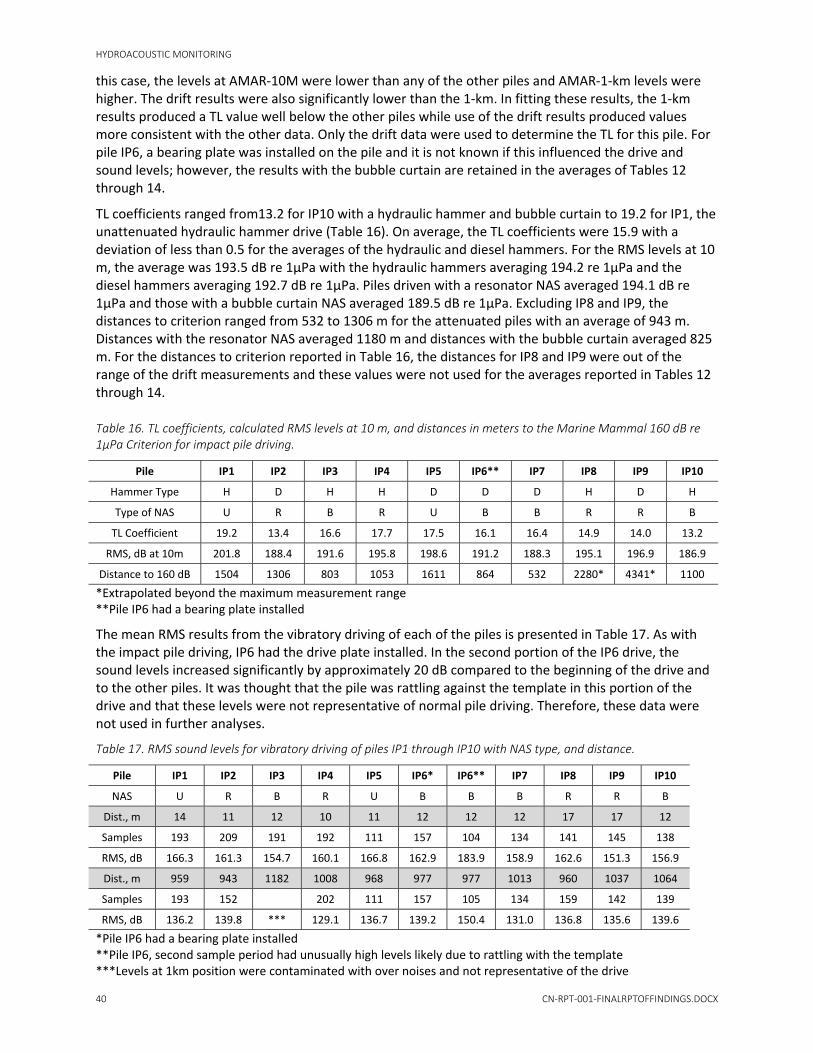
Table 16. TL coefficients, calculated RMS levels at 10 m, and distances in meters to the Marine Mammal 160 dB re 1μPa Criterion for impact pile driving. ........................................................... 40
Table 17. RMS sound levels for vibratory driving of piles IP1 through IP10 with NAS type, and distance. ......................................................................................................................................... 40
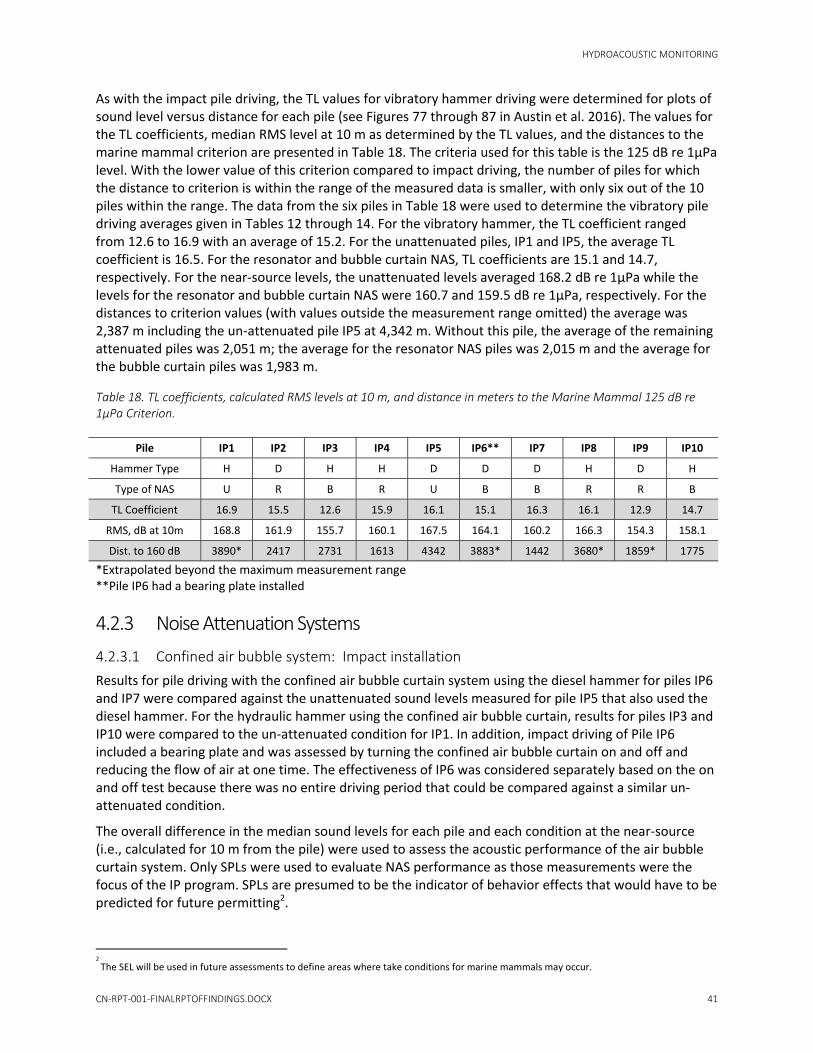
Table 18. TL coefficients, calculated RMS levels at 10 m, and distance in meters to the Marine Mammal 125 dB re 1μPa Criterion. ............................................................................................... 41
Table 19. Summary of Median Near‐Source RMS Sound Levels with Diesel Impact Hammer and Air Bubble Curtain. .............................................................................................................................. 42
Table 20. Summary of Median Near‐Source RMS Sound Levels with Hydraulic Impact Hammer and Air Bubble Curtain. ......................................................................................................................... 43
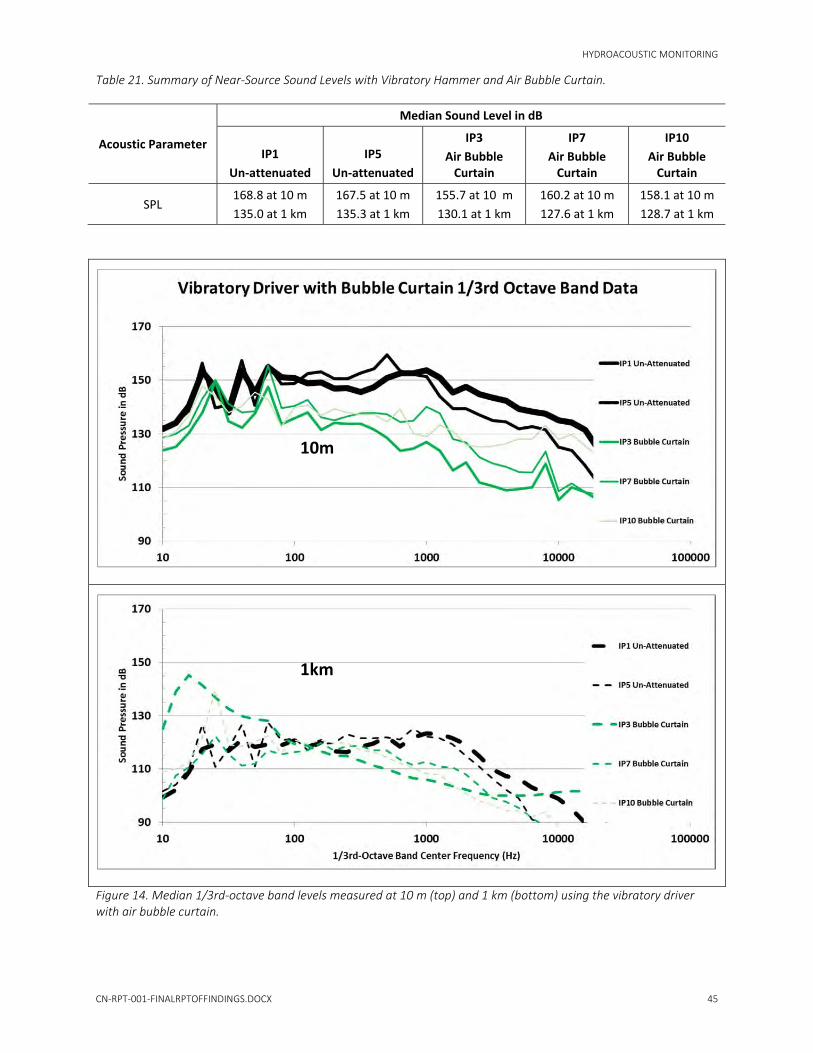
Table 21. Summary of Near‐Source Sound Levels with Vibratory Hammer and Air Bubble Curtain. ........ 45 Table 22. Summary of Near‐Source RMS Sound Levels with Diesel Impact Hammer and Resonator. ...... 47 Table 23. Summary of Near‐Source RMS Sound Levels with Hydraulic Impact Hammer and
Resonator. ...................................................................................................................................... 47 Table 24. Summary of Near‐Source RMS Sound Levels with Vibratory Hammer and Resonator. ............. 48
CN‐RPT‐001‐FINALRPTOFFINDINGS.DOCX IX
Figures
Figure 1. Final indicator pile locations (KIWC 2016). .................................................................................... 2 Figure 2. KIWC Barge‐mounted 700‐Ton Derrick Crane – DB General. ........................................................ 5 Figure 3. Confined bubble curtain system schematic. .................................................................................. 9 Figure 4. Confined air bubble curtain on (a) and off (b). .............................................................................. 9 Figure 5. Schematic of deployed AdBm Passive Resonator system (left) and Helmholtz resonators
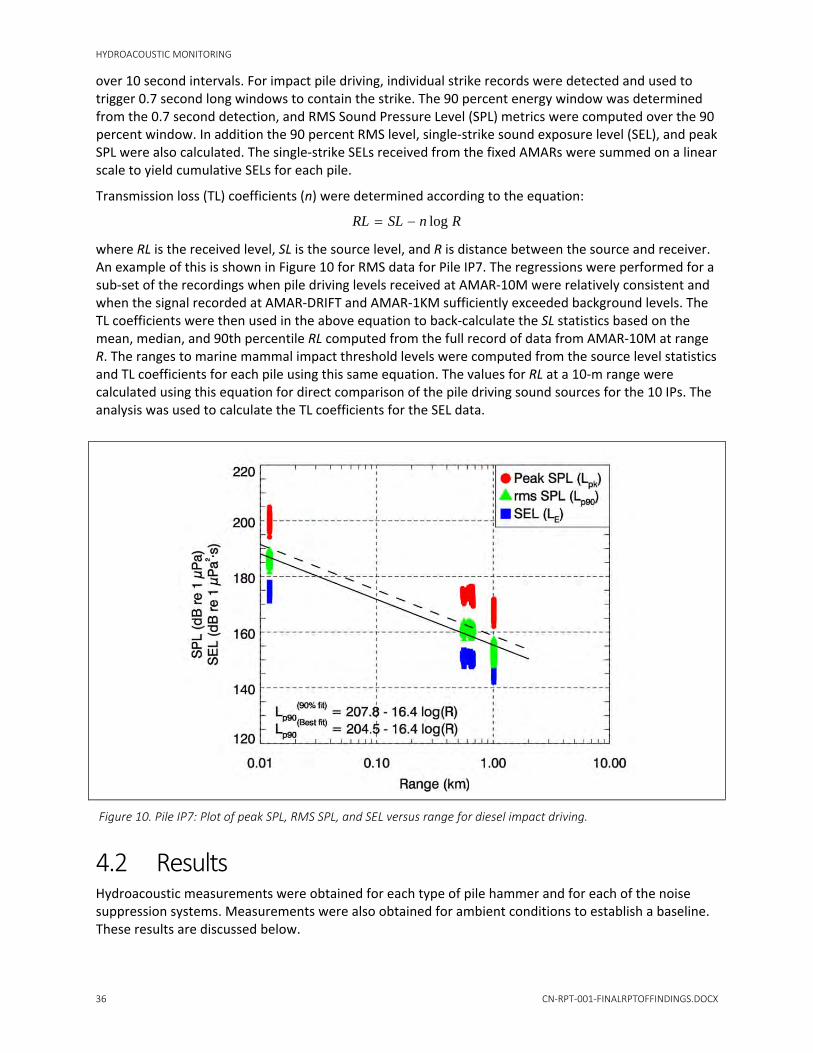
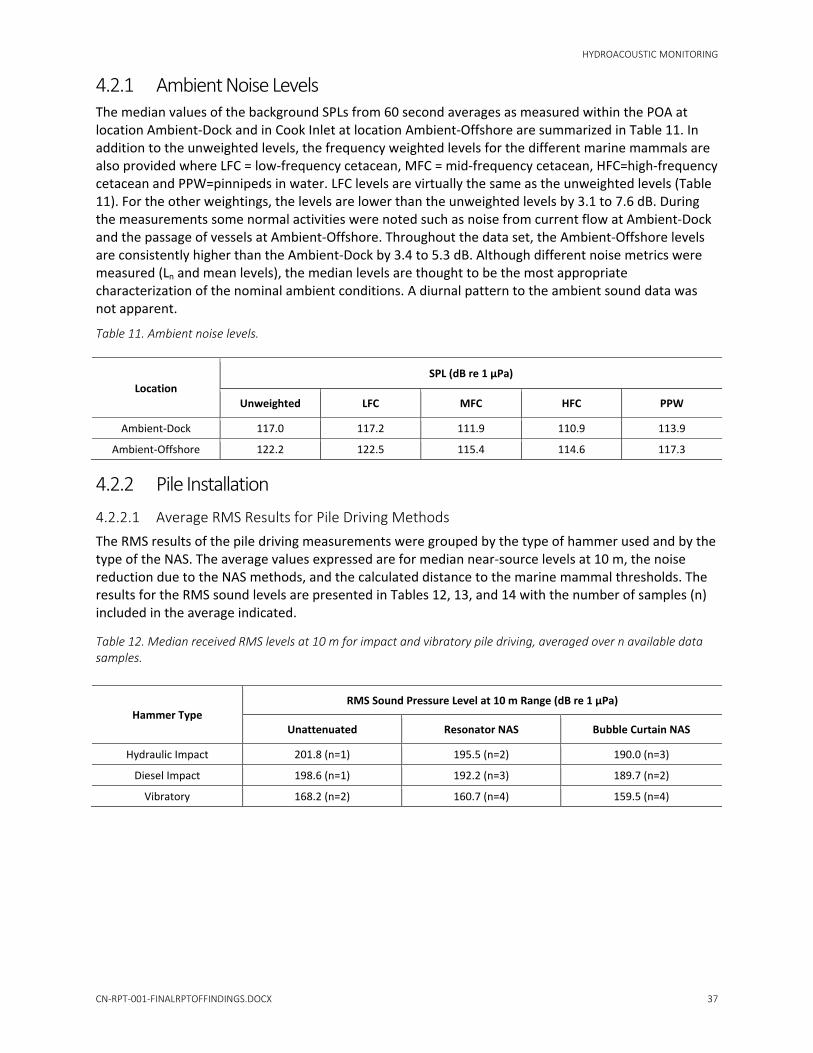
(right). The open ends of the resonators face downward when deployed. .................................. 10 Figure 6. TPP activities near existing POL 1. ............................................................................................... 13 Figure 7. Location of geotechnical explorations (Golder 2016). ................................................................. 17 Figure 8. Photographs of drill rig setup. ..................................................................................................... 18 Figure 9. Typical soil cross section of Terminal 2 wharf and access trestle. ............................................... 20 Figure 10. Pile IP7: Plot of peak SPL, RMS SPL, and SEL versus range for diesel impact driving. ............... 36 Figure 11. Median 1/3rd‐octave band levels measured at 10 m and 1 km using the diesel impact
hammer with air bubble curtain. ................................................................................................... 42 Figure 12. IP6 air bubble on and off test median 1/3rd‐octave band levels measured at 10 m and 1
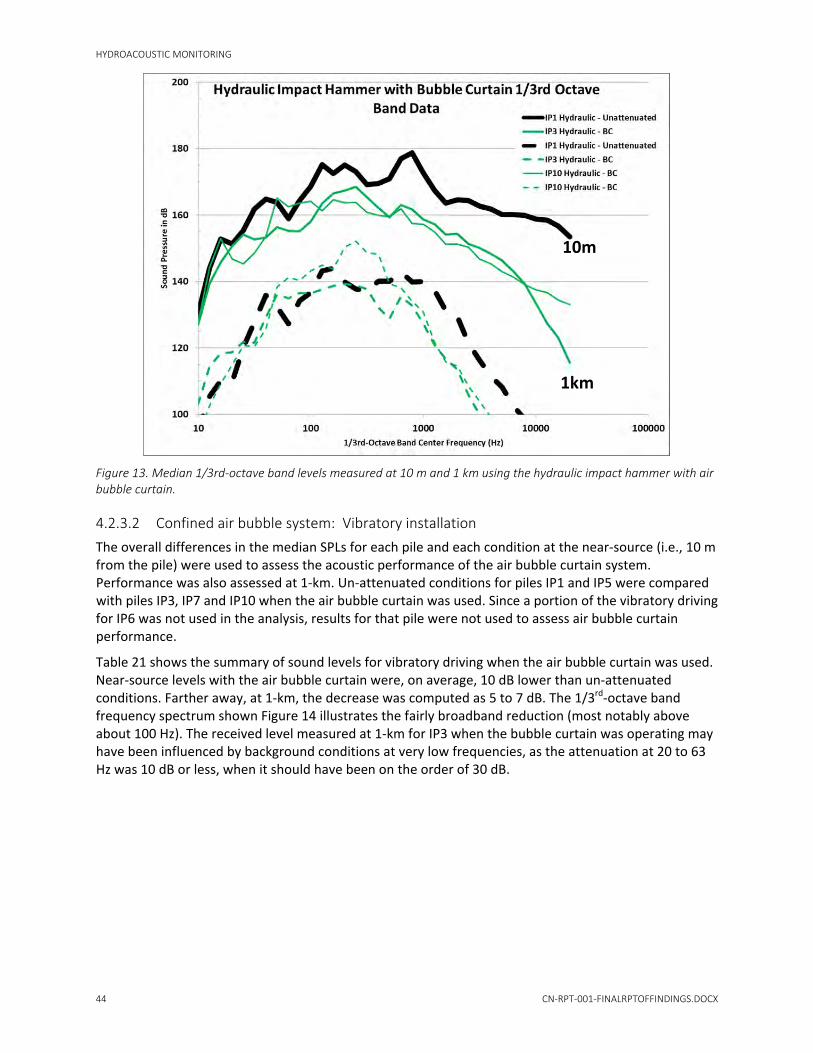
km using the diesel impact hammer. ............................................................................................. 43 Figure 13. Median 1/3rd‐octave band levels measured at 10 m and 1 km using the hydraulic impact
hammer with air bubble curtain. ................................................................................................... 44 Figure 14. Median 1/3rd‐octave band levels measured at 10 m (top) and 1 km (bottom) using the
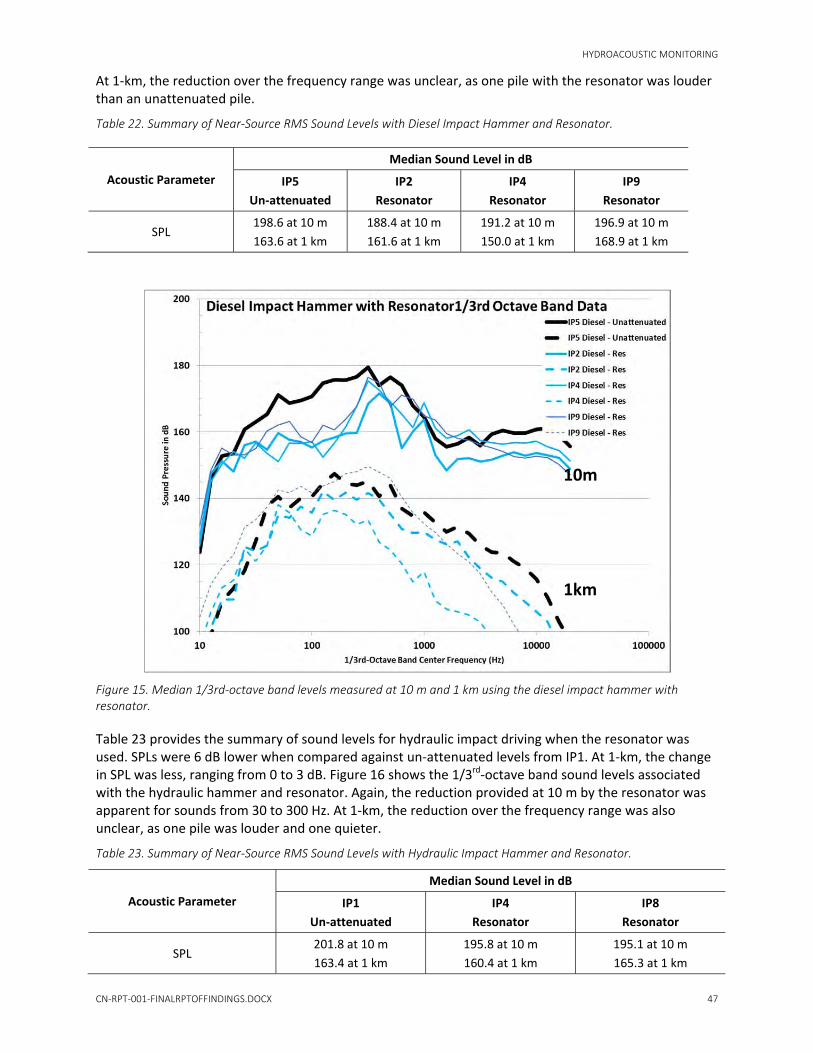
vibratory driver with air bubble curtain. ....................................................................................... 45 Figure 15. Median 1/3rd‐octave band levels measured at 10 m and 1 km using the diesel impact
hammer with resonator. ................................................................................................................ 47 Figure 16. Median 1/3rd‐octave band levels measured at 10 m and 1 km using the hydraulic impact
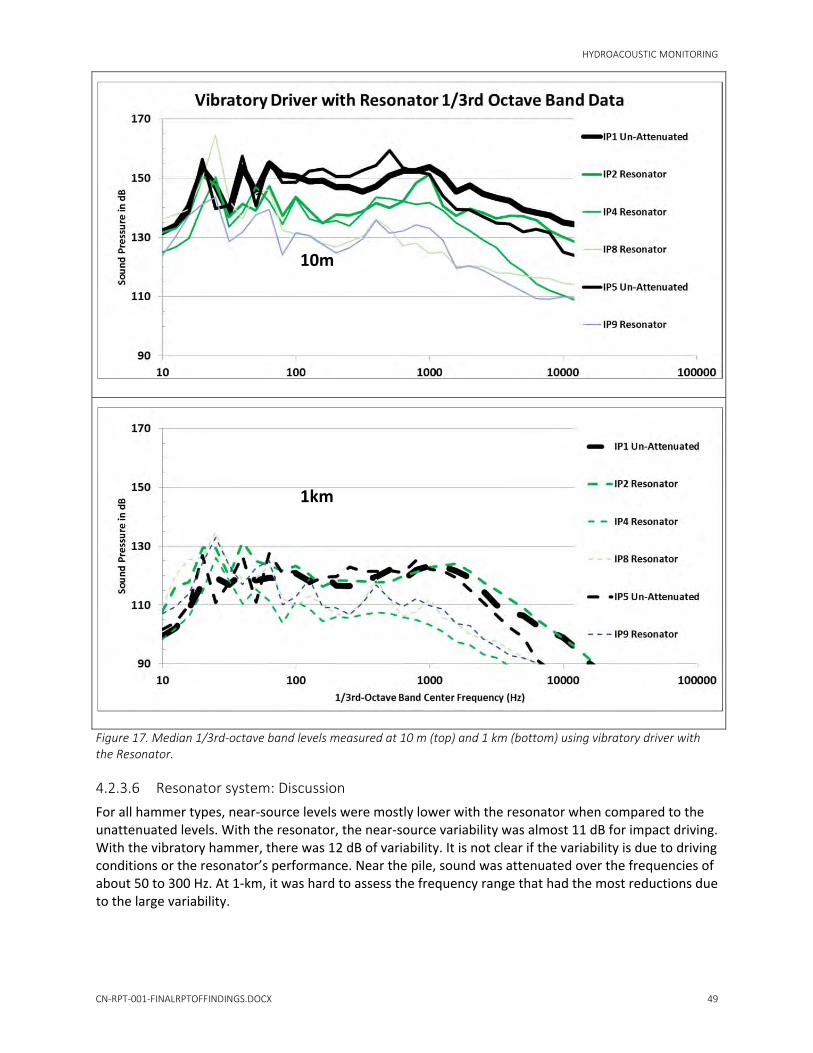
hammer with Resonator. ............................................................................................................... 48 Figure 17. Median 1/3rd‐octave band levels measured at 10 m (top) and 1 km (bottom) using
vibratory driver with the Resonator. ............................................................................................. 49
X CN‐RPT‐001‐FINALRPTOFFINDINGS.DOCX
Acronyms and Abbreviations AMAR Autonomous Multichannel Acoustic Recorders
APE American Piledriving Equipment
APMP Anchorage Port Modernization Program
BCF Bootlegger Cove Formation
BOR Beginning of Restrike
bpf blows per foot
b/min blows per minute
cfm cubic foot per minute
dB decibels
DGPS Differential Global Positioning System
DOR Designer of Record
EOID End of Initial Driving
ESA Endangered Species Act
ft‐lb foot‐pound
GFo Older Glaciofluvial
IHA Incidental Harassment Authorization
IP indicator pile
KIWC Kiewit Infrastructure West Co
km kilometer
LNM Local Notice to Mariners
m meters
MLLW mean lower low water
MMO marine mammal observer
MMPA Marine Mammal Protection Act
MOA Municipality of Anchorage
NAS noise attenuation system
NMFS National Marine Fisheries Service
PCT Petroleum Cement Terminal
PDA Pile Driving Analyzer
PIEP Port Intermodal Expansion Project
POL Petroleum, Oil, and Lubricant
RMDT Robert Miner Dynamic Testing of Alaska, Inc.
RMS root mean squared
SC Glaciolacustrine Silt and Clay
SEL sound exposure level
SELc cumulative SEL
SPT Standard Penetration Test
TL transmission loss
TPP Test Pile Program
PROJECT DESCRIPTION
CN‐RPT‐001‐FINALRPTOFFINDINGS.DOCX 1
Project Description The Port of Anchorage (POA) is identifying and updating plans for modernizing its facilities through the Anchorage Port Modernization Program (APMP). An initial step in the APMP was implementation of a Test Pile Program (TPP), which involved a geotechnical investigation and the installation of 10 indicator piles (IPs) in the area of future APMP development (Figure 1). Each IP was a 48‐inch diameter steel pipe pile with a 1‐inch wall thickness.
The purpose of the geotechnical program was to collect data that would help in the initial planning of the TPP and that could be used in the interpretation of TPP results relative to the design of future production piles.
The pile installation portion of the TPP had three related purposes:
o To inform and support the design of the APMP by using IPs to collect pile resistance information and evaluate pile drivability and other pile installation variables along the extent of the planned APMP wharf alignment.
o To obtain information on the constructability of the full APMP, particularly regarding the efficiency of impact and vibratory installation and the logistics of installing large diameter steel pipe piles in Knik Arm.
o To understand levels of underwater sound associated with pile installation and how methods for reducing sound would affect the efficiency of production pile installation.
Underwater sound is a particularly important consideration for APMP development because pile installation with vibratory and impact hammers can cause elevated noise levels under water, with the potential to disturb or injure marine mammals. Environmental restrictions required to limit underwater noise may severely affect the efficiency of pile installation, as well as the type of installation.
Installation of the 10 IPs provided the opportunity to collect empirical data on noise levels produced during pile installation operations in the waters of Knik Arm. A series of tests on impact and vibratory driven piles was performed using different pile hammer types and noise attenuation methods, and noise levels produced by the mitigated piles and control piles were recorded as part of a hydroacoustic monitoring program. Results from the hydroacoustic monitoring will be used to develop monitoring and mitigation methods to reduce impacts to marine mammals during future port modernization activities, as well as assist the DOR in making design decisions regarding appropriate lengths, diameters, and installation methods for production piles.
This Report of Findings summarizes information from the various TPP investigations to provide an overview of findings and recommendations for application during APMP permitting, design, and construction. The Report of Findings was prepared under Municipality of Anchorage (MOA) Vendor Contract 2014POA043, Task Order 4 (MOA Purchase Order 20141235). This report provides preliminary interpretations for the Designer(s) of Record to aid in efficiently constructing future APMP projects, especially in consideration of permitting constraints related to marine mammals.
PROJECT DESCRIPTION
2 CN‐RPT‐001‐FINALRPTOFFINDINGS.DOCX
Figure 1. Final indicator pile locations (KIWC 2016).
Location 1
Location 4
Location 5
Location 6
CONSTRUCTABILITY
CN‐RPT‐001‐FINALRPTOFFINDINGS.DOCX 3
Constructability The TPP involved installing 10 IPs along the existing POA terminals to depths of 150 feet or more below the mudline. This work was conducted in the spring of 2016 using a floating derrick barge that could be stabilized with two spuds. Deployment of the noise attenuation systems (NASs) also took place from the floating derrick barge. The hydroacoustic monitoring program used a combination of anchored and floating hydrophones to collect underwater sound data. Details about the construction methods used during IP installation, including a description of the NASs and recommendations for future construction, are summarized in the following subsections.
1.1 Construction Documentation As part of the TPP, the Contractor was required to produce various engineering reports and plans describing the intended work and results. This Report of Findings does not duplicate those reports; rather, it summarizes findings, emphasizing next steps and lessons learned to assist with formulation and development of future phases of the APMP.
Salient contractor reports that should be considered in advancing the future phases of the program include:
Geotechnical Work Plan ST 003 and revisions
Geotechnical Final Report ST 023 and revisions
Drivability Analysis and Piling Hammer Selection ST 028 and revisions
Confined Bubble Curtain Information ST 031 and revisions
Resonator System Information ST 032 and revisions
Indicator Piling Work Plan ST 033 and revisions
As‐built Piling Information ST 076 and revisions
Hydro‐Acoustic Monitoring Final Report, Including Supplementary Data Analysis ST 077 and revisions
Marine Mammal Observations Final Report ST 080 and revisions
Piling Dynamic Analysis Final Report ST 081 and revisions
Contractor’s Construction Summary ST 082
These reports are located in the project files and should be consulted in conjunction with the Report of Findings.
Contract information for the TPP was developed by the MOA and the Program Management Consultant. The bid document and addenda define the terms of the work conducted during the TPP. Other relevant documents for the TPP include the APMP Test Pile Work Plan (CH2M HILL 2014a) and the Marine Mammal Monitoring and Mitigation Plan (HDR 2015b).
1.2 Pile Installation The TPP took place when Knik Arm was ice‐free. Indicator piles were installed from 03 May through 07 June 2016. Eight of the 10 IPs were driven open‐ended into a dense sand and gravel bearing layer (e.g., the Older Glaciofluvial [GFo] geologic unit) located from 100 to 150 feet below the mudline. The other two piles were stopped in the Glaciolacustrine Silt and Clay (SC) formation (also referred to as the Bootlegger Cove Formation (BCF) clay unit) above the GFo bearing layer. One of these piles had an
CONSTRUCTABILITY
4 CN‐RPT‐001‐FINALRPTOFFINDINGS.DOCX
internal bearing plate located approximately 80 feet above the toe of the pile. Thirteen to 38 days following initial pile installation, each indicator pile was re‐struck with an impact hammer to obtain information about pile setup after installation. Re‐strikes took place from 08 June through 21 June 2016. All pile installation took place during daylight hours when marine mammal monitoring zones could be adequately monitored.
1.2.1 Logistics for Installation The TPP involved the use of three types of pile hammers. After penetration due to self‐weight, a vibratory hammer was used for the first 50 feet (15.2 meters [m]) of installation. Once the pile reached this depth, the pile was driven with either a hydraulic impact hammer or a diesel impact hammer to the pile termination depth. All restrikes were conducted with the diesel impact hammer.
Kiewit Infrastructure West Co. (KIWC) was the Contractor hired by the POA to carry out the TPP. All materials and equipment for the pile driving portion of the TPP were brought from Seattle on a barge. Craft labor was obtained locally in Anchorage with key personnel agreements through the local labor unions for the crane operator and the labor foreman. A laydown yard on POA property was authorized but not used because, given the marine‐based work plan, the Contractor staged everything from the materials barge. Based on the lack of landside infrastructure, the need to mobilize all materials from the Lower 48 states, and the lack of a suitable crane in Alaska, the Contractor used marine methods to advance the pile installation portion of the TPP.
Planned pile locations were surveyed using Differential Global Positioning System (DGPS) methods, and vertical datum, to the extent necessary to record pile advancement, which were then transferred to a set of marked elevations on the nearby wharf structure. The Contractor used a small (approximately 20‐foot [20‐meter] tall) template on the materials barge to control pile orientation and location; this was not an anchored template.
Prior to lofting the piles, the Contractor deployed the required NAS—either a confined air bubble curtain or a resonance system. Each NAS required a certain amount of crane time and deck labor for deployment, which was not problematic. Both systems had to accommodate a water depth range of 10 to 40 feet (3‐12 m) from mudline to mean lower low water (MLLW) and a tidal range of approximately 35 feet (10.7 m) above MLLW.
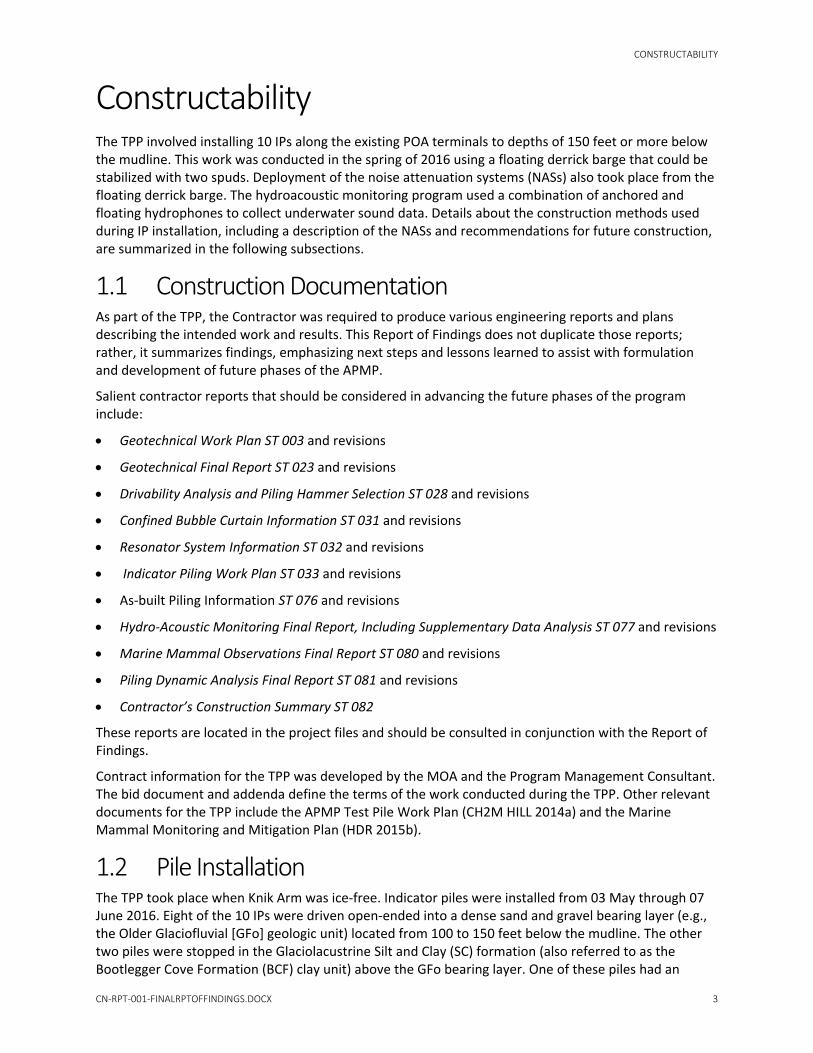
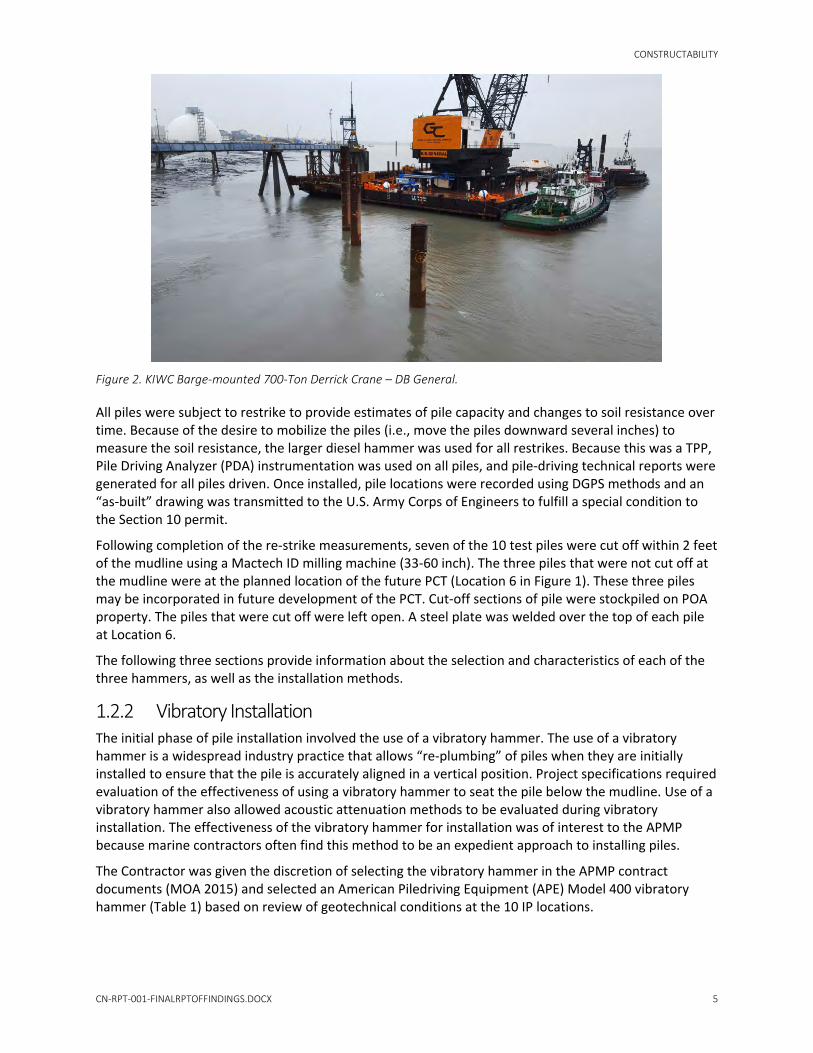
The DB General, a 700‐ton‐capacity floating derrick barge, was used for all pile operations (Figure 2). The Contractor lofted the piles and used self‐weight penetration through the template to stab the piles into the marine sediments. The contractor used the vibratory hammer to advance the piles approximately 50 feet (15.2 m). For impact driving, the TPP specified the use of hydraulic and diesel impact hammers (120,000‐foot‐pound (ft‐lb) and 446,513‐ft‐lb hammers, respectively) to allow the collection of noise data from each type of hammer, as well as to evaluate the efficiency of driving through deep deposits of stiff silty clays and interlayers of sand with each hammer type.
CONSTRUCTABILITY
CN‐RPT‐001‐FINALRPTOFFINDINGS.DOCX 5
Figure 2. KIWC Barge‐mounted 700‐Ton Derrick Crane – DB General.
All piles were subject to restrike to provide estimates of pile capacity and changes to soil resistance over time. Because of the desire to mobilize the piles (i.e., move the piles downward several inches) to measure the soil resistance, the larger diesel hammer was used for all restrikes. Because this was a TPP, Pile Driving Analyzer (PDA) instrumentation was used on all piles, and pile‐driving technical reports were generated for all piles driven. Once installed, pile locations were recorded using DGPS methods and an “as‐built” drawing was transmitted to the U.S. Army Corps of Engineers to fulfill a special condition to the Section 10 permit.
Following completion of the re‐strike measurements, seven of the 10 test piles were cut off within 2 feet of the mudline using a Mactech ID milling machine (33‐60 inch). The three piles that were not cut off at the mudline were at the planned location of the future PCT (Location 6 in Figure 1). These three piles may be incorporated in future development of the PCT. Cut‐off sections of pile were stockpiled on POA property. The piles that were cut off were left open. A steel plate was welded over the top of each pile at Location 6.
The following three sections provide information about the selection and characteristics of each of the three hammers, as well as the installation methods.
1.2.2 Vibratory Installation The initial phase of pile installation involved the use of a vibratory hammer. The use of a vibratory hammer is a widespread industry practice that allows “re‐plumbing” of piles when they are initially installed to ensure that the pile is accurately aligned in a vertical position. Project specifications required evaluation of the effectiveness of using a vibratory hammer to seat the pile below the mudline. Use of a vibratory hammer also allowed acoustic attenuation methods to be evaluated during vibratory installation. The effectiveness of the vibratory hammer for installation was of interest to the APMP because marine contractors often find this method to be an expedient approach to installing piles.
The Contractor was given the discretion of selecting the vibratory hammer in the APMP contract documents (MOA 2015) and selected an American Piledriving Equipment (APE) Model 400 vibratory hammer (Table 1) based on review of geotechnical conditions at the 10 IP locations.
CONSTRUCTABILITY
6 CN‐RPT‐001‐FINALRPTOFFINDINGS.DOCX
Table 1. Vibratory hammer with performance characteristics.
APE 400 Vibratory Hammer
SPECIFICATIONS DATA
Eccentric Moment 11,500 in‐lbs (132.49 kNm)
Drive Force 298 tons (2648 kN)
Frequency Maximum (VPM) 0 – 1,350 vpm
Max Line Pull 234 toms (2,082 kN)
Bare Hammer Weight w/o Clamp 31,570 lbs (14,320 kg)
Throat Width 33.00 in (84 cm)
Length 141.00 in (358 cm)
Height w/o Clamp 88.50 in (225 cm)
The APE 400 vibratory hammer was attached to each indicator pile after the pile penetrated a certain distance below the mudline from self‐weight. Piles were vibrated from 39 to 50 feet beyond the depth of self‐weight penetration. A maximum of 50 feet of vibratory driving was allowed by the approved construction permits for the project. This depth limit was established to minimize the duration of hydroacoustic noise during vibratory installation.
1.2.3 Hydraulic Impact Installation Five of the indicator piles were driven from the maximum depth reached by the vibratory hammer, to the planned pile termination depth using a hydraulic impact hammer. A hydraulic impact hammer was included in the APMP TPP for two reasons: (1) to evaluate the underwater noise produced by a hydraulic impact hammer and (2) to evaluate driving efficiency in the Upper SC formation [also referred to as the Bootlegger Cove Formation (BCF) Clay]. The features of the hydraulic impact hammer are such that the velocity is lower than a diesel impact hammer, and this difference was expected to result in different underwater noise levels and frequencies and potential differences in driving the indicator pile through a deep clay soil profile.
The APMP contract specifications allowed the Contractor to select the type of hydraulic impact hammer used for the TPP. The Contractor selected an APE 15‐4 hydraulic impact hammer (Table 2) based on a series of pile drivability studies using the computer program GRLWEAP (Pile Dynamics, Inc. 2010). The maximum rated energy of this hammer is 120,000 ft‐lbs (Table 2). The pile drivability studies determined that the indicator piles could be driven to the termination depth between 136 and 185 feet below the mudline at a final blowcount of 12 to 55 blows per foot (bpf). The Contractor estimated that it would take the hydraulic hammer from less than to 10 minutes to as many as 50 minutes to reach the termination depths, with the hammer operating at 50 blows per minute (b/min). Actual driving times are discussed in Section 3.2.2, and additional information about impact driving with the hydraulic hammer is provided in RMDT (2016).
CONSTRUCTABILITY
CN‐RPT‐001‐FINALRPTOFFINDINGS.DOCX 7
Table 2. Diesel and hydraulic impact hammer specifications.
Specifications
Hydraulic Hammer Diesel Hammer
Imperial Metric Imperial Metric
Stroke at maximum rated energy 48 in 121.92 cm 135 in 343 cm
Maximum rated energy 120,000 ft‐lbs 162.7 kNm 446,513 ft‐lbs 602.79 kNm
Minimum rated energy 272,373 ft‐lbs 367.70 kNm
Maximum obtainable stroke 150 in 381 cm
Maximum obtainable energy 666,395 ft‐lbs 196 kNm
Ram 30,000 lbs 13,607.77 kg 39,690 lbs 18,000 kg
Anvil 10,223 lbs 4,642 kg
Hammer weight 42,000 lbs 19,050.88 kg 92,000 lbs 11,286 kg
Speed (b/min) 30–65 30–65 34–53 34–53
APE 15‐4 Hydraulic Impact Hammer
APE 180‐42 Diesel Impact Hammer
1.2.4 Diesel Impact Installation The remaining five indicator piles were driven from the maximum depth reached by the vibratory hammer to the planned pile termination depth using a diesel impact hammer. The diesel hammer was included in the APMP TPP contract requirements for the same two reasons as described above for the hydraulic impact hammer: (1) to evaluate the underwater noise caused by this type of impact hammer and (2) to evaluate driving efficiency in the SC/BCF geologic unit. The features of the diesel impact hammer are such that the velocity is much higher than a hydraulic impact hammer, and this difference was expected to result in different underwater noise levels and frequencies and potential differences in driving the indicator pile through a deep clay soil profile.
The decision on the type of diesel hammer was assigned within the APMP TPP contract specifications to the Contractor. The Contractor selected an APE D180‐42 diesel impact hammer (Table 2) based on a series of pile drivability studies conducted using the computer program GRLWEAP (2010). This hammer
CONSTRUCTABILITY
8 CN‐RPT‐001‐FINALRPTOFFINDINGS.DOCX
has a maximum rated energy of 446,513 ft‐lbs at a stroke of 11.5 feet and can be used with a striker plate. The pile drivability studies determined that the indicator piles could be driven to the termination depth between 136 and 170 feet below the mudline at final blowcount of 8 to 49 bpf. The Contractor estimated drive times to reach the termination depth as ranging from less than 10 to slightly more than 50 minutes. Actual driving times are discussed in Section 3.2.2, and additional information about impact driving with the diesel impact hammer is provided in RMDT (2016).
1.3 Noise Attenuation Systems Two different NASs were employed during the TPP. The NASs were designed to reduce water‐borne noise levels caused by pile installation, and were evaluated for their efficacy. In addition, piles were installed with no attenuation as a control pile condition for comparison. TPP design included pile location, hammer type, and attenuation system (Table 3).
Table 3. Noise attenuation system and hammer type used for each pile.
Pile Location1 IP# Hammer Type Noise Attenuation System (NAS)
Date Installed Date of Restrike
6 IP #8 Hydraulic Resonator 03 May 16 10 June 2016
6 IP #9 Diesel Resonator 06‐07 May 16 10 June 2016
1 IP #4 Hydraulic Resonator 12‐13 May 16 15 June 2016
4 IP #5 Diesel None 18 May 16 09 June 2016
4 IP #2 Diesel Resonator 19 May 16 09 & 21 June 2016
5 IP #7 Diesel Bubble Curtain 25 May 16 08 June 2016
6 IP #10 Hydraulic Bubble Curtain 26 May 16 10 June 2016
4 IP #6 Diesel Bubble Curtain 01 June 16 21 June 2016
1 IP #3 Hydraulic Bubble Curtain 03 June 16 16 June 2016
5 IP #1 Hydraulic None 07 June 16 21 June 2016
1 Pile locations are described in Section 3.1.2. 2Pile IP6 had a bearing plate installed and was driven with the air bubble curtained turned off and on.
1.3.1 Confined Air Bubble Curtain A confined air bubble curtain NAS was used on four indicator piles (IP3, IP6, IP7, and IP10; Table 3). This telescoping, steel pipe system created an isolation pile surrounding the pile as it was being installed. The confined bubble curtain consisted of four, vertically‐distributed bubble rings welded to the inside of a telescoping steel pipe system made up of a 5‐foot diameter inner pipe and a 6‐foot diameter outer pipe. Each bubble ring was a 3‐inch inner‐diameter half‐ring steel pipe, with four rows of 1/16‐inch holes on 0.78‐inch spacing.
A 1600‐cubic foot per minute (cfm) compressor provided a continuous supply of compressed air to the four aeration pipes (Figure 3), with flow nominally distributed among the stages from top to bottom as follows: Stage 1 = 160 cfm, Stage 2 = 320 cfm, Stage 3 = 560 cfm, Stage 4 = 560 cfm. Air was then released from the small holes in the pipeline to create a curtain of air bubbles surrounding the pipe (Figure 4), while maintaining contact with the sea floor. The curtain of air bubbles inhibited the transmission of pile driving sounds to the surrounding water due to the high compressibility of air bubbles relative to water. This confined bubble curtain was designed for water depths of 26 to 60 feet.
The confined bubble curtain was required for the TPP because of the strong currents that occur in Knik Arm. In the absence of confinement provided by the telescoping pipe system, the air bubbles were
CONSTRUCTABILITY
CN‐RPT‐001‐FINALRPTOFFINDINGS.DOCX 9
expected to disperse with the current, leading to a significant reduction in the sound attenuation properties. By confining the air bubbles in the 5‐foot casing, maximum attenuation was expected.
Figure 3. Confined bubble curtain system schematic.
a b
Figure 4. Confined air bubble curtain on (a) and off (b).
CONSTRUCTABILITY
10 CN‐RPT‐001‐FINALRPTOFFINDINGS.DOCX
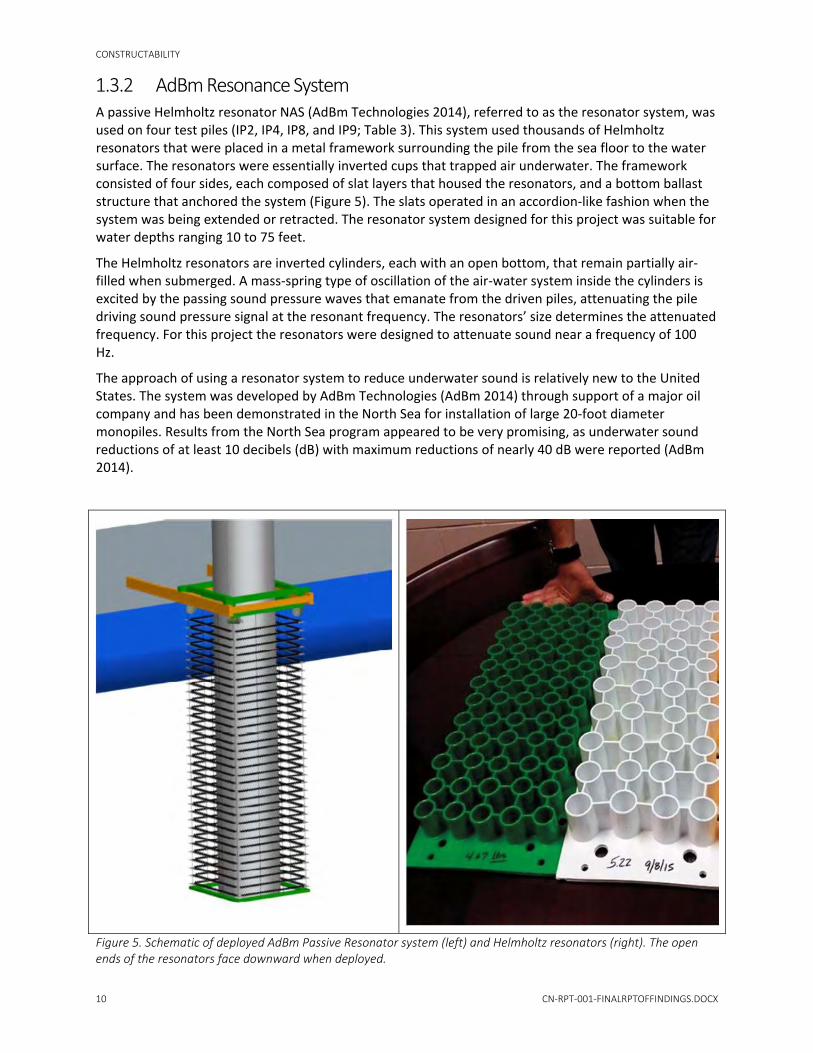
1.3.2 AdBm Resonance System A passive Helmholtz resonator NAS (AdBm Technologies 2014), referred to as the resonator system, was used on four test piles (IP2, IP4, IP8, and IP9; Table 3). This system used thousands of Helmholtz resonators that were placed in a metal framework surrounding the pile from the sea floor to the water surface. The resonators were essentially inverted cups that trapped air underwater. The framework consisted of four sides, each composed of slat layers that housed the resonators, and a bottom ballast structure that anchored the system (Figure 5). The slats operated in an accordion‐like fashion when the system was being extended or retracted. The resonator system designed for this project was suitable for water depths ranging 10 to 75 feet.
The Helmholtz resonators are inverted cylinders, each with an open bottom, that remain partially air‐filled when submerged. A mass‐spring type of oscillation of the air‐water system inside the cylinders is excited by the passing sound pressure waves that emanate from the driven piles, attenuating the pile driving sound pressure signal at the resonant frequency. The resonators’ size determines the attenuated frequency. For this project the resonators were designed to attenuate sound near a frequency of 100 Hz.
The approach of using a resonator system to reduce underwater sound is relatively new to the United States. The system was developed by AdBm Technologies (AdBm 2014) through support of a major oil company and has been demonstrated in the North Sea for installation of large 20‐foot diameter monopiles. Results from the North Sea program appeared to be very promising, as underwater sound reductions of at least 10 decibels (dB) with maximum reductions of nearly 40 dB were reported (AdBm 2014).
Figure 5. Schematic of deployed AdBm Passive Resonator system (left) and Helmholtz resonators (right). The open ends of the resonators face downward when deployed.
CONSTRUCTABILITY
CN‐RPT‐001‐FINALRPTOFFINDINGS.DOCX 11
1.4 Construction Issues A number of important construction issues were observed during the TPP. These issues range from availability of work areas to coordination and safety issues, as discussed below. These observations from the TPP provide valuable insight into issues that will have to be considered during planning and installation of production piling for the APMP.
1.4.1 Work Area The POA required that the TPP be implemented without affecting Port operations in any way. This meant that all ship berths had to be open whenever a port call was to be made, and that the Contractor had to work around POA operations to install, restrike, and cut off each pile.
The lack of a dedicated work area required avoidance of all ship traffic; the Contractor responded by incorporating the following into the work plan:
Use of shop‐fabricated full‐length piles to avoid the need for splicing during pile installation
Use of a large crane and hammer to minimize driving time
Keeping an ocean tug on charter at the POA to assist in multiple moves between pile locations.
Advancing piles to the required depths from a marine platform lessened interference with POA daily operations and allowed mobility, but made construction subject to extreme tides and tidal currents. This limited productivity (e.g., having to wait for tide or current conditions to change) on some shifts. These strategies were successful; however, if a dedicated work area in the harbor were available during future phases, this would provide flexibility in techniques for contractors. Future APMP work will be production oriented and a variety of approaches may be used such as combined use of marine and land based equipment, in‐lead splicing of piles, or work on multiple headings at one time. Use of these strategies would provide for contractor efficiencies in the production work.
1.4.2 Self‐weight Penetration The Contractor lofted the piles and used self‐weight penetration through the template to stab the piles into the marine sediments. The amount of self‐weight penetration ranged from approximately 2 feet to 20 feet below the mudline depending on location. Differences in self‐weight penetration were attributed to characteristics of the upper silt layer near the mudline.
The use of self‐weight penetration caused some problems when penetration was less than estimated. At least twice, this required the rig to wait for the tide to come up so that the piles could be released in vertical position with adequate stability and the vibratory hammer attached. A longer template or shore‐based construction would mitigate this issue during production pile installation for future APMP phases.
1.4.3 Repair Parts and Personnel and Stockpiled Materials Securing repair parts and specialty repair personnel required coordination throughout TPP activities. Similar to other Alaska projects, the TPP required air freight of repair parts and air transport of manufacturer’s or repair personnel. In a production setting, successful contractors are expected to stock common repair parts; however, most projects still rely on air shipment of parts and air transport of specialty personnel to some extent.
Stockpiled materials left over from the TPP were retained by the POA, as return and restocking would have added costs to the POA. The POA is in possession of 773 linear feet of 48‐inch‐diameter by 1‐inch‐wall ASTM A52 GR3/API 5L steel pipe piles in 32 sections of random lengths, and three cast steel 48‐inch‐diameter open driving shoes. These driving shoes were specifically fabricated by the Contractor for
CONSTRUCTABILITY
12 CN‐RPT‐001‐FINALRPTOFFINDINGS.DOCX
the TPP, as 48‐inch driving shoes were not available through suppliers, such as Associated Pile & Fitting (APF), who sell pre‐fabricated driving shoes for pipe piles.
1.4.4 Additional Coordination Additional coordination required prior to and throughout the TPP included securing and complying with required permits, port security, and coordination with ongoing POA operations.
Permits – From a construction coordination perspective, two main permits governed the test pile work:
– USACE Section 10 Permit
– National Marine Fisheries Service (NMFS) Incidental Harassment Authorization (IHA)
The USACE Section 10 permit required only limited coordination with the USACE during the TPP. This consisted effectively of providing notice to the U.S. Coast Guard of operations and their termination and supplying as‐built record information of piles left shoreward of the USACE’s dredging boundaries.
For the NMFS IHA, while pile installation was occurring, marine mammal observers (MMOs) were required to monitor marine waters within a specific radius of the pile installation activity (see Section 4.0). The observers communicated directly with the pile‐driving supervisor to provide either an all‐clear status or an alert of the presence of marine mammals within or near the specific radius being monitored. MMOs worked from two observation towers with appropriate optical equipment, and a roving observer conducted observations from opportunistic locations as well. One observer was the lead technician and was responsible for communicating the absence or presence of marine mammals to the pile‐driving supervisor. This system worked well for the limited number of piles that were driven for the TPP, and the contract did not experience any claims as result of the marine mammal monitoring program.
Port Security – The POA is a transportation secured facility, and personnel working on POA property must have either a proximity card issued by the POA or a federal Transportation Workers Credential card. This system worked well; the Contractor had no difficulty securing labor with the ability to obtain the required clearances.
Coordination with POA Operations – It was important that TPP activities were conducted without interfering with POA operations; therefore, communication and coordination were extremely important. This was handled in large part through the POA Operations Superintendent. TPP personnel held weekly coordination meetings for which tenant and POA coordination was an agenda topic. In addition, direct ad‐hoc phone calls and meetings were held to maintain coordination within the dynamic environment of a working port. The Contractor also provided a daily email update to POA users, including the marine pilots’ organization, stating the position of floating equipment, tugs, barges, and anchors.
Various other tasks were occurring during the TPP that required coordination between contractors. This was accomplished successfully without significant interruptions to POA activities or to the Contractor’s productivity.
A major goal of the TPP was effective measurement of the sound signature of the installation of attenuated and unattenuated piles. During pile installation for the TPP, Port MacKenzie was using a vibratory hammer to install a series of sheet piles to repair a dock face. There was concern that this work, located about 2 miles from the POA, would affect the underwater noise measurements collected and thus have the potential to affect TPP results. The Matanuska‐Susitna Borough contract administrator for Port MacKenzie agreed to temporarily halt sheet pile installation operations during two of the TPP indicator piles. This standby time was not charged to the TPP.
CONSTRUCTABILITY
CN‐RPT‐001‐FINALRPTOFFINDINGS.DOCX 13
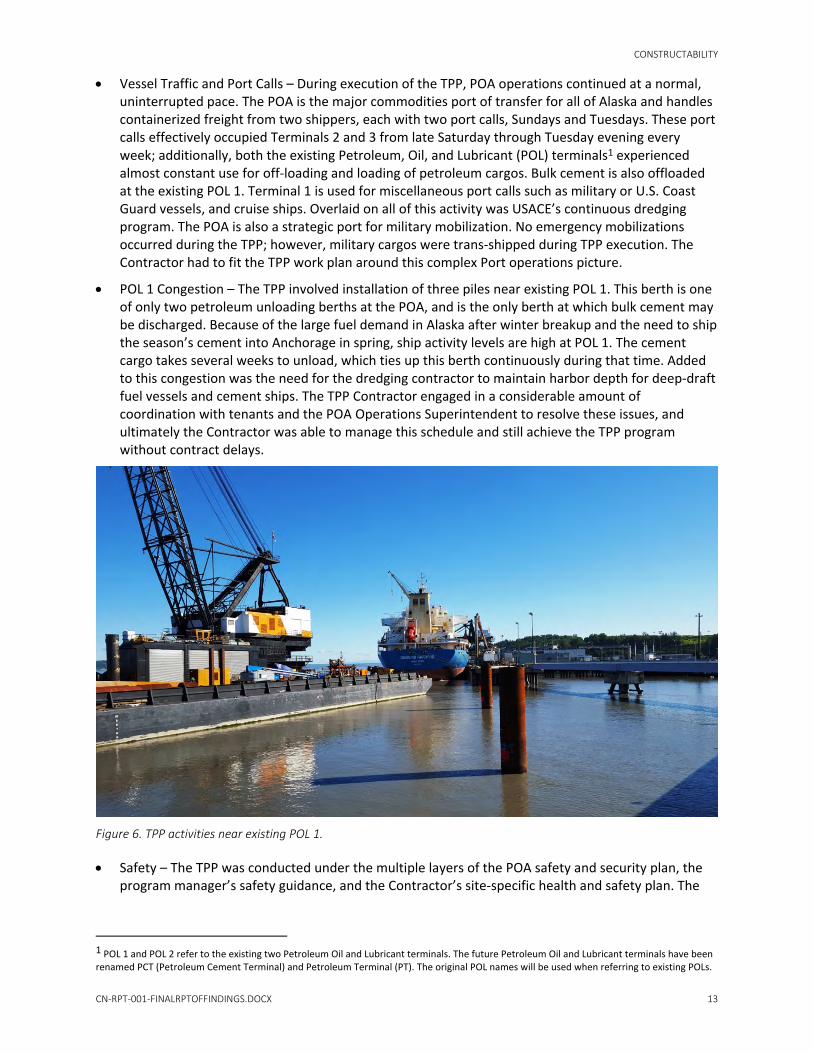
Vessel Traffic and Port Calls – During execution of the TPP, POA operations continued at a normal, uninterrupted pace. The POA is the major commodities port of transfer for all of Alaska and handles containerized freight from two shippers, each with two port calls, Sundays and Tuesdays. These port calls effectively occupied Terminals 2 and 3 from late Saturday through Tuesday evening every week; additionally, both the existing Petroleum, Oil, and Lubricant (POL) terminals1 experienced almost constant use for off‐loading and loading of petroleum cargos. Bulk cement is also offloaded at the existing POL 1. Terminal 1 is used for miscellaneous port calls such as military or U.S. Coast Guard vessels, and cruise ships. Overlaid on all of this activity was USACE’s continuous dredging program. The POA is also a strategic port for military mobilization. No emergency mobilizations occurred during the TPP; however, military cargos were trans‐shipped during TPP execution. The Contractor had to fit the TPP work plan around this complex Port operations picture.
POL 1 Congestion – The TPP involved installation of three piles near existing POL 1. This berth is one of only two petroleum unloading berths at the POA, and is the only berth at which bulk cement may be discharged. Because of the large fuel demand in Alaska after winter breakup and the need to ship the season’s cement into Anchorage in spring, ship activity levels are high at POL 1. The cement cargo takes several weeks to unload, which ties up this berth continuously during that time. Added to this congestion was the need for the dredging contractor to maintain harbor depth for deep‐draft fuel vessels and cement ships. The TPP Contractor engaged in a considerable amount of coordination with tenants and the POA Operations Superintendent to resolve these issues, and ultimately the Contractor was able to manage this schedule and still achieve the TPP program without contract delays.
Figure 6. TPP activities near existing POL 1.
Safety – The TPP was conducted under the multiple layers of the POA safety and security plan, the program manager’s safety guidance, and the Contractor’s site‐specific health and safety plan. The
1 POL 1 and POL 2 refer to the existing two Petroleum Oil and Lubricant terminals. The future Petroleum Oil and Lubricant terminals have been renamed PCT (Petroleum Cement Terminal) and Petroleum Terminal (PT). The original POL names will be used when referring to existing POLs.
CONSTRUCTABILITY
14 CN‐RPT‐001‐FINALRPTOFFINDINGS.DOCX
Contractor’s safety plan, methods, and performance were good. The Contractor worked 9,364 craft hours without a recordable incident.
1.5 Pile Installation Discussion Production pile installation is expected to be similar to TPP pile installation. Key steps include:
Survey and layout
Template installation
Installation of noise attenuation devices and systems
Initial driving and verification of plumb and position
Final driving to target depths
Restrike to verify capacity on a subset of the piles
As‐built locations to verify compliance
Cutoff to required elevation and installation of pile caps
During production pile installation, construction lay‐out and as‐built information will use similar methods to the TPP and are not expected to be problematic.
Production piles will likely use a larger template than that used in the TPP. The production template will likely be designed such that it registers multiple piles in a bent for the trestle piles. Another template configuration for dolphin piles will also need to be developed. The templates will have to be solidly fixed to provide the accuracy needed for production piles. This will require a certain amount of pile driving for the template itself and pile extraction work when the template is moved to a new location. Similar to the TPP, NASs will have to be attached to the template and will need to accommodate variable minimum water depths and variable tides. Total range of minimum water depth and tidal variation may be 70 feet or more. Production operations may benefit from a larger NAS that encompasses a group of piles, to avoid setting up the system for each individual pile. Effectiveness and feasibility of such a NAS is unknown and deserves further investigation.
Consideration may be given to steel pile caps to allow efficient placement of pile caps. This would avoid the detailing and force‐transfer issues that may occur with precast caps; it would also avoid potential environmental problems with placing concrete over water, and seasonal issues associated with mass‐ and cold‐weather concrete placement.
1.6 Recommendations Moving Forward Although the TPP was successfully implemented, some tenant coordination issues and similar access issues need to be addressed to maximize efficiency during a larger production‐oriented contract for the next phase of the APMP. These include:
Provide dedicated areas within the POA (both landside and within the harbor limits) for the Contractor’s work.
Use a long‐term Local Notice to Mariners (LNM) to avoid the need for ongoing vessel coordination to the extent possible.
Continue the use of daily email notifications to supplement LNM notices and engage in other coordination as needed.
Engage Port Operations Superintendent with all tenant communication and coordination.
CONSTRUCTABILITY
CN‐RPT‐001‐FINALRPTOFFINDINGS.DOCX 15
Distribute a weekly mailer to POA tenants and stakeholders with updates on construction activities and configuration.
Provide a webcam to document project progress.
Key steps required to advance the APMP include coordination with the POA and USACE to establish a dedicated work area both on the land side and within the harbor limits for the Contractor and establishment of communication protocol. A Contractor work area that allows unrestricted access and allows for a laydown yard immediately accessible to the landside of the new Petroleum Cement Terminal (PCT) will allow greater success of that element of the APMP. Coordination with the POA to achieve a workable tenant and stakeholder communication protocol will help avoid last minute coordination issues between construction activities and Port operations.
GEOTECHNICAL AND PILE INSTALLATION
16 CN‐RPT‐001‐FINALRPTOFFINDINGS.DOCX
Geotechnical and Pile Installation The scope of work for the APMP TPP included two separate geotechnical tasks, both conducted under the overall KIWC contract:
The first task involved drilling and sampling of five geotechnical explorations, followed by a laboratory testing program on intact soil samples recovered during the exploration program. The results of the geotechnical testing and exploration program are summarized in a report titled Port of Anchorage Test Pile Program Geotechnical Data Report, prepared by Golder (2016) for the Contractor.
The second task involved installation and restrike of 10 indicator piles (IP), numbered IP‐1 through IP‐10, with dynamic monitoring. The dynamic monitoring work was performed by Robert Miner Dynamic Testing of Alaska, Inc. (RMDT) under contract to KIWC. The results of the dynamic monitoring program are summarized in a report titled Dynamic Pile Measurements and Analyses, PP 48” x 1”, May 3 ‐ June 21, 2016, APE D180‐42 & APE 15‐4 Hydraulic Hammer, Test Pile Program, Anchorage Port Modernization Project, prepared by RMDT (2016) for KIWC.
The following subsections summarize methods used and results of the exploration and TPPs. Recommendations for moving forward following the APMP TPP are provided at the end of the section.
2.1 Methods The geotechnical exploration and dynamic pile testing methods were developed by the Contractor to meet general requirements describe within the APMP contract documents (MOA 2015). These requirements included characterizing soil conditions at the locations of the planned test pile installations and collecting dynamic measurements on test piles as they were being installed and during restrikes.
2.1.1 Geotechnical Exploration Program The Golder geotechnical exploration program was conducted from 08 October through 07 November 2015. The program consisted of drilling and sampling five boreholes (Figure 7) to depth ranging from approximately 149 to 201 feet (45 to 61 m) below the existing mudline. Table 4 provides a summary of the dates, borehole depths, mudline elevations, and coordinates for each of the explorations.
Table 4. Borehole depth and location summary (Golder 2016).
Notes: 1 Mudline elevation relative to MLLW at the time of drilling 2 Latitude and Longitude coordinates based upon handheld GPS 3 VWP installation depths identified are relative to mudline at the time of drilling
GEOTECHNICAL AND PILE INSTALLATION
CN‐RPT‐001‐FINALRPTOFFINDINGS 17
Figure 7. Location of geotechnical explorations (Golder 2016).
GEOTECHNICAL AND PILE INSTALLATION
18 CN‐RPT‐001‐FINALRPTOFFINDINGS
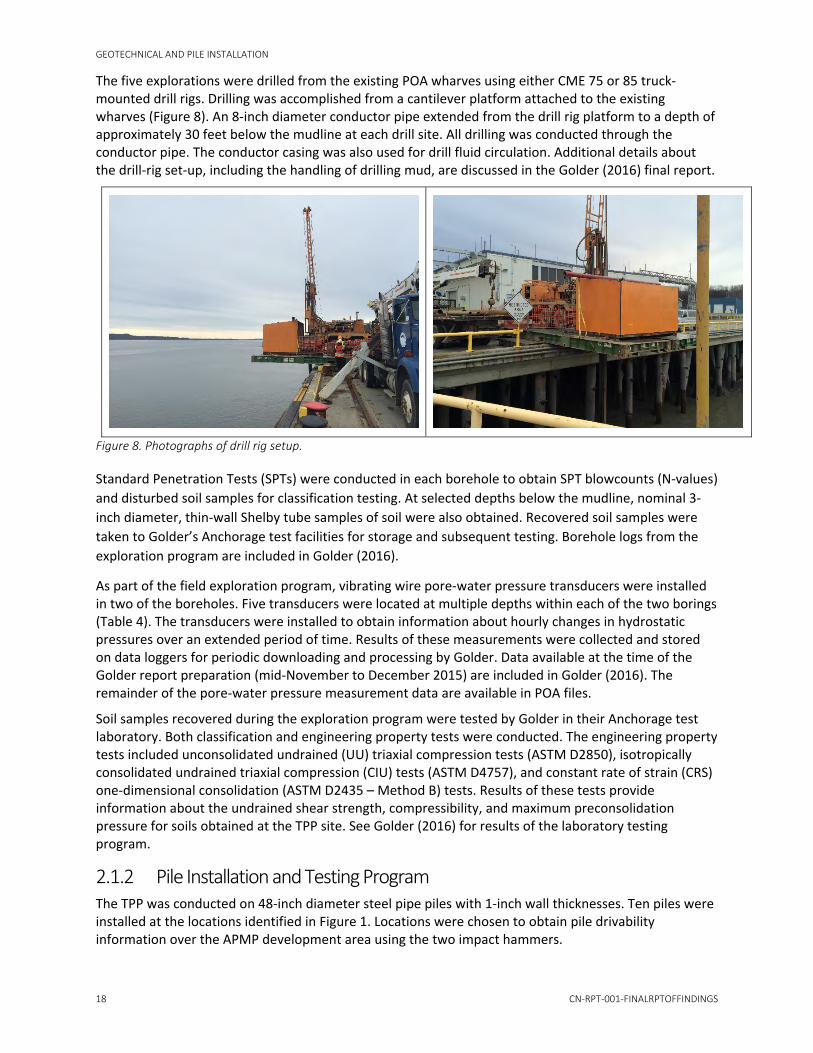
The five explorations were drilled from the existing POA wharves using either CME 75 or 85 truck‐mounted drill rigs. Drilling was accomplished from a cantilever platform attached to the existing wharves (Figure 8). An 8‐inch diameter conductor pipe extended from the drill rig platform to a depth of approximately 30 feet below the mudline at each drill site. All drilling was conducted through the conductor pipe. The conductor casing was also used for drill fluid circulation. Additional details about the drill‐rig set‐up, including the handling of drilling mud, are discussed in the Golder (2016) final report.
Figure 8. Photographs of drill rig setup.
Standard Penetration Tests (SPTs) were conducted in each borehole to obtain SPT blowcounts (N‐values)
and disturbed soil samples for classification testing. At selected depths below the mudline, nominal 3‐
inch diameter, thin‐wall Shelby tube samples of soil were also obtained. Recovered soil samples were
taken to Golder’s Anchorage test facilities for storage and subsequent testing. Borehole logs from the
exploration program are included in Golder (2016).
As part of the field exploration program, vibrating wire pore‐water pressure transducers were installed in two of the boreholes. Five transducers were located at multiple depths within each of the two borings (Table 4). The transducers were installed to obtain information about hourly changes in hydrostatic pressures over an extended period of time. Results of these measurements were collected and stored on data loggers for periodic downloading and processing by Golder. Data available at the time of the Golder report preparation (mid‐November to December 2015) are included in Golder (2016). The remainder of the pore‐water pressure measurement data are available in POA files.
Soil samples recovered during the exploration program were tested by Golder in their Anchorage test laboratory. Both classification and engineering property tests were conducted. The engineering property tests included unconsolidated undrained (UU) triaxial compression tests (ASTM D2850), isotropically consolidated undrained triaxial compression (CIU) tests (ASTM D4757), and constant rate of strain (CRS) one‐dimensional consolidation (ASTM D2435 – Method B) tests. Results of these tests provide information about the undrained shear strength, compressibility, and maximum preconsolidation pressure for soils obtained at the TPP site. See Golder (2016) for results of the laboratory testing program.
2.1.2 Pile Installation and Testing Program The TPP was conducted on 48‐inch diameter steel pipe piles with 1‐inch wall thicknesses. Ten piles were installed at the locations identified in Figure 1. Locations were chosen to obtain pile drivability information over the APMP development area using the two impact hammers.
GEOTECHNICAL AND PILE INSTALLATION
CN‐RPT‐001‐FINALRPTOFFINDINGS.DOCX 19
2.1.2.1 Indicator Pile Locations
The original planning for the TPP identified the location and type of hammer that would be used for each location. The locations included two indicator piles alongside the face of the existing POA wharf. These piles were to be driven and then removed within 4 days to avoid conflicts with the arrival of the Matson and TOTE cargo vessels. After further discussions with the POA and the Contractor, the decision was made to relocate these piles to other positions away from the active shipping area. The consensus was that available time was most likely sufficient to allow driving and removing the piles during the available work window; however, the disruption to the terminal operators would be significant if the pile could not be removed, and this risk was not acceptable to the POA. Locations were revised to avoid potential conflicts with the POA’s ongoing shipping operations and accessibility to the installation sites.
The APMP contract documents required that all piles were driven on the shore side of the USACE dredge limits. This shore‐side location was required to avoid creating an obstruction in the dredge area when the piles were cut off. Of the 10 IPs, all but three were cut off at the mudline. These three un‐cut IP locations were selected to coincide with planned future locations of an emergency access bridge and mooring dolphin at PCT (Location 6). The emergency access bridge was part of the POA’s plans for post‐earthquake preparedness after a Maximum Considered Earthquake (CH2M HILL 2015). Location tolerance for Location 6 piles was within 4 inches; all other piles were located within 24 inches of the planned locations.
Two additional changes in hammer type and indicator pile location were made during the installation program:
IP‐4 at Location 1 was driven with an APE 15‐4 hydraulic impact hammer and then with the APE D180‐42 diesel impact hammer. The change from the APE 15‐4 hydraulic impact hammer to the diesel impact hammer occurred at approximately 113 feet of penetration. At this depth the hydraulic impact hammer encountered operational issues, such that the energy was less than planned. Rather than waiting for the hammer to be repaired, and the risk of too much setup to drive the pile to the termination depth, a decision was made to drive the pile from 113 feet of penetration to termination using the APE D180‐42 diesel impact hammer.
The other change relative to the Contractor’s original indicator pile installation plans involved moving the location of IP‐1 from Location 1 to Location 5. This change was necessitated by access issues related to the Contractor barge location. Water depth and barge location resulted in IP‐1 being driven too close to the two indicator piles (IP‐3 and IP‐4) that had already been driven in this area. The proximity to the existing piles resulted in concerns that restrike capacities of the existing two piles would be affected by another pile being driven nearby. For this reason IP‐1 was relocated to Location 5 and driven to the same depth as IP‐6. Moving to Location 5 also allowed a direct comparison between IP‐6 and IP‐1 – that is “with” and “without” a bearing plate.
2.1.2.2 Pile Length
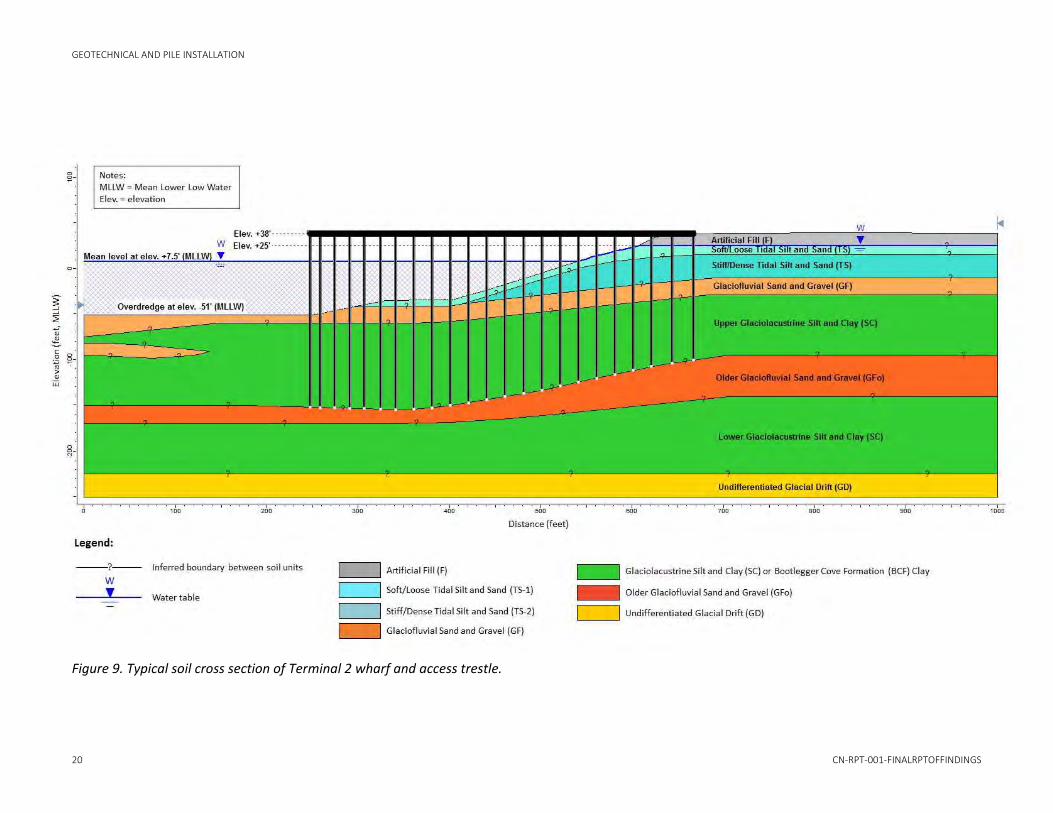
The APMP contract documents required eight of the 10 IPs to be driven to a bearing layer located as much as 200 feet below MLLW. This bearing layer had been identified in previous concept‐level design work (CH2M HILL 2014b). The bearing layer consisted of dense sands and gravels and is referred to as the GFo layer. This layer had been chosen as the planned pile toe elevation because of the increased toe bearing that would occur in this layer. Previous piles driven for the POA had not extended to this layer; these piles stopped in the SC/BCF layer above the GFo. However, pile capacity evaluations conducted during conceptual design for the APMP concluded that the piles should be extended to the GFo layer to have greater confidence in the axial capacities. Figure 9 shows a typical cross‐section across the site at Terminal 2.
GEOTECHNICAL AND PILE INSTALLATION
20 CN‐RPT‐001‐FINALRPTOFFINDINGS
Figure 9. Typical soil cross section of Terminal 2 wharf and access trestle.
GEOTECHNICAL AND PILE INSTALLATION
CN‐RPT‐001‐FINALRPTOFFINDINGS.DOCX 21
The depth of the GFo bearing layer varied across the APMP site. Previous exploration work conducted for the area during the Port Intermodal Expansion Project (PIEP) and the more recent Golder exploration program conducted as part of the APMP TPP encountered the GFo layer between Elevations ‐150 feet MLLW and ‐200 feet MLLW. The deepest elevation of the GFo layer was located to the west of the north end of existing planned Terminal 1 (Borehole 15‐03 in Figure 7); the shallowest location appeared to be near POL 1.
Test piles were to be driven to the GFo layer to confirm that piles could be driven to this depth, to monitor hydroacoustic and in‐air noise during driving, and to evaluate axial capacities of piles using the PDA monitoring method. The thickness of the GFo layer typically varied from 10 to 20 feet; soil beneath the GFo layer was an older deposit of SC/BCF that was expected to exhibit lower bearing strengths than the GFo layer. As a result, there was some concern that the piles could punch through the GFo layer during production installation and therefore pile driving should stop once piles had penetrated one to two diameters within GFo layer. One of the objectives of the TPP was, therefore, to determine if the top of the GFo layer could be detected by changes in the number of hammer blows to achieve penetration.
Two of the IPs (IP‐1 and IP‐6) were stopped short of the GFo layer during the TPP to evaluate the capacity of IPs not driven into the GFo layer. These piles were not driven to the GFo layer to also evaluate the setup within the SC/BCF layer without the influence of the GFo layer. One of the piles was also fit with an internal bearing plate approximately 82 feet above the toe of the pile. The intent of the bearing plate was to force a closed‐end condition in the SC/BCF. It was anticipated that the closed end condition would result in additional end bearing from the SC/BCF, and possibly the combination of the closed end condition with setup in the SC/BCF would result in sufficient axial capacity that piles would not have to be driven to the GFo bearing layer. The potential benefit of stopping the piles above the GFo layer is that pile lengths could be reduced, potentially resulting in substantial cost savings to the APMP.
2.1.2.3 Installation Method
The APMP contract documents required that sufficient pile materials be provided by the contractor that piles up to 205 feet in length could be driven at each pile location and that an additional 300 feet of pile be available if deeper driving was required. Both the sequence of driving and the manner of handling the piles were left to the Contractor. The APMP contract documents allowed either driving in single 205‐foot lengths or splicing in the leads. The Contractor opted to fabricate the pile to the full 205‐foot length in Seattle before transport to Anchorage to avoid field splices. The APMP contract documents also required the contractor to provide driving shoes for field installation in the event that premature refusal occurred during driving; a bearing plate was also required for one pile.
As discussed previously in Section 1.4, piles were installed first by vibrating the piles using an APE 400 vibratory hammer to approximately 50 feet below the depth of self‐weight penetration and then driving to the planned termination depth using either the APE 15‐4 hydraulic impact hammer or the APE 180‐42 diesel impact hammer. The selection of hammer type for specific locations was specified in the APMP contract documents to provide a range of hydroacoustic and soil conditions for evaluating each hammer type. The maximum depth of driving was determined either by the ability of the hydraulic or diesel impact hammer to penetrate the soil layering without meeting refusal or the maximum length of the pile, which was 205 feet.
All piles were driven open except IP‐6. This IP had a bearing plate welded approximately 80 feet from the toe of the pile. A 3‐inch diameter hole was located in the center of the bearing plate to help relieve hydrostatic pressure that developed between the top of the soil plug and the bearing plate during driving. The intent of the bearing plate was to evaluate driving response for a case where the soil plug would develop. For piles that were not driven with the plate, the location of the plug was determined by soundings with a lead line weight both before and after restrike.
GEOTECHNICAL AND PILE INSTALLATION
22 CN‐RPT‐001‐FINALRPTOFFINDINGS.DOCX
2.1.2.4 Monitoring
Dynamic measurements were collected on each pile during initial driving and restrike using strain sensors and accelerometers attached to the piles. These sensors were located approximately 15 to 18 feet below the pile top except when the instrumentation approached or entered the water or the NAS. For those cases the PDA sensors were relocated so that they would not be submerged or contact the NAS. All signals from these sensors were collected and processed using a PDA system manufactured by Pile Dynamics. The PDA data were collected from the start of impact driving through the final termination depth.
Soil resistances along each piles was computed using both the Case method and by conducting CAse Pile Wave Analysis Program (CAPWAP®) analyses based on force and velocity data recorded in the field during dynamic monitoring. Typically, the CAPWAP analyses were performed on hammer blows recorded when the piles penetrated the GFo layer; however, intermediate blows within the SC/BCF were also evaluated to obtain information about the soil friction during driving. Final CAPWAP results included soil resistance distribution, driving stress on piles, soil quake and damping factors, and static load‐displacement graph. The results of these measurements are summarized in the Dynamic Pile Measurement and Analyses Report, prepared by RMDT (2016) for the Contractor. These details include additional information about the test equipment and test sequence.
Each IP was re‐struck with the APE D180‐42 diesel impact hammer to determine the amount of setup that developed with time. The setup time ranged from 13 days to as much as 38 days. A minimum of 2 to 3 weeks of setup time was required by the APMP contract documents. The variation in days of setup was determined by the Contractor’s driving sequence. The APE D180‐42 diesel impact hammer was used for restriking each pile because of its much greater hammer energy. Results of initial driving found that the APE 15‐4 hydraulic impact hammer was able to drive through the SC/BCF, but had limited ability to mobilize end bearing in the much denser GFo layer. In an effort to maximize the development of side friction and end bearing during restrike, the decision was made to use only the APE D180‐42 diesel impact hammer for the TPP. Future phases of the APMP will require validation of capacity on a certain number of installed piles with a hammer large enough to mobilize (i.e., drive downward several inches) the pile once it is installed.
2.2 Results The results of the geotechnical exploration for the TPP include additional information about soil layering and soil properties at the APMP site, as well as an extensive amount of information about installation of piles for the APMP. Results of the TPP are specific to the type of hammers used and the size of the piles. If the Designer of Record decides to use an alternate type of hammer or different pile sizes (i.e., diameters or pile wall thicknesses), results given in the following subsections will need to be reevaluated in consideration of hammer or pile changes.
2.2.1 Geotechnical Exploration Results of the Golder exploration program include boring logs from the five borehole location and laboratory test data from soil classification, strength, and compressibility testing. Borehole logs, as well as details for the laboratory test program, are included in Golder (2016) and will not be repeated.
Soil conditions at the five locations are generally similar, comprising:
An upper surface layer of soft silt that range from 10 to 30 feet in thickness. Golder was not able to sample the upper 30 feet of soil because of the exploration setup used by Denali Drilling, who was subcontracted by Golder for drilling services. The absence of samples meant that soil conditions had to be inferred by the field personnel based on performance of the drilling equipment.
GEOTECHNICAL AND PILE INSTALLATION
CN‐RPT‐001‐FINALRPTOFFINDINGS.DOCX 23
A thick deposit of firm to stiff silt and clay for most locations. This deposit is the SC/BCF deposit. In one borehole (G15‐04) the upper 60 feet comprised of compact to very dense silty sand. Interlayers of silty gravel with sand or sand with gravel were also encountered within the SC/BCF at two borehole locations (G15‐02B, G15‐03). These interlayers ranged in thickness from 7 to 18 feet. Artesian conditions were encountered in this geologic unit approximately 135 feet below the mudline.
Dense sands and gravels. This layer is referred to as the GFo unit. The depth at which this dense sand and gravel layer was encountered varied with location, ranging from 145 feet below the mudline to approximately 200 feet below the mudline at one locations (see Borehole G15‐03), which was the maximum depth of drilling. Borehole G15‐05 encountered sands and gravels at 125 feet below the mudline. Drilling at this location was terminated before the planned depth of drilling because of very hard drilling conditions. It is not clear whether soil at the termination depth was a very dense interlayer or the older GFo unit at a much shallower elevation.
The results of these explorations are generally consistent with data collected by Terracon (2004) and PND (2008). See boring logs in Golder (2016) and soil profiles in the CH2M (2016) Geotechnical Engineering Report for more information about subsurface soil layering.
The laboratory test program for the APMP TPP was intended to supplement laboratory test information developed previously and presented by Terracon (2004) and PND (2008). The types of laboratory tests that were conducted by Golder (2016) are listed below. The reader is referred to the Golder report for detailed results.
ASTM D4220/4220M‐14: Standard Practices for Preserving and Transporting Soil Samples
ASTM D2488: Description and Identification of Soils (Visual‐Manual Practice)
ASTM D2487: Classification of Soils for Engineering Purposes
ASTM D2216: Laboratory Determination of Water (Moisture) Content of Soil and Rock by Mass
ASTM D422: Standard Test Method for Particle‐Size Analysis of Soils
ASTM D4318: Liquid Limit, Plastic Limit, and Plasticity Index of Soils
ASTM D854: Standard Test Methods for Specific Gravity of Soil Solids by Water Pycnometer
ASTM D2850: Standard Test Method for Unconsolidated‐Undrained Triaxial Compression Test on Cohesive Soils
ASTM D4767: Standard Test Method for Consolidated Undrained Triaxial Compression Test for Cohesive Soils
ASTM D4186: Standard Test Method for One‐Dimensional Consolidation Properties of Saturated Cohesive Soils Using Controlled‐Strain Loading
2.2.2 Indicator Piles Installation of the IPs provided an extensive amount of information about the penetration resistance during initial driving and restrike of the 48‐inch steel pipe piles for the three different hammers, for different pile embedment lengths, for soil conditions across the APMP site, and for different amounts of setup between initial driving and restrike. Most of the quantitative information was collected during monitoring with the PDA by RMDT for the hydraulic and diesel impact hammers. Other information collection during the program included impact hammer blowcounts during driving and elapsed time of driving for each pile. Blowcount information was recorded with a Saximeter.
GEOTECHNICAL AND PILE INSTALLATION
24 CN‐RPT‐001‐FINALRPTOFFINDINGS.DOCX
The Contractor estimated that it would take the hydraulic hammer from less than 10 minutes to as many as 50 minutes to reach the termination depths, with the hammer operating at 50 blows per minute (b/min); actual driving times ranged from approximately 30 to 45 minutes. The diesel impact hammer was estimated to reach termination depth at less than 10 to slightly more than 50 minutes; actual driving times ranged from 35 to 50 minutes. These durations varied according to both the planned depth to the bearing layer and the operation of the hammer. The only information collected during the vibratory pile installation was the time that it took the vibratory hammer to drive the pile approximately 50 feet beyond the depth of self‐weight penetration. The report prepared by RMDT (2016) summarizes these results.
Information from the PDA monitoring program included average transferred energy, computed ram stroke for the diesel impact hammer, and the compressive stress (Table 5). These results show that the 48‐inch pipe piles could be driven with either the APE 15‐4 hydraulic impact hammer or the APE 180‐42 diesel impact hammer to the required termination depth in the GFo bearing layer. Blowcounts and compressive stresses during initial driving were within acceptable ranges, although the lower energy of the hydraulic hammer (IP‐1, IP‐3, IP‐6, and IP‐10) was evident in the higher blowcounts at termination and the much lower transferred energy, relative to the rest of the piles driven with the APE D180‐42 diesel impact hammer (Table 5).
Table 5. Summary of results from pile driving monitoring and analysis (RMDT 2016).
Pile Test Approx. Depth Below Mud‐Line
(ft)
Approximate Penetration Resistance blows/set
Average Transfer Energy (EMX)
kip‐ft
Computed Ram Stroke
(STK) ft
Compressive Stress (CSX)
ksi
IP 3, Loc. 1 Drive 149 72/ft 96 NA 22
IP 4, Loc. 1 Drive 149 30/ft 226 9.7 29
IP 2, Loc. 4 Drive 141 16/ft 226 9.7 30
IP 5, Loc. 4 Drive 144 23/ft 239 10.0 29
IP 6, Loc. 4 Drive 129 84/ft 132 8.9 23
IP 1, Loc. 5 Drive 128 54/ft 89 NA 21
IP 7, Loc. 5 Drive 139 22/ft 236 9.9 29
IP 8, Loc. 6 Drive 105 31/3" 97 NA 22
IP 9, Loc. 6 Drive 115 37/ft 206 9.2 27
IP 10, Loc. 6 Drive 113 77/ft 110 NA 30
As part of the PDA testing program, RMDT performed CAPWAP analyses to estimate the capacity of each IP at End of Initial Driving (EOID) and at Beginning of Restrike (BOR). A summary of these results is given in Table 6. Results of the CAPWAP analyses in Table 6 show several important findings.
First, the total capacity of the piles was highly variable, with total capacities immediately after driving ranging from 690 kips to 1,750 kips. As expected, the lowest capacities were obtained in IP‐1 and IP‐6, which were not driven to the GFo bearing layer.
The second important observation is that more capacity was developed from skin friction than from end bearing. This observation meant that the piles did not plug when they reached the GFo bearing layer – meaning that end bearing was limited to a combination of internal skin friction of the plug and the bearing of the pipe annulus. Piles were typically driven from one to two pile diameters into the GFo layer, and therefore, the limited end bearing was likely affected by the amount of
GEOTECHNICAL AND PILE INSTALLATION
CN‐RPT‐001‐FINALRPTOFFINDINGS.DOCX 25
penetration into the GFo layer. The penetration into the GFo layer was limited because of concerns of punching through the layer into an older SC/BCF clay unit.
The third observation deals with the setup that occurred. The setup resulted in a substantial increase in total capacity – by a factor of at least 1.9 and to as much as 3.7. The average increase for piles tipped in the GFo (i.e., all but IP‐1 and IP‐6) was by a factor of 2.4. The increase for side friction varied by a factor of 2.4 to 4, while the increase for end bearing ranged from no increase to a factor of 2.9. The higher increase in side friction is not surprising, given the predominance of silts and clays along the side of the piles versus predominantly sands and gravels in the GFo at the toe of the pile.
The setup for the piles occurred over a period of 13 to 38 days. As noted before, different setup periods resulted as the Contractor optimized its driving operations. Although the setup generally showed increasing setup with the number of days, the trend in data was very scattered and could not be used to develop any formal prediction method.
Three other observations were made from the results of the dynamic testing obtained by RMDT:
Response of the pile with the bearing plate at 80 feet above the toe (IP‐6) did not show a significant improvement in capacity relative to the other pile stopped in the SC/BCF (IP‐1). However, as noted by RMDT in their report (RMDT, 2016), the intepretation of PDA data for the pile with the plate was difficult, because of wave reflections from the plate. This observation also suggested that the amount of energy reaching the toe of the pile with the bearing plate was less than without, and this may have contributed to the high driving resistance for this pile. It is also unclear whether the 80 feet of soil within the pile was sufficiently incompressible to serve as a rigid plug. Locating the plate closer to the toe of the pile may have addressed this potential issue.
Table 6. Results of CAPWAP Analyses (RMDT 2016).
Pile Hammer1 Test Approx. Depth
in Soil (ft)
Setup Duration (days)
Reported Penetration Resistance blows/set
Computed Soil Resistance, kips
Total Shaft Toe
IP 3 L1 APE 15‐4 EOID 149 ‐ 64/ft 1240 840 400
D180‐42 BOR 149 13 ~43/in 2900 2500 400
IP 4 L1 D180‐42 EOID 149 ‐ 30/ft 1070 940 130
D180‐42 BOR 149 33 10/in 2550 2270 280
IP 2 L4 D180‐42 EOID 141 ‐ 16/ft 1210 780 430
D180‐42 BOR/1 141 21 22/in 2760 1940 820
D180‐42 BOR/2 141 21 + 12 10/in 3420 2420 1000
IP 5 L4 D180‐42 EOID 144 ‐ 23/ft 1340 840 500
D180‐42 BOR 144 22 28/in 3560 2360 1200
IP 6 L4 D180‐42 EOID 129 ‐ 84/ft 900 580 320
D180‐42 BOR/1 129 20 4/in 2060 1580 470
D180‐42 BOR/2 129 20 5/in 1790 1360 430
D180‐42 BOR/3 129 20 6/in 1590 1170 410
GEOTECHNICAL AND PILE INSTALLATION
26 CN‐RPT‐001‐FINALRPTOFFINDINGS.DOCX
Pile Hammer1 Test Approx. Depth
in Soil (ft)
Setup Duration (days)
Reported Penetration Resistance blows/set
Computed Soil Resistance, kips
Total Shaft Toe
IP 1 L5 APE 15‐4 EOID 128 ‐ 54/ft 690 500 190
D180‐42 BOR 128 14 5/in 2450 1900 550
IP 7 L5 D180‐42 EOID 139 ‐ 22/ft 1750 800 850
D180‐42 BOR 139 14 21/in 3900 2960 940
IP 8 L6 APE 15‐4 EOID 105 ‐ 31/3 in 1160 880 280
D180‐42 BOR 105 38 7/in 2780 2450 330
IP 9 L6 D180‐42 EOID 115 ‐ 37/ft 1310 820 490
D180‐42 BOR 115 34 20/in 4030 3310 720
IP 10 L6 APE 15‐4 EOID 113 ‐ 77/ft 1190 610 580
D180‐42 BOR 113 15 5/in 2220 1590 630
Notes: EOID = End of Initial Drive BOR = Beginning of Restrike
The soil plug within the pile was also monitored during the driving program. This monitoring involved sounding the location of the soil within the pile relative to the mudline outside the pile. If the soil inside the pile was much lower than the outside mudline, either a soil plug or partial plug would have occurred. Results of this monitoring found that the soil inside the pile was at or slightly above the mudline on the outside of the pile, indicating that the soil friction within the pile was less than the resistance developed for a fully plugged pile, during both initial driving and restrike.
Unit skin friction values obtained from the TPP range from approximately 1 to over 2 kips per square foot (ksf) with an average unit skin friction of 1.4 ksf. These values are in the same range as those interpreted from the test program conducted at POL 2 in 1994 (CH2M HILL, 1994). The 1994 test program was conducted on four IPs that ranged in size from 24 inch to 36 inch outer diameter.
2.3 Recommendations Moving Forward The geotechnical exploration information and IP results obtained during the TPP provide valuable information for the design and construction of the over‐water terminal facilities for the APMP. Both the exploration program conducted by Golder and the monitoring during pile driving performed by RMDT should be provided to future designers and contractors – with requirements that the information be reviewed in detail when finalizing designs and planning construction. The APMP TPP results can also be used to supplement information obtained previously by PND (2008) and Terracon (2004) for design of the PIEP.
No immediate requirements have been identified for additional geotechnical work associated with this phase of the APMP. However, as future requests for proposal are developed for final design and construction packages, the following conclusions and observations from the geotechnical exploration and IP test programs should be integrated into contract documents:
1. Additional geotechnical exploration data are needed along the face of the new wharves and along the trestles. There are several reasons that this additional information is needed. The first
GEOTECHNICAL AND PILE INSTALLATION
CN‐RPT‐001‐FINALRPTOFFINDINGS.DOCX 27
is that the location of the GFo bearing layer is deeper in some locations than originally thought. Any design approach that requires seating the piles into the GFo bearing layer will need to evaluate this need. Part of the evaluation should consider the local thickness of the GFo bearing layer and the potential for “punching through” into the underlying SC/BCF layer. Furthermore, although the APMP site generally consists of an upper tidal silt deposit overlying a deep deposit of SC/BCF, the DOR will need to anticipate that interlayers of sands and gravels will occur randomly within the profile. These conditions could lead to hard driving conditions when encountered. Further, they could be the source of artesian pressures.
2. Additional exploration information is required along the trestle alignments and within the footprint of the PCT. The objectives of the future explorations should be to confirm the location and thickness of the bearing layer below the wharf and trestle. Although there is extensive existing information from the PIEP exploration work, there is a gap between most of the existing data and where the PCT trestle would cross to the backlands. This need is particularly important for the planned location of the PCT. The closest information at this terminal structure is located at some distance from or is not sufficient in depth to confirm the thickness of the GFo bearing layer. This deficiency introduces uncertainties in whether production piles can be terminated in layers encountered during the TPP or there is a possibility that the piles must be driven much deeper.
3. Further consideration should be given to the need for driving production piles to the GFo bearing layer. Results of the TPP showed substantial setup in the SC/BCF over the 13 to 38 day period of setup. It may be possible with further evaluation to meet axial load demands within the SC/BCF. If this approach is considered by the DOR, most likely additional pile testing would be required to confirm the capacity of the driven piles. The type of confirmatory testing should involve a full scale static axial load test program, where one or more fully‐instrumented IPs are loaded to failure. These tests would ideally be located in proximity to the new wharf face; however, it is possible that tests in the backlands could be conducted to provide sufficient information to support not driving to the GFo bearing layer.
4. Steel piles of the size used for the APMP TPP can be efficiently driven open ended to depths below the mudline of 150 feet or more. Either hydraulic or diesel hammers can be used to drive open‐end pipe piles at the APMP project site; however, for efficiency in driving, and particularly if the pile is driven to the GFo bearing layer, the size of any hydraulic hammer should be larger than the APE 15‐4 hammer used during this program. The APE D180‐42 diesel hammer was appropriately sized for both initial driving and restrike. Future construction plans should also incorporate dynamic monitoring with a PDA, similar to what was done for the TPP. Information from the PDA program provides valuable data on the operation of the hammer, as well as confirmation on the axial capacities of the piles.
5. More consideration will have to be given to the use of a bearing plate to force a soil plug before this approach is used again. It was apparent that having the bearing plate located approximately 80 feet from the pile toe had no measureable benefit in the capacity development. It is possible, however, that if the bearing plate had been located close to the end of the pile, say within 10 feet, better success would have been realized. This location would result in harder driving, requiring the contractor to consider whether the APE D180‐42 hammer size is sufficient for driving the pile.
6. The TPP included provisions for a cutting shoe at the toe of the pile. The intent of the cutting shoe was to make driving easier. Experience from the TPP was, however, that cutting shoes were not required for the hammers used during the TPP. When the soil plug location was monitored after initial driving and after restrike, the plug stayed at or slightly above the existing
GEOTECHNICAL AND PILE INSTALLATION
28 CN‐RPT‐001‐FINALRPTOFFINDINGS.DOCX
mudline, suggesting that sufficient remolding of soil at the interior interface between the soil plug wall and pile wall occurs to limit driving resistance.
MARINE MAMMAL MONITORING
CN‐RPT‐001‐FINALRPTOFFINDINGS 29
Marine Mammal Monitoring A marine mammal monitoring program was implemented in accordance with the TPP’s permits and authorizations. The monitoring program was designed to avoid the potential for injury to marine mammals from exposure to elevated noise levels produced by the TPP’s pile installation activities as defined under the Marine Mammal Protection Act (MMPA). Two marine mammal populations that have been documented at the POA are listed under the U.S. Endangered Species Act (ESA) and therefore, required additional consideration. The Cook Inlet population of belugas whales (Delphinapterus leucas), which occurs in the POA project area, is listed as Endangered under the ESA. Critical habitat for the listed population has been designated in Cook Inlet and surrounds the POA; however, the POA, the adjacent navigation channel, and the turning basin were excluded from critical habitat designation due to national security reasons (76 FR 20180). The Cook Inlet beluga whale population comprises about 340 individuals and they can be observed in the project area in spring, summer, and early fall. The second ESA‐listed population that has been observed at the POA is the western Distinct Population Segment (DPS) of Steller sea lion (Eumetopias jubatus), which is listed as Endangered. Steller sea lion occurrence in the project area has been documented on two occasions but is considered rare.
Harbor seals (Phoca vitulina) are occasionally observed in Knik Arm and in the vicinity of the POA, primarily near the mouth of Ship Creek. Harbor porpoises (Phocoena phocoena) are observed in most years in low numbers near the POA and in Knik Arm. Killer whales (Orcinus orca) have not been observed in Knik Arm or at the POA, but are known to occur in upper Cook Inlet, and could occur in the POA project area. Other marine mammals are not known to occur in Knik Arm. More detailed information on the occurrence of marine mammals in the POA project area is summarized in the TPP IHA application (HDR 2015a).
3.1 Methods and Permit Requirements Marine mammal monitoring during the TPP was conducted by a specialty subcontractor working under the construction Contractor. The Contractor selected AECOM as its sub‐consultant to complete this work, and AECOM then contracted with Alaska Pacific University. Methodology and results from the marine mammal monitoring program are provided in Cornick and Seagars (2016).
The marine mammal monitoring program was implemented in accordance with the project’s IHA (NMFS 2016b), Marine Mammal Monitoring and Mitigation Plan (4MP; HDR Inc. 2015b), and Incidental Take Statement (ITS; NMFS 2016a). For some components of the marine mammal monitoring program, the mitigation measures implemented by the TPP were more conservative, e.g., more protective of beluga whales and other marine mammals, than were required by permit conditions.
Mitigation measures, including the sizes of the marine mammal monitoring zones, were established during the process of applying for an IHA with NMFS. NMFS requires applicants to determine the numbers of marine mammals that are expected to be incidentally harassed by an action and the nature of the harassment (Level A or Level B). Level A harassment is defined as “Any act of pursuit, torment, or annoyance which has the potential to injure a marine mammal or marine mammal stock in the wild.” Level B harassment is defined as “Any act of pursuit, torment, or annoyance which has the potential to disturb a marine mammal or marine mammal stock in the wild by causing disruption of behavioral patterns, including but not limited to migration, breathing, nursing, breeding, feeding or sheltering.”
NMFS uses “do‐not‐exceed” criteria as thresholds for exposure of marine mammals to various underwater sound sources and levels to quantify the levels of harassment (Table 7). The thresholds vary with type of sound (impulsive or continuous), marine mammal group (pinnipeds or cetaceans), and level of harassment (Level A Injury or Level B disturbance). Impact pile installation is considered impulsive; vibratory pile installation is considered continuous.
MARINE MAMMAL MONITORING
30 CN‐RPT‐001‐FINALRPTOFFINDINGS.DOCX
Table 7. Summary of underwater acoustic criteria for exposure of marine mammals to noise from continuous and pulsed sound sources.
Species
Underwater Noise Thresholds
(dB re 1µPa)
Vibratory Pile Installation Level B
Disturbance Threshold
Impact Pile Installation Level B
Disturbance Threshold
Level A Injury
Threshold Frequency Range
Cetaceans 120 dB rms 160 dB rms 180 dB rms
7 Hz to 20 kHz (Low)
150 Hz to 20 kHz (Mid)
200 Hz to 20 kHz (High)
Pinnipeds 120 dB rms 160 dB rms 190 dB rms 75 Hz to 20 kHz
rms = root mean squared
The sizes of the Level A and Level B harassment zones for the TPP were determined by modeling the predicted sound levels as defined by the harassment levels for the different marine mammal groups (pinnipeds and cetaceans). The distances at which those sound level thresholds were reached were established as the radii of the Level A and Level B monitoring zones (Table 8).
Table 8. Distances to NMFS’ Level A injury and Level B harassment thresholds (isopleths) for a 48‐inch‐diameter pile, assuming a 125‐dB background noise level and log 15 as the transmission loss value.
Pile diameter (inches)
Impact Vibratory
Pinniped, Level A Injury
Cetacean, Level A Injury
Level B Harassment
Pinniped, Level A Injury
Cetacean, Level A Injury
Level B Harassment
190 dB 180 dB 160 dB 190 dB 180 dB 125 dB
48, unattenuated
14 m 63 m 1,359 m <10 m <10 m 3,981 m
During discussions with NMFS, it was agreed that, during installation of piles with a NAS, the isopleths would be reduced in size to reflect the anticipated reductions in noise levels (NMFS 2016b). The harassment zones that were established and monitored for the TPP therefore varied by type of installation (vibratory or impact), type of marine mammal (pinniped, beluga whale, or other cetacean) and whether a pile was treated with a NAS (NMFS 2016b; Table 9).
Table 9. Marine mammal monitoring zones, Level A or shutdown zones, and Level B harassment zones authorized by NMFS for the TPP.
Pile Activity
Attenuated Piles Unattenuated Piles
Level A or Shutdown Level B Level A or Shutdown Level B
Belugas Other marine
mammals Belugas
Other marine
mammals Belugas
Other marine
mammals Belugas
Other marine
mammals
Vibratory 900 m 100 m 4,000 m 4,000 m 4,000 m 100 m None 4,000 m
Impact 300 m 100 m 1,400 m 1,400 m 1,400 m 100 m None 1,400 m
MARINE MAMMAL MONITORING
CN‐RPT‐001‐FINALRPTOFFINDINGS.DOCX 31
Authorized Level B take for Cook Inlet beluga whales was 26 individuals. Authorized take numbers for other species ranged from 6 Steller sea lions from the wDPS to 62 harbor seals (NMFS 2016b; Table 10).
Table 10. Numbers of Level B takes for marine mammals authorized by NMFS for the TPP.
DPS or Stock Authorized Level B Take by Harassment
Cook Inlet beluga whale 26
Killer whale 8
Harbor porpoise 31
Harbor seal 62
Western DPS, Steller sea lion 6
3.2 Results and Implementation
3.2.1 Marine mammal monitoring The monitoring strategy outlined in the 4MP and IHA required that four Marine Mammal Observers (MMOs) work concurrently in rotating shifts to provide full coverage for marine mammal monitoring; the number of required observation stations was not specified in recognition that project specifics were still evolving during the authorization process. Final pile installation locations for the TPP were spread along the wharf face across a kilometer (km)‐long distance, and pile installation rotated among the four in‐water work sites. Given these conditions, the Contractor determined that using two stationary monitoring stations and additional MMOs would lower the project’s risk of taking marine mammals, especially beluga whales.
Therefore, monitoring for marine mammals was conducted from three locations: 1) the Ship Creek Boat Launch (Anchorage Public Boat Dock) to the south of POA harbor, 2) the North Extension area at the northern end of the POA, and 3) from a single mobile observer (rover) generally stationed near the pile driving activity. The rover moved from location to location with pile installation, and focused on observing the area surrounding the active work site. The two stationary observation platforms were elevated approximately 10 feet (3 m) above the shoreline to improve the MMOs’ ability to see greater distances. Each of the stationary observation platforms was staffed by four trained MMOs. One of the four MMOs at each location was the lead and had extensive experience in marine mammal observing; a single field lead was also designated.
Boat‐based monitoring was an option for the TPP as outlined in the 4MP. Placement of an MMO on the hydroacoustic monitoring vessel was deemed unnecessary during the TPP because the harassment zones could be adequately monitored from shore, especially with three active observation stations. To enhance the project’s responsiveness to the potential presence of a marine mammal, the hydroacoustic monitoring crew was directed to call the construction supervisor immediately if a marine mammal of any species was observed during hydroacoustic monitoring.
MMOs actively monitored for marine mammals from 30 minutes prior to the start of pile installation to 30 minutes after pile installation was complete. They also observed during pile re‐strikes. Marine mammal monitoring was limited to daylight hours, when the zones could be adequately observed in their entirety. The four MMOs at each station rotated between actively monitoring and resting to prevent fatigue. The marine mammal harassment and shut‐down zones were continuously monitored using binoculars (Bushnell 7x50 or Nikon Monarch ATB 10x42). In addition, the monitoring station located at the Ship Creek Boat Launch was outfitted with Celestron 25x70 long‐range binoculars.
MARINE MAMMAL MONITORING
32 CN‐RPT‐001‐FINALRPTOFFINDINGS.DOCX
Once sighted, locations of marine mammals were attributed to pre‐established grid cells displayed on hard‐copy maps and denoted as either within or outside the harassment and shut‐down zones. A surveyor’s theodolite was used to collect GPS locations when animals were in view long enough to obtain a theodolite fix.
3.2.2 Monitoring zones During installation of the first pile, which used the resonator NAS, a project acoustician collected initial measurements of noise levels at a location very near the active construction site. In the absence of a site‐specific model for sound propagation, there was some concern that the noise levels at greater distances could potentially exceed the levels modeled during the authorization process. In an abundance of caution, the shutdown zone for the next two piles (IP9 and IP4) was expanded to the zone size for unattenuated piles of 4,000 m (Table 9). For the fifth pile (IP2), a 3,000‐meter shutdown zone was implemented. No marine mammals approached or entered the expanded shutdown zone during this time, and no shutdowns were implemented.
As additional noise measurements were collected and analyzed, it became clear that noise levels did not exceed levels authorized by NMFS, and that the shutdown and Level B zones for attenuated piles were adequately protective of marine mammals when a NAS was deployed. At that time, the TPP implemented the Level B and shutdown zones for attenuated piles and unattenuated piles as authorized by NMFS (Table 9).
These decisions are supported by estimates of received sound levels that sighted marine mammals were exposed to during the TPP while pile installation was in progress. Using the distance of a sighted marine mammal from the location of pile installation, JASCO Applied Sciences made an estimate of received sound levels for the pile and hammer type in use at the time of the sighting (Tables 3.2 and 3.3 in Cornick and Seagars 2016). During the TPP, four marine mammals (one beluga whale and four harbor seals) were sighted while acoustic monitoring was on‐going and were considered taken by Level B harassment based on their physical locations during pile installation. Sample size is small but estimates of received sound levels indicate exposure to sound levels commensurate with Level B harassment for three of the individuals, as anticipated. One individual, although documented as a take, was exposed to a sound level that did not rise to the level of harassment.
For an additional discussion of hydroacoustic monitoring results, see Section 5.
3.2.3 Communication Communication among the MMOs, hydroacoustic monitoring vessel, and the Contractor was achieved using hand‐held radios and cell phones. The lead MMO was the primary point of contact between the pile drivers and other MMOs. If a marine mammal was observed approaching or within an applicable harassment zone (see NMFS 2016b), the lead MMO would communicate recommended actions directly to the construction crew supervisor.
3.2.4 Takes A total of 44 marine mammal sightings were documented during the TPP: 10 beluga whales, 6 Steller sea lions, and 28 harbor seals. An unidentified whale carcass was also observed and reported to NMFS. All marine mammals were observed by the land‐based MMOs; no sightings were reported by the hydroacoustic monitoring vessel.
When a marine mammal was located within a Level B harassment zone during active pile installation, both vibratory and impact, it was considered a “take” under the MMPA (MMPA). During the TPP, there were nine Level B takes, including one beluga whale, one Steller sea lion, and seven harbor seals. All takes were within the allowable limits permitted in the IHA (Table 10; NMFS 2016b).
MARINE MAMMAL MONITORING
CN‐RPT‐001‐FINALRPTOFFINDINGS.DOCX 33
On 25 May 2016, a gray beluga whale surfaced in the Level B harassment zone at 11:02 am, about 1,300 m from vibratory pile installation with the bubble curtain. The beluga whale was traveling north as it passed the construction area, and its closest approach to pile installation was fixed with the theodolite at about 238 m. It exited the Level B zone at 11:05 am and continued north, leaving the monitoring zone. It was last sighted at 11:15 am before it swam out of sight, for a total tracking time of 13 minutes. No abrupt changes in behavior were observed. Pile installation was not shut down because the beluga whale did not enter the 900‐meter shutdown zone for attenuated vibratory pile installation. This beluga whale was documented as a Level B take. Sighting conditions at the time of the take were rated as excellent.
A shut‐down was recommended by the MMOs and implemented by the Contractor on 18 May 2016 due to poor weather conditions and reduced visibility. The Contractor shut down vibratory pile installation, which was near completion anyway, and prepared for impact installation of the same pile while the MMOs conducted the 30‐minute post‐strike monitoring period. Visibility returned after a shutdown period of 22 minutes. No other shut‐downs were recommended during the TPP.
On 25 May 2016, a beluga whale was observed in the Level A shut‐downzone within the 30 minute pre‐strike monitoring period prior to pile installation. Because mechanical adjustments were necessary to equipment, no delay of pile installation was required and the individual beluga whale was last observed 2 hours and 49 minutes prior to pile installation; therefore, no take for this beluga whale was recorded.
3.2.5 Marine mammal presence Consistent with other years of marine mammal observations during POA construction activities, beluga whales were not observed during the TPP in June (Cornick and Seagars 2016). The 10 sightings of beluga whales that occurred were all in May. Aerial surveys conducted by NMFS have also found that beluga whale use of Kink Arm is very limited in June (Shelden et al. 2015).
In contrast, harbor seals numbers increased throughout the TPP, and harbor seals were present in low but consistent numbers throughout June (Cornick and Seagars 2016). Their movements were concentrated around the mouth of Ship Creek, near the south observation station, where they were likely attracted to the incoming salmon runs.
3.3 Recommendations Moving Forward The marine mammal monitoring program during the TPP provided valuable information to guide future marine mammal monitoring programs during the APMP. The following findings are important considerations for future APMP phases:
The design and locations of the observation stations were sufficient to meet the TPP’s needs. The number and locations of observation stations for the next phase of the APMP will depend on the sizes of the monitoring zones and the location of in‐water work. In‐water work will be concentrated in a single location, which may reduce the need for more than a single observation station. Similarly, a more mobile platform could be re‐located as needed to maximize visibility of the monitoring zones and reduce the number of MMOs.
A minimum of three MMOs at an observation station is necessary to prevent fatigue and increase accuracy of detecting marine mammals, especially for large‐radius zones. When using three MMOs, one MMO is observing, one MMO is recording data (and observing when there are no data to record), and the third MMO is resting. A fourth MMO allows the scanning of a 90‐degree arc, instead of a 180‐degree arc, increasing scan intensity and the likelihood of detecting marine mammals. Thirty to 60 minute rotations work well with this schedule.
MARINE MAMMAL MONITORING
34 CN‐RPT‐001‐FINALRPTOFFINDINGS.DOCX
A solo MMO is not recommended. All project‐associated events should be witnessed and reported on by more than one observer.
Communications between the pile driving/construction contractor and the MMOs should take place between one dedicated point of contact, or Lead MMO, for each shift.
The 25‐power, long range binoculars were superior to 7‐ and 10‐power binoculars at allowing detection and identification of marine mammals at greater distances. It is recommended that each observation station employ a pair of 25‐power binoculars.
Electronic data collection methods should be considered. iPad applications and other technological advances make it possible to collect data quickly and accurately. A theodolite can be plugged into the device and marine mammal locations can be calculated on the spot, minimizing uncertainty. Data can be downloaded throughout the day to a database, eliminating the need for data entry by hand, and allowing quicker data assessment.
Hard copy maps with pre‐established grid‐cells and harassment zones specific to the pile location being driven were invaluable. These maps allowed for immediate, accurate and consistent identification of marine mammal locations relative to the harassment zones, regardless of observation station.
Numbers of marine mammals, including beluga whales, are typically low in May and June in Knik Arm. Numbers of beluga whales are known to increase in Knik Arm during the August through November time frame.
HYDROACOUSTIC MONITORING
CN‐RPT‐001‐FINALRPTOFFINDINGS.DOCX 35
Hydroacoustic Monitoring Hydroacoustic monitoring for the TPP was carried out during installation of each test pile. Autonomous sound recorders were deployed at nominal distances of 10 m and 1‐km from each pile during installation, and a mobile hydrophone system drifted during measurements to target data collection at ranges corresponding to marine mammal disturbance thresholds. Ambient sound recordings were measured at two locations during a 3‐day break in pile installation activities. Details for this monitoring program are summarized in the following subsections.
4.1 Methods Data collection and analysis methods for the POA TPP were compliant with NMFS’ guidance on hydroacoustic monitoring (NMFS 2012a, 2012b, 2012c). Compliance included the availability and use of equipment, such as moorings, recording systems, hydrophones, a vessel, and other hardware and software as required to meet the specifications outlined in the NMFS‐approved TPP Hydroacoustic Monitoring Framework (HDR Inc. 2015c) and the three NMFS guidance documents.
Detailed methods and results for the TPP hydroacoustic monitoring program can be found in Austin et al. 2016.
4.1.1 Measurement Methods Two types of hydroacoustic measurements were made: fixed position and variable drift positions. The fixed position measurements were conducted autonomously at two locations using JASCO Autonomous Multichannel Acoustic Recorders (AMARs). These units were nominally positioned 10 m (AMAR‐10M) and 1‐km (AMAR‐1KM) away from the pile being driven and deployed such that the hydrophones were 0.6 meter above a mooring base plate that rested on the bottom of the Cook Inlet. Each unit consisted of two hydrophones and recording systems set to different sensitivities. The hydrophones were protected with a shroud to minimize noise artifacts due to water flow. Acoustic data were stored on internal solid‐state flash memory for later processing. The variable distance measurements were collected on a vessel drifting freely with two hydrophones suspended to a depth of 10 m below the water surface. A leaded line was secured to the cable to cause the cable to hang vertically in the water during measurements. The data were displayed in real‐time and digitally recorded. Calibrations were performed on both types of systems before and after each deployment using a G.R.A.S 42AC pistonphone calibrator and hydrophone adaptor.
AMAR‐1KM was deployed as close as practicable to the period of slack current preceding pile driving activities. AMAR‐10M was deployed when the derrick barge was in final position, generally in the morning prior to the beginning of pile driving. Drift measurements were collected when pile driving activities were underway. Concurrent with acoustic measurements, a marine GPS collected location tracks with sample intervals of 2 seconds. Ambient sound levels were also recorded continuously during a 72‐hour period when there were no pile driving activities. One AMAR was deployed at a location just south of Pile Location 5 (Ambient‐Dock) and the other at a nominal offshore position (Ambient‐Offshore) near where the AMAR‐1KM recordings were made.
4.1.2 Data Analysis The recorded signals were filtered with a bandpass filter with a pass‐band from 15 Hz to 20,000 Hz. The 15 Hz low‐frequency cutoff was selected to remove flow noise contamination from the recordings and the 20,000 Hz high‐frequency cutoff was selected following NMFS Northwest Region 2012 Guidance Document for Sound Propagation Modeling to Characterize Pile Driving Sounds Relevant to Marine Mammals. The reported root mean squared (RMS) sound levels for the vibratory driving were calculated
HYDROACOUSTIC MONITORING
36 CN‐RPT‐001‐FINALRPTOFFINDINGS.DOCX
over 10 second intervals. For impact pile driving, individual strike records were detected and used to trigger 0.7 second long windows to contain the strike. The 90 percent energy window was determined from the 0.7 second detection, and RMS Sound Pressure Level (SPL) metrics were computed over the 90 percent window. In addition the 90 percent RMS level, single‐strike sound exposure level (SEL), and peak SPL were also calculated. The single‐strike SELs received from the fixed AMARs were summed on a linear scale to yield cumulative SELs for each pile.
Transmission loss (TL) coefficients (n) were determined according to the equation:
RnSLRL log
where RL is the received level, SL is the source level, and R is distance between the source and receiver. An example of this is shown in Figure 10 for RMS data for Pile IP7. The regressions were performed for a sub‐set of the recordings when pile driving levels received at AMAR‐10M were relatively consistent and when the signal recorded at AMAR‐DRIFT and AMAR‐1KM sufficiently exceeded background levels. The TL coefficients were then used in the above equation to back‐calculate the SL statistics based on the mean, median, and 90th percentile RL computed from the full record of data from AMAR‐10M at range R. The ranges to marine mammal impact threshold levels were computed from the source level statistics and TL coefficients for each pile using this same equation. The values for RL at a 10‐m range were calculated using this equation for direct comparison of the pile driving sound sources for the 10 IPs. The analysis was used to calculate the TL coefficients for the SEL data.
4.2 Results Hydroacoustic measurements were obtained for each type of pile hammer and for each of the noise suppression systems. Measurements were also obtained for ambient conditions to establish a baseline. These results are discussed below.
Figure 10. Pile IP7: Plot of peak SPL, RMS SPL, and SEL versus range for diesel impact driving.
HYDROACOUSTIC MONITORING
CN‐RPT‐001‐FINALRPTOFFINDINGS.DOCX 37
4.2.1 Ambient Noise Levels The median values of the background SPLs from 60 second averages as measured within the POA at location Ambient‐Dock and in Cook Inlet at location Ambient‐Offshore are summarized in Table 11. In addition to the unweighted levels, the frequency weighted levels for the different marine mammals are also provided where LFC = low‐frequency cetacean, MFC = mid‐frequency cetacean, HFC=high‐frequency cetacean and PPW=pinnipeds in water. LFC levels are virtually the same as the unweighted levels (Table 11). For the other weightings, the levels are lower than the unweighted levels by 3.1 to 7.6 dB. During the measurements some normal activities were noted such as noise from current flow at Ambient‐Dock and the passage of vessels at Ambient‐Offshore. Throughout the data set, the Ambient‐Offshore levels are consistently higher than the Ambient‐Dock by 3.4 to 5.3 dB. Although different noise metrics were measured (Ln and mean levels), the median levels are thought to be the most appropriate characterization of the nominal ambient conditions. A diurnal pattern to the ambient sound data was not apparent.
Table 11. Ambient noise levels.
Location
SPL (dB re 1 µPa)
Unweighted LFC MFC HFC PPW
Ambient‐Dock 117.0 117.2 111.9 110.9 113.9
Ambient‐Offshore 122.2 122.5 115.4 114.6 117.3
4.2.2 Pile Installation
4.2.2.1 Average RMS Results for Pile Driving Methods
The RMS results of the pile driving measurements were grouped by the type of hammer used and by the type of the NAS. The average values expressed are for median near‐source levels at 10 m, the noise reduction due to the NAS methods, and the calculated distance to the marine mammal thresholds. The results for the RMS sound levels are presented in Tables 12, 13, and 14 with the number of samples (n) included in the average indicated.
Table 12. Median received RMS levels at 10 m for impact and vibratory pile driving, averaged over n available data samples.
Hammer Type RMS Sound Pressure Level at 10 m Range (dB re 1 µPa)
Table 13. Reduction of the median received RMS levels at 10 m for impact and vibratory pile driving compared to the un‐attenuated values, averaged over n available data samples.
Hammer Type Average RMS Noise Reduction, dB
Resonator NAS Bubble Curtain NAS
Hydraulic Impact 6 (n=2) 12 (n=3)
Diesel Impact 6 (n=3) 9 (n=2)
Vibratory 8 (n=4) 9 (n=4)
Table 14. Median range to marine mammal RMS thresholds of 160 dB re 1 µPa for impact pile driving and 125 dB re 1 µPa for vibratory pile driving, averaged over n data samples and excluding data from extrapolation of measured levels.
Hammer Type Distance to Marine Mammal RMS Threshold, m
Unattenuated Resonator NAS Bubble Curtain NAS
Hydraulic Impact 1504 (n=1) 1053 (n=1) 952 (n=2)
Diesel Impact 1611 (n=1) 1306 (n=1) 698 (n=2)
Vibratory 4342 (n=1) 2015 (n=2) 1983 (n=3)
The highest median unattenuated received levels at 10‐m range (Table 13) were obtained by the hydraulic impact hammer with an average value of 201.8 dB re 1 µPa. For the diesel impact and vibratory hammers, the levels were 198.6 dB re 1 µPa and 168.2 dB re 1 µPa, respectively. This ordering of the 10‐m results is maintained regardless of which type of NAS is used. The application of the two NAS devices reduced the 10‐m levels for each type of hammer. As shown in Table 13, reductions ranged from 6 to 12 dB depending on hammer type and NAS. For each hammer type, the bubble curtain produced more noise reduction than the resonator by 1 to 6 dB with the largest noise reduction occurring for the hydraulic hammer. The smallest difference in NAS performance (1 dB) was for vibratory driving, however, the reductions were still 8 dB for the resonators and 9 dB for the bubble curtain.
Using the TL values determined for each pile, hammer type and NAS, the distances to the marine mammal RMS criteria were calculated producing the values shown in Table 14 for the 160 dB re 1 µPa impact pile driving and 125 dB re 1 µPa vibratory pile driving criteria. The distances in this table are shown only for those cases when the calculated values were inside the range of the measured data. The results of Table 14 generally follow from the results of the previous two tables with the distances being greater for the unattenuated hammers and the bubble curtain producing shorter distances to criteria for each hammer type. It should also be noted that with the much lower criteria level, the vibratory hammer distances extend out much farther (1.5 to 2.9 times) than the impact pile driving hammers even though the 10‐m levels (Table 12) are 30 to 35 dB lower.
The effectiveness of the NASs are further addressed in Section 5.2.3.
4.2.2.2 Results for Individual Piles
The mean peak pressure, SEL, cumulative SEL (SELc), and RMS sound levels for impact driving of individual piles as measured by the autonomous AMAR units are presented in Table 15 for distances nominally at the 10‐m and 1‐km positions. For 10‐m nominal locations, the actual distances from the piles vary from 10 to 17 m. This difference in range can account for a 3.5 dB difference in sound level for
HYDROACOUSTIC MONITORING
CN‐RPT‐001‐FINALRPTOFFINDINGS.DOCX 39
an assumed TL coefficient of 15. To compare the “near‐source levels,” the levels were normalized using the TL coefficients. The numbers of strikes for each pile are also shown in Table 15. These are necessary to calculate the SELc in addition to the single strike SEL. The number of strikes per pile varies from 845 to 4,801. This would add 29.3 to 38.6 dB to the average single strike SEL depending on the pile. Review of the strikes per pile indicates a trend of the piles driven by the hydraulic hammer requiring more strikes than those driven by a diesel hammer. For the hydraulic hammer, the average number of strikes was 2,116; for the diesel hammer, it was 1,241. The large number of strikes with the hydraulic hammer is caused in large part by the much smaller energy delivered per blow. The diesel average excludes IP6, analysis of which is complicated by the bearing plate and the bubble curtain on/off test. The combination of higher sound levels and more pile strikes increases the SELc.
The TL coefficients were calculated from the RMS sound level versus distance plots such as that of Figure 10 (see Figures 64 to 76 in Austin et al. 2016). These coefficients are given in Table 16 along with median RMS level at 10 m as determined by the TL values, and the distance to the marine mammal criterion of 160 dB re 1μPa. For results of Table 16, some results from Table 15 have been excluded. For IP6, the bubble curtain NAS was installed through the entire drive and the air was shut off for a portion of the drive. The bubble encapsulating sleeve was in place when the air was off and it is not known if the presence of the sleeve had any effect on the “unattenuated” levels. As a result, only the results from the diesel hammer and bubble curtain were used in the averages for Tables 12 through 14. For pile IP3, there was concern about dredging deposits producing shielding for the 1‐km AMAR measurement as the levels were lower than the drift measurements taken at a greater distance. After some analysis of the TL values, it was decided to use the drift data only as the distant levels for the TL calculation which was identified as Path 2. For Pile IP4, measurements were made for impact pile driving using hydraulic and diesel hammers. For both sets of data, propagation effects also appeared to be factors in the 1‐km AMAR results. For the drift measurements during the hydraulic hammer driving, the effects of shoreline shielding appeared to be minimal due to the location of the drift. For the diesel hammer, the drift measurements were also apparently effected by land shielding. As a result, TL coefficients were only calculated for the hydraulic hammer data. Anomalous behavior was also found in the results of IP10. In
Table 15. Sound levels for impact driving of piles IP1 through IP10 with hammer type, NAS type, and distance.
*Pile IP6 had a bearing plate installed **Bubble curtain off, sleeve in place
HYDROACOUSTIC MONITORING
40 CN‐RPT‐001‐FINALRPTOFFINDINGS.DOCX
this case, the levels at AMAR‐10M were lower than any of the other piles and AMAR‐1‐km levels were higher. The drift results were also significantly lower than the 1‐km. In fitting these results, the 1‐km results produced a TL value well below the other piles while use of the drift results produced values more consistent with the other data. Only the drift data were used to determine the TL for this pile. For pile IP6, a bearing plate was installed on the pile and it is not known if this influenced the drive and sound levels; however, the results with the bubble curtain are retained in the averages of Tables 12 through 14.
TL coefficients ranged from13.2 for IP10 with a hydraulic hammer and bubble curtain to 19.2 for IP1, the unattenuated hydraulic hammer drive (Table 16). On average, the TL coefficients were 15.9 with a deviation of less than 0.5 for the averages of the hydraulic and diesel hammers. For the RMS levels at 10 m, the average was 193.5 dB re 1μPa with the hydraulic hammers averaging 194.2 re 1μPa and the diesel hammers averaging 192.7 dB re 1μPa. Piles driven with a resonator NAS averaged 194.1 dB re 1μPa and those with a bubble curtain NAS averaged 189.5 dB re 1μPa. Excluding IP8 and IP9, the distances to criterion ranged from 532 to 1306 m for the attenuated piles with an average of 943 m. Distances with the resonator NAS averaged 1180 m and distances with the bubble curtain averaged 825 m. For the distances to criterion reported in Table 16, the distances for IP8 and IP9 were out of the range of the drift measurements and these values were not used for the averages reported in Tables 12 through 14.
The mean RMS results from the vibratory driving of each of the piles is presented in Table 17. As with the impact pile driving, IP6 had the drive plate installed. In the second portion of the IP6 drive, the sound levels increased significantly by approximately 20 dB compared to the beginning of the drive and to the other piles. It was thought that the pile was rattling against the template in this portion of the drive and that these levels were not representative of normal pile driving. Therefore, these data were not used in further analyses.
Table 16. TL coefficients, calculated RMS levels at 10 m, and distances in meters to the Marine Mammal 160 dB re 1μPa Criterion for impact pile driving.
*Pile IP6 had a bearing plate installed **Pile IP6, second sample period had unusually high levels likely due to rattling with the template ***Levels at 1km position were contaminated with over noises and not representative of the drive
HYDROACOUSTIC MONITORING
CN‐RPT‐001‐FINALRPTOFFINDINGS.DOCX 41
As with the impact pile driving, the TL values for vibratory hammer driving were determined for plots of sound level versus distance for each pile (see Figures 77 through 87 in Austin et al. 2016). The values for the TL coefficients, median RMS level at 10 m as determined by the TL values, and the distances to the marine mammal criterion are presented in Table 18. The criteria used for this table is the 125 dB re 1μPa level. With the lower value of this criterion compared to impact driving, the number of piles for which the distance to criterion is within the range of the measured data is smaller, with only six out of the 10 piles within the range. The data from the six piles in Table 18 were used to determine the vibratory pile driving averages given in Tables 12 through 14. For the vibratory hammer, the TL coefficient ranged from 12.6 to 16.9 with an average of 15.2. For the unattenuated piles, IP1 and IP5, the average TL coefficient is 16.5. For the resonator and bubble curtain NAS, TL coefficients are 15.1 and 14.7, respectively. For the near‐source levels, the unattenuated levels averaged 168.2 dB re 1μPa while the levels for the resonator and bubble curtain NAS were 160.7 and 159.5 dB re 1μPa, respectively. For the distances to criterion values (with values outside the measurement range omitted) the average was 2,387 m including the un‐attenuated pile IP5 at 4,342 m. Without this pile, the average of the remaining attenuated piles was 2,051 m; the average for the resonator NAS piles was 2,015 m and the average for the bubble curtain piles was 1,983 m.
4.2.3 Noise Attenuation Systems
4.2.3.1 Confined air bubble system: Impact installation
Results for pile driving with the confined air bubble curtain system using the diesel hammer for piles IP6 and IP7 were compared against the unattenuated sound levels measured for pile IP5 that also used the diesel hammer. For the hydraulic hammer using the confined air bubble curtain, results for piles IP3 and IP10 were compared to the un‐attenuated condition for IP1. In addition, impact driving of Pile IP6 included a bearing plate and was assessed by turning the confined air bubble curtain on and off and reducing the flow of air at one time. The effectiveness of IP6 was considered separately based on the on and off test because there was no entire driving period that could be compared against a similar un‐attenuated condition.
The overall difference in the median sound levels for each pile and each condition at the near‐source (i.e., calculated for 10 m from the pile) were used to assess the acoustic performance of the air bubble curtain system. Only SPLs were used to evaluate NAS performance as those measurements were the focus of the IP program. SPLs are presumed to be the indicator of behavior effects that would have to be predicted for future permitting2.
2 The SEL will be used in future assessments to define areas where take conditions for marine mammals may occur.
Table 18. TL coefficients, calculated RMS levels at 10 m, and distance in meters to the Marine Mammal 125 dB re 1μPa Criterion.
RMS, dB at 10m 168.8 161.9 155.7 160.1 167.5 164.1 160.2 166.3 154.3 158.1
Dist. to 160 dB 3890* 2417 2731 1613 4342 3883* 1442 3680* 1859* 1775
*Extrapolated beyond the maximum measurement range**Pile IP6 had a bearing plate installed
HYDROACOUSTIC MONITORING
42 CN‐RPT‐001‐FINALRPTOFFINDINGS.DOCX
In addition to assessing the near‐source acoustic performance, the computed levels at 1‐km were also evaluated. The near‐source median levels and TLs were used to compute the received levels at 1‐km.
Table 19 shows the summary of sound levels for diesel impact driving when the air bubble curtain was used. While IP6 included the air bubble curtain turned off for a portion of the drive, IP5 was considered the best un‐attenuated condition. The air bubble curtain housing may have slightly attenuated sound levels when the system did not produce bubbles. SPLs decreased by about 7 and 10 dB (overall 9 dB, compared against un‐attenuated levels from IP5. At 1‐km, the decrease was less, about 4 to 8 dB.
Table 19. Summary of Median Near‐Source RMS Sound Levels with Diesel Impact Hammer and Air Bubble Curtain.
Acoustic Parameter
Median Sound Level in dB
IP5
Un‐attenuated
IP6 (on)a
Air Bubble Curtain
IP7
Air Bubble Curtain
SPL 198.6 at 10 m
163.6 at 1 km
191.2 at 10 m
159.0 at 1 km
188 at 10 m
155.5 at 1 km a For portion of IP6 driving with air bubble curtain system on.
The performance of the air bubble curtain was also evaluated using the 1/3rd‐octave band frequency spectrum shown in Figure 11. This illustrates the mostly broadband reduction provided by the air bubble curtain.
Figure 11. Median 1/3rd‐octave band levels measured at 10 m and 1 km using the diesel impact hammer with air bubble curtain.
It should be noted that the air bubble curtain was turned on, turned off, and then turned back on during impact driving of IP6. Near the source (i.e., 10 m), overall SPLs decreased by 3.4 dB when it was operating, but only by 1 dB at 1‐km. When looking specifically at the periods when the bubble curtain was off then on and then off, the decrease due to the bubble curtain was about 5 dB near the source, and only about 1 to 2 dB at 1‐km (Figure 31 of Austin et al. 2016). The frequency spectrum in Figure 12
10m
1km
HYDROACOUSTIC MONITORING
CN‐RPT‐001‐FINALRPTOFFINDINGS.DOCX 43
shows how turning the air bubbles on had only a small effect on reducing sound levels at both 10 m and 1‐km. The reduction that was provided was above 100 Hz at 10 m and above 1,000 Hz at 1‐km.
Figure 12. IP6 air bubble on and off test median 1/3rd‐octave band levels measured at 10 m and 1 km using the diesel impact hammer.
Table 20 provides the summary of sound levels for hydraulic impact driving when the air bubble curtain was used. On average, SPLs with the air bubble curtain system were 13 dB lower than un‐attenuated levels from IP5. Depending on the attenuation path, SPLs at 1‐km were 0 to 5 dB lower. Figure 13 shows the 1/3rd‐octave band sound levels associated with the hydraulic hammer and air bubble curtain. The reduction provided by the air bubble curtain was broadband with most of the reductions for sounds above 300 Hz.
Table 20. Summary of Median Near‐Source RMS Sound Levels with Hydraulic Impact Hammer and Air Bubble Curtain.
Acoustic Parameter
Median Sound Level in dB
IP1
Un‐attenuated
IP3
Air Bubble Curtain
IP10
Air Bubble Curtain
SPL 201.8 at 10 m
163.4 at 1 km
191.6 at 10 m
165.3 to 158.4 at 1 km
186.9 at 10 m
160.5 at 1 km
10m
1km
HYDROACOUSTIC MONITORING
44 CN‐RPT‐001‐FINALRPTOFFINDINGS.DOCX
Figure 13. Median 1/3rd‐octave band levels measured at 10 m and 1 km using the hydraulic impact hammer with air bubble curtain.
4.2.3.2 Confined air bubble system: Vibratory installation
The overall differences in the median SPLs for each pile and each condition at the near‐source (i.e., 10 m from the pile) were used to assess the acoustic performance of the air bubble curtain system. Performance was also assessed at 1‐km. Un‐attenuated conditions for piles IP1 and IP5 were compared with piles IP3, IP7 and IP10 when the air bubble curtain was used. Since a portion of the vibratory driving for IP6 was not used in the analysis, results for that pile were not used to assess air bubble curtain performance.
Table 21 shows the summary of sound levels for vibratory driving when the air bubble curtain was used. Near‐source levels with the air bubble curtain were, on average, 10 dB lower than un‐attenuated conditions. Farther away, at 1‐km, the decrease was computed as 5 to 7 dB. The 1/3rd‐octave band frequency spectrum shown Figure 14 illustrates the fairly broadband reduction (most notably above about 100 Hz). The received level measured at 1‐km for IP3 when the bubble curtain was operating may have been influenced by background conditions at very low frequencies, as the attenuation at 20 to 63 Hz was 10 dB or less, when it should have been on the order of 30 dB.
1km
10m
HYDROACOUSTIC MONITORING
CN‐RPT‐001‐FINALRPTOFFINDINGS.DOCX 45
Table 21. Summary of Near‐Source Sound Levels with Vibratory Hammer and Air Bubble Curtain.
Acoustic Parameter
Median Sound Level in dB
IP1
Un‐attenuated
IP5
Un‐attenuated
IP3
Air Bubble Curtain
IP7
Air Bubble Curtain
IP10
Air Bubble Curtain
SPL 168.8 at 10 m
135.0 at 1 km
167.5 at 10 m
135.3 at 1 km
155.7 at 10 m
130.1 at 1 km
160.2 at 10 m
127.6 at 1 km
158.1 at 10 m
128.7 at 1 km
Figure 14. Median 1/3rd‐octave band levels measured at 10 m (top) and 1 km (bottom) using the vibratory driver with air bubble curtain.
1km
10m
HYDROACOUSTIC MONITORING
46 CN‐RPT‐001‐FINALRPTOFFINDINGS.DOCX
4.2.3.3 Confined Air Bubble System: Discussion
For all hammer types, near‐source levels were consistently lower with the air bubble curtain system operating when compared to the un‐attenuated levels. The single exception to this was a portion of vibratory pile driving for IP6 that yielded near‐source levels that exceeded all other vibratory results by 20 dB; that data point was excluded from the assessment. For impact installation, the near‐source levels were 3 dB different between the two hammer types (the hydraulic hammer was louder), but this could also have been variability due to the complexities of measuring underwater sound levels or differences in location or driving conditions. With the impact hammer using the air bubble curtain, the near‐source variability was almost 5 dB. With the vibratory hammer, there was less variability for the un‐attenuated conditions and about 4 dB for the air bubble curtain conditions.
While the air bubble curtain system appeared more effective with the hydraulic hammer, the resulting attenuated sound levels were similar for both hammers. The increased reduction with the hydraulic hammer appears attributable to the slightly higher sound levels associated with the un‐attenuated hydraulic hammer condition. The 1/3rd‐octave band frequency spectrum, shown in Figures 12 through 14, illustrates the relatively broadband reduction of 5 to 10 dB provided by the air bubble curtain.
The reduction the air bubble curtain provided when using the vibratory driver was more consistent. The 10‐dB or greater reduction at 10 m was evident for levels above 100 Hz (Figure 14). At 1‐km, the reduction of 5‐dB or greater occurred over the range of 400 to 3,000 Hz. Background contributions may have limited the performance at 1‐km, especially at higher frequencies. The vibratory driver produces pronounced tones at 20, 40 and 63 Hz that did not appear to be reduced by the air bubble curtain.
The confined telescoping bubble curtain consisted of a 72‐inch diameter steel pipe that extended surface and slide over a smaller 60‐inch diameter steel pile that extended to the bottom. During the operation of the bubble curtain a large volume of water “pumped” out of the top of the 72‐inch confinement pipe at the surface. This was presumably caused by vertically rising air bubbles which in‐turn caused water to be drawn up the annular space between 72‐inch and 60‐inch diameter pipes. This large inflow of water into the confined bubble curtain may have negatively affected the performance of the confined bubble curtain NAS.
Results for impact pile installation with the passive Helmholtz resonator system (by AdBm Technologies) using the diesel hammer for piles IP2, IP4 and IP9 were compared against the un‐attenuated sound levels measured for pile IP5. For the hydraulic hammer using the passive Helmholtz resonator (resonator) system, results for piles IP4 and IP8 were compared to the un‐attenuated condition for IP13.
As with the air bubble curtain system, the overall differences in the median sound levels for each pile and each condition at the near‐source (i.e., 10 m from the pile) were used to assess the acoustic performance of the air bubble curtain system. In addition to assessing the near‐source acoustic performance, the computed levels at 1‐km were also evaluated. The near‐source median levels and TLs were used to compute the received levels at 1‐km.
Table 22 shows the summary of sound levels for diesel impact driving when the resonator system was used. SPLs decreased by 2 to 10 dB when compared against un‐attenuated levels for IP5. The most comparable conditions are those between piles IP5 and IP2, which were both driven at Location 4 one day apart. For that condition, the SPL with the resonator system was 10 dB lower at 10 m and 2 dB lower at 1‐km. Figure 15 shows the 1/3rd‐octave band sound levels associated with the diesel hammer and resonator. The reduction provided at 10 m by the resonator was apparent for sounds from 30 to 300 Hz.
3The hydraulic hammer was used only for the first part of installation for IP4, so this condition was not considered in this assessment.
HYDROACOUSTIC MONITORING
CN‐RPT‐001‐FINALRPTOFFINDINGS.DOCX 47
At 1‐km, the reduction over the frequency range was unclear, as one pile with the resonator was louder than an unattenuated pile.
Table 22. Summary of Near‐Source RMS Sound Levels with Diesel Impact Hammer and Resonator.
Acoustic Parameter
Median Sound Level in dB
IP5
Un‐attenuated
IP2
Resonator
IP4
Resonator
IP9
Resonator
SPL 198.6 at 10 m
163.6 at 1 km
188.4 at 10 m
161.6 at 1 km
191.2 at 10 m
150.0 at 1 km
196.9 at 10 m
168.9 at 1 km
Figure 15. Median 1/3rd‐octave band levels measured at 10 m and 1 km using the diesel impact hammer with resonator.
Table 23 provides the summary of sound levels for hydraulic impact driving when the resonator was used. SPLs were 6 dB lower when compared against un‐attenuated levels from IP1. At 1‐km, the change in SPL was less, ranging from 0 to 3 dB. Figure 16 shows the 1/3rd‐octave band sound levels associated with the hydraulic hammer and resonator. Again, the reduction provided at 10 m by the resonator was apparent for sounds from 30 to 300 Hz. At 1‐km, the reduction over the frequency range was also unclear, as one pile was louder and one quieter.
Table 23. Summary of Near‐Source RMS Sound Levels with Hydraulic Impact Hammer and Resonator.
Acoustic Parameter
Median Sound Level in dB
IP1
Un‐attenuated
IP4
Resonator
IP8
Resonator
SPL 201.8 at 10 m
163.4 at 1 km
195.8 at 10 m
160.4 at 1 km
195.1 at 10 m
165.3 at 1 km
1km
10m
HYDROACOUSTIC MONITORING
48 CN‐RPT‐001‐FINALRPTOFFINDINGS.DOCX
Figure 16. Median 1/3rd‐octave band levels measured at 10 m and 1 km using the hydraulic impact hammer with Resonator.
The overall differences in the median SPLs for each pile and each condition at the near‐source (i.e., 10 m from the pile) were used to assess the acoustic performance of the resonator system. Performance was also assessed at 1‐km. Unattenuated conditions for piles IP1 and IP5 were compared with piles IP2, IP4, IP8, and IP9 when the resonator system was used.
Table 24 shows the summary of sound levels for vibratory driving when the resonator was used. On average, near‐source levels were 8 dB lower and almost 5 dB lower at 1‐km. There was considerable variability for the piles with the resonator, where the reduction ranged from 2 to over 14 dB. Figure 17, which shows the 1/3rd‐octave band frequency spectrum, illustrates where sound was reduced from about 50 to 1,000 Hz at 10m. At 1‐km, the reduction is less clear as IP2 showed no reduction and IP4, IP8 and IP9 had reductions of 10 dB or more at 200 to 2,500 Hz.
Table 24. Summary of Near‐Source RMS Sound Levels with Vibratory Hammer and Resonator.
Acoustic Parameter
Median Sound Level in dB
IP1
Unattenuated
IP5
Unattenuated
IP2
Resonator
IP4
Resonator
IP8
Resonator
IP9
Resonator
SPL 168.8 at 10 m
135.0 at 1 km
167.5 at 10 m
135.3 at 1 km
161.9 at 10 m
130.9 at 1 km
160.1 at 10 m
128.3 at 1 km
166.3 at 10 m
134.1 at 1 km
154.3 at 10 m
128.5 at 1 km
10m
1km
HYDROACOUSTIC MONITORING
CN‐RPT‐001‐FINALRPTOFFINDINGS.DOCX 49
Figure 17. Median 1/3rd‐octave band levels measured at 10 m (top) and 1 km (bottom) using vibratory driver with the Resonator.
4.2.3.6 Resonator system: Discussion
For all hammer types, near‐source levels were mostly lower with the resonator when compared to the unattenuated levels. With the resonator, the near‐source variability was almost 11 dB for impact driving. With the vibratory hammer, there was 12 dB of variability. It is not clear if the variability is due to driving conditions or the resonator’s performance. Near the pile, sound was attenuated over the frequencies of about 50 to 300 Hz. At 1‐km, it was hard to assess the frequency range that had the most reductions due to the large variability.
10m
1km
HYDROACOUSTIC MONITORING
50 CN‐RPT‐001‐FINALRPTOFFINDINGS.DOCX
4.2.3.7 Discussion of NAS Performance
Two types of NAS systems were evaluated during the TPP with two types of impact hammers and a vibratory driver. Novel aspects of the program included evaluation of sounds from different types of hammers and use of NASs with a vibratory pile driver. While the range in sound reduction was great, overall, the systems tested reduced median unweighted RMS SPLs by 6 to 12 dB. The air bubble curtain system provided the greatest overall reductions of 9 to 12 dB compared to the 6‐ to 8‐dB reduction for the resonator. These reductions occurred near the pile and were less at farther distances.
Impact pile driving produces much higher RMS SPLs than vibratory driving, although it is impulsive, whereas vibratory driving is continuous. The overall median SPLs for impact driving are about 30 dB higher than the overall continuous median SPL for vibratory driving. Reducing impact driving sound levels is important, especially near the pile where these sounds can have injurious effects.
For impact driving, the resonator reduced overall sound levels by 6 dB. This reduction was mostly confined to the frequency bands of 50 to 300 Hz, while significant sounds from impact driving were over the range of 50 to about 1,200 Hz. The air bubble curtain system reduced sounds by 9 to 12 dB, with the best performance when the slightly louder hydraulic hammer was used. The reduction with the air bubble curtain was generally above 50 to 100 Hz. The hydraulic hammer had more acoustic content in the higher frequencies, so the air bubble curtain was more effective reducing those higher sounds. The on‐off test of the air bubble curtain system for Pile IP6 indicated that the air bubbles were providing only about 5 dB of reduction at 10 m for that pile and up to 1 or 2 dB at 1km, an indication that the system could have been more effective.
The use of attenuation systems during vibratory pile installation is unique and has not been tested before in such detail. Vibratory installation produces continuous sound that varies in amplitude and tone over short periods of time, which make evaluating a NAS difficult. For the TPP, the trace of sound levels over time for each vibratory installation event indicated more variability compared with impact installation. For example, the vibratory installation of IP1 varied by 15 dB with abrupt changes of 5 to 10 dB, while impact installation of the same pile varied by less than 5 dB with no abrupt changes in level.
Both NASs were found to provide overall reductions of 6 dB for vibratory driving. There is considerable variation in the data, where reductions were greater and less with each system. The resonator appeared to consistently reduce sounds over a limited range of 30 to 1,000 Hz. Note that there were cases when the resonator appeared to have reduced sounds throughout much of the frequency range above 30 Hz. The air bubble curtain system reduced sounds consistently above 100 Hz.
The performance of the NASs at 1‐km is difficult to assess. The received sound at these distances can be greatly affected by complex sound propagation combined with the generation and propagation of sound through the ground. Impact pile installation can have a significant ground‐borne sound component, while vibratory installation is assumed to have a lesser component. Neither NAS can reduce sound emanating from the ground.
As previously described, the resonator reduced sounds at 1‐km by 0 to 3 dB, but performance was considered inconsistent due to the great variation in sound levels. The air bubble curtain system appeared to be only slightly effective at 1‐km, reducing sounds by 0 to 8 dB. The frequency spectra show that the reductions at 1‐km were for sounds above about 800 Hz. The dominant sounds at 1‐km were in the 50 to 1,200 Hz range. In all cases, the vibratory sound levels were lower for frequencies above about 100 HZ when both NASs were used.
It should be noted that the sound reductions described in this report are based on unweighted levels. In the future, assessment of the potential for Level A harassment of marine mammals will be based on weighted SEL levels that tend to deemphasize the lower frequency sound components (NMFS 2016d). This is a species‐dependent assessment based on differences among marine mammal functional hearing groups. Level B behavior impacts will still be addressed using unweighted RMS SPLs that are discussed in
HYDROACOUSTIC MONITORING
CN‐RPT‐001‐FINALRPTOFFINDINGS.DOCX 51
this report; however, some animals may not be sensitive to the lower frequency sound components from these activities. The resulting sounds at 1‐km are dominated by sounds in the range of about 50 to 1,200Hz for impact pile driving and 20 to 3,000 Hz for vibratory driving. A NAS that achieves better attenuation of higher frequencies would provide a higher level of sound reduction if measured using weighted sound levels. In this case, the air bubble curtain would show a greater reduction. The resonator performance appeared to be mostly limited to lower frequencies and some of that range may include sounds that are not significant for hearing by some marine mammal species.
There is limited published data regarding the performance of the resonator that was tested during the TPP, so it is difficult to compare its performance to other projects. It appears the resonator provided sound reduction at around 100 Hz for impact driving in the range of 12 to 18 dB. According to the manufacturer’s website, the system could reduce sounds up to 50 dB.
Air bubble curtain systems have been used on many projects and are published by Caltrans to provide 20 dB or greater of attenuation for steel‐pipe piles that are 48 inches in diameter or larger (Caltrans 2015). A TPP conducted for the US. Navy in Kitsap at Bangor, Washington, indicated only a 5‐dB reduction when driving 48‐inch diameter piles with an impact hammer (NAVFAC 2012). A TPP for the Tappan Zee Bridge conducted in 2012 tested different attenuation systems for 48‐inch diameter piles and found 10 dB of reduction in the SEL levels with a confined air bubble system and 10 to 12 dB for an unconfined system (Martin et al. 2012). There are several other projects cited by Caltrans in the Compendium of Pile Driving Sound Data in their guidance manual (Caltrans2015) that show reductions in sound of 5 to nearly 30 dB with use of multi‐stage air bubble curtains on large piles for the Benicia‐Martinez Bridge and San Francisco Oakland Bay Bridge East Span.
4.3 Recommendations Moving Forward The underwater acoustic monitoring program demonstrated that the NASs reduced underwater sound levels during impact and vibratory installation of steel pipe piles. The amount of sound attenuation varied with hammer type and NAS. Key observations from the monitoring program, as well as recommendations for future programs, are summarized below.
Use of a high‐pass filter to eliminate noise caused by currents, wind or other non‐project influences is recommended during analysis of noise measurements that were collected away from pile installation. For the TPP, a 15‐Hz high‐pass filter was applied to avoid the influence of non‐project noise. Analysis of future measurements should consider this issue carefully.
Selection of a NAS – TPP results indicate that a confined air bubble curtain system should be utilized for future APMP construction phases. It is more robust in general and typically provides better or equal performance compared to the resonator NAS based on TPP test results. The performance of the bubble curtain should be improved to match the documented performance of other bubble curtain systems. A possible improvement would be to increase the bubble flux area by enlarging the annular space between the pile and the containment structure. At this time, it is not recommended to pursue the AdBm system for future APMP construction phases based on TPP performance results.
Design bubble curtain containment such that it will not draw in water during operations.
The APMP will consider reducing vibratory pile installation as the impact zones are significantly larger than those from impact installation. This is due to the difference in the regulatory thresholds used by NMFS for impulse versus continuous noise.
Improvements to the Hydroacoustic Monitoring Program for Establishing Safety Zones/Identifying Impact Areas –
o For future monitoring at 1‐km distances, use two locations with roughly 90 degrees between the lines drawn from the pile to 1‐km locations. This would provide additional data at distances more closely representing the potential impact zones and help to
HYDROACOUSTIC MONITORING
52 CN‐RPT‐001‐FINALRPTOFFINDINGS.DOCX
identify cases of propagation abnormalities. This improvement recognizes that sound appears to propagate differently to the north compared to the west and southwest.
o At the 10‐meter locations, use two depths (at least on occasion) to confirm that there is no significant depth dependence from the bottom measurements produced by the AMAR used for the TPP versus more mid‐depth locations. This should verify or improve near‐source sound characterization.
o Measure and record background noise during each monitored pile drive at times just before and just after the drive and for any periods from the start to finish when the driving ceases. It is not possible to know what the background noise level is during the drive; however, these measurements would be a better indicator than background noise measured on a totally different day in a different location. This is important for vibratory driving at far distances where background sound or noise may contribute to the measurements.
o Drift measurements should be limited and only done occasionally to confirm the impact zones determined from the 10‐m and 1‐km data.
Cease pile driving when upset conditions occur. An example of this was the loud portion of vibratory pile installation near the end of IP6. Those sound levels were 20 dB higher than any other sounds measured for that type of driving and clearly increase sounds at the very distant measurement positions.
RECOMMENDATIONS FOR PERMITTING
CN‐RPT‐001‐FINALRPTOFFINDINGS.DOCX 53
Recommendations for Permitting Reducing the threat of anthropogenic noise in Cook Inlet has been identified by NMFS as one of its priority actions for protecting and fostering recovery of the endangered Cook Inlet beluga whale (NMFS 2016c).
All marine mammals, including Cook Inlet beluga whales, are protected under the MMPA. The taking of marine mammals under section 101(a)(5) of the MMPA may be allowed only if NMFS finds that:
the total taking by the activity will have a negligible impact on the species or stock
the total taking will not have an unmitigable adverse impact on the availability of the species or stock for subsistence uses
mitigation measures developed for the activity limit harm to marine mammals and their habitat to the “least practicable adverse impact” standard; and
the taking consists of small numbers of the species or stock (50 CFR Part 216).
NMFS must also provide for the monitoring and reporting of such takings.
Take numbers authorized by NMFS for one year of an activity may be limited to a maximum of about 12 percent of the population, a threshold for marine mammals that appears to be supported by previous NMFS permit authorizations. The most recent peer‐reviewed population estimate for the Cook Inlet beluga whale, developed from aerial surveys in 2012, is 312 individuals (Hobbs et al. 2015). An estimate of population size based on the most recent survey, in 2014, is 340 Cook Inlet beluga whales (Shelden et al. 2015), but this estimate has not yet been published in the peer‐reviewed literature. Twelve percent of a population of 312 is about 37 beluga whales. In the past, NMFS has generally authorized Level B take of 30 or fewer beluga whales per year (12 months) for a given activity in Cook Inlet.
This number of beluga whale takes, 30 or fewer for 12 months of activity, could be reached or exceeded early in the year, placing the rest of the project at risk. A single event, such as the approach of a pod of belugas into the Level B harassment zone, could result in take of multiple individuals at once. In November 2009, during the PIEP, 15 beluga whales were taken at one time before vibratory pile installation could be halted (ICRC 2009). Pod sizes reported for the POA range from a few individuals to groups as large as 100 beluga whales; about 36 percent of sightings documented at the POA were groups of 15 or more beluga whales (HDR, Inc. 2015a).
Detection of beluga whales before they enter the Level B harassment zone is particularly difficult during vibratory pile installation, when the Level B harassment zone can be very large. For the TPP, the Level B harassment zone for vibratory pile installation was set at a radius of 4,000 m (2.5 miles). This distance, and the area it encompasses, can be monitored from an elevated platform by multiple observers using high‐powered optics. However, the likelihood of detection diminishes with increasing distance. Additionally, approaching beluga whales must be detected before they reach the Level B harassment zone so pile installation can be halted before the animals enter the zone. Once they have crossed into the Level B zone, they are considered taken and must be documented as such.
In July 2016, NMFS released new technical guidance for assessing the effects of anthropogenic sound on marine mammal hearing (NMFS 2016d). The guidance identifies the received sound levels, or acoustic thresholds, at which marine mammals are predicted to experience permanent or temporary threshold shifts that correspond to Level A injury levels for five different functional hearing groups. It is anticipated that the isopleths for these thresholds will be greater distances from the construction activity than under the previous NMFS method. Level A harassment is currently rarely authorized, and avoidance of Level A harassment triggers a project shutdown when a marine mammal approaches the isopleth. With
RECOMMENDATIONS FOR PERMITTING
54 CN‐RPT‐001‐FINALRPTOFFINDINGS.DOCX
the new guidance in place, Level A shutdowns could be triggered at greater distances and hence, become more common.
The APMP and the future Designer of Record must therefore consider a combination of constraints: constructability concerns such as cost, schedule, design standards, and function; the likelihood of obtaining required permits and authorizations; and the likelihood of successfully completing project in‐water construction while remaining compliant with permit requirements.
Prior to moving forward with permitting Phase 1 of the APMP, a meeting will be scheduled with NMFS to discuss:
Results of the TPP hydroacoustic test components, specifically ambient conditions, TL coefficients, source noise levels, and NAS performance/results
Agreement on hydroacoustic data results
Results of the marine mammal monitoring program
Reestablishment of baseline conditions for future permitting and improved applications
Expectations for evaluating the least practicable adverse impact standard under the MMPA in consideration of the recent Ninth Circuit Court ruling and
Application of the new NMFS Technical Guidance for assessing effects of anthropogenic noise on marine mammal hearing (NMFS 2016d).
LITERATURE CITED
CN‐RPT‐001‐FINALRPTOFFINDINGS.DOCX 55
Literature Cited AdBm. 2014. AdBm Demonstration at Butendiek Offshore Wind Farm with Ballast Nedam.
Austin, M., S. Denes, J. MacDonnell, and G. Warner. 2016. Hydroacoustic Monitoring Report: Anchorage Port Modernization Project Test Pile Program. Version 3.0. Technical report by JASCO Applied Sciences for Kiewit Infrastructure West Co.
Caltrans. 2015. Technical Guidance for Assessment and Mitigation of the Hydroacoustic Effects of Pile Driving on Fish: Appendix I – Compendium of Pile Driving Sound Data. California Department of Transportation, Division of Environmental Analysis, Sacramento, CA. Updated November 2015.
CH2M. 2016. Anchorage Port Modernization Program Geotechnical Engineering Report, prepared by CH2M, Anchorage, AK for the Port of Anchorage (in preparation).
CH2M HILL. 2015. Anchorage Port Modernization Project Evaluation of Design Alternatives to Satisfy the Municipality of Anchorage Geotechnical Advisory Commission’s Recommended Seismic Performance Requirements, prepared for the Port of Anchorage and Municipality of Anchorage, Oct.
CH2M HILL. 2014a. Anchorage Port Modernization Project Test Pile Work Plan, prepared for the Port of Anchorage and Municipality of Anchorage, Nov.
CH2M HILL. 2014b. Anchorage Port Modernization Project Fifteen Percent Concept Plans, prepared for the Port of Anchorage and Municipality of Anchorage, Oct.
CH2M HILL. 1994. Test Pile Program Report, POL Terminal 2, prepared for Tryck, Nyman & Hayes, on behalf of the Port of Anchorage and Municipality of Anchorage, Oct.
Cornick, L. and D.J. Seagars. 2016. Final Project Report: Anchorage Port Modernization Project Test Pile Program Marine Mammal Observing Program. Technical Report by AECOM for Kiewit.
Golder (Golder Associates, Inc.). 2016. Port of Anchorage Test Pile Program, Geotechnical Data Report.
HDR, Inc. 2015a. Application for a Marine Mammal Protection Act Incidental Harassment Authorization, Port of Anchorage. Prepared by HDR, Inc., Anchorage, AK for the Port of Anchorage under contract to CH2MHill.
HDR, Inc. 2015b. Marine Mammal Monitoring and Mitigation Plan, Port of Anchorage. Prepared by HDR, Inc., Anchorage, AK for the Port of Anchorage under contract to CH2MHill.
HDR, Inc. 2015c. Hydroacoustic Monitoring Framework, Port of Anchorage. Prepared by HDR, Inc., Anchorage, AK for the Port of Anchorage under contract to CH2MHill.
Hobbs, R. C., K. E. W. Shelden, D. J. Rugh, C. L. Sims, and J. M. Waite. 2015. Estimated abundance and trend in aerial counts of beluga whales, Delphinapterus leucas, in Cook Inlet, Alaska, 1994‐2012. Marine Fisheries Review 77(1):11‐31. DOI: dx.doi.org/10.7755/MFR.77.1.2.
ICRC (Integrated Concepts & Research Corporation). 2009. Port of Anchorage Marine Terminal Redevelopment Project, Marine Mammal Monitoring Monthly Report: November 2009. Prepared for U.S. Department of Transportation, Maritime Administration, Washington, DC; Port of Anchorage, Anchorage, AK by Integrated Concepts and Research Corporation, Anchorage, AK.
KIWC. 2016. Port of Anchorage APMP Test Pile Program As‐Built Pile Locations. Certified on 01 August 2016.
LITERATURE CITED
56 CN‐RPT‐001‐FINALRPTOFFINDINGS.DOCX
Martin, B., A. MacGillivray, J. MacDonnell, J. Vallarta, T. Deveau, G. Warner, and D. Zeddies. 2012. Underwater Acoustic Monitoring of the Tappan Zee Bridge Pile Installation Demonstration Project: Comprehensive Report. JASCO Document 00355, Version 1.1. Technical report for AECOM by JASCO Applied Sciences.
MOA (Municipality of Anchorage). 2015. Port of Anchorage Modernization Project Test Pile Program, Invitation to Bid No. 2015C037.
NAVFAC. 2012. Naval Base Kitsap at Bangor EHW‐1 Pile Replacement Project, Bangor, Washington. Final Acoustic Monitoring Report. Prepared by Illingworth & Rodkin. April 2012.
NMFS (National Marine Fisheries Service). 2012a. Memorandum. Guidance Document: Data Collection Methods to Characterize Impact and Vibratory Pile Driving Source Levels Relevant to Marine Mammals. NMFS, Northwest Fisheries Science Center. 31 January 2012.
NMFS. 2012b. Memorandum. Guidance Document: Sound Propagation Modeling to Characterize Pile Driving Sounds Relevant to Marine Mammals. NMFS, Northwest Fisheries Science Center. 31 January 2012.
NMFS. 2012c. Memorandum. Guidance Document: Data Collection Methods to Characterize Underwater Background Sound Relevant to Marine Mammals in Coastal Nearshore Waters and Rivers of Washington and Oregon. NMFS, Northwest Fisheries Science Center. 31 January 2012.
NMFS. 2016a. Endangered Species Act (ESA) Section 7(a)(2) Biological Opinion, Port of Anchorage Test Pile Project and Associated Proposed Issuance of Incidental Harassment Authorization and NWP Verification. NMFS Consultation Number AKR‐2016‐9513, Alaska Region.
NMFS. 2016b. Incidental Harassment Authorization. Issued to the Port of Anchorage. NMFS, Silver Spring, MD.
NMFS. 2016c. Species in the Spotlight: 2016‐2020. Cook Inlet Beluga Whale Delphinapterus leucas. Cook Inlet Beluga Whale 5‐Year Action Plan. National Marine Fisheries Service, Protected Resources Division.
National Marine Fisheries Service. 2016d. Technical Guidance for Assessing the Effects of Anthropogenic Sound on Marine Mammal Hearing: Underwater Acoustic Thresholds for Onset of Permanent and Temporary Threshold Shifts. U.S. Dept. of Commerce, NOAA. NOAA Technical Memorandum NMFS‐OPR‐55, 178 p.
PDI (Pile Dynamics Inc.). GRLWEAP ‐‐ A One‐dimensional Wave Equation Analysis Program, Version 2010‐6.
PND (PND Engineers, Inc.). 2008. Port of Anchorage Marine Terminal Redevelopment Geotechnical Analysis Report. Prepared for Integrated Concepts and Research Corporation. April.
RMDT (Robert Miner Dynamic Testing of Alaska Inc.). 2016. Dynamic Pile Measurements and Analyses, PP 48” x 1”, May 3 ‐ June 21, 2016, APE D180‐42 & APE 15‐4 Hydraulic Hammer, Test Pile Program, Anchorage Port Modernization Project, prepared for Kiewit Infrastructure West, Co.
Shelden, K. E. W., C. L. Sims, L. Vate Brattstrӧm, K. T. Goetz, and R. C. Hobbs. 2015. Aerial surveys of beluga whales (Delphinapterus leucas) in Cook Inlet, Alaska, June 2014. AFSC Processed Rep. 2015‐03, 55 p. Alaska Fish. Sci. Cent., NOAA, Natl. Mar. Fish. Serv., 7600 Sand Point Way NE, Seattle WA 98115.
Terracon (Terracon Consulting Engineers and Scientists Inc.). 2004. Marine Geotechnical Exploration, Port of Anchorage Intermodal Expansion. Volumes 1 and 2. Prepared for Koniag Services, Anchorage, Alaska.