Page 1
e-Perimetron, Vol. 4, No. 4, 2009 [221-233] www.e-perimetron.org | ISSN 1790-3769
[221]
G. Bitelli∗ , S. Cremonini
∗∗, G. Gatta
∗∗∗.
Ancient map comparisons and georeferencing techniques:
A case study from the Po River Delta (Italy)
Keywords: pre-geodetic cartography, georeferencing, landmarks, coastline, Po river delta.
Summary
Two coeval 16th century maps of the Po river delta area (Northern Adriatic Sea), both signed
by Ottavio Fabri, were studied to understand the differences in their contents, to test their
georeferencing and to accomplish the first evaluation of existing errors.
As they are pre-geodetic documents, many problems were involved in performing the analy-
sis. The chief problems were the inability to record the true, original author errors and the im-
possibility to restore the shape of the eroded landscape and morphological tracts, due to the
current non-existence of recognizable landmarks for a large part of the area. To overcome
these problems, an analysis approach is suggested, which consists in: i) attempting to recog-
nize the original survey techniques and their restrictions; ii) evaluating the true differences
between the ancient map and the preserved environmental context.
In this paper, different methods were used to test the reliability of the georeferencing meth-
ods, so as to understand their effectiveness in highlighting the kinds of errors recorded in the
maps.
Introduction
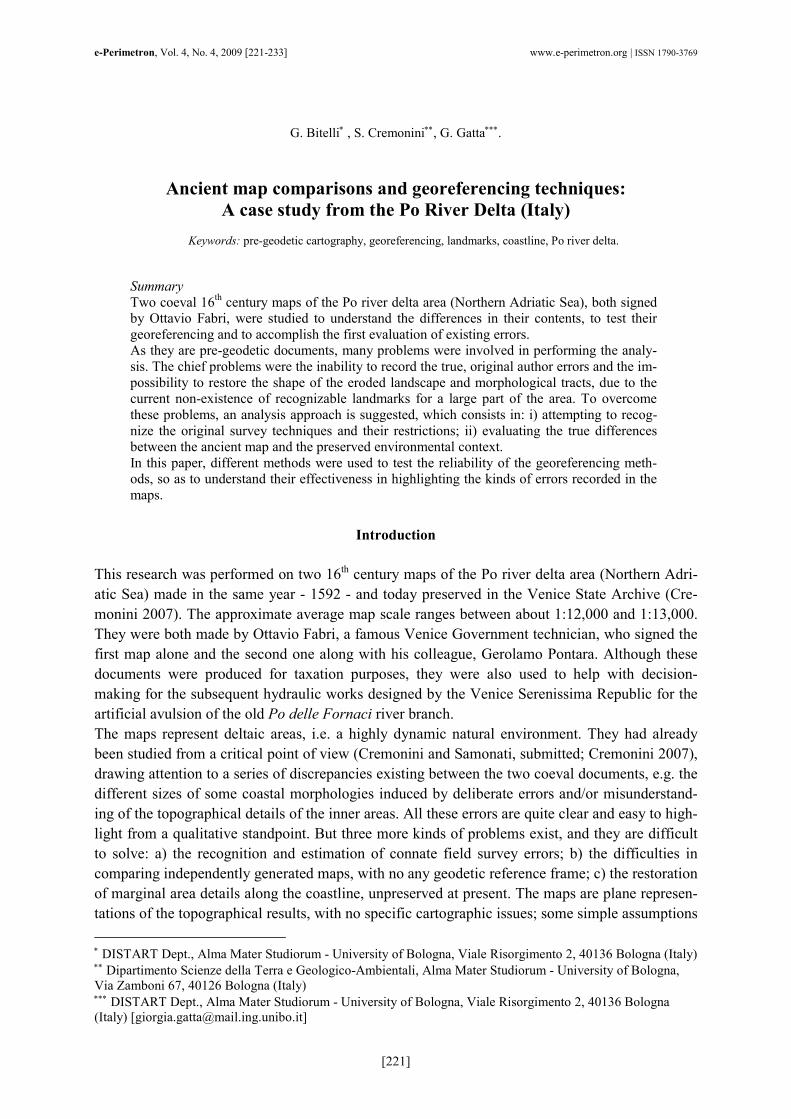
This research was performed on two 16th century maps of the Po river delta area (Northern Adri-
atic Sea) made in the same year - 1592 - and today preserved in the Venice State Archive (Cre-
monini 2007). The approximate average map scale ranges between about 1:12,000 and 1:13,000.
They were both made by Ottavio Fabri, a famous Venice Government technician, who signed the
first map alone and the second one along with his colleague, Gerolamo Pontara. Although these
documents were produced for taxation purposes, they were also used to help with decision-
making for the subsequent hydraulic works designed by the Venice Serenissima Republic for the
artificial avulsion of the old Po delle Fornaci river branch.
The maps represent deltaic areas, i.e. a highly dynamic natural environment. They had already
been studied from a critical point of view (Cremonini and Samonati, submitted; Cremonini 2007),
drawing attention to a series of discrepancies existing between the two coeval documents, e.g. the
different sizes of some coastal morphologies induced by deliberate errors and/or misunderstand-
ing of the topographical details of the inner areas. All these errors are quite clear and easy to high-
light from a qualitative standpoint. But three more kinds of problems exist, and they are difficult
to solve: a) the recognition and estimation of connate field survey errors; b) the difficulties in
comparing independently generated maps, with no any geodetic reference frame; c) the restoration
of marginal area details along the coastline, unpreserved at present. The maps are plane represen-
tations of the topographical results, with no specific cartographic issues; some simple assumptions
∗ DISTART Dept., Alma Mater Studiorum - University of Bologna, Viale Risorgimento 2, 40136 Bologna (Italy) ∗∗ Dipartimento Scienze della Terra e Geologico-Ambientali, Alma Mater Studiorum - University of Bologna,
Via Zamboni 67, 40126 Bologna (Italy) ∗∗∗ DISTART Dept., Alma Mater Studiorum - University of Bologna, Viale Risorgimento 2, 40136 Bologna
(Italy) [[email protected] ]
Page 2
e-Perimetron, Vol. 4, No. 4, 2009 [221-233] www.e-perimetron.org | ISSN 1790-3769
[222]
can be drawn concerning the adopted techniques: a large number of points was probably surveyed
using a limited number of selected benchmarks, usually bell towers because of their greater visi-
bility in the lowland plains. The drawings were probably made by means of bearings measure-
ments related to the coeval magnetic North (a wind rose was drawn on one of the maps). As pre-
geodetic products, they do not exhibit common cartographic characteristics: they are neither con-
formal, nor equivalent, nor equidistant.
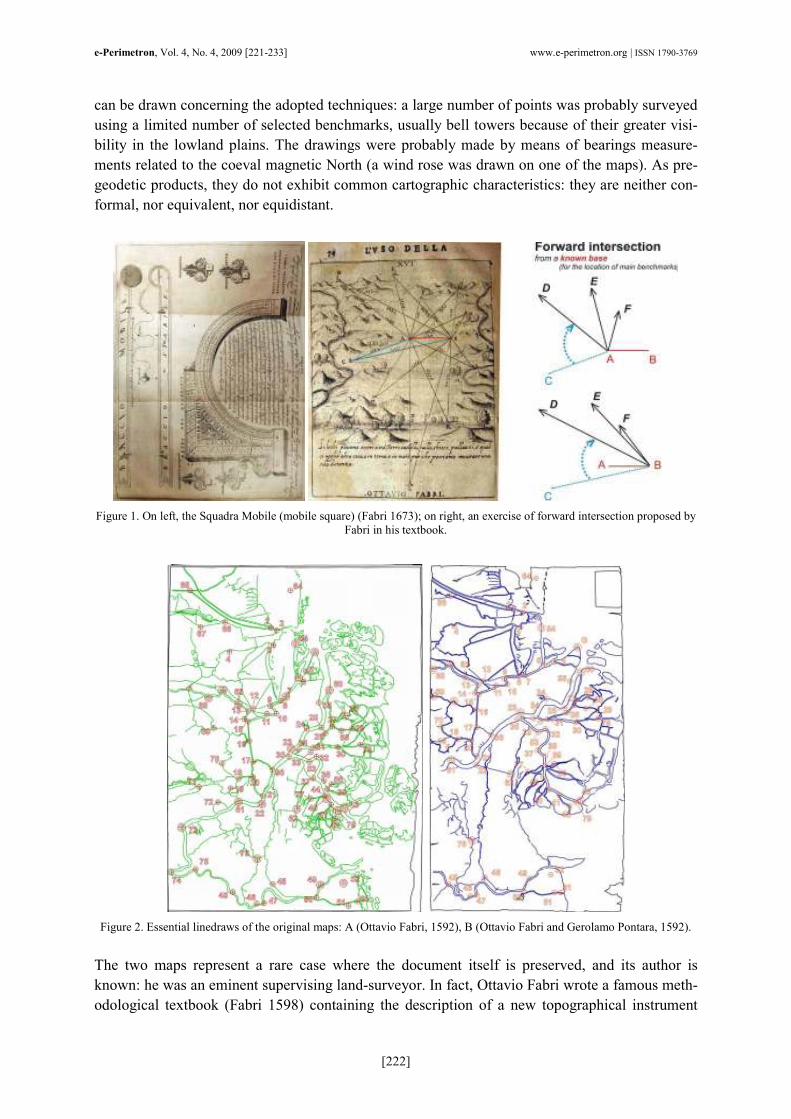
Figure 1. On left, the Squadra Mobile (mobile square) (Fabri 1673); on right, an exercise of forward intersection proposed by
Fabri in his textbook.
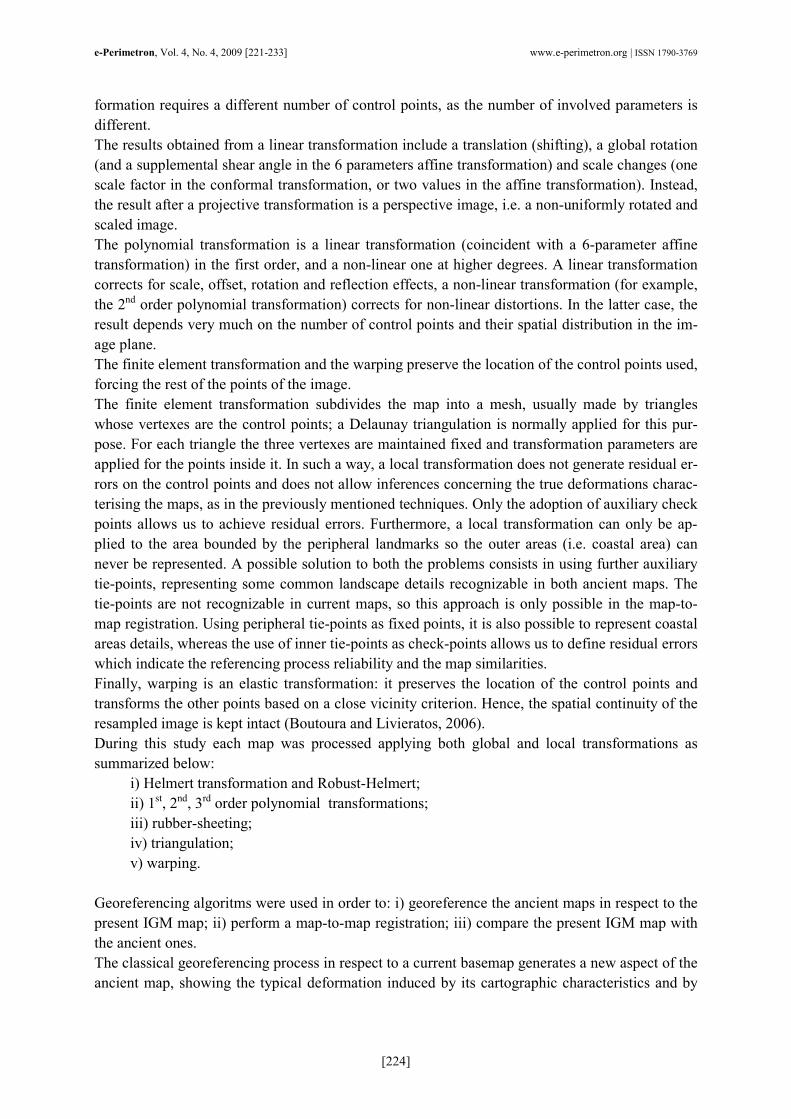
Figure 2. Essential linedraws of the original maps: A (Ottavio Fabri, 1592), B (Ottavio Fabri and Gerolamo Pontara, 1592).
The two maps represent a rare case where the document itself is preserved, and its author is
known: he was an eminent supervising land-surveyor. In fact, Ottavio Fabri wrote a famous meth-
odological textbook (Fabri 1598) containing the description of a new topographical instrument
Page 3
e-Perimetron, Vol. 4, No. 4, 2009 [221-233] www.e-perimetron.org | ISSN 1790-3769
[223]
which he himself had invented and used (Squadra mobile - mobile square - or zoppa), useful for
performing every type of topographic measurement (i.e. heights, distances, depths) in urban and
land surveying and map drawing (Fig. 1). Surprisingly, this book seems to be a powerful record (a
summa) of the author’s whole technical experience derived in surveying the geographical areas
drawn in the maps here studied.
For the purposes of this study, digitized photographic image linedraws of the original maps were
used modified in respect to those depicted in Cremonini and Samonati (submitted). Hereon, the
term Map A will refer to the map signed only by Fabri, and Map B will be used to identify the
document signed by Fabri and Pontara (Fig. 2).
Study purpose
The first aim of our research was to derive information on the ancient coastal morphology of the
Po delta area, and to find a reliable way to describe the no longer existing details of coastal areas.
The method was based on a comparison between the two 16th century maps and the current land-
scape, and cross-comparison between the two coeval ancient documents.
Some evident differences exist in the details drawn in the two maps, even though the main author
and the year of publication were the same, and the maps record exactly the same topographic de-
tails: the two documents are not a reciprocal self-copy. Therefore, not only a merely qualitative
but also a quantitative comparison between the available samples must be attempted to determine
which is the most reliable.
One of the main purposes of this analysis consists in comparing the results produced by applying
different kinds of algorithms available in software packages used for map georeferencing, in order
to evaluate the reliability of each chosen algorithm.
Georeferencing issues
For georeferencing purposes it is generally necessary to select peculiar points with known coordi-
nates, recognizable on the ancient maps and still existing on current representations (Benavides
and Koster, 2006). In this specific case, the task was very difficult because of the remarkable
landscape evolution over the past centuries. In this phase, a lot of problems arise concerning the
basic characters of the points themselves (e.g., planimetric precision, graphic representation on the
ancient maps, etc.); for this reason, these points were considered landmarks because of their lesser
reliability as compared with the usual topographic benchmarks.
After careful analysis, a set of about 80 common landmarks, clearly identifiable also on the IGM
1:25.000 topographic sheet, was recognized on both the ancient maps. North and East coordinates
were attributed to each point according to UTM-ED50 (fuse 33) grid. One hundred and ten further
tie-points were chosen and used as auxiliary points in the rubber-sheeting processing for the map-
to-map registration.
As well-known, there are two different classes of transformations for establishing a one-to-one
correspondence between two set of control points lying on two different plane surfaces through a
“best-fit” process: the global ones and the local ones (Balletti 2006). In a global transformation -
i.e. conformal (4 parameters), affine (5 or 6 parameters), projective (8 parameters), generic order
polynomial - the unknown parameters are calculated for the whole area. On the other hand, in a
local transformation - finite elements, morphing - the unknown parameters are calculated for a
small area, defined by a small number of control points or close to each control point. Each trans-
Page 4
e-Perimetron, Vol. 4, No. 4, 2009 [221-233] www.e-perimetron.org | ISSN 1790-3769
[224]
formation requires a different number of control points, as the number of involved parameters is
different.
The results obtained from a linear transformation include a translation (shifting), a global rotation
(and a supplemental shear angle in the 6 parameters affine transformation) and scale changes (one
scale factor in the conformal transformation, or two values in the affine transformation). Instead,
the result after a projective transformation is a perspective image, i.e. a non-uniformly rotated and
scaled image.
The polynomial transformation is a linear transformation (coincident with a 6-parameter affine
transformation) in the first order, and a non-linear one at higher degrees. A linear transformation
corrects for scale, offset, rotation and reflection effects, a non-linear transformation (for example,
the 2nd order polynomial transformation) corrects for non-linear distortions. In the latter case, the
result depends very much on the number of control points and their spatial distribution in the im-
age plane.
The finite element transformation and the warping preserve the location of the control points used,
forcing the rest of the points of the image.
The finite element transformation subdivides the map into a mesh, usually made by triangles
whose vertexes are the control points; a Delaunay triangulation is normally applied for this pur-
pose. For each triangle the three vertexes are maintained fixed and transformation parameters are
applied for the points inside it. In such a way, a local transformation does not generate residual er-
rors on the control points and does not allow inferences concerning the true deformations charac-
terising the maps, as in the previously mentioned techniques. Only the adoption of auxiliary check
points allows us to achieve residual errors. Furthermore, a local transformation can only be ap-
plied to the area bounded by the peripheral landmarks so the outer areas (i.e. coastal area) can
never be represented. A possible solution to both the problems consists in using further auxiliary
tie-points, representing some common landscape details recognizable in both ancient maps. The
tie-points are not recognizable in current maps, so this approach is only possible in the map-to-
map registration. Using peripheral tie-points as fixed points, it is also possible to represent coastal
areas details, whereas the use of inner tie-points as check-points allows us to define residual errors
which indicate the referencing process reliability and the map similarities.
Finally, warping is an elastic transformation: it preserves the location of the control points and
transforms the other points based on a close vicinity criterion. Hence, the spatial continuity of the
resampled image is kept intact (Boutoura and Livieratos, 2006).
During this study each map was processed applying both global and local transformations as
summarized below:
i) Helmert transformation and Robust-Helmert;
ii) 1st, 2nd, 3rd order polynomial transformations;
iii) rubber-sheeting;
iv) triangulation;
v) warping.
Georeferencing algoritms were used in order to: i) georeference the ancient maps in respect to the
present IGM map; ii) perform a map-to-map registration; iii) compare the present IGM map with
the ancient ones.
The classical georeferencing process in respect to a current basemap generates a new aspect of the
ancient map, showing the typical deformation induced by its cartographic characteristics and by
Page 5
e-Perimetron, Vol. 4, No. 4, 2009 [221-233] www.e-perimetron.org | ISSN 1790-3769
[225]
the applied algorithm: the parameters usually able to quantify the deformation are the residual er-
rors associated to each single point.
Map-to-map registration can apply a similar co-registration technique from one ancient map to the
other one, useful for the comparison of their drawings and the recognition of the same landscape
details (Daniil 2006).
The comparison of the present IGM map with the ancient ones is the contrary of the usual geo-
referencing; it provides non-canonical referencing that easily highlights in which way the present
topographical patterns must be deformed to adapt to the ancient corresponding ones. This is a
powerful tool for a more immediate visualization of the original deformation pattern due to the
ancient author work (Balletti 2006).
Different output products were realized for each map, and a short report will be presented on the
following:
a) rendering of UTM grid deformation over the original map image;
b) visualization of scale parameter variations throughout a single map by means of isolines;
c) map rotation angles with respect to grid North and angular displacement between the
maps;
d) image of the georeferenced map;
e) residual errors spatial distribution (as vectors and 3D model) related to the georeferencing
process;
f) overlaying of georeferenced ancient map on the current IGM map and viceversa, i.e. the
IGM referred in respect to the ancient one.
Results
The most evident deformation pattern, the scale variability and the rotation angle (in respect to the
grid North) were displayed by means of MapAnalyst (Jenny 2006). Rotation angles were 15.7°
and 8.9° for A and B, respectively, suggesting an angular displacement of about 7°. Scale factors
vary throughout the maps, being slightly more homogenous in A than in B, even if Map A shows
two severe anomalous variation areas near the northern and southern delta lobe corners. The aver-
age scale resulted to be 1:12,300 (1:14,300 ÷ 1:10,300) and 1:13,400 (1:16,300 ÷ 1:10,500) in
Maps A and B, respectively (Fig. 3).
The second order polynomial transformation was recognized as the best technique for evaluating
the mean residual errors and for rendering inland area details (Fig. 4). The mean residual error
was about 588 m in Map A and in Map B, ranging between 18 and 1,320 m in Map A and be-
tween 85 and 1,650 in Map B: the whole set of the original landmarks were considered in all the
calculations. The residual errors were displayed in different colors in the two maps, and their spa-
tial distribution was displayed as isolines and 3D models. The residuals appear to be the lowest in
the map centre, whereas they increase in size in the peripheral areas: it is the classical border ef-
fect due to the polynomial transformation associated to the lack of reference points in the area
and, probably, to the survey technique adopted here and to accidental or intentional drawing errors
(Fig. 5).
MAP A B
residual ranges (m) 18÷1320 85÷1650
total RMS (m) 588 588
Table 1: Ranges of single landmarks residual errors (in meters) for each georeferenced map (polynomial transformation).
Page 6
e-Perimetron, Vol. 4, No. 4, 2009 [221-233] www.e-perimetron.org | ISSN 1790-3769
[226]
Figure 3. Display of the UTM-km grid deformations (cell size is 2,500 m), residual error vectors and scale isolines on Maps
A and B, respectively.
Figure 4. Georeferenced map (A and B respectively) resulting from a 2nd order polynomial transformation (applied by means
of about 80 landmarks).
The coastline was horizontally shifted and rotated in the two maps. The use of polynomial algo-
rithm in the map-to-map registration process (using landmarks as fixed points and tie-points as
check) produced a residual error distribution (expressed as isolines and 3D model) showing a se-
vere dissimilitude (500-600 m) all along the peripheral coastal areas.
The residual error vector pattern is shown in Fig. 3. It can be argued that in Map A: i) vectors are
slightly shorter than in B (Table 1); ii) they show an almost homogeneous size all over the map
Page 7
e-Perimetron, Vol. 4, No. 4, 2009 [221-233] www.e-perimetron.org | ISSN 1790-3769
[227]
even if the shortest coincide with the central part lying next to benchmarks 15-17; iii) they do not
exhibit directional clusters and their average direction does not show an apparent self-congruence.
Instead, in Map B vectors: i) possess a varying length growing toward the peripheral areas, and in
the map core near benchmarks 15-17 they appear to be the lowest; ii) the directions are slightly
centripetal in the central part, whereas they are southward-verging in the peripheral areas; iii) in
particular, in deltaic coastal areas the vectors increase in size and are eastward-verging.
Figure 5. Residual errors in Maps A and B, and related spatial distribution as 3D model. Different colors were used according
to the error size (in meters).
The triangulation method (local transformation) was tested due to the shifts characterising the
landmarks relocation after the polynomial processing. This attempt highlighted a low reliability of
the end-product mainly in the peripheral areas and severe shear effects at the triangle borders.
A rubber-sheeting algorithm, as local transformation, was tested as well. In this case, the linear
rubber-sheeting (hereon LRS) was recognized to be preferable in respect to the non-linear one,
because the non-linear rubber-sheeting induced unacceptable deformations in the map centre.
In the georeferencing process, LRS did not show any particular further information concerning the
map-making process and no other kind of information was made available by the mutual compari-
son of LRS maps.
In the map-to-map co-registration, LRS (without tie-points applied) shows a very good corre-
spondence between the maps, highlighting a severe difference in the riverbeds width (more wide
in map A than in B) (Fig. 6), however. If tie-points are considered, the correspondence degree in-
creases further, the size of southern islands cluster becomes different in the maps and the northern
cluster appears severely shifted northward in Map A.
In order to display the residual errors (for the same landmarks used in the polynomial georefer-
encing process) in the LRS process, a map-to-map registration using landmarks as check points
and tie-points as fixed points was performed. The residual error distribution (expressed as isolines
and 3D model) showed a smaller dissimilitude with respect to the polynomial georeferencing
process.
Page 8
e-Perimetron, Vol. 4, No. 4, 2009 [221-233] www.e-perimetron.org | ISSN 1790-3769
[228]
Maps A vs. B B vs. A
residual ranges (m) 40÷1200 40÷1260
total RMS (m) 402 368
Table 2: Ranges of single check points residual error (in meters) for LRS of A/B and B/A.
Figure 6. Results from the map-to-map registration, performed by means of a linear rubber-sheeting transformation: the re-
ferred Map A (left), overlaid to the reference map (B); the referred Map B (right), overlaid to the reference map (A).
Two areas (northern and southern parts of the delta) show clearly high differences in the two
maps; the visualization is enabled by the 3D model.
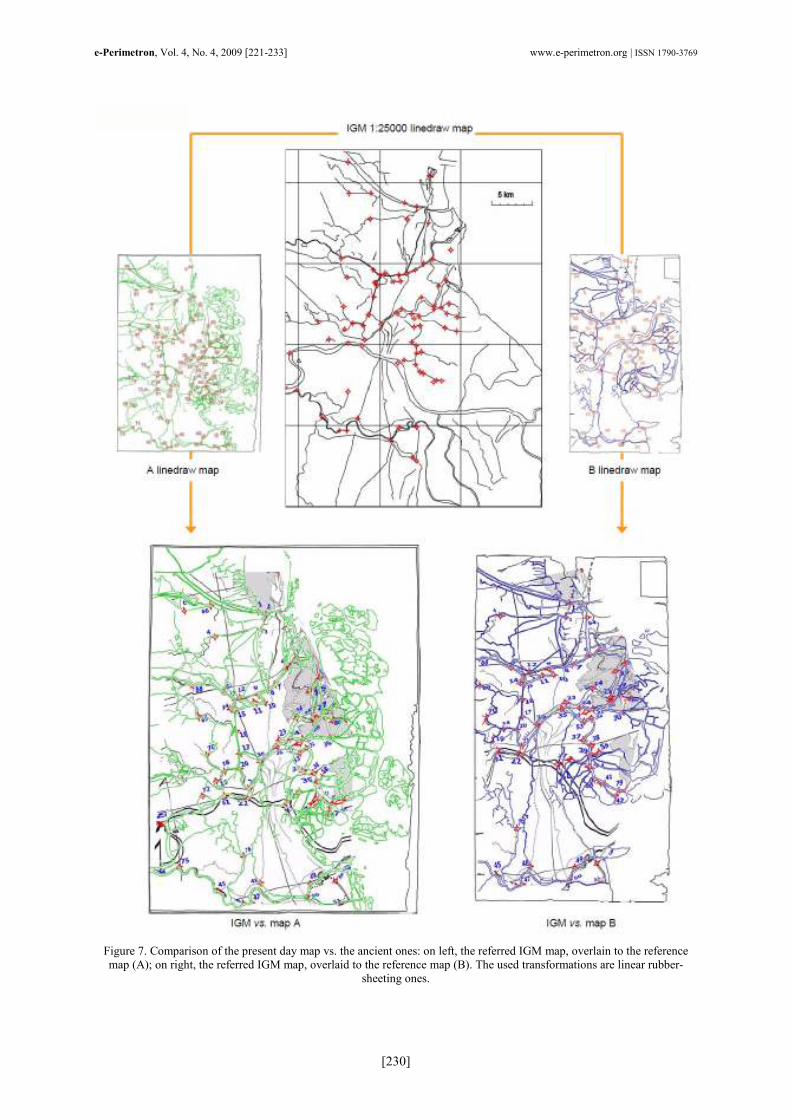
A linear rubber-sheeting transformation was also used in comparing the present-day map with the
ancient ones. The results were overlain to the reference maps (Fig. 7).
A point-based warping algorithm was the third local-transformation tested. For this study case, its
result was not satisfying because of the high deformations induced by the algorithm, even though
the warping was able to represent the peripheral areas.
Discussion
Unfortunately, the deltaic areas represent a half-space in respect to the possible set of landmarks,
the supplementary marine half-space being unavailable. Therefore, the coastal areas are topog-
raphically under-constrained. Such a character, coupled with the vegetation cover characteristics,
involved a series of operational limitations during the original topographical survey, with an un-
avoidable decrease in accuracy. Of course, the same problems arise in the application of digital
techniques in the georeferencing process, and they are furthermore worsened by very large land-
scape changes in deltaic zones.
All algorithms induce some supplementary geometrical deformations added to those characteris-
ing the original map (due to survey/drawing errors and to map preservation conditions) (Fig. 5).
These distortions are not clearly recognizable but the proof of their existence and importance is
Page 9
e-Perimetron, Vol. 4, No. 4, 2009 [221-233] www.e-perimetron.org | ISSN 1790-3769
[229]
stated by the diverse results reached applying different kind of algorithms. Therefore, the applica-
tion of georeferencing algorithms does not allow representing the ancient location and morphol-
ogy of the eroded coastal areas.
Page 10
e-Perimetron, Vol. 4, No. 4, 2009 [221-233] www.e-perimetron.org | ISSN 1790-3769
[230]
Figure 7. Comparison of the present day map vs. the ancient ones: on left, the referred IGM map, overlain to the reference
map (A); on right, the referred IGM map, overlaid to the reference map (B). The used transformations are linear rubber-
sheeting ones.
Page 11
e-Perimetron, Vol. 4, No. 4, 2009 [221-233] www.e-perimetron.org | ISSN 1790-3769
[231]
The results of map-to-map registration allow to state that in general the maps recorded the same
topographic details (Fig. 6). Nevertheless, they show some morphological differences and differ-
ent residual error patterns; hence, up to now it has been impossible to recognize which map is
most similar to its proper coeval physical landscape. This approach is made more difficult by the
fact that the author of Map A probably induced an intentional error in representing the uppermost
part of the north-eastern delta lobe corner (Cremonini and Samonati, submitted). The differences
in the residual error patterns are not always directly related to the surveying techniques: probably,
other aspects have to be investigated (e.g. economics, politics, management, etc.).
Even if the available residual error analysis does not paint a complete and wholly reliable picture
of the true original surveying errors, it allows to state that the studied maps are two independently
generated documents, that is, they are not a mutual self-copy. Therefore, the mutual differences
characterising the maps could be related to a different field-survey method or to the use of a dif-
ferent topographic instrument. However, it is not yet possible to state whether the field survey
strategy was the same for the maps even though a unique starting base was probably adopted at
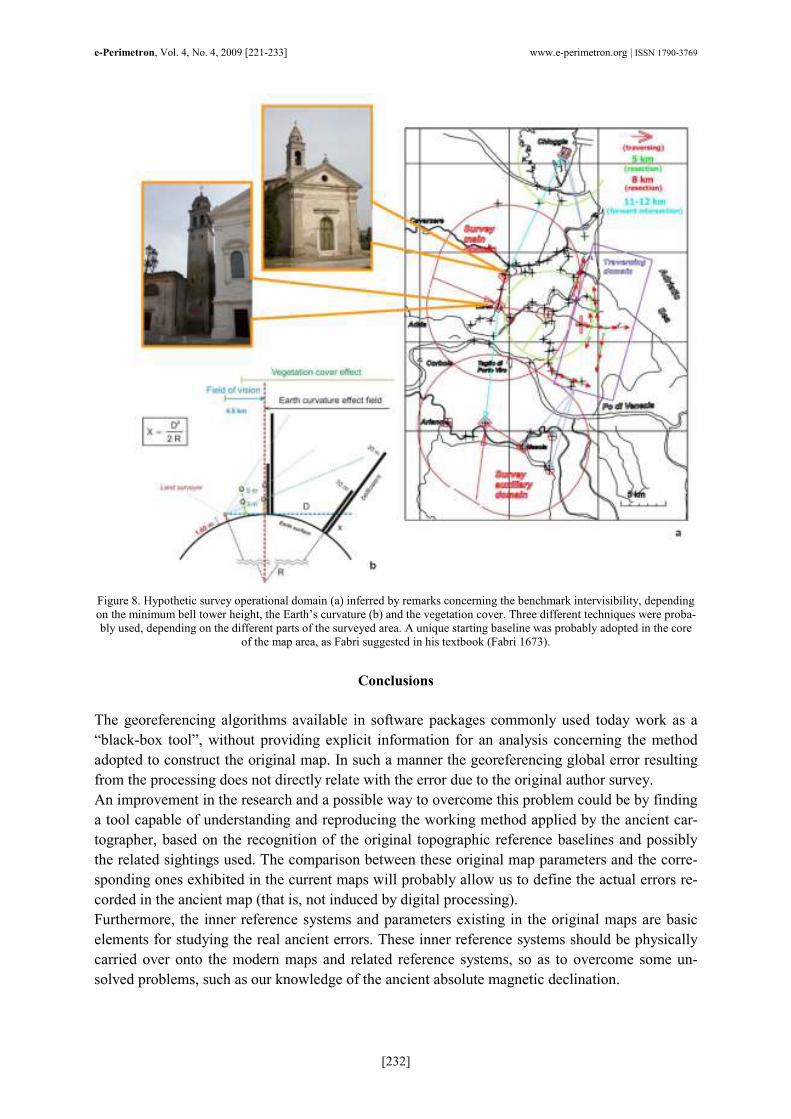
the core of the geographical area, as Fabri suggested in his textbook (Fabri 1598) (Fig. 8). Owing
to the wide extension of the surveyed area, another question might be discussed concerning the
need to adopt more than one reference baseline and related benchmarks. This implies, among
other things, a knowledge of the maximum operational sighting lengths adopted by ancient land-
surveyors. A maximum length of 8-9 km seems to be reasonably acceptable as recorded by pal-
impsestic sighting traces preserved in other maps (Cremonini 2007), and it can also be supported
by remarks concerning the intervisibility benchmarks depending on the minimum bell tower
heights, the Earth’s curvature and the vegetation cover (Fig. 8). In fact, if a 20-metre minimum
height (e.g. Loreo bell tower) is assumed, the theoretical related minimum sighting distance will
be about 16 km. This has to be further reduced to at least 11 km to assure a realistic minimum
visibility. Furthermore, if a couple of bell towers consistently differing in heights was used as sur-
vey reference, the more constraining would be the lower one, thus reducing the length of the field
of view. If this is the actual case, four operational subareas, with different surveying approaches
will be required at least to map the whole territory. It is reasonable to assume that the resection
technique was applied, whereas the cross-linking of the four areas was probably attained by a mu-
tual back sighting of the main benchmarks of each subarea. In all coastal areas, lying beyond the
8-9 km operational threshold, a simpler technique was probably applied based on traversing along
selected pathways, mainly coinciding with the riverbed and channels. This technique could ac-
count for the high error values recorded in the coastal areas.
The existence of the 8-9 km threshold can be also supported by the comparison of the present
IGM map with the ancient ones, indicating a change in deformation coinciding with a peculiar
point (30: La Crose) located about 9 km eastwards of the undistorted baseline 15-17. Therefore,
the use of LRS processing applied in the comparison of the present IGM map with the ancient
ones has generated a new kind of map leading to a possible new interpretative perspective, as it
has shown the most faithful picture of the deformation pattern of the ancient maps, quite different
from all the previous ones (Fig. 7). In fact, the process preserves all the ancient map characteris-
tics and allows for: i) a more immediate visualization of the original deformation pattern due to
the ancient survey operations; ii) a notable increase in the number of auxiliary points (useful for
comparing the resampled map with the current IGM). These new pictures will need to be further
processed to extract fresh numerical information content. By applying this technique, the restora-
tion of the coastal areas is better defined in respect to the classical geo-referencing process, al-
though it is still unsatisfactory.
Page 12
e-Perimetron, Vol. 4, No. 4, 2009 [221-233] www.e-perimetron.org | ISSN 1790-3769
[232]
Figure 8. Hypothetic survey operational domain (a) inferred by remarks concerning the benchmark intervisibility, depending
on the minimum bell tower height, the Earth’s curvature (b) and the vegetation cover. Three different techniques were proba-
bly used, depending on the different parts of the surveyed area. A unique starting baseline was probably adopted in the core
of the map area, as Fabri suggested in his textbook (Fabri 1673).
Conclusions
The georeferencing algorithms available in software packages commonly used today work as a
“black-box tool”, without providing explicit information for an analysis concerning the method
adopted to construct the original map. In such a manner the georeferencing global error resulting
from the processing does not directly relate with the error due to the original author survey.
An improvement in the research and a possible way to overcome this problem could be by finding
a tool capable of understanding and reproducing the working method applied by the ancient car-
tographer, based on the recognition of the original topographic reference baselines and possibly
the related sightings used. The comparison between these original map parameters and the corre-
sponding ones exhibited in the current maps will probably allow us to define the actual errors re-
corded in the ancient map (that is, not induced by digital processing).
Furthermore, the inner reference systems and parameters existing in the original maps are basic
elements for studying the real ancient errors. These inner reference systems should be physically
carried over onto the modern maps and related reference systems, so as to overcome some un-
solved problems, such as our knowledge of the ancient absolute magnetic declination.
Page 13
e-Perimetron, Vol. 4, No. 4, 2009 [221-233] www.e-perimetron.org | ISSN 1790-3769
[233]
These are some potential ways to try to extrapolate useful information also regarding the periph-
eral areas of the ancient maps, not preserved today due to natural erosion phenomena, with a view
to reaching an error-model capable of overcoming the death of landmarks.
Until now, this kind of problem appears to be unsolved, making hard the comparison between
time-crossing map configurations of peculiar geomorphological tracts and the evaluation of the
landscape change rates in this important area.
Acknowledgements
We would like to thank the Engineering Faculty Library of the University of Bologna for the con-
sultation of the textbook by O. Fabri, and the Venice State Archive for the consultation of the map
by O. Fabri.
References
Balletti C. (2006). Georeference in the analysis of the geometric content of early maps. e-
Perimetron, Vol. 1, No. 1, 32-42.
Benavides J., Koster E. (2006). Identifying surviving landmarks on historical maps, e-Perimetron,
Vol. 1, No. 4, 287-296.
Boutoura C., Livieratos E. (2006). Some fundamentals for the study of the geometry of early
maps by comparative methods. e-Perimetron, Vol. 1, No. 1, 60-70.
Cremonini S. (2007). Questioni di geomorfologia costiera del delta del Po anteriormente al 1604.
Evidenze dalla cartografia storica. Annali di Ricerche e Studi di Geografia, 63, 53-67.
Cremonini S., Samonati E. (submitted). Value of ancient cartography for geoenvironmental pur-
poses: a case study from the Po River delta coast (Italy).
Daniil M. (2006). Comparing by digital transparency the differences between two almost identical
17th century maps of North Aegean Sea. e-Perimetron, Vol. 1, No. 3, 194-208.
Fabri O. (1673). L'uso della squadra mobile con la quale per teorica et per pratica si misura
geometricamente ogni distanza, altezza, e profondità. S'impara a perticare liuellare, et pigliare in
dissegno le città paesi, et prouincie. Il tutto con le sue dimostrazioni intagliate in rame, Editore
Gattella, Padova, 60 sheets (= 120 pp.).
Jenny B. (2006). MapAnalyst - A digital tool for the analysis of the planimetric accuracy of his-
torical maps. e-Perimetron, Vol. 1, No. 3, 239-245.