Tissue distribution and clonal diversity of the T and B cell repertoire in type 1 diabetes Howard R. Seay, … , Harlan S. Robins, Todd M. Brusko JCI Insight. 2016; 1(20):e88242. https://doi.org/10.1172/jci.insight.88242. The adaptive immune repertoire plays a critical role in type 1 diabetes (T1D) pathogenesis. However, efforts to characterize B cell and T cell receptor (TCR) profiles in T1D subjects have been largely limited to peripheral blood sampling and restricted to known antigens. To address this, we collected pancreatic draining lymph nodes (pLN), “irrelevant” nonpancreatic draining lymph nodes, peripheral blood mononuclear cells (PBMC), and splenocytes from T1D subjects (n = 18) and control donors (n = 9) as well as pancreatic islets from 1 T1D patient; from these tissues, we collected purified CD4 + conventional T cells (Tconv), CD4 + Treg, CD8 + T cells, and B cells. By conducting high-throughput immunosequencing of the TCR b chain (TRB) and B cell receptor (BCR) immunoglobulin heavy chain (IGH) on these samples, we sought to analyze the molecular signature of the lymphocyte populations within these tissues and of T1D. Ultimately, we observed a highly tissue-restricted CD4 + repertoire, while up to 24% of CD8 + clones were shared among tissues. We surveyed our data set for previously described proinsulin- and glutamic acid decarboxylase 65–reactive (GAD65-reactive) receptors, and interestingly, we observed a TRB with homology to a known GAD65-reactive TCR (clone GAD4.13) present in 7 T1D donors (38.9%), representing >25% of all productive TRB within Tconv isolated from the pLN of 1 T1D subject. These data demonstrate diverse receptor […] Research Article Immunology Find the latest version: http://jci.me/88242-pdf
Transcript
Tissue distribution and clonal diversity of the Tand B cell repertoire in type 1 diabetes
Howard R. Seay, … , Harlan S. Robins, Todd M. Brusko
The adaptive immune repertoire plays a critical role in type 1 diabetes (T1D) pathogenesis.However, efforts to characterize B cell and T cell receptor (TCR) profiles in T1D subjectshave been largely limited to peripheral blood sampling and restricted to known antigens. Toaddress this, we collected pancreatic draining lymph nodes (pLN), “irrelevant”nonpancreatic draining lymph nodes, peripheral blood mononuclear cells (PBMC), andsplenocytes from T1D subjects (n = 18) and control donors (n = 9) as well as pancreaticislets from 1 T1D patient; from these tissues, we collected purified CD4+ conventional Tcells (Tconv), CD4+ Treg, CD8+ T cells, and B cells. By conducting high-throughputimmunosequencing of the TCR b chain (TRB) and B cell receptor (BCR) immunoglobulinheavy chain (IGH) on these samples, we sought to analyze the molecular signature of thelymphocyte populations within these tissues and of T1D. Ultimately, we observed a highlytissue-restricted CD4+ repertoire, while up to 24% of CD8+ clones were shared amongtissues. We surveyed our data set for previously described proinsulin- and glutamic aciddecarboxylase 65–reactive (GAD65-reactive) receptors, and interestingly, we observed aTRB with homology to a known GAD65-reactive TCR (clone GAD4.13) present in 7 T1Ddonors (38.9%), representing >25% of all productive TRB within Tconv isolated from thepLN of 1 T1D subject. These data demonstrate diverse receptor […]
Conflict of interest: M. Vignali, R.O. Emerson, and E. Yusko are employees of and have equity ownership in Adaptive Biotechnologies. H.S. Robins is an employee, has equity ownership, patents, and royalties with Adaptive Biotechnologies.
Submitted: April 29, 2016 Accepted: October 28, 2016 Published: December 8, 2016
Tissue distribution and clonal diversity of the T and B cell repertoire in type 1 diabetesHoward R. Seay,1 Erik Yusko,2 Stephanie J. Rothweiler,1 Lin Zhang,1 Amanda L. Posgai,1 Martha Campbell-Thompson,1 Marissa Vignali,2 Ryan O. Emerson,2 John S. Kaddis,3 Dave Ko,3 Maki Nakayama,4 Mia J. Smith,5 John C. Cambier,5 Alberto Pugliese,6 Mark A. Atkinson,1 Harlan S. Robins,2,7 and Todd M. Brusko1
1Department of Pathology, Immunology and Laboratory Medicine, University of Florida Diabetes Institute, Gainesville,
Florida, USA. 2Adaptive Biotechnologies Corporation, Seattle, Washington, USA. 3Department of Information Sciences,
City of Hope National Medical Center, Duarte, California, USA. 4Barbara Davis Center for Childhood Diabetes and 5Department of Immunology and Microbiology, University of Colorado School of Medicine, Aurora, Colorado, USA. 6Diabetes Research Institute and Departments of Medicine, Microbiology, and Immunology, University of Miami Miller
School of Medicine, Miami, Florida, USA. 7Fred Hutchinson Cancer Research Center, Seattle, Washington, USA.
IntroductionHelper CD4+ T cells and cytotoxic CD8+ T cells are thought to serve a primary role in driving β cell destruc-tion during the development of type 1 diabetes (T1D) (1, 2). This notion emanates from studies strongly linking genetic risk to the HLA region (3). A pathogenic role for adaptive immunity is also supported by the development of T1D in recipients of bone marrow transplants from both twin and unrelated T1D donors (4, 5). In addition, adoptive transfer experiments in the NOD mouse model support the notion that T cells are both necessary and sufficient for disease development (6) and are retained in pancreatic draining lymph nodes (pLN) prior to and after disease onset (7, 8). Hence, there is great interest in monitoring and tracking the T cell repertoire during T1D pathogenesis.
Autoreactive T cells capable of recognizing β cell autoantigens (e.g., insulin, glutamic acid decarboxyl-ase [GAD], and insulinoma-associated protein-2 [IA-2], ref. 9) are present within the memory T cell pool in peripheral blood at higher frequencies in T1D subjects than in healthy controls (10, 11). However, the detection of autoreactive T cells presents numerous challenges and limitations, most notably a low precur-sor frequency coupled with a technical bias toward known antigens presented by a limited number of HLA
The adaptive immune repertoire plays a critical role in type 1 diabetes (T1D) pathogenesis. However, efforts to characterize B cell and T cell receptor (TCR) profiles in T1D subjects have been largely limited to peripheral blood sampling and restricted to known antigens. To address this, we collected pancreatic draining lymph nodes (pLN), “irrelevant” nonpancreatic draining lymph nodes, peripheral blood mononuclear cells (PBMC), and splenocytes from T1D subjects (n = 18) and control donors (n = 9) as well as pancreatic islets from 1 T1D patient; from these tissues, we collected purified CD4+ conventional T cells (Tconv), CD4+ Treg, CD8+ T cells, and B cells. By conducting high-throughput immunosequencing of the TCR β chain (TRB) and B cell receptor (BCR) immunoglobulin heavy chain (IGH) on these samples, we sought to analyze the molecular signature of the lymphocyte populations within these tissues and of T1D. Ultimately, we observed a highly tissue-restricted CD4+ repertoire, while up to 24% of CD8+ clones were shared among tissues. We surveyed our data set for previously described proinsulin- and glutamic acid decarboxylase 65–reactive (GAD65-reactive) receptors, and interestingly, we observed a TRB with homology to a known GAD65-reactive TCR (clone GAD4.13) present in 7 T1D donors (38.9%), representing >25% of all productive TRB within Tconv isolated from the pLN of 1 T1D subject. These data demonstrate diverse receptor signatures at the nucleotide level and enriched autoreactive clones at the amino acid level, supporting the utility of coupling immunosequencing data with knowledge of characterized autoreactive receptors.
2insight.jci.org doi:10.1172/jci.insight.88242
R E S E A R C H A R T I C L E
molecules. Technological advances, including the application of immunosequencing, have made it possible to analyze the molecular signature of a broad array of T and B cells as potential biomarkers of disease.
Despite playing a key role in disease development, questions remain regarding the diversity of the adaptive immune repertoire that gives rise to T1D. Namely, are there public (i.e., shared) T cell clones that are preferentially selected in patients with T1D, or is each person’s path to the disease unique? In T1D sub-jects, T cell receptor (TCR) sequencing efforts have detected clonal T cell expansions in pancreatic islets, spleen, and peripheral blood, but these studies were limited in sample size and have yet to be confirmed (12–14). Moreover, TCR overlap among pathogenic CD4+ effector T cells and protective Treg have yet to be investigated in human T1D. Likewise, B cell receptor (BCR) sequencing efforts have been limited overall (15, 16) and, in particular, in patients with T1D (17), despite a known role for B cells in contributing to T1D through their capacity to present antigens (18).
NOD mice spontaneously develop T1D and exhibit conserved autoreactive (e.g., insulin- and GAD-specific) TCR (19, 20). We reasoned that specific TCR and BCR sequences shared among patients would likely identify clones with a strong role in T1D pathogenesis and that these could then serve as informative biomarkers. Thus, we sought to address some of these long-standing questions, including whether certain autoreactive TCR and BCR sequences could be detected at greater frequency in tissues relevant to T1D (e.g., pLN and islets) relative to other tissues.
Treg TCR diversity is proposed to be beneficial in maintaining self-tolerance (21). Given emerging con-cepts of T cell plasticity, and its potential contribution to autoimmunity in animal models, we compared TCR overlap between Treg and conventional T cell (Tconv) populations from the pLN in T1D and control subjects. We hypothesized that Treg instability in T1D could result in clonal outgrowth of inflammatory T cells from Treg expressing shared TCR. To address these questions, we studied cells from pLN, mesenteric and/or inguinal “irrelevant” lymph nodes (iLN), spleen, peripheral blood, and intraislet samples obtained via the Network for Pancreatic Organ Donors with Diabetes (nPOD). Specifically, we isolated CD8+ T cells, CD4+CD127+ Tconv, CD4+CD127–CD25+ Treg, and CD19+ B cells by FACS and then examined the TCR and BCR repertoire through immunosequencing (22). Herein, we report on the diversity and tissue distribution of T and B cells in T1D and announce a public sequence databank, against which TCR and BCR sequences can be queried in future investigations.
ResultsOrgan donor tissue sample set. Prior studies characterizing the adaptive immune repertoire in T1D, particular-ly in living subjects, have been primarily restricted to studies of peripheral blood. A limited number of pan-creatic biopsies of living T1D patients have been undertaken; however, this procedure resulted in significant complications (23). To overcome this limitation, we obtained specimens from nPOD organ donors with and without T1D, which allowed us to determine whether such studies in peripheral blood broadly reflect the distribution of T and B cells in the target organ and pLN. Thus, we FACS-purified 100,000–250,000 cells of each lymphocyte subset (Treg, Tconv, CD8+ T cells, and B cells) to conduct immunosequencing of the TCR β chain (TRB) and BCR immunoglobulin heavy chain (IGH) from the pLN, spleen, iLN, periph-eral blood, and, in one case, pancreatic islets, of nPOD organ donors (24). Given variability in donor organ availability and consortium sample constraints, not all samples were represented for each subject. The sam-ples obtained for each donor and the TRB or IGH productive clonality, as determined by using the amino acid (AA) sequence of the third complementarity determining region (CDR3), are summarized in Figure 1.
nPOD donor demographic and health information is presented in Supplemental Table 1 (supplemental material available online with this article; doi:10.1172/jci.insight.88242DS1). Reported associations between HLA class II haplotypes (DRB1-DQA1-DQB1) and risk of developing T1D are summarized from the lit-erature in Supplemental Table 2 (25, 26), and donors were categorized based on whether they carried T1D-protective or T1D-susceptible HLA class II haplotypes (Supplemental Table 3). As expected, the majority of T1D donors possessed at least one of the T1D risk HLA haplotypes, while the majority of controls possessed at least one protective allele (25, 26). Despite this enrichment of susceptible HLA donors in T1D subjects, two controls were determined to also carry T1D risk-associated HLA (nPOD 6174 and 6254).
TRB or IGH gene usage in T1D. One Tconv sample derived from spleen (nPOD 6263) was sequenced in two separate runs. From this technical replicate, we approximated a clonal abundance threshold for repro-ducible sampling of the repertoire pool (0.50%; Supplemental Figure 1). For clones present at or above this cutoff, we examined pLN TRBV and IGHV gene usage and observed apparent trends toward unique V gene
3insight.jci.org doi:10.1172/jci.insight.88242
R E S E A R C H A R T I C L E
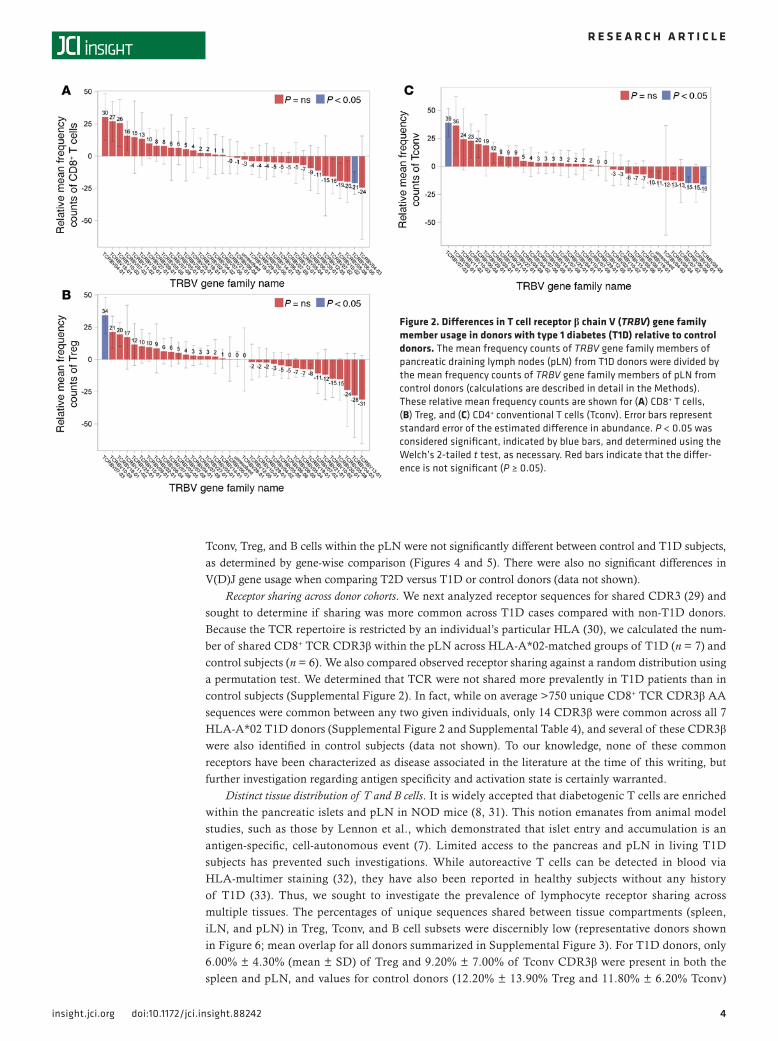
family distribution within the T and B cell subsets for T1D versus control subjects (Figures 2 and 3). These data suggest that T1D subjects demonstrate multiple receptor biases (27); however, we cannot exclude the possibility that this observation may be subject to HLA influences or other components of disease state.
The CDR3 loop of the TRB (CDR3β), which is directly responsible for engaging antigenic peptides in the context of HLA, is determined by the highly variable recombination events that join the TRB V(D)J gene segments (28). Similar recombination events result in the BCR IGH; thus, V(D)J gene usage is critical in determining the T cell and B cell repertoire. However, V and J gene usage and pairing in CD8+ T cells,
Figure 1. Productive clonality for donor samples showing unique T cell receptors (TRB) and B cell receptors (IgH) depicted by heatmap. Organ donors are listed along the y axis according to Network for Pancreatic Organ Donors with Diabetes (nPOD) case number and disease status. FACS-isolated cell subsets and tissue source are listed on the x axis. This cohort analysis resulted in an average of 35,822 unique sequences per sample, totaling an average of 46,523 total templates per sample. Dark gray boxes indicate samples that were not available for immunosequencing. Heatmap values depict productive clonality ranging from 0 to 0.6, with red to blue coloring centered at 0.1 (indicated by a black line). Productive clonality is a normalized score based on diversity and sample entropy, with higher values (blue) representing enriched oligoclones (samples with fewer predominant rearrangements). Conversely, clonality values approaching 0 (red) represent samples with highly diverse repertoire. For nPOD 6323, intraislet CD4+ and CD8+ T cells were also available for immunose-quencing. †nPOD 6274 classification as T2D is based on a prior diagnosis, despite subsequent resumption of metabolic normalcy following gastric bypass surgery. pLN, pancreatic draining lymph node; iLN, “irrelevant” mesenteric and/or inguinal lymph node; PBMC, peripheral blood mononuclear cells; Tconv, conventional T cells; T1D, type 1 diabetes; T2D, type 2 diabetes; FDB, control, other/Flatbush diabetes; AAb+, autoantibody positive without diabetes.
4insight.jci.org doi:10.1172/jci.insight.88242
R E S E A R C H A R T I C L E
Tconv, Treg, and B cells within the pLN were not significantly different between control and T1D subjects, as determined by gene-wise comparison (Figures 4 and 5). There were also no significant differences in V(D)J gene usage when comparing T2D versus T1D or control donors (data not shown).
Receptor sharing across donor cohorts. We next analyzed receptor sequences for shared CDR3 (29) and sought to determine if sharing was more common across T1D cases compared with non-T1D donors. Because the TCR repertoire is restricted by an individual’s particular HLA (30), we calculated the num-ber of shared CD8+ TCR CDR3β within the pLN across HLA-A*02-matched groups of T1D (n = 7) and control subjects (n = 6). We also compared observed receptor sharing against a random distribution using a permutation test. We determined that TCR were not shared more prevalently in T1D patients than in control subjects (Supplemental Figure 2). In fact, while on average >750 unique CD8+ TCR CDR3β AA sequences were common between any two given individuals, only 14 CDR3β were common across all 7 HLA-A*02 T1D donors (Supplemental Figure 2 and Supplemental Table 4), and several of these CDR3β were also identified in control subjects (data not shown). To our knowledge, none of these common receptors have been characterized as disease associated in the literature at the time of this writing, but further investigation regarding antigen specificity and activation state is certainly warranted.
Distinct tissue distribution of T and B cells. It is widely accepted that diabetogenic T cells are enriched within the pancreatic islets and pLN in NOD mice (8, 31). This notion emanates from animal model studies, such as those by Lennon et al., which demonstrated that islet entry and accumulation is an antigen-specific, cell-autonomous event (7). Limited access to the pancreas and pLN in living T1D subjects has prevented such investigations. While autoreactive T cells can be detected in blood via HLA-multimer staining (32), they have also been reported in healthy subjects without any history of T1D (33). Thus, we sought to investigate the prevalence of lymphocyte receptor sharing across multiple tissues. The percentages of unique sequences shared between tissue compartments (spleen, iLN, and pLN) in Treg, Tconv, and B cell subsets were discernibly low (representative donors shown in Figure 6; mean overlap for all donors summarized in Supplemental Figure 3). For T1D donors, only 6.00% ± 4.30% (mean ± SD) of Treg and 9.20% ± 7.00% of Tconv CDR3β were present in both the spleen and pLN, and values for control donors (12.20% ± 13.90% Treg and 11.80% ± 6.20% Tconv)
Figure 2. Differences in T cell receptor β chain V (TRBV) gene family member usage in donors with type 1 diabetes (T1D) relative to control donors. The mean frequency counts of TRBV gene family members of pancreatic draining lymph nodes (pLN) from T1D donors were divided by the mean frequency counts of TRBV gene family members of pLN from control donors (calculations are described in detail in the Methods). These relative mean frequency counts are shown for (A) CD8+ T cells, (B) Treg, and (C) CD4+ conventional T cells (Tconv). Error bars represent standard error of the estimated difference in abundance. P < 0.05 was considered significant, indicated by blue bars, and determined using the Welch’s 2-tailed t test, as necessary. Red bars indicate that the differ-ence is not significant (P ≥ 0.05).
5insight.jci.org doi:10.1172/jci.insight.88242
R E S E A R C H A R T I C L E
were similar. Conversely, CDR3β overlap among these tissues was more abundant in the CD8+ T cell compartment for T1D (36.00% ± 21.00%) and control donors (47.70% ± 19.10%) as well as in T2D donors (51.40% ± 7.90%) (Supplemental Figure 3).
In a case study of a donor (nPOD 6323) with 6-year T1D duration; high-risk HLA (Supplemental Table 3); insulitis of insulin– islets (Figure 7A) as well as of islets containing residual insulin+ cells (Fig-ure 7, B and C); and CD19+ B cell infiltrate around the islets (Figure 7D), we compared CDR3β AA sequence overlap across spleen, pLN, peripheral blood mononuclear cells (PBMC), and intraislet T cells; B cell samples were not available for this comparison. Of the 399 CD8+ intraislet CDR3β AA sequences identified, 58 were also present in the pLN, and, of these, 53 were found in PBMC (Figure 7E). Conversely, the intraislet T cell compartment included 527 unique Tconv CDR3β, but only 7 were also identified in the pLN, and of these 7, none were also found in PBMC or spleen (Figure 7F). These data support the notion of CD4+ T cell tissue restriction and CD8+ TCR overlap across tissues. Treg could not be FACS purified from the intraislet sample (Supplemental Figure 4, A–C); moreover, only 2 of 527 intraislet CD4+ T cell CDR3β AA sequences were common to the Treg subset in either pLN or spleen (Figure 7G). Despite this paucity of FACS-isolated intraislet Treg, immunofluorescence staining demonstrated the in situ presence of CD4+FOXP3+ Treg in the exocrine pancreas as well as islets detected by immunohistochemistry (Sup-plemental Figure 4D). While these data represent a single case, they highlight several important concepts: (a) the islets and associated pLN may provide a highly restricted repertoire of CD4+ T cells; (b) CD8+ T cells, as opposed to CD4+ Tconv or Treg, may provide better biomarkers of T1D, given their overlap among tissues and in circulation; and (C) Treg may be present in the infiltrated islets, albeit sparsely, given the low levels of insulitis in established T1D (34).
Comparable receptor diversity. It has been suggested that a lack of Treg receptor diversity may contribute to the development of autoimmunity and T1D (21). We also hypothesized that outgrowth of autoreactive T cells might result in reduced diversity in the Tconv and/or CD8+ T cell compartments in T1D subjects.
Figure 3. Differences in immunoglobulin heavy chain V (IGHV) gene family member usage in donors with type 1 diabetes (T1D) relative to control donors. The mean frequency counts of IGHV gene family members of pancreatic draining lymph nodes (pLN) from T1D donors were divided by the mean frequency counts of IGHV gene family members of pLN from control donors (calculations are described in detail in the Methods). These relative mean frequency counts are shown for CD19+ B cells from pLN tissue. Error bars represent standard error of the estimated difference in abundance. P < 0.05 was considered significant and determined using the Welch’s 2-tailed t test, as necessary. Red bars indicate that the difference is not significant (P ≥ 0.05).
6insight.jci.org doi:10.1172/jci.insight.88242
R E S E A R C H A R T I C L E
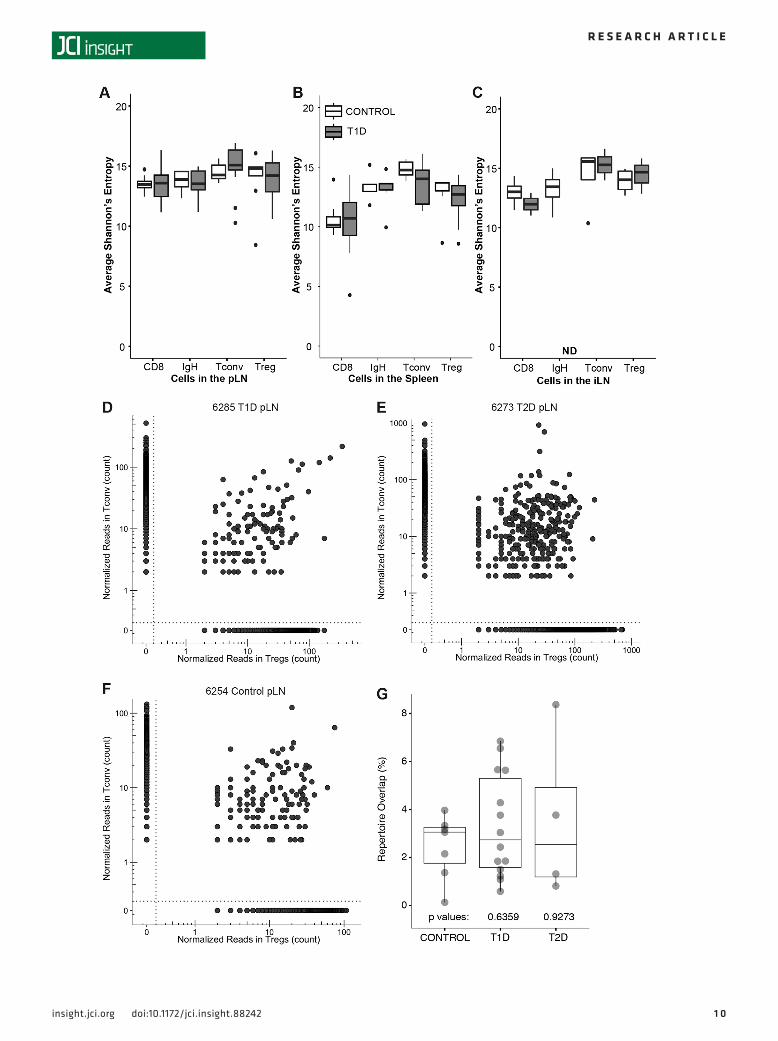
However, when comparing each sample type in the context of disease state, clonal diversity scores were not found to be significantly different between T1D and control donors (Figure 8, A–C). While not signifi-cant for independent subject cohorts, we did note a trend toward increased clonality (thus, reduced TRB diversity) within the pLN CD8+ T cells with donor age when all subjects were analyzed (r = 0.39, P = 0.07; Supplemental Figure 5, A–C). Productive clonality for CD8+ T cells (Supplemental Figure 5D), Tconv (Supplemental Figure 5E), and Treg (Supplemental Figure 5F) was comparable across T1D, T2D, and con-trol donor groups with one exception: CD8+ T cell clonality was markedly increased in spleen samples from T2D donors, possibly related to older donors in the T2D group (Supplemental Table 1).
Treg lineage instability and T cell plasticity have been suggested to contribute to autoimmunity via the expansion of autoreactive CD4+ effector cells from a regulatory parent clone (35). We therefore expected to observe TRB sharing between Treg and Tconv in the pLN of subjects with T1D. However, for most donors, few TCR clones were enriched in both subsets, countering the notion of a common progenitor, and repertoire over-lap was comparable in T1D, T2D, and control donor groups (Figure 8, D–G). It is important to consider that if Treg-to-Tconv conversion is highly efficient, we still may not have detected overlap between the two populations.
Figure 4. V and J gene usage and pairing for the top 30 T cell receptor β chain (TCRβ) V genes. Average V and J gene usage within the pancreatic draining lymph node (pLN) of (A, C, and E) T1D and (B, D, and F) control organ donors. Prevalence of each V-J gene pair was not significantly different between T1D and control donors within (A and B) CD8+ T cells (CD8), (C and D) CD4+ conventional T cells (Tconv), or (E and F) CD4+ Treg (P = NS, unpaired t test).
7insight.jci.org doi:10.1172/jci.insight.88242
R E S E A R C H A R T I C L E
Identification and frequency of known autoreactive and enriched TCR in T1D. We examined our immunose-quencing data to determine the total number of reads corresponding to known T1D-related autoreactive TCR clones from the reported literature or our own data. On a broad scale, we compared their prevalence in the Tconv, Treg, and CD8+ T cell subsets for T1D versus non-T1D donors (i.e., T2D, Flatbush diabetes [FBD], AAb+, and control combined). For nearly all autoreactive clones described to date, significant differ-ences in receptor frequencies were observed between T1D versus non-T1D donors (Tables 1 and 2).
We compared our immunosequencing data against a published list of T cell clones (proinsulin specific and of unknown reactivity) previously identified by Pathiraja et al. from the pancreatic islets of a T1D organ donor (36) as well as a list of GAD-reactive TCR characterized by Eugster et al. (37) (Supplemental Table 5). For the intraislet case (nPOD 6323), we identified 12 of the GAD-reactive clones present within the pLN, and, of these, 4 were common to multiple tissue types; however, none of the Pathiraja or Eugster sequences were found in the intraislet region (Supplemental Table 6).
We also queried our immunosequencing data for 5 known autoreactive TCR CDR3β AA sequences for which we have TCR expression vectors to generate de novo antigen-specific T cells by lentiviral TCR gene transfer (data not shown). IGRP-reactive clone 32 (38) and insulin-A clone SD32.5 (39) were each found in only one sample at very low frequencies. Similarly, an insulin-B–reactive clone (40) and GAD clone R164 (41) were identified at low frequencies in 3 and 4 samples, respectively. The latter was only detected among T2D and control subjects. Alternatively, GAD-PM1#11 (42) was found in 20 samples from T1D, T2D, and control donors (Supplemental Table 5); yet again, these clones were not observed in the intraislet sample.
We investigated the prevalence of a known autoreactive TCR specific for GAD65(555–567) presented in the context of HLA-DR*04:01 (CDR3β AA sequence: CASSLVGGPSSEAFF). This particular clone (GAD4.13), which uses TCR α chain V gene (TRAV) 12.1 and TRB V gene (TRBV) 5.1, was previously reported to be enriched in PBMC of T1D patients in comparison with controls (10, 43) and has since been extensively studied in human HLA- and TCR-transgenic mouse models. Interestingly, a clone matching the GAD4.13 CDR3β sequence, which utilized TRBV 5.1 (specifically, β chain genes V05-01*01, D01-01*01, J01-01*01), was substantially enriched in one pLN of a T1D donor positive for autoantibodies (AAb+) against GAD (Supplemental Table 5 and Figure 9) with T1D-permissive HLA class II alleles (nPOD 6265, Supplemental Table 3). In fact, this clone represented an astounding 25.2% of the Tconv population in this pLN, indicating clonal dominance and making it the most abundant clone found in the pLN in this or any sample in this data set (Supplemental Figure 6). Additionally, the same CDR3β sequence was identified as the most abundant clone in the pLN Treg and CD8+ T cell subsets of that same donor (Figure 9B). This intermediate-affinity GAD4.13 clone interestingly develops an IL-10–producing (i.e., reportedly tolero-genic) phenotype in human HLA-DR*04-01 transgenic mice (41). This is in contrast to the higher affinity GAD(555–567)–specific clone R164 that shares the same TRAV 12.1 and TRBV 5.1 gene usage, differing from GAD4.13 in only 3 CDR3β AAs.
Notably, GAD4.13 was present in varying tissues of 6 other T1D subjects, including the intraislet sample of nPOD 6323, and in only 1 of the controls (nPOD 6254) at lower frequency. Of note, control donor 6254 possessed T1D-permissive HLA (Supplemental Table 3) and exhibited histological evidence of
Figure 5. V and J gene usage and pairing for the top 30 immunoglobulin heavy chain (IgH) V genes. Average V and J gene usage within the pancreatic draining lymph node (pLN) of (A) T1D and (B) control organ donors. Prevalence of each V-J gene pair was not significantly different between T1D and control donors within B cells (IgH) (P = NS, unpaired t test).
8insight.jci.org doi:10.1172/jci.insight.88242
R E S E A R C H A R T I C L E
chronic pancreatitis, with fatty deposits, fibrosis, and CD3+ lymphocytic infiltration, despite being negative for T1D-related AAb (Supplemental Figure 7); though available medical history is limited, and clinical diagnosis of pancreatitis cannot be confirmed. Thus, in this case, the presence of this clone may be related to inflammation within the pancreas without overt diabetes.
We next assessed clonal sharing between our data set and that obtained from a T1D patient with recur-rent autoimmunity following a simultaneous pancreas-kidney transplant (44). We hypothesized that these particular sequences would represent clones that were presumably long lived and pathogenic, given their enrichment concurrent with the reemergence of GAD-autoreactive T cells and AAb and with β cell dys-function (Supplemental Table 7). Indeed, we observed that a number of the reported GAD(555–567)–reactive
Figure 6. Immune subsets display distinct receptor distributions among various tissues. The percentage of unique T cell receptor β chain (TRB) and B cell receptor (BCR) immunoglobulin heavy chain (IGH) complementarity determining region 3 (CDR3) amino acid (AA) sequences shared across the pancreatic draining lymph node (pLN, yellow), spleen (blue), and “irrel-evant” mesenteric and/or inguinal lymph node (iLN, red) is shown for representative donors (control [nPOD 6271], T1D [nPOD 6207], and T2D [nPOD 6273]) and donors within the Treg, CD4+ conventional T cell (Tconv), CD8+ T cell, and CD19+ B cell subsets. B cells were not available for the T1D donor. pLN and spleen B cells were compared for another T1D donor (nPOD 6264), and iLN B cells were also not available (n/a).
9insight.jci.org doi:10.1172/jci.insight.88242
R E S E A R C H A R T I C L E
TRB sequences (44) overlapped with sequences observed from a large number of our study subjects (17 matching samples), including an HLA-matched (HLA-DRB1*04-05) subject (subject 6249) at a frequency of 0.128% (Supplemental Table 8).
Pairing TCR α chain and β chain. CD4+ and CD8+ T cells expanded from the islets of patient 6323. To resolve individual TCR, a microfluidic platform (Fluidigm C1) was used to isolate and amplify single-cell cDNA libraries. RNAseq analysis on these cells revealed the highest frequency CD4+ T cell clone (26.9%, after in vitro expansion) paired the TCR α chain gene TRAV 08-04 with TRAJ 10 (CDR3α: CALGGRGGGNKLTF) and β chain gene TRBV 11-02*02 with TRBD 01-01*01 and TRBJ 01-02*01 (CDR3β: CASSLVGQNYGY-TF; Supplemental Table 8); although the actual specificity of the intraislet clones is yet to be determined.
Searching for CASSLVGQNYGYTF within the high-throughput sequencing data reveals that 36 dif-ferent DNA sequences contributed to the frequency of that CDR3β within the 6323 intraislet CD4+ T cell sample. Further analysis revealed a bias toward its presence within autoimmune donors (within the 1 AAb+ donor and the 6 T1D donors), and, moreover, it was found exclusively in the Tconv compartment (7 of 7) and predominantly within the pLN (6 of 7). Conversely, in control donors, the sequence was predomi-nantly found in the Treg compartment (5 of 7), including both clones found within the pLN deriving from the Treg subset (2 of 2).
A similar single-cell sequencing approach was applied in an effort to gain additional TCR gene usage information from the pLN of nPOD 6265. We obtained an additional sample of cryopreserved pLN cells from the nPOD repository for single-cell sequencing, allowing for TCR α/β chain pairing. To our surprise, none of the 94 CDR3β sequences matched that of the GAD4.13 clone (Supplemental Table 9), despite the 1 in 4 frequency of abundance predicted from prior sampling (Figure 9). Absence of the clone from this
Figure 7. T cell receptor (TCR) sharing among intraislet and peripheral tissues. Spleen, peripheral blood mononu-clear cells (PBMC), pancreatic draining lymph node (pLN), and pancreatic islets harbor distinct adaptive immune rep-ertoires in a 22-year-old organ donor (nPOD 6323) with type 1 diabetes (T1D) for 6 years. (A) The CD3+ insulitis lesion is evident by histology of insulin– islets within the pancreas tail region (CD3, brown; glucagon, red; scale bar: 100 μm). Serial sections of the pancreatic tail region show two islets with (B) insulitis (CD3, brown; glucagon, red) and (C) residual insulin+ β cells (Ki67, brown; insulin, red; scale bar: 200 μm). (D) CD19+ B cells were also observed surrounding an islet within the pancreatic head region (CD19, brown, glucagon, red; scale bar: 100 μm). The Venn diagrams show the absolute number of unique (E) CD8+ T cells, (F) CD4+ conventional T cells (Tconv), and (G) Treg complementarity determining region 3 β chain (CDR3β) amino acid (AA) sequences shared across PBMC (blue), intraislet (green), pLN (red), and spleen (orange) samples. Within the intraislet region, no Treg were isolated, so only total CD4+ or CD8+ sequences were available for comparison. The numbers show the CDR3β AA sequence overlap between the indicated tissue and the islet sample calculated for each clone that is detected in both samples: number of shared templates/total templates in both samples. Additional histology is freely available for review at the nPOD Aperio database with login credentials (http://ahc-path-apr01.ahc.ufl.edu/Login.php, for which the password request form can be found at http://www.jdrfnpod.org/for-investigators/password-request-form/).
1 0insight.jci.org doi:10.1172/jci.insight.88242
R E S E A R C H A R T I C L E
1 1insight.jci.org doi:10.1172/jci.insight.88242
R E S E A R C H A R T I C L E
second pLN sample was also observed using a HLA-DR*04-01 GAD-peptide-loaded tetramer (555–567; 557I) that was originally used to isolate the GAD4.13 clone (data not shown) (45). These findings highlight the potential for heterogeneity among nPOD pLN; however, to evaluate the degree of heterogeneity will require direct testing of multiple pLN.
Identification of BCR that bind insulin. Following our analysis of autoreactive T cells, we sought to char-acterize the BCR signature from pLN samples, as B cells are thought to play a key role in antigen presen-tation. We specifically limited the analysis of our immunosequencing data to IGH CDR3 (CDRH3) AA sequences of B cells that were isolated based on binding to an insulin antigen (IBC) adsorbent followed by single-cell sorting (17). Thirty-one IBC CDRH3 sequences were determined de novo from the peripheral blood of healthy subjects without diabetes. We queried our sequencing data derived from nPOD pLN, iLN, and spleen B cell samples for these 31 CDRH3 sequences, and two were identified; each returned 4 hits from 3 nPOD donors as partial matches for CDRH3 AA sequences (RRRMDV and DDYYDSSGYYP; Supplemental Table 10). Both of the sequences were found at relatively high frequencies in T1D donor 6161 (1.22% and 0.64%, respectively), but there were also matches in the control (nPOD 6271 and 6289), T2D (nPOD 6274), and FBD (nPOD 6284) cohorts, albeit at much lower frequencies.
We also compared insulin-reactive clones previously reported from peripheral blood by Wardemann et al. (46) and by Thomas (46, 47) to our immunosequencing data. We observed sequence overlap between two of the CDRH3 AA sequences from those published by Wardemann et al. (46) (clones DRSYYYYG-MDV and LWFGSYYYYGMDV). Indeed, the clones were identified at lower frequencies from 3 T1D subjects and 1 T1D subject, respectively, as well as 1 control and 1 FBD donor (Supplemental Table 10). No overlap was observed with clone sequences reported by Thomas (46, 47).
DiscussionThere is a pressing need to understand the complexity of the adaptive immune repertoire as it pertains to T1D pathogenesis. While significant progress has been made in identifying disease-related autoantigens, an extensive and unbiased analysis of the T and B cell repertoire has yet to be conducted. In this study, we per-formed immunosequencing of the TCR and BCR loci on FACS-purified lymphocyte subsets from the pLN and other lymphoid tissues to determine the adaptive repertoire in organ donors with and without T1D. Previous efforts to characterize the TCR repertoire in T1D subjects have been limited to tissues obtained from few or even a mere single organ donor (12, 13) or were restricted to peripheral blood samples (14, 37). Furthermore, BCR sequencing data in human samples is limited, particularly in subjects with T1D (15, 16). Thus, to our knowledge, this report contains the most comprehensive TCR and BCR data set from human pLN, spleen, and islet tissues from T1D donors available to date.
Our analysis indicates that the frequency of pLN TCR clone sharing across organ donors was limited and comparable between T1D and control groups. While there was a preference for certain Vβ gene fami-lies in T1D versus control donors, we did not observe significant common V-J gene pairing across T1D donors. These data do not support the notion that overt repertoire shifts can readily discriminate T1D sub-jects. However, it is possible that with more precise HLA matching and increased sample size, clone sharing may become more apparent near disease onset.
Treg and Tconv TCR repertoires show high exclusivity in pLN and spleen, with only CD8+ T cells showing appreciable receptor sharing across tissues. Similarly, in a T1D subject with insulitis (nPOD 6323), minimal Tconv repertoire overlap was observed between intraislet and pLN samples, in contrast to observa-tions made in NOD mice (48, 49). While we could detect Treg in situ in the islets of this donor by multi-immunofluorescence, these cells were too few to allow isolation via FACS, preventing intertissue com-
Figure 8. Lymphocyte repertoire diversity was comparable between donors with type 1 diabetes (T1D) and control donors. Receptor repertoire diversity was calculated using the Shannon Diversity Index for CD8+ T cells (CD8), B cells (IGH), CD4+ T conventional cells (Tconv), and Treg isolated from (A) pancre-atic draining lymph node (pLN), (B) spleen, and (C) “irrelevant” mesenteric and/or inguinal lymph node (iLN), and diversity scores were compared for T1D (gray) versus control (white) subjects (P = NS, all). Data are presented using box-and-whisker plots, with the points representing outliers defined as > (×1.5 IQR + Q3) or < (Q1-1.5 × IQR). T cell receptor (TCR) clones observed in the Treg (x axis) and Tconv (y axis) subsets within the pLN of representative (D) T1D (nPOD 6285), (E) type 2 diabetes (T2D; nPOD 6273), and (F) control (nPOD 6254) subjects are shown in scatter plots, with each point representing a unique clone and its position along the axes representing the clone’s frequency in either subset. Sequences present in only the Tconv subset are to the left of the vertical dotted line, while those detected only in the Treg subset are below the horizontal dotted line. T cell clones common to both subsets are shown in the top right quadrant above and to the right of the dotted lines. (G) Box-and-whisker plots depict the percentage of TCR clones shared between Tconv and Treg subsets within the pLN (median ± distribution, P = NS, Mann-Whitney U test).
1 2insight.jci.org doi:10.1172/jci.insight.88242
R E S E A R C H A R T I C L E
parison of the Treg repertoire. Twelve known GAD-reactive clones were found in the pLN of case 6323, and four of these were also present within the donor’s spleen and/or PBMC, albeit at low frequency. While previous studies using tetramers clearly indicate that islet-auto-reactive T cells can be found in the periphery (10, 37), the data presented here from pLN and spleen suggest that these clones are extremely rare in peripheral blood, if present at all. This
Figure 9. Detection of a highly enriched T cell receptor β chain (TCRβ) complementarity deter-mining region 3 (CDR3) identical to a known glutamic acid decarboxyl-ase–reactive (GAD-reactive) clone in the pancreatic draining lymph node (pLN) of a subject with type 1 diabetes (T1D). Heatmaps depict the (A) clone frequency and (B) clone rank of a TRB CDR3 region identical to that of the known GAD65-specific TCR clone GAD4.13 detected within the regulatory T cell (Treg), conventional T cell (Tconv), and CD8+ T cell (CD8) subsets in the spleen, pancreatic draining lymph node (pLN), and “irrelevant” mesenteric and/or inguinal lymph node (iLN) of type 1 diabetes (T1D; n = 7) and control (n = 1) organ donors. For nPOD 6323 (seventh row), intraislet T cells were expanded prior to sorting, which prevented distinction of Treg from Tconv, so total CD4+CD8– T cells are depicted. Dark gray boxes indicate samples that were not observed to contain the TCR clone. For both heatmaps (A and B), orange represents the abundant clones, while blue represents those present at lower abundance. The amino acid (AA) sequence of the CDR3 from GAD4.13 was the most abundant receptor in the pLN of T1D subject nPOD 6265 (sixth row), representing approximately 25.2% of all produc-tive TCR clones within the Tconv cells isolated from the pLN. (C) The packed bubble plot (Tableau Soft-ware) depicts the frequency of the AA CDR3 from GAD4.13 (red circle, CASSLVGGPSSEAFF) in the nPOD 6265 pLN Tconv sample relative to all other sequences (blue circles).
1 3insight.jci.org doi:10.1172/jci.insight.88242
R E S E A R C H A R T I C L E
reinforces the challenge of detecting antigen-specific T cells without a period of antigen-driven in vitro expansion. Additional studies of AAb+ donors without diabetes or those with recent-onset T1D will be required to draw a firm conclusion regarding tissue distribution of autoreactive clones at disease onset.
Insulitis in human T1D is limited and negatively correlates with disease duration (50). Of note, our data from case 6323 potentially identified only one known GAD-reactive clone (GAD4.13) in the islet region. This likely reflects low intraislet T cell recovery, but may also suggest high exclusivity between the islets and pLN. Alternatively, it is possible that within the pLN, detection of pathogenic clones may depend upon the proxim-ity of the sampled LN to an active insulitis lesion. In contrast to NOD mice, human insulitis and HLA class I overexpression can be found in only a small percentage of the pancreatic islets (50) and occurs in a lobular fashion (45, 51–53). This may imply that future studies investigating the T cell repertoire in the pLN should document the anatomical position of the LN in relation to nearby histological findings within the pancreas.
The acquisition of additional intraislet and antigen-specific T cells, as well as single-cell analyses, are currently ongoing in our laboratory along with several groups within the nPOD network and the Integrated Islet Distribution Program (12, 13, 36, 54). We expect these consortium efforts will improve resolution of the adaptive signature in T1D, particularly given the heterogeneous distribution of insulitis within donor pancreata (50, 53, 55).
While searching our immunosequencing data for known autoreactive T cell clones, the CDR3β AA sequence of GAD4.13 was readily identified in 7 T1D donors. This implies that a targeted search for well-characterized TCR may be needed to identify key clones. GAD4.13 was solely and dramatically immuno-dominant in a GADA+, C-peptide+ donor with longstanding T1D (nPOD 6265). Curiously, the receptor was not only identified in the Treg and Tconv subsets, but was also dominant in the CD8+ T cell population. Recent reports of class II–restricted CD8+ T cells in both macaques and humans (56) would suggest that tetramer-sorting experiments are needed to examine a potential role for class II–restricted CD8+ T cells in T1D patients. Alternatively, this may imply alternate TCR α chain pairing and, thus, different antigen rec-ognition or may have resulted from minor crossover sort contamination, given that the top clone from each sample shared the same nucleotide sequences. Inversely, 9 different clones, identified by dissimilar DNA sequences, contributed to the total GAD4.13 CDR3 within the 6265 pLN samples.
Nonetheless, the clear enrichment present in nPOD 6265 highlights the utility of assessing clone fre-quency of well-characterized and validated TCR and the importance of ongoing efforts to expand the list of known autoreactive clones for biomarker studies (20, 37). Toward expanding this notion, we have created an open-access TCR and BCR sequence (nucleic and AA) library (http://clonesearch.jdrfnpod.org/) that can be queried against to discover the frequency and tissue distribution of additional clones present in our data set.
We sought to investigate if chronic autoimmunity in T1D significantly altered conventional, Treg, or CD8+ T cell diversity across donor tissues. Overall, TCR diversity was not significantly different between T1D and control subjects in any of the cell types or tissues evaluated. Future experiments identifying the predominant clones in tissues obtained from donors with recent-onset T1D (< 3 months) and multiple AAb+ donors without diabetes (considered to be progressing toward T1D onset, refs. 57, 58) would be of great interest in determining whether reduced Treg diversity in the pLN or peripheral lymphoid tissues precedes disease onset (59).
We expected T1D subjects to exhibit increased TRB overlap between Treg and Tconv subsets com-pared to the degree of sharing among control subjects. Aside from the enriched GAD4.13 clone in nPOD 6265, such TCR sharing was infrequent in both T1D and control subjects. Disease duration in T1D donors was 11.5 ± 6.24 years (Supplemental Table 1), so it is possible that diabetogenic clones had contracted by the time of organ harvest in the majority of donors, again indicating a need for investigation in recent-onset T1D and AAb+ donors. The potential for lineage plasticity and limitation of one-time sampling make these questions challenging in humans but the loss of FoxP3 expression and acquisition of an effector phenotype in Tregs has been demonstrated through T cell lineage tracing studies in animal models (60).
The data presented here begin to elucidate the T and B cell repertoire in the human pancreas and/or pLN. One key limitation to a high-throughput approach is that TRB and IGH sequencing was performed on bulk DNA — not at the single-cell level; thus, we cannot truly denote function of a particular clone as pathogenic versus regulatory. Further investigations, including a more detailed characterization of naive versus activated/memory populations, identification of the antigen specificity of enriched clones, and in silico TCR (or BCR) reconstruction may be required to facilitate autoantigen discovery and validation.
1 4insight.jci.org doi:10.1172/jci.insight.88242
R E S E A R C H A R T I C L E
Table 1. Previously described complementarity determining region 3 (CDR3) β chain amino acid (AA) sequences from autoreactive T cell receptor (TCR) clones reported in the literature identified in tissues from Network for Pancreatic Organ Donors with Diabetes (nPOD) organ donors
CDR3 AA sequence T1D Non-T1DTreg CD8+ Tconv Treg CD8+ Tconv P value Reference
The total number of reads corresponding to a given CDR3 AA sequence within the three T cell subsets examined (Treg, CD8+ T cell, and CD4+ conventional T cell [Tconv]) is reported for type 1 diabetes (T1D) and non-T1D (type 2 diabetes, control, autoantibody positive, and other/Flatbush diabetes combined) donors. The total number of donors with the CDR3 AA sequence is shown in parentheses. Data are derived from all tissue sources analyzed (spleen, peripheral blood mononuclear cells, pancreatic draining lymph node, “irrelevant” mesenteric and/or inguinal lymph node, and intraislets). Therefore, the first column for each subset represents the sum of reads corresponding to the CDR3 AA sequence from all tissue types from all T1D or non-T1D donors. The second column for each subset (numbers in parentheses) indicates the total number of T1D or non-T1D donors for which the CDR3 AA sequence was detected. Clone counts were compared for T1D versus non-T1D subjects using a χ2 test. –, there were too few reads corresponding to the CDR3 AA sequence for comparison by χ2 test. ACD8 were excluded from analysis; BTreg were excluded from analysis; CAAb+ Case 6197 HLA-A*02:02; Dnon-T1D Case 6289 HLA-DRB1*04:11, 07:01.
1 5insight.jci.org doi:10.1172/jci.insight.88242
R E S E A R C H A R T I C L E
To this end, the use of emerging technologies, including single-cell studies, could dramatically improve sample analysis throughput by in silico TCR α/β chain pairing.
While our data do not support the notion of an overtly skewed TCR and/or BCR repertoire in T1D, they support the notion of convergent recombination leading to a number of enriched autoreactive clones present in T1D subjects. Our data also highlight the challenge of restricted tissue distribution of CD4+ T cells, in particular, when considering T cells as biomarkers of disease. However, it remains pos-sible that, with increased sample size and HLA matching, high-resolution immunosequencing data could provide a powerful data set for the discovery and validation of a combinatorial TCR and BCR signature in T1D. Acquiring a data set of this breadth, in particular from pancreatic tissues, will almost certainly prove a prodigious effort. Despite these challenges, the application of immunosequencing technologies offers the unique opportunity to understand the evolution of the antigen-specific immune repertoire in T1D, effectively utilizing the molecular “barcode” of the TCR and BCR for monitoring disease develop-ment, therapeutic immune interventions, and antigen-directed therapies.
MethodsHuman tissue donors. Tissues were recovered from transplant-grade organ donors (n = 18 T1D; n = 4 T2D; n = 9 control subjects without diabetes and negative for β cell AAb; n = 1 AAb+ subject without diabetes; and n = 1 subject with other/FBD), according to the inclusion criteria donor demographics, and clini-cal values were determined via medical records; nPOD laboratories performed serological assessments as described (Supplemental Table 6) (24).
Histology. Paraffin sections were dewaxed, and low pH antigen retrieval was performed (Citra, Bio-genex) followed by blocking with normal goat serum. Sections were then incubated with primary anti-bodies (rat anti-human-FOXP3 [eBioscience, 14-4776-80; clone PCH101] and mouse anti-CD4 [Dako Cytomation, M7310]) overnight at 4°C, washed, and incubated with secondary antibodies (goat anti-rat-AF488 and goat anti-mouse-AF555, Invitrogen). Sections were mounted with ProLong Gold Anti-fade mounting media containing DAPI (Life Technologies). Positive controls included human spleen. Images were obtained with multichannel image acquisition software on a Zeiss Axiophot microscope using a ×40 objective (AxioVision, Carl Zeiss Inc.). Numbers of CD4+ cells with and without specific nuclear FOXP3 staining were counted using Adobe Photoshop for islets (n = 23), exocrine regions
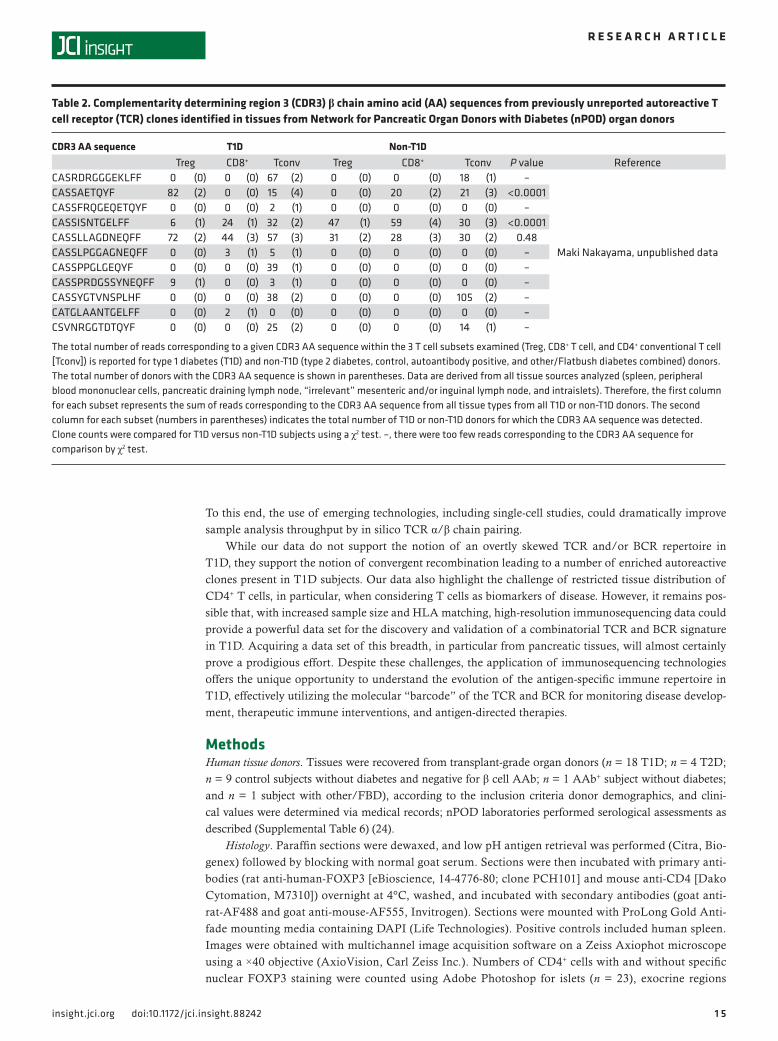
Table 2. Complementarity determining region 3 (CDR3) β chain amino acid (AA) sequences from previously unreported autoreactive T cell receptor (TCR) clones identified in tissues from Network for Pancreatic Organ Donors with Diabetes (nPOD) organ donors
CDR3 AA sequence T1D Non-T1D Treg CD8+ Tconv Treg CD8+ Tconv P value Reference
The total number of reads corresponding to a given CDR3 AA sequence within the 3 T cell subsets examined (Treg, CD8+ T cell, and CD4+ conventional T cell [Tconv]) is reported for type 1 diabetes (T1D) and non-T1D (type 2 diabetes, control, autoantibody positive, and other/Flatbush diabetes combined) donors. The total number of donors with the CDR3 AA sequence is shown in parentheses. Data are derived from all tissue sources analyzed (spleen, peripheral blood mononuclear cells, pancreatic draining lymph node, “irrelevant” mesenteric and/or inguinal lymph node, and intraislets). Therefore, the first column for each subset represents the sum of reads corresponding to the CDR3 AA sequence from all tissue types from all T1D or non-T1D donors. The second column for each subset (numbers in parentheses) indicates the total number of T1D or non-T1D donors for which the CDR3 AA sequence was detected. Clone counts were compared for T1D versus non-T1D subjects using a χ2 test. –, there were too few reads corresponding to the CDR3 AA sequence for comparison by χ2 test.
1 6insight.jci.org doi:10.1172/jci.insight.88242
R E S E A R C H A R T I C L E
(n = 24), interlobular/periductal regions (n = 11), and spleen (n = 3). Proportions of CD4+FOXP3+ cells were determined from the ratio of CD4+FOXP3+ cell numbers to the sum of CD4+FOXP3– + CD4+FOXP3+ cell numbers.
Tissue processing. Spleen, pLN, and iLN were dissociated in HBSS + 10% human (male, type AB) serum (Atlanta Biologicals) with the gentleMACS tissue processor (Miltenyi Biotech). Tissues were further homogenized by a tissue douncer (40 ml; loose pestle; Wheaton) and passed through a 100-μm, 70-μm, and 30-μm preseparation filter (Miltenyi) to generate single-cell suspensions. Islets were isolated by a modified collagenase-based (Serva NB1 and Neutral Proteases GMP grade) digestion protocol at the Institute of Cellular Therapeutics at Allegheny General Hospital (Pittsburgh, Pennsylvania, USA) (61). Dissociated intraislet T cells were expanded with anti-CD3/CD28 beads for 14 days prior to FACS.
FACS. PBMC and spleen, iLN, and pLN cells were labeled for 30 minutes at 4°C with fluorescent-conju-gated antibodies against CD19 (FITC; clone HIB19), CD8 (APC-Cy7; clone SK1), CD4 (Pacific Blue; clone RPA-T4), CD25 (APC; clone BC96), and CD127 (PE; clone A019D5). Because Treg markers were not read-ily distinguishable after expansion, intraislet T cells were sorted for the CD8+ and total CD4+ subsets. Based on post-sort recovery, 1 × 10⁵ to 4 × 10⁵ cells were combined with 400 μl DNA/RNA Lysis Buffer (Zymo Research) and frozen at –80°C, and DNA was extracted using the Zymo ZR-Duet DNA/RNA MiniPrep kit. Mean post-sort purities were typically mean = 93.6% (range = 86.1%–98.4%) for B cells, 97.9% (96.4%–99.3%) for CD8+ T cells, 99.7% (99.3%–99.9%) for Tconv, and 99.1% (97.9%–99.8%) for Treg.
Immune receptor deep sequencing. Samples were sequenced with the immunoSEQ assay (in-kind gift from Adaptive Biotechnologies) using deep-level resolution to identify and quantitate TRB and BCR IGH sequences. In brief, the somatically rearranged CDR3 of these loci was amplified from 0.145 μg to 7.5 μg genomic DNA using a 2-step, amplification bias-controlled multiplex PCR approach (22, 62). CDR3 libraries were sequenced, and Illumina sequence reads were demultiplexed. Sequence data have been made publicly available (http://clonesearch.jdrfnpod.org/), and an open-access TCRβ and IgH sequence library is available for analysis and download from Adaptive Biotechnologies (http://doi.org/10.21417/B73S3K). Additionally, demultiplexed sequence files can be downloaded from the NCBI Sequence Read Archive (https://www.ncbi.nlm.nih.gov/bioproject/PRJNA348342; accession PRJNA348342).
Insulin-binding B cell Ig gene sequencing. Eligible subjects were healthy controls who did not meet the American Diabetes Association criteria for classification of disease. Cells were stained and enriched for insulin-binding B cells, as previously described (17). Briefly, PBMC were stained with 0.1 μg of biotinyl-ated insulin and other B cell surface antibodies/106 cells/25 μl of biotinylated insulin and other B cell surface antibodies, followed by streptavidin-Alexa Fluor 647. Insulin-binding B cells were then enriched using anti-Cy5/anti-Alexa 647 microbeads (Miltenyi Biotec). Cells were passed over a magnetized col-umn, and cells that bound the magnetic beads were positively collected. Insulin-binding B cells were then single-cell sorted on a FACS Aria (BD) directly into RT buffer in 96-well plates. Variable region ampli-fication and sequence analysis were completed as previously described (17, 63). Briefly, variable region genes were amplified by RT-PCR to identify and sequence the Ig heavy and light chain genes. Ig CDR3 regions were sequenced using IgBlast, and sequences were entered into the JDRF clone search website (http://clonesearch.jdrfnpod.org/) to determine homology with those from nPOD donors.
TRB deep-sequencing data analysis. Raw Illumina sequence reads were demultiplexed and processed to remove adapter and primer sequences; to identify and correct for technical errors introduced through PCR and sequencing; and to remove primer dimer, germline, and other contaminant sequences. The data were then filtered and clustered using both the relative frequency ratio between similar clones and a modified nearest-neighbor algorithm to merge closely related sequences. The resulting sequences were sufficient to allow annotation of the V(N)D(N)J genes constituting each unique CDR3 and to obtain the corresponding AA sequence. V, D, and J gene definitions were based on annotation in accordance with the IMGT data-base annotations (http://www.imgt.org/).
Single-cell TCR sequencing. After intraislet T cells were isolated and expanded with anti-CD3/CD28 beads (ExpAct, Miltenyi Biotech), cells were FACS purified into CD4+ and CD8+ populations. Individual cells were then sequestered using the Fluidigm C1 platform, mRNA sequences were amplified, and TCR α/β–pair sequences were identified using the TraCeR protocol, as previously described in published meth-ods (64–66).
For the 6265 PLN sample, single CD4+ and CD8+ cells were FACS sorted into each well of 96-well plates, followed by direct cell lysis and reverse-transcription reaction using random hexamers and primers specific for
1 7insight.jci.org doi:10.1172/jci.insight.88242
R E S E A R C H A R T I C L E
the TRA and TRB constant regions. Gene segments were then amplified from each cell by a 3-step multiplex PCR using primers specific for individual TRAV and TRBV genes. PCR products ligated to multi-identifier oligonucleotides to distinguish sequences for each cell were sequenced on Illumina MiSEQ, followed by anal-ysis for identifying V, J, and CDR3α/β sequences using the IMGT/HIGHV-QUEST algorithm.
Venn diagram preparation and analysis of receptor sharing across tissues. For Venn diagrams, the percentage of shared unique receptor sequences among different tissue compartments was calculated after downsam-pling the number of unique receptor sequences found in each tissue compartment to the lowest number of unique receptor sequences within the set. For Venn diagrams relative to case 6323, absolute sequence numbers were reported for T cells within the pLN, blood, spleen, and islet tissue rather than percentage of shared receptor sequences.
Waterfall graphs and V gene family skewing. For waterfall graphs, the following sample calculations were performed for each TRBV or IGHV family. First mean frequency counts were determined as follows: YT1D = (XT1D/NT1D), where YT1D stands for the mean frequency count for reads belonging to the gene family from T1D pLN; XT1D stands for the total number of TRBV or IGHV sequence reads belonging to the gene family from T1D pLN; and NT1D stands for the total number of T1D pLN samples sequenced. Similarly, YControl = (XControl/NControl), where YControl stands for the mean frequency count for reads belonging to the gene family from control pLN; XControl stands for the total number of TRBV or IGHV sequence reads belonging to the gene family from control pLN; and NControl stands for the total number of control pLN samples sequenced. Then, we calculated and reported the relative mean frequency counts with the following formula: YT1D/YControl.
Heatmaps and packed bubble charts. Figure 1, Figure 4B, Figure 7D, Supplemental Figure 1D, Supple-mental Figure 5B, and Supplemental Figure 6F were created with Tableau Public v9.3 (Tableau Software). Interactive versions of heatmaps, tables, and packed bubble charts for each of the 192 samples sequences can be found at the nPOD Adaptive Immune Repertoire (https://public.tableau.com/profile/npod.adap-tive.immune.repertoire#!/).
Statistics. Statistical analyses were performed using R. Sample diversity was calculated using the Shan-non Diversity Index (SDI) and clonality by the equation [1 – (SDI)/log2(productive unique sequences)] (67). Data were analyzed via Mann-Whitney U test, Welch’s 2-tailed t test, and χ2 test, as indicated. Data are reported as mean ± SD or median ± distribution. A P value of less than 0.05 was considered significant.
Study approval. Coded nPOD human donor tissue samples were obtained and processed by nPOD under a University of Florida Institutional Review Board–approved protocol (IRB201600029). To isolate insulin-binding B cell samples, human blood samples were obtained with informed consent at the Barbara Davis Center for Childhood Diabetes using a University of Colorado Institutional Review Board–approved protocol (COMIRB #01-384).
Author contributionsHRS processed the samples, researched the data, and wrote the manuscript; EY, SJR, MCT, AP, and LZ researched and analyzed the data and reviewed and edited the manuscript; MN reviewed and edited the manuscript, performed additional single-cell sequencing, and provided additional TCR data; MJS and JCC reviewed and edited the manuscript and provided antigen-specific BCR data; ALP contributed to discus-sion and wrote the manuscript; MV, ROE, DK, and MAA contributed to discussion and reviewed and edited the manuscript; JSK and HSR researched the data and reviewed and edited the manuscript; and TMB conceived of the study and wrote the manuscript. TMB is the guarantor of the work and as such assures the validity and ethics of the data reported herein.
AcknowledgmentsThese studies were supported by a research sequencing grant provided by Adaptive Biotechnologies. Addi-tional project support was provided by grants from the National Institutes of Health (P01 AI42288 to MAA and TMB; R01 DK096492-05 to JCC; R01 DK106191 to TMB), the NIH-supported Human Islet Research Network (U01 DK104147 to JSK; UC4 DK104194, U01 DK104162, and R01 DK099317 to MN), and the Juvenile Diabetes Research Foundation (1-2008-994 and 27-2012-450 to JCC) as well as the Juvenile Dia-betes Research Foundation Career Development Award (2-2012-280 to TMB and 25-2013-268 to MAA, with subcontract to JSK) and the Leona M. and Harry B. Helmsley Charitable Trust George S. Eisenbarth Award for Team Science (to AP and TMB). We would like to thank organ donors and their families for their gifts. In addition, we would like to acknowledge Sean McGrail who produced the single-cell TCR
1 8insight.jci.org doi:10.1172/jci.insight.88242
R E S E A R C H A R T I C L E
data using TraCeR and Arron Raju who assisted with technical and analytical aspects of the project. Irina Kusmartseva, Maria Beery, and Stephen Selman coordinated the receipt, isolation, and distribution of the samples through the nPOD Organ Procurement and Processing Core to the Brusko Laboratory.
Address correspondence to: Todd M. Brusko, Department of Pathology, Immunology and Laboratory Medicine, College of Medicine, University of Florida, 1275 Center Drive, Biomedical Sciences Building J589, Box 100275, Gainesville, Florida 32610, USA. Phone: 352.273.9255; E-mail: [email protected].
1. Atkinson MA, Eisenbarth GS, Michels AW. Type 1 diabetes. Lancet. 2014;383(9911):69–82. 2. Roep BO, Peakman M. Diabetogenic T lymphocytes in human Type 1 diabetes. Curr Opin Immunol. 2011;23(6):746–753. 3. Noble JA, Valdes AM. Genetics of the HLA region in the prediction of type 1 diabetes. Curr Diab Rep. 2011;11(6):533–542. 4. Lampeter EF, et al. Transfer of insulin-dependent diabetes between HLA-identical siblings by bone marrow transplantation.
Lancet. 1993;341(8855):1243–1244. 5. Lampeter EF, McCann SR, Kolb H. Transfer of diabetes type 1 by bone-marrow transplantation. Lancet. 1998;351(9102):568–569. 6. Serreze DV, Leiter EH. Genes and cellular requirements for autoimmune diabetes susceptibility in nonobese diabetic mice. Curr
Dir Autoimmun. 2001;4:31–67. 7. Lennon GP, et al. T cell islet accumulation in type 1 diabetes is a tightly regulated, cell-autonomous event. Immunity.
2009;31(4):643–653. 8. Diz R, et al. Autoreactive effector/memory CD4+ and CD8+ T cells infiltrating grafted and endogenous islets in diabetic NOD
mice exhibit similar T cell receptor usage. PLoS One. 2012;7(12):e52054. 9. Roep BO, Peakman M. Antigen targets of type 1 diabetes autoimmunity. Cold Spring Harb Perspect Med. 2012;2(4):a007781. 10. Reijonen H, et al. Detection of GAD65-specific T-cells by major histocompatibility complex class II tetramers in type 1 diabetic
patients and at-risk subjects. Diabetes. 2002;51(5):1375–1382. 11. Mallone R, et al. Immunology of diabetes society T-cell workshop: HLA class I tetramer-directed epitope validation initiative
T-cell workshop report-HLA class I tetramer validation initiative. Diabetes Metab Res Rev. 2011;27(8):720–726. 12. Codina-Busqueta E, et al. TCR bias of in vivo expanded T cells in pancreatic islets and spleen at the onset in human type 1 dia-
betes. J Immunol. 2011;186(6):3787–3797. 13. Kent SC, et al. Expanded T cells from pancreatic lymph nodes of type 1 diabetic subjects recognize an insulin epitope. Nature.
2005;435(7039):224–228. 14. Zhou J, et al. In silico analysis of TCR Vβ7 of two patients with type 1 diabetes mellitus. J Lab Physicians. 2013;5(2):79–82. 15. Bashford-Rogers RJ, et al. Network properties derived from deep sequencing of human B-cell receptor repertoires delineate
B-cell populations. Genome Res. 2013;23(11):1874–1884. 16. Klarenbeek PL, et al. Complete T and B cell receptor repertoire analysis in rheumatoid arthritis using high throughput sequencing.
Ann Rheum Dis. 2010;69: A33–A34. 17. Smith MJ, et al. Loss of anergic B cells in prediabetic and new-onset type 1 diabetic patients. Diabetes. 2015;64(5):1703–1712. 18. Hinman RM, Cambier JC. Role of B lymphocytes in the pathogenesis of type 1 diabetes. Curr Diab Rep. 2014;14(11):543. 19. Quinn A, et al. T cells to a dominant epitope of GAD65 express a public CDR3 motif. Int Immunol. 2006;18(6):967–979. 20. Nakayama M, et al. Germline TRAV5D-4 T-cell receptor sequence targets a primary insulin peptide of NOD mice. Diabetes.
2012;61(4):857–865. 21. Wing JB, Sakaguchi S. TCR diversity and Treg cells, sometimes more is more. Eur J Immunol. 2011;41(11):3097–3100. 22. Carlson CS, et al. Using synthetic templates to design an unbiased multiplex PCR assay. Nat Commun. 2013;4:2680. 23. Atkinson MA. Pancreatic biopsies in type 1 diabetes: revisiting the myth of Pandora’s box. Diabetologia. 2014;57(4):656–659. 24. Campbell-Thompson M, et al. Network for Pancreatic Organ Donors with Diabetes (nPOD): developing a tissue biobank for
type 1 diabetes. Diabetes Metab Res Rev. 2012;28(7):608–617. 25. Erlich H, et al. HLA DR-DQ haplotypes and genotypes and type 1 diabetes risk: analysis of the type 1 diabetes genetics consor-
tium families. Diabetes. 2008;57(4):1084–1092. 26. Noble JA, Johnson J, Lane JA, Valdes AM. HLA class II genotyping of African American type 1 diabetic patients reveals asso-
ciations unique to African haplotypes. Diabetes. 2013;62(9):3292–3299. 27. Luppi P, et al. Restricted TCR V beta gene expression and enterovirus infection in type I diabetes: a pilot study. Diabetologia.
2000;43(12):1484–1497. 28. Hughes MM, et al. T cell receptor CDR3 loop length repertoire is determined primarily by features of the V(D)J recombination
reaction. Eur J Immunol. 2003;33(6):1568–1575. 29. Li H, Ye C, Ji G, Han J. Determinants of public T cell responses. Cell Res. 2012;22(1):33–42. 30. Klein L, Kyewski B, Allen PM, Hogquist KA. Positive and negative selection of the T cell repertoire: what thymocytes see (and
don’t see). Nat Rev Immunol. 2014;14(6):377–391. 31. Li L, et al. beta cell-specific CD4+ T cell clonotypes in peripheral blood and the pancreatic islets are distinct. J Immunol.
2009;183(11):7585–7591. 32. Reijonen H, et al. GAD65-specific CD4+ T-cells with high antigen avidity are prevalent in peripheral blood of patients with
type 1 diabetes. Diabetes. 2004;53(8):1987–1994. 33. Danke NA, Koelle DM, Yee C, Beheray S, Kwok WW. Autoreactive T cells in healthy individuals. J Immunol.
2004;172(10):5967–5972. 34. Campbell-Thompson ML, et al. The diagnosis of insulitis in human type 1 diabetes. Diabetologia. 2013;56(11):2541–2543. 35. McClymont SA, et al. Plasticity of human regulatory T cells in healthy subjects and patients with type 1 diabetes. J Immunol.
2011;186(7):3918–3926.
1 9insight.jci.org doi:10.1172/jci.insight.88242
R E S E A R C H A R T I C L E
36. Pathiraja V, et al. Proinsulin-specific, HLA-DQ8, and HLA-DQ8-transdimer-restricted CD4+ T cells infiltrate islets in type 1 diabetes. Diabetes. 2015;64(1):172–182.
37. Eugster A, et al. High diversity in the TCR repertoire of GAD65 autoantigen-specific human CD4+ T cells. J Immunol. 2015;194(6):2531–2538.
38. Babad J, et al. Generation of β cell-specific human cytotoxic T cells by lentiviral transduction and their survival in immunodefi-cient human leucocyte antigen-transgenic mice. Clin Exp Immunol. 2015;179(3):398–413.
39. Endl J, et al. Coexpression of CD25 and OX40 (CD134) receptors delineates autoreactive T-cells in type 1 diabetes. Diabetes. 2006;55(1):50–60.
40. Tree TI, et al. Naturally arising human CD4 T-cells that recognize islet autoantigens and secrete interleukin-10 regulate proin-flammatory T-cell responses via linked suppression. Diabetes. 2010;59(6):1451–1460.
41. Gebe JA, Yue BB, Unrath KA, Falk BA, Nepom GT. Restricted autoantigen recognition associated with deletional and adaptive regulatory mechanisms. J Immunol. 2009;183(1):59–65.
42. Greening JE, et al. Processing and presentation of the islet autoantigen GAD by vascular endothelial cells promotes transmigra-tion of autoreactive T-cells. Diabetes. 2003;52(3):717–725.
43. Oling V, et al. GAD65- and proinsulin-specific CD4+ T-cells detected by MHC class II tetramers in peripheral blood of type 1 diabetes patients and at-risk subjects. J Autoimmun. 2005;25(3):235–243.
44. Vendrame F, et al. Recurrence of type 1 diabetes after simultaneous pancreas-kidney transplantation, despite immunosuppres-sion, is associated with autoantibodies and pathogenic autoreactive CD4 T-cells. Diabetes. 2010;59(4):947–957.
45. Rodriguez-Calvo T, et al. Heterogeneity and Lobularity of Pancreatic Pathology in Type 1 Diabetes during the Prediabetic Phase. J Histochem Cytochem. 2015;63(8):626–636.
46. Wardemann H, Yurasov S, Schaefer A, Young JW, Meffre E, Nussenzweig MC. Predominant autoantibody production by early human B cell precursors. Science. 2003;301(5638):1374–1377.
47. Thomas JW. V region diversity in human anti-insulin antibodies. Preferential use of a VHIII gene subset. J Immunol. 1993;150(4):1375–1382.
48. Shoda L, et al. The Type 1 Diabetes PhysioLab Platform: a validated physiologically based mathematical model of pathogen-esis in the non-obese diabetic mouse. Clin Exp Immunol. 2010;161(2):250–267.
49. Höglund P, Mintern J, Waltzinger C, Heath W, Benoist C, Mathis D. Initiation of autoimmune diabetes by developmentally regulated presentation of islet cell antigens in the pancreatic lymph nodes. J Exp Med. 1999;189(2):331–339.
50. Campbell-Thompson M, et al. Insulitis and β-cell mass in the natural history of type 1 diabetes. Diabetes. 2016;65(3):719–731. 51. Foulis AK, Liddle CN, Farquharson MA, Richmond JA, Weir RS. The histopathology of the pancreas in type 1 (insulin-
dependent) diabetes mellitus: a 25-year review of deaths in patients under 20 years of age in the United Kingdom. Diabetologia. 1986;29(5):267–274.
52. Campbell-Thompson M. Organ donor specimens: What can they tell us about type 1 diabetes? Pediatr Diabetes. 2015;16(5):320–330. 53. Coppieters KT, et al. Demonstration of islet-autoreactive CD8 T cells in insulitic lesions from recent onset and long-term type 1
diabetes patients. J Exp Med. 2012;209(1):51–60. 54. Nakayama M, et al. Regulatory vs. inflammatory cytokine T-cell responses to mutated insulin peptides in healthy and type 1
diabetic subjects. Proc Natl Acad Sci U S A. 2015;112(14):4429–4434. 55. Gianani R, et al. Dimorphic histopathology of long-standing childhood-onset diabetes. Diabetologia. 2010;53(4):690–698. 56. Migueles SA, Connors M. Class II-Restricted CD8s: New Lessons Violate Old Paradigms. Immunity. 2016;45(4):712–714. 57. Knip M, et al. Prediction of type 1 diabetes in the general population. Diabetes Care. 2010;33(6):1206–1212. 58. Siljander H. Assessment of Risk for Type 1 Diabetes in Children of Affected Families and in the General Population: Role of Immunological
and Metabolic Markers. HELDA. https://helda.helsinki.fi/handle/10138/22799. Published February 19, 2010. Accessed Octo-ber 31, 2016.
59. Long SA, Buckner JH. CD4+FOXP3+ T regulatory cells in human autoimmunity: more than a numbers game. J Immunol. 2011;187(5):2061–2066.
60. Zhou X, et al. Instability of the transcription factor Foxp3 leads to the generation of pathogenic memory T cells in vivo. Nat Immunol. 2009;10(9):1000–1007.
61. Balamurugan AN, Chang Y, Fung JJ, Trucco M, Bottino R. Flexible management of enzymatic digestion improves human islet isolation outcome from sub-optimal donor pancreata. Am J Transplant. 2003;3(9):1135–1142.
62. Robins HS, et al. Comprehensive assessment of T-cell receptor beta-chain diversity in alphabeta T cells. Blood. 2009;114(19):4099–4107.
63. Smith K, et al. Rapid generation of fully human monoclonal antibodies specific to a vaccinating antigen. Nat Protoc. 2009;4(3):372–384.
64. Stubbington MJ, et al. T cell fate and clonality inference from single-cell transcriptomes. Nat Methods. 2016;13(4):329–332. 65. Kolodziejczyk AA, Kim JK, Svensson V, Marioni JC, Teichmann SA. The technology and biology of single-cell RNA sequenc-
ing. Mol Cell. 2015;58(4):610–620. 66. Schober K, Busch DH. A synergistic combination: using RNAseq to decipher both T-cell receptor sequence and transcriptional
profile of individual T cells. Immunol Cell Biol. 2016;94(6):529–530. 67. Robert L, et al. CTLA4 blockade broadens the peripheral T-cell receptor repertoire. Clin Cancer Res. 2014;20(9):2424–2432. 68. Conrad B, et al. Evidence for superantigen involvement in insulin-dependent diabetes mellitus aetiology. Nature.