Page 1
This pre-print manuscript ” Spatio-temporal trends of nitrogen deposition
and climate effects on Sphagnum productivity in European peatlands” was
subsequently accepted by Environmental Pollution.
This version of the manuscript has not been peer-reviewed.
Published with permission from Elsevier.
Statement from the publisher: “NOTICE: this is the author’s version of a work
that was accepted for publication in <Environmental Pollution>. Changes resulting
from the publishing process, such as peer review, editing, corrections, structural
formatting, and other quality control mechanisms may not be reflected in this
document. Changes may have been made to this work since it was submitted for
publication. A definitive version was subsequently published in
ENVIRONMENTAL POLLUTION, [VOL#187, (April 2014)]
DOI#10.1016/j.envpol.2013.12.023 ¨
Epsilon Open Archive http://epsilon.slu.se
Page 2
Trends of N deposition effects on Sphagnum
1
1
Spatio-temporal trends of nitrogen deposition and climate effects on 2
Sphagnum productivity in European peatlands 3
4
5
6
7
Gustaf Granath1,2
*, Juul Limpens3, Maximilian Posch
4, Sander Mücher
5, Wim de Vries
5,6 8
9 *Corresponding author: [email protected] 10 Tel: + 1 905 525-9140 ext. 20437 11
12
13 1School of Geography and Earth Sciences, 14
McMaster University, 1280 Main Street West, 15 Hamilton, ON, L8S 4K1, Canada 16 17 2Department of Aquatic Sciences and Assessment, Swedish University of Agricultural 18
Sciences, Box 7050, SE-75007 Uppsala, Sweden 19 20 3Nature Conservation and Plant Ecology Group, Wageningen University, PO Box 47, 21
Wageningen, The Netherlands 22 Email: [email protected] 23
24 4Coordination Centre for Effects (CCE), RIVM, PO Box 1, 3720 BA Bilthoven, The 25
Netherlands 26 Email: [email protected] 27
28 5Alterra, Wageningen University and Research Centre (WUR), PO Box 47, 6700 AA 29
Wageningen, The Netherlands 30 Email: [email protected] 31
32 6Environmental Systems Analysis Group, Wageningen University, PO Box 47, 6700 AA 33
Wageningen, The Netherlands 34 Email: [email protected] 35 36
37
Running title: Trends of N deposition effects on Sphagnum 38
Tables: 2 39 Figures: 3 40 41 42 43
44 45 46 47 48
Page 3
Trends of N deposition effects on Sphagnum
2
Abstract 49
To quantify potential nitrogen (N) deposition impacts on peatland carbon (C) uptake, we 50
explored temporal and spatial trends in N deposition and climate impacts on the production of 51
the key peat forming functional group (Sphagnum mosses) across European peatlands for the 52
period1900 - 2050. Using a modelling approach we estimated that between 1900-1950 N 53
deposition impacts remained limited irrespective of geographical position. Between 1950-54
2000 N deposition depressed production between 0-25% relative to 1900, particularly in 55
temperate regions. Future scenarios indicate this trend will continue and become more 56
pronounced with climate warming. At the European scale, the consequences for Sphagnum 57
net C-uptake remained small relative to 1900 due to the low peatland cover in high-N areas. 58
The predicted impacts of likely changes in N deposition on Sphagnum productivity appeared 59
to be less than those of climate. Nevertheless, current critical loads for peatlands are likely to 60
hold under a future climate. 61
62
Keywords: air pollution, carbon balance, critical load, ecosystem change, peat mosses 63
64
Capsule: Temperate Sphagnum peatlands are vulnerable to current and future N deposition 65
and current critical loads for peatlands are likely to hold under a future climate. 66
67
Introduction 68
Deposition of reactive nitrogen (N) has increased steadily in many parts of the world since the 69
industrial revolution (Galloway et al. 2003). At present N deposition levels are either 70
stabilizing at a high level (Europe) or continue to increase in other parts of the world (de Vries 71
& Posch 2011). N effects are numerous, ranging from biodiversity loss to increased leaching 72
of nitrate to aquifers and lakes (e.g. Bergström & Jansson 2006). To improve risk assessments 73
and support policy decisions, critical N deposition loads have been defined for many 74
ecosystems (Bobbink & Hettelingh 2011), including Sphagnum-dominated peatlands. These 75
extremely nutrient-poor ecosystems are among those most sensitive to N enrichment, and 76
show changes in species composition above N deposition levels of 5-10 kg ha-1
yr-1
(Bobbink 77
& Hettelingh 2010). Recent work suggests that N-impacts on Sphagnum depends on climatic 78
factors (Heijmans et al. 2008; Limpens et al. 2011), implying critical loads may vary across 79
geographical gradients and may change with climate warming. Our study is the first attempt 80
Page 4
Trends of N deposition effects on Sphagnum
3
to explore the spatial distribution of N effects on Sphagnum production in peatlands for past, 81
present and future. 82
83
Sphagnum-dominated peatlands cover large areas of the boreal-temperate zone and store a 84
substantial amount of the global soil carbon (C) pool (Rydin & Jeglum 2013). Peat mosses 85
(genus Sphagnum) play a key role in these ecosystems as they efficiently engineer an 86
environment that facilitates their own growth while being hostile to vascular plants (van 87
Breemen 1995). Their unique properties are both directly and indirectly responsible for the 88
long-term C sequestration of northern peatlands. Sphagnum directly affects C-sequestration 89
by producing litter that decays at a slower rate than vascular plants (Freeman et al. 2001), thus 90
forming a much greater proportion of the peat than expected from their primary production 91
(Wallén, 1992),. Sphagnum litter/peat is also responsible for the wet and acidic environment 92
that suppresses decay, thus indirectly facilitating long-term C-sequestration. Thus, Sphagnum 93
production and abundance are of vital importance for the functioning and C accumulation of 94
Sphagnum-peatlands (Johnson & Damman 1993). The proportion of annual Sphagnum 95
production that is eventually integrated into long-term C storage (peat accumulation) varies 96
between 0-10%, depending on environmental conditions (Rydin & Jeglum 2013). This can 97
translate into an average carbon accumulation of circa 20 g C m-2
yr-1
(Roulet et al. 2007). 98
Although peatland habitats are usually resilient to environmental change (Belyea & Baird 99
2006), nutrient alterations can lead to drastic changes in the composition of the vegetation. In 100
general vascular plants benefit from the surplus N and become more dominant while the 101
growth ofpeat mosses decreases due to litter burial and shading (Berendse et al. 2001). There 102
is also experimental evidence of more direct effects of increased N availability on Sphagnum 103
performance, such as increased photosynthesis, P limitation and even toxicity at very high N 104
levels (Granath et al. 2009, Granath et al. 2012, Limpens and Berendse 2003). Consequently, 105
N deposition has been suggested as a potential threat to C sequestration of boreal and 106
temperate peatlands (Gunnarsson et al. 2008; Dise 2009). Yet, attempts to quantify this threat 107
are lacking. This is in sharp contrast to forest ecosystems where N deposition effects on C 108
sequestration have been quantified at a European scale (de Vries et al. 2006; de Vries & 109
Posch 2011). 110
111
A modelling approach is necessary to quantify the effects of N deposition at a larger scale, 112
and until recently, no model was available for Sphagnum. A recent meta-regression analysis 113
(Limpens et al. 2011), was an important step forward in the process of understanding and 114
Page 5
Trends of N deposition effects on Sphagnum
4
quantifying the effect of N on Sphagnum growth in peatlands. Using results of N application 115
experiments across the northern hemisphere, the authors identified some of the variables that 116
may affect Sphagnum growth response to N deposition. This analysis resulted in a statistical 117
model that describes the impact of N deposition on Sphagnum production in interaction with 118
climatic factors. By combining this statistical model with N deposition and climate data for 119
European peatlands for the past, present and future (1900-2050) we investigated, i) how N 120
deposition has affected Sphagnum production, temporally and spatially across Europe, over 121
the 20th century, ii) the effect of future N deposition on Sphagnum production, given future 122
climatic and N deposition projections, and iii) the overall consequences for Sphagnum 123
production and potential C-uptake at European scale. 124
125
126
Methods and Materials 127
128
Modelling the effect of nitrogen deposition on Sphagnum 129
We adapted the meta-regression model of Limpens et al ( 2011), further referred to as 130
Limpens-Granath model, to model the effect of N deposition on Sphagnum productivity under 131
different climatic conditions. Our adapted model is expressed as: 132
133
loge (Ptreat / Pcontrol) = μ + a × Nc + b × Nadd + c × Tj + d × Pa + C + Error (1) 134
135
where μ is the intercept, Nc is the current mean annual N deposition at the site at the time of 136
treatment, Nadd is the annual added N at treatment plots, Tj is the mean July temperature 137
(which is strongly correlated with mean summer temperature, June-August), Pa is mean 138
annual precipitation, Pcontrol is the Sphagnum productivity at the control plots receiving only 139
Nc, and Ptreat is the Sphagnum productivity at the treatment plots, receiving Nc + Nadd . C and 140
a, b, c, d are regression coefficients, where C also includes the effects of phosphorus 141
application and presence of vascular plants. The Error term captures the unexplained 142
between-experiment variation. 143
144
Adaptations to the Limpens-Granath model included the use of more recent climate and 145
background N deposition data, and a further simplification of parameters and adaptation of Nc 146
Page 6
Trends of N deposition effects on Sphagnum
5
and Nadd to make the model suitable for comparing N effects over different time periods 147
instead of between treatments. These adaptations are discussed below. 148
149
Parameterization 150
The model was parameterized using the same experimental data as in Limpens et al. (2011) 151
The most important details are given in Table S1 (sources, location, species, N application 152
rate). In contrast to Limpens et al. (2011), we used more recent climate and background N 153
deposition data. For the adapted model (1) we used gridded average climate data for a 10-year 154
period encompassing the timing of the experiments based on the Climate Research Unit 155
(CRU) data base (Mitchell et al. 2004). Furthermore, annual total background N deposition 156
(i.e. wet plus dry) was used instead of only wet deposition as in Limpens et al. (2011). Most 157
N application experiments were conducted in Europe and wet and dry N depositions for the 158
years of the experimental duration were extracted from the European Monitoring and 159
Evaluation Programme (EMEP MSC-W model results, 160
http://www.emep.int/mscw/index_mscw.html). For non-European sites, N deposition was 161
retrieved from original publications. More details on N deposition and climate data can be 162
found in the methods section below. The model was fitted using a Bayesian approach in the R 163
package MCMCglmm (Hadfield 2010) to more easily include parameter uncertainties in the 164
spatial models. For parameterization, we ran the model for 140 000 iterations after a burn-in 165
of 30 000 iterations, using non-informative priors. Changing the priors did not alter the results 166
and ensures little influence of the priors on the posterior (see Limpens et al. (2011) for details 167
on fitting hierarchical meta-regression models accounting for within-study dependence). 168
169
The Limpens-Granath model included the effect of microhabitat (moist lawn vs. dry 170
hummocks) and an interaction between microhabitat and temperature. As the proportions of 171
microhabitats in peatlands are not well-documented, we removed the terms involving 172
microhabitat in the model, generalizing our predictions. In addition, the Limpens-Granath 173
model included variables that were manipulated in the experiments: phosphorus application 174
and presence of vascular plants (some experiments removed vascular plants). In our 175
predictions we assumed that phosphorus was not added and vascular plants were not removed. 176
177
Page 7
Trends of N deposition effects on Sphagnum
6
To test if the adapted Limpens-Granath model would lead to a loss of predictive value, we 178
compared both the original and adapted models using the experiment data set of Limpens et 179
al. (2011). Our simpler model performed as well as the original model, with predictors 180
explaining 51% (present model) and 53% (Limpens-Granath model) of the variation among 181
experiment outcomes (log response ratio), respectively. Model parameters estimated for our 182
revised model are given in Table 1. 183
184
Our model was applied on a 0.5×0.5 degree longitude-latitude grid (8539 grid cells with 185
peatlands) covering Europe except for the most eastern parts where the peatland distribution is 186
not available (Ukraine, Belarus, Moldova and Greece, see Figure 2).To make spatial 187
predictions, we used July temperature, annual precipitation and annual N deposition data for 188
each grid cell. Model uncertainty (parameter uncertainty and random variation) was 189
incorporated by performing random draws of parameter estimates from the joint distribution 190
of the meta-regression model. We made 5000 random draws for predicting the outcome at 191
each grid cell and time period. From these 5000 predictions we calculated the mean and the 192
90% and 50% uncertainty intervals. 193
194
Including all model uncertainties gave wide uncertainty intervals. A large part of that 195
uncertainty comes from the unexplained between-study variation (Table 1), which is mainly a 196
result of large within-peatland variation in Sphagnum species and vascular plant cover. Since 197
we were not interested in the within-peatland variation but rather in the aggregated response 198
of the whole peatland to N deposition, we removed the uncertainty related to Sphagnum 199
species for the uncertainty graphs. To this end we first analyzed a subset of the data used in 200
Limpens et al. (2011) that only contains studies with more than one species (see Table S1). 201
From this data we estimated that the species component explained about 25% of between-202
study variation. This variation was removed when prediction intervals were created for the 203
graphs presented in the supporting information (see figures in Appendix S1 in Supporting 204
Information). 205
206
To summarize the effect over Europe we calculated weighted means of predictions using 207
proportions of peatlands in each grid cell as weights. The estimation of the peatland cover is 208
described later in the methods section. Effects on carbon uptake were calculated by assuming 209
a mean annual Sphagnum production of 200 g dry matter m-2
yr-1
. This value is derived from 210
a meta-analysis of Sphagnum production (Gunnarsson 2005) enhanced by the production rates 211
Page 8
Trends of N deposition effects on Sphagnum
7
observed in the control plots of the N addition experiments that formed the basis of our 212
model. The 200 g m-2
yr-1
is a representative, albeit conservative (e.g. Wieder et al. 2010), 213
estimate of long-term production values and thus highly suitable for the 50-year time step 214
adopted in our study. To convert the dry matter production to C-uptake we assumed a dry 215
tissue carbon content of 50% (Rydin & Jeglum 2013). 216
217
Modelled time periods and scenarios 218
We analysed N deposition effects between 1900-1950, 1950-2000 and four different scenarios 219
for the period 2000-2050; combining (1) two N deposition scenarios (current N deposition, 220
using means of 2000-2010, and future N deposition, according to the Global Energy 221
Assessment current legislation, GEA-CLE), with (2) two climate scenarios (current climate, 222
using means of 1950-2000, and future climate, according to the A1 climate scenario). For 223
more information on these scenarios see sub-section Nitrogen deposition 1900-2050 and 224
Climate data 1900-2050. 225
226
Modelling N effects over time 227
The response variable in the Limpens-Granath model was the ratio of Sphagnum productivity 228
in treatment over control, i.e. the model predicts the change in Sphagnum productivity 229
compared to a reference point. Consequently, to apply the Limpens-Granath model based on 230
N addition experiments to field conditions, we needed to set a reference point with which to 231
compare the effects of increasing N deposition. We used the year 1900 as reference point, 232
assuming that N deposition at that time reflects pre-industrial times (de Vries & Posch 2011). 233
234
N load in the Limpens-Granath model was divided over N deposition at the experimental site 235
(N current = Nc) and experimentally applied N (Nadd). For our adapted model we also divided 236
N deposition over the terms Nc and Nadd, where Nc presented the impact of long-term historic 237
N deposition, and Nadd the impact of additional N deposition. We used one or two allocation 238
steps, depending on the change in N deposition between 1900 and 2050. If N deposition 239
changed less than 0.4 g m-2
between 1900 and 2050, no reliable predictions could be made 240
between the periods as the Limpens-Granath model assumes a minimum Nadd of 0.4 g m-2
. 241
One allocation step was used when the change in mean N deposition between 1900-2050 242
exceeded 0.4 g m-2
yr-1
. Then the N deposition in 1900 was allocated to Nc, and all other N to 243
Nadd. If the change in N deposition between 1950-2000 to 2000-2050 was higher than 0.4 g m-244
Page 9
Trends of N deposition effects on Sphagnum
8
2 yr
-1 we used two allocation steps: N deposition in 1900 was allocated to Nc for the period 245
1950 to 2000, and the average N deposition between 1950 and 2000 was allocated to Nc for 246
the period 2000-2050. In the latter case, the outcome was multiplied with the first outcome 247
(effect 1900 to 1950-2000) to keep comparisons to 1900. 248
249
Model evaluation 250
The sensitivity of our model was evaluated in two ways; 1) to investigate the effect of 251
potential uncertainty of our modelled predictors we ran the model with an uncertainty 252
(standard deviation set to 5% of the value) around modelled predictor values (N deposition, 253
temperature and precipitation), and, 2) to test the effect of different ways of allocating N 254
deposition over Nc and Nadd. In addition, we explored an alternative model where the 255
parameters Nc and Nadd were merged into a single parameter (total N addition, Nc+add). The 256
test of this alternative model was also restricted to the 0.4 g m-2
yr-1
minimum increase since 257
1900. 258
259
Nitrogen deposition 1900-2050 260
Oxidised and reduced N deposition were calculated with the atmospheric transport model of 261
EMEP/MSC-W (Simpson et al. 2012). Historic NOx and NH3 emissions were taken from 262
Lamarque et al. (2010). Predictions for the period 2000-2050 were based on a (1) constant N 263
deposition scenario, i.e. fixing N deposition to the current levels, here defined as the mean for 264
the period 2000-2010, and, (2) Global Energy Assessment (GEA) current legislation scenario 265
(GEA-CLE). The GEA-CLE deposition scenario assumes full implementation of all current 266
and planned air pollution legislation world-wide until 2030. 267
268
Climate data 1900-2050 269
Historical meteorological data were taken from a high resolution European data base 270
(Mitchell et al. 2004) that contains monthly values of temperature, precipitation and 271
cloudiness for the years 1901–2000 for land-based grid-cells west of 32ºE of size 10'10' 272
(approx. 15 km18 km in central Europe). In the simulations, 10-year averages were taken 273
centred around 1900, 1910, …, 1990 (1900 is the average of 1901–1905; 1910 of 1906–1915 274
etc.) to smooth the climate pattern. For future values we used two climate scenarios: (1) 275
constant climate after 1990 (using the average of the 1961-1990 period); (2) from 2010 276
onwards the A1 storyline from the Special Report on Emission Scenarios (SRES) with its 277
related climate scenario (Nakićenović & Swart 2000). This scenario, which is from the IPCC 278
Page 10
Trends of N deposition effects on Sphagnum
9
scenario family with the highest emissions, reflects a future world with globalization and 279
rapid economic growth, low population growth, and the rapid introduction of new and more 280
efficient technologies everywhere. The A1 scenario was chosen in this study as the most 281
likely future scenario, considering that current CO2 emission trends exceed this most 282
pessimistic IPCC scenario (Raupach et al. 2007). Mitchell et al. (2004) used results from the 283
HADCM3 General Circulation Model to derive monthly meteorological data for the years 284
2001–2100 from this (and several other) scenario, which we again averaged over 10-year 285
periods for use in the simulations. For the transition period, 1990–2010, data were 286
interpolated linearly. Under the A1 climate scenario, temperatures over Europe increase by 287
about 3±1ºC between 1990 and 2050, whereas median precipitation hardly changes, with 288
precipitation at southern sites decreasing and at northern sites increasing compared to 1990 289
(see also de Vries & Posch 2011). 290
291
Spatial distribution of peatlands in Europe 292
We improved the estimation of the coverage of open Sphagnum dominated peatlands by 293
integrating the CORINE (CO-oRdination of INformation on the Environment) land cover 294
2006 of the European Environmental Agency (EEA) with the Forest Map of the Joint 295
Research Centre (JRC) of the European Commission. The CORINE land cover is derived 296
from high resolution satellite data (e.g. Landsat-TM) by computer assisted visual 297
interpretation in combination with ancillary data. The minimum mapping unit is 25 ha and for 298
line elements the minimum width is 100 m. Büttner and Maucha (2006) validated the 299
CLC2000 and found a total reliability of CLC2000 was 87.0 ± 0.8%. The JRC Forest Cover 300
Map is a 25 m spatial resolution raster Pan-European Forest / Non Forest Map with target 301
years 2000 and 2006 derived from high resolution satellite data such as LISS III and SPOT 302
4/5 imagery. In the JRC forest map, forests are defined as vegetation dominated by trees, with 303
canopy closure more than 30% and trees higher than 5 m. For its integration with CORINE, 304
the JRC Forest Map was resampled to a 100 m grid (same resolution as CORINE) using a 305
majority filter. 306
307
From CORINE land cover we selected the land cover class 4.1.2 Peat bogs, which has been 308
defined as: peatland consisting mainly of decomposed moss and vegetable matter which 309
might be exploited (Bossard et al. 2000). It includes minerogenic peatlands (fed by ground 310
water) with mosses (mostly Sphagnum), ombrogenic peatlands (fed only by precipitation and 311
dominated by Sphagnum) such as boreal bogs, boreal bogs with reticulated structure (aapa), 312
Page 11
Trends of N deposition effects on Sphagnum
10
blanket bogs, and fossil arctic peat bogs (palsa). The integrated map of JRC forest and 313
CORINE land cover (2006), focusing on non-forested peatlands, was analysed over European 314
sites where N application experiments used in the meta-analysis were performed, and over 315
other sites where Sphagnum production had been recorded in the literature. Our combined 316
map showed an improvement over CORINE 2006 concerning open, Sphagnum dominated 317
peatlands. 318
319
The gridded peatland distribution map was first re-projected and then overlaid with the 320
gridded climate/N deposition map (0.5×0.5 longitude-latitude grid) to calculate the proportion 321
of peatland per cell. This was done using the R packages raster (Hijmans & van Etten 2012) 322
and rgdal (Keitt et al. 2012). All maps are shown with the EPSG:3035 projection. 323
324
325
Results 326
N deposition trend and peatland cover 327
Estimated N deposition varied over time and space. At the beginning of the 1900s, N 328
deposition was generally low, except for a region in central Europe and the southern British 329
Isles. Between 1900 and 1950 N deposition increased slightly, but not more than 0.4 g m-2
yr-1
330
on average over the whole period (Fig 1a). From 1950 onwards, N deposition rose quickly, 331
reaching peak values around 1980-1990, after which it decreased slightly and levelled off to 332
the present levels in many areas. The total change in N deposition exceeded 0.4 g m-2
yr-1
in 333
most areas (Fig 1b). Predictions for 2000-2050 under the current legislation N emission 334
scenario (GEA-CLE) vary per region, with N deposition increasing or decreasing, depending 335
on location (Fig 1c). In the constant (mean 2000-2010) scenario, most areas showed a minor 336
decrease compared to the 1950-2000 period (not shown). 337
338
Combining CORINE land cover data and the JRC forest map, we estimated open/semi-open 339
Sphagnum-dominated peatland cover in Europe to be10.5 million ha. About 20% of these 340
peatlands are defined as forested. The highest cover of peatlands is found in Fennoscandia and 341
the British Isles (Fig 2). 342
343
Spatial predictions for Sphagnum productivity 344
Page 12
Trends of N deposition effects on Sphagnum
11
For the period 1900-1950 we could not make reliable predictions for changes in Sphagnum 345
productivity as the change in N deposition remained below 0.4 g m-2
(the minimum amount 346
needed for modelling predictions, see Methods) for all regions. For 1950-2000, large areas of 347
Europe did show a sufficient increase in N deposition for making predictions. This area 348
includes approximately 1 million hectares of Sphagnum dominated peatlands. Over this 349
period, our model estimated that N deposition depressed Sphagnum production between 350
between 0 and 25% in western, central and eastern Europe (Fig 3a), but increased production 351
in south-eastern Sweden. N deposition in parts of Ireland and northern Fennoscandia did not 352
change enough to allow reliable predictions. When summarized over all predictions and 353
taking peatland cover into account, the overall N effect on Sphagnum production, and 354
consequently on the Sphagnum C balance of the living parts, was close to zero (Table 2). 355
356
Over 2000-2050 N deposition is predicted to depress Sphagnum production further under both 357
the constant N emission scenario (using average N deposition of 2000-2010; Fig 3c) and the 358
current legislation N emission scenario (GEA-CLE deposition scenario; Fig 3b). Without a 359
change in climate however, predictions are similar to 1950-2000 (Fig. 3d). The strongest 360
overall reduction of Sphagnum production occurs under the constant N deposition and A1 361
climate scenario (Table 2, Fig 3c) and the weakest is under the reduced N deposition and 362
constant climate scenario (Table 2, Fig 3d). The predicted impacts of N deposition appeared 363
to be less (on average 3 percentage points difference between constant and reduced N 364
deposition) than those of climate change (on average 7-8 percentage points difference 365
between constant climate and climate change according to A1; see table 2).The consequences 366
of the different scenarios for C uptake show large spatial variation, but little-no difference 367
when upscaled to Europe (Table 2). 368
369
Model uncertainty and sensitivity 370
Including all model uncertainties gave wide uncertainty intervals even when correcting for 371
contribution of within peatland uncertainty. Hence parameter uncertainty is the largest 372
contributor to the overall uncertainty (Supporting information, Fig. S1, S2). 373
374
When looking at the sensitivity of the model, a standard deviation of 5% for a predictor value 375
(e.g. an N deposition value of 1.0 g m-2
yr-1
is assumed to be estimated with a standard 376
deviation of 0.05 g m-2
yr-1
) did not change our predictions substantially. If we did not use 377
Page 13
Trends of N deposition effects on Sphagnum
12
allocation steps for Nc, but only one fixed Nc (N deposition in1900) for all time periods, our 378
future predictions (2000-2050) suggested less negative effects of N deposition. Also, the 379
model where Nc and Nadd were merged into one parameter (Nc+add) did not diverge much from 380
our original model. In this case, however, the model produced more extreme predictions near 381
the boundaries of model space and stronger negative effects were predicted at lower N 382
deposition levels because a larger proportion of N deposition was allocated to Nc. The 383
instability of this model (Nc+add) makes it less useful despite its simplicity and thus the results 384
from the two-step allocation model are the only ones presented here. 385
386
Discussion 387
388
Nitrogen deposition impacts 389
For the second half of the 20th
century, our model suggests that N deposition will depress 390
Sphagnum production in many areas by 0-25% relative to 1900. This reduction nearly equals 391
the year-to-year variation due to weather conditions observed in contemporary Sphagnum 392
production studies (e.g. Vitt 1990). These modelled trends correspond to independent field 393
observations of peat accumulation (Gunnarsson et al. 2008), vegetation changes (Kapfer et al. 394
2011) and Sphagnum N concentration (Malmer & Wallén 2005). 395
396
The N deposition impact varied spatially, with N deposition depressing Sphagnum production 397
mostly in peatlands approximately south of 60° latitude, with the exception of Eastern 398
Sweden. North of 60° latitude, changes in Sphagnum production could generally not be 399
modelled because N deposition changed less than 0.4 g m-2
yr-1
relative to 1900. However 400
based on our model, it is likely that N deposition had little effect on Sphagnum production and 401
probably stimulated growth. Unfortunately, there are no long-term data sets on Sphagnum 402
production that we can use for direct validation of our model results, restricting validation to 403
comparisons of patterns observed in vegetation composition and litter production which may 404
be viewed as indirect proxies for Sphagnum production. Below we compare our results with 405
patterns observed in vegetation composition and litter production in bogs. Our spatial 406
distribution of N deposition impacts corresponds with that observed in studies focussing on 407
peatland vegetation composition. For example, in Southern Sweden (60° latitude) where our 408
model estimates a net positive effect over the 20th
century, Gunnarsson et al. (2000) found no 409
evidence of N-induced changes in vegetation composition, whereas in England where our 410
Page 14
Trends of N deposition effects on Sphagnum
13
model estimates negative effects, Chapman & Rose (1991) reported negative effects on 411
vegetation, notably on Sphagnum cover. Another interesting example is the peatland Store 412
mosse in SW Sweden. Malmer & Wallén (2004) estimated that about 50% less litter 413
(Sphagnum and vascular plants) was produced in the 20th
century compared to the 19th
414
century. A direct comparison with our estimate (20-25% reduction) is not straight forward 415
since we focus on Sphagnum and single out the effect of N deposition. In their study, Malmer 416
& Wallén (2004) acknowledge that N deposition is a likely important factor causing the 417
decrease of litter from Sphagnum, together with general drier conditions. Although being a 418
single peatland, this gives some quantitative support for our predictions that needs to be 419
scrutinized further. The scarcity of suitable validation data highlights the need of long-term 420
monitoring of processes, such as productivity, instead of only state variables, such as 421
vegetation composition. 422
423
Our future scenarios suggest that N deposition impacts predicted for the period between 1950-424
2000 will continue in the 21st century, becoming more pronounced with climate warming. At 425
the European scale, however, the net N deposition impact on carbon uptake by Sphagnum 426
remains small due to the low peatland cover in high N deposition regions: ranging between -6 427
to -15 g C m-2
yr-1
relative to 1900 for the period 1950-2050, depending on N deposition 428
scenario and climate warming. However, at the peatland scale N deposition could depress 429
Sphagnum C uptake up to 50-60 g C m-2
yr-1
. This is twice as large as recent estimates of 430
annual C sequestration in northern peatlands based on long-term eddy covariance monitoring 431
(Yu et al. 2011). Assuming 10% of the Sphagnum production eventually enters long-term 432
storage in the anoxic zone (Rydin & Jeglum 2013), then long-term C sequestration of 433
Sphagnum would be reduced by roughly 5 g C m-2
yr-1
in the most negatively affected 434
peatlands. If this long term decrease in C sequestration by Sphagnum can be offset by 435
increased production of vascular plant litter is highly uncertain as non-woody vascular plant 436
litter is readily decomposed and is less likely to enter into the anoxic zone as peat (Rydin & 437
Jeglum 2013). Moreover, reduced Sphagnum growth may decrease the self-regulation 438
capacity and resilience of these ecosystems to further disturbances such as changes in climate 439
or land-use. 440
Regions that would be affected most in the future are SW Sweden, Ireland, England, NW 441
Germany, Netherlands and the Alps. Here the N deposition rates remain too high to halt 442
negative N impacts, even in the best-case N deposition scenario without climate change. This 443
suggests that the oceanic-temperate peatlands in Europe will continue to suffer under the 444
Page 15
Trends of N deposition effects on Sphagnum
14
predicted N deposition levels. The area estimated to be affected is likely underestimated in 445
southern Europe because of the many small peatlands which may fulfil the CORINE size 446
criteria. Many of these temperate peatlands are protected nature reserves and may continue to 447
face lower Sphagnum production, invasion of vascular plants (Berendse et al. 2001; 448
Tomassen et al. 2004) and continued losses of DON to groundwater and surface waters 449
(Bragazza & Limpens 2004). 450
451
Prediction uncertainties 452
Despite the numerous N application studies carried out in peatlands, making quantitative 453
estimates remains a challenge. In our study we did not include any uncertainties in climate 454
change (e.g. Ruete et al. 2012) or N deposition scenarios. Instead we explored one model for 455
climate change (A1) and N deposition (GEA-CLE) and compared them with a constant 456
scenario, including all combinations. Sensitivity analyses showed that uncertainties in these 457
variables did not much affect predictions. Likewise, uncertainty in peatland cover was not of 458
major influence and point predictions were mostly influenced by model parameter 459
uncertainties. 460
461
Predictions presented here are associated with considerable uncertainties, reflecting both 462
parameter uncertainty, but also unknown variables affecting the effect of N deposition. It is 463
reasonable to assume that a large proportion of the random variation among N application 464
experiments is mostly associated with unknown microhabitat and species-specific responses 465
and factors that could not be included here because of the limited amount of data. For 466
example, different effects of N form (dry versus wet) and vascular plant cover. We argue that 467
at the peatland scale our average effects are reasonable and realistic, although we should be 468
cautious in our interpretation of the large effects reported (e.g. future Sphagnum production 469
reduction by 50% in some regions). By using higher temperatures we are making predictions 470
near the limits of model space. Nevertheless, these results suggest that interactions between 471
the effect of N and climate need to be addressed in future research. 472
473
Another potential uncertainty resides in the assumption of our model that short term 474
experiments (here 1-6 years) can be extrapolated over a longer time span. This assumption 475
was supported by time series analyses in Limpens et al. (2011) which did not detect an effect 476
of experiment length on the effect of N application. Accumulated N deposition (i.e. total N 477
load) may, however, be as important as deposition rates since low deposition levels may over 478
Page 16
Trends of N deposition effects on Sphagnum
15
time reach critical loads. We were unable to predict N deposition effects for a large part of 479
northern Europe, because N deposition change is too low to allow reliable modelling. N 480
experiments in peatlands have so far focused on rather large N loads, preventing accurate 481
assessment of the impact of a more realistic low, but chronic N deposition rates. Evidence 482
from other ecosystems, such as forest, suggests that low but chronic N loads induced by 483
experimental N fertilization of forests in Sweden, Finland and the USA for a period of about 484
10- 30 year causes enhanced carbon sequestration by increased tree growth without signs of N 485
saturation (Högberg et al., 2006; Pregitzer et al. 2007; Hyvönen et al., 2008). However, at 486
elevated N deposition, N saturation, occurrence of soil acidification and the elevated 487
incidence of pest and diseases may lead to adverse impacts on forest growth (Magill et al. 488
2004). These results imply that experiments with high N loads in forests tend to overestimate 489
adverse impacts as compared to low chronic loads. Our model suggest generally positive 490
effects of low N levels on Sphagnum production, which is supported by the field observations 491
in areas that received low N deposition (~ 0.5 g m-2
yr-1
) during an extensive time period (e.g. 492
50 years - Gunnarsson et al. 2000, 34 years - Vitt et al. 2003). While intact Sphagnum-493
dominated peatlands show a high resistance to disturbances such as moderate drainage or low-494
intensity fire, the disruption of keystone species such as Sphagnum may reduce the resilience 495
of peatlands and cascade into disequilibrium or ecosystem change (Luo & Weng 2011). 496
Nevertheless, in the case of N deposition, it is also possible that thresholds do not exist, or are 497
below a detection limit, and the ecosystem is changing in a continuous manner (Payne et al. 498
2013). 499
500
Evaluating critical loads 501
Overall, our analyses support the critical load range of 0.5 to 1.0 g m-2
yr-1
for peatlands 502
(Bobbink & Hettelingh 2011). The lower bound of that range suggests that negative N-503
deposition impacts already occur at a very small increase (0.2-0.3 g m-2
yr-1
assuming a pre-504
industrial N deposition of 0.2-0.3 g m-2
yr-1
) of N deposition. In some areas, Sphagnum 505
production showed reductions at the minimum N deposition increase that could be reliably 506
modelled in our study (0.4 g m-1
yr-1
), while in other areas a greater increase of N deposition 507
(up to 1 g m-1
yr-1
) was needed to achieve a significant production decrease. Overall, our 508
results suggest the current critical load holds for the range of climatic conditions predicted for 509
2050. 510
511
Conclusions 512
Page 17
Trends of N deposition effects on Sphagnum
16
Our modelling analysis suggests that the negative impact of N deposition was rather limited 513
throughout the 1900s, but the negative effects observed in the end of the 20th
century (up to 514
25% production reduction) are likely to continue or even increase in the 21st century. 515
Peatland-rich areas in Fennoscandia are, however, less impacted and Sphagnum production 516
may even be temporarily stimulated in some areas. Our results stress the vulnerability of 517
temperate peatlands to N deposition impacts and highlight the need for more studies on the 518
effect of small but chronic elevations of N deposition. Furthermore, our results suggest the 519
current critical loads for peatlands are also valid under predicted climate warming. 520
521
Acknowledgement 522
We are indebted to all co-authors involved in the Limpens et al. 2011 meta-analysis, without 523
them this analysis would not have been possible. We also thank J. M. Waddington and two 524
anonymous reviewers for comments on the manuscript. The study was financially supported 525
by a grant from the Swedish Research Council VR to G. G., while financial support from the 526
FP7 EU framework project Eclaire (grant agreement no 282910) was granted to W.d.V. and 527
M.P. 528
529
References 530
Belyea, L.R. & Baird, A.J. (2006) Beyond “the limits to peat bog growth”: cross-scale 531
feedback in peatland development. Ecological Monographs, 76, 299-322. 532
Berendse, F., van Breemen, N., Rydin, H., Buttler, A., Heijmans, M., Hoosbeek, M.R., Lee, 533
J.A., Mitchell, E., Saarinen, T., Vasander, H. & Wallén, B. (2001) Raised atmospheric 534
CO2 levels and increased N deposition cause shifts in plant species composition and 535
production in Sphagnum bogs. Global Change Biology, 7, 591-598. 536
Bergström, A.-K. & Jansson, M. (2006) Atmospheric nitrogen deposition has caused nitrogen 537
enrichment and eutrophication of lakes in the northern hemisphere. Global Change 538
Biology, 12, 635–643. 539
Page 18
Trends of N deposition effects on Sphagnum
17
Bobbink, R. & Hettelingh, J.-P. (2011) Review and revision of empirical critical loads and 540
dose-response relationships. RIVM Report 680359002, Bilthoven The Netherlands, 541
pp.23-25. 542
Bossard, M., Feranec, J. & Oťaheľ, J. (2000) CORINE land cover technical giude – 543
Addendum 2000. Technical report, 40. European Environment Agency, Copenhagen. 544
http://terrestrial.eionet.eea.int 545
Bragazza, L. & Limpens, J. (2004) Dissolved organic nitrogen dominates in European bogs 546
under increasing atmospheric N deposition. Global Biogeochemical Cycles, 18, 547
GB4018. 548
Büttner, G. & Maucha, G. (2006) The thematic accuracy of CORINE Land Cover 2000. 549
Assessment using LUCAS (land use/cover area frame statistical survey). EEA 550
Technical report no.7/2006. Copenhagen, Denmark. 551
Chapman, S.B. & Rose, R.J. (1991) Changes in the vegetation at Coom Rigg Moss National 552
Nature Reserve within the period 1958-86. Journal of Applied Ecology, 28, 140-153. 553
de Vries, W., Reinds, G.J. Gundersen, P. & Sterba, H. (2006) The impact of nitrogen 554
deposition on carbon sequestration in European forests and forest soils. Global 555
Change Biology, 12, 1151–1173. 556
de Vries, W. & Posch, M. (2011) Modelling the impact of nitrogen deposition, climate change 557
and nutrient limitations on tree carbon sequestration in Europe for the period 1900-558
2050. Environmental Pollution, 159, 2289-2299. 559
Dise, N.B. (2009) Peatland response to global change. Science, 326, 810-811. 560
Freeman, C., Ostle, N. & Kang, H.J. (2001) An enzymic 'latch' on a global carbon store. 561
Nature, 409, 149. 562
Galloway, J.N., Aber, J.D., Erisman, J.W., Seitzinger, S.P., Howarth, R.W., Cowling, E.B. & 563
Cosby, B.J. (2003) The nitrogen cascade. Bioscience, 53, 341-356. 564
Page 19
Trends of N deposition effects on Sphagnum
18
Gerdol, R. (1995) The growth dynamics of Sphagnum based on field measurements in a 565
temperate bog and on laboratory cultures. Journal of Ecology, 83, 431-437. 566
Granath, G., Wiedermann, M.M. & Strengbom, J. (2009) Physiological responses to nitrogen 567
and sulphur addition and raised temperature in Sphagnum balticum. Oecologia, 161, 568
481-490. 569
Granath, G., Strengbom, J. & Rydin, H. (2012) Direct physiological effects of nitrogen on 570
Sphagnum: a greenhouse experiment. Functional Ecology, 26, 353–364. 571
Gunnarsson, U. (2005) Global patterns of Sphagnum productivity. Journal of Bryology, 27, 572
267-277. 573
Gunnarsson, U., Boresö–Bronge, L., Håkan, R. & Ohlson, M. (2008) Near-zero recent carbon 574
accumulation in a bog with high nitrogen deposition in SW Sweden. Global Change 575
Biology, 14, 2152–2165. 576
Gunnarsson, U., Sjörs, H. & Rydin, H. (2000) Diversity and pH changes after 50 years on the 577
boreal mire Skattlösbergs Stormosse, Central Sweden. Journal of Vegetation Science, 578
11, 277-286. 579
Hadfield, J.D. (2010) MCMC methods for multi-response generalized linear mixed models: 580
The MCMCglmm R package. Journal of Statistical Software, 33, 1-22. 581
Heijmans, M.M.P.D., Mauquoy, D., van Geel, B. & Berendse, F. (2008) Long-term effects of 582
climate change on vegetation and carbon dynamics in peat bogs. Journal of Vegetation 583
Science, 19, 307-320. 584
Hijmans, R., J. & van Etten, J. (2012) raster: Geographic data analysis and modeling. R 585
package version 2.1-25. 586
Högberg, P., Fan, H., Quist, M., Binkley, D., Tamm, C.O., 2006. Tree growth and soil 587
acidification in response to 30 years of experimental nitrogen loading on boreal forest. 588
Global Change Biology, 12, 489-499. 589
Page 20
Trends of N deposition effects on Sphagnum
19
Hyvönen, R., Persson, T., Andersson, S., Olsson, B., Ågren, G.I., Linder, S., 2008. Impact of 590
long-term nitrogen addition on carbon stocks in trees and soils in northern Europe. 591
Biogeochemistry, 89, 121-137. 592
Johnson, L.C. & Damman, A.W.H. (1993) Decay and its regulation in Sphagnum peatlands. 593
Advances in Bryology, 5, 249-296. 594
Kapfer, J., Grytnes, J.-A., Gunnarsson, U. & Birks, H.J.B. (2011) Fine-scale changes in 595
vegetation composition in a boreal mire over 50 years. Journal of Ecology, 99, 1179–596
1189. 597
Keitt, T.H., Bivand, R., Pebesma, E. & Rowlingson, B. (2012) rgdal: Bindings for the 598
Geospatial Data Abstraction Library. R package version 0.8-9. 599
Lamers, L.P.M., Bobbink, R. & Roelofs, J.G.M. (2000) Natural nitrogen filter fails in polluted 600
raised bogs. Global Change Biology, 6, 583-586. 601
Limpens, J. & Berendse, F. (2003) Growth reduction of Sphagnum magellanicum subjected to 602
high nitrogen deposition: the role of amino acid nitrogen concentration. Oecologia, 603
135, 339-345. 604
Limpens, J., Berendse, F., Blodau, C., Canadell, J.G., Freeman, C., Holden, J., Roulet, N., H. 605
Rydin H. & Schaepman-Strub, G. (2008) Peatlands and the carbon cycle: from local 606
processes to global implications - a synthesis. Biogeosciences .5, 1475-1491. 607
Limpens, J., Granath, G., Aerts, R., Heijmans, M., Sheppard, L., Bragazza, L., Williams, B., 608
Rydin, H., Bubier, J., Moore, T., Rochefort, L., Mitchell, E., Buttler, A., van den Berg, 609
L., Gunnarsson, U., Francez, A.J., Gerdol, R., Thormann, M., Grosvernier, P., 610
Wiedermann, M., Nilsson, M., Hoosbeek, M., Bayley, S., Nordbakken, J.F., Paulissen, 611
M.P.C., Hotes, S., Breeuwer, A., Ilomets, M., Tomassen, H., Leith, I. & Xu, B. (2012) 612
Glasshouse vs field experiments: do they yield ecologically similar results for 613
assessing N impacts on peat mosses? The New Phytologist, 195, 408-418. 614
Page 21
Trends of N deposition effects on Sphagnum
20
Limpens, J., Granath, G., Gunnarsson, U., Aerts, R., Bayley, S., Bragazza, L., Bubier, J., 615
Buttler, A., van den Berg, L., Francez, A.J., Gerdol, R., Grosvernier, P., Heijmans, M., 616
Hoosbeek, M., Hotes, S., Ilomets, M., Leith, I., Mitchell, E., Moore, T., Nilsson, M., 617
Nordbakken, J.F., Rochefort, L., Rydin, H., Sheppard, L., Thormann, M., 618
Wiedermann, M., Williams, B. & Xu, B. (2011) Climatic modifiers of the response to 619
nitrogen deposition in peat-forming Sphagnum mosses: a meta-analysis. The New 620
Phytologist, 191, 496-507. 621
Luo, Y. & Weng, E. (2011) Dynamic disequilibrium of the terrestrial carbon cycle under 622
global change. Trends in Ecology & Evolution, 26, 96-104. 623
Magill, A.H., Aber, J.D., Currie, W., Nadelhoffer, K., Martin, M., McDowell, W.H., Melillo, 624
J.M., Steudler, P., 2004. Ecosystem response to 15 years of chronic nitrogen additions 625
at the Harvard Forest LTER, Massachusetts, USA. Forest Ecology and Management, 626
196, 7-28. 627
Malmer, N. & Wallén, B., 2004. Input rates, decay losses and accumulation rates of carbon in 628
bogs during the last millenium: internal processes and environmental changes. 629
Holocene, 14, 111-117. 630
Malmer, N. & Wallén, B. (2005) Nitrogen and phosphorus in mire plants: variation during 50 631
years in relation to supply rate and vegetation type. Oikos, 109, 539-554. 632
Mitchell, T.D., Carter, T.R., Jones, P.D., Hulme, M. & New, M. (2004) A comprehensive set 633
of high-resolution grids of monthly climate for Europe and the globe: the observed 634
record (1901–2000) and 16 scenarios (2001–2100). Tyndall Centre for Climate 635
Change Research, Working Paper 55, pp. 25. 636
Nakićenović, N. & Swart, R. (2000) Special Report on Emission Scenarios. 637
Intergovernmental Panel on Climate Change, Cambridge University Press, Cambridge. 638
Page 22
Trends of N deposition effects on Sphagnum
21
Payne, R., Dise, N., Stevens, C., Gowing, D. & Partners, B. (2013) Impact of nitrogen 639
deposition at the species level. Proceedings of the National Academy of Sciences of 640
the United States of America, 110, 984-987. 641
Pregitzer, K.S., Burton, A.J., Zak, D.R., Talhelm, A.F., 2007. Simulated chronic nitrogen 642
deposition increases carbon storage in Northern Temperate forests. Global Change 643
Biology, 14, 1-12. 644
Raupach, M.R., Marland, G., Ciais, P., Le Quéré, C., Canadell, J.G., Klepper, G. & Field, 645
C.B. (2007) Global and regional drivers of accelerating CO2 emissions. Proceedings 646
of the National Academy of Sciences of the United States of America, 104, 10288–647
10293 648
Roulet, N.T., Lafleur, P.M., Richard, P.J.H., Moore, T.R., Humphreys, E.R. & Bubier, J. 649
(2007) Contemporary carbon balance and late Holocene carbon accumulation in a 650
northern peatland. Global Change Biology, 13, 397-411. 651
Ruete, A., Yang, W., Bärring, L., Stenseth, N. & Snäll, T. (2012) Disentangling effects of 652
uncertainties on population projections: climate change impact on an epixylic 653
bryophyte. Proceedings. Biological sciences / The Royal Society, 279, 3098-3105. 654
Rydin, H. & Jeglum, J.K. (2013) The Biology of Peatlands. 2nd
edn, Oxford University Press, 655
New York. 656
Simpson, D., Benedictow, A., Berge, H., Bergström, R., Emberson, L.D., Fagerli, H., 657
Flechard, C.R., Hayman, G.D., Gauss, M., Jonson, J.E., Jenkin, M.E., Nyiri, A., 658
Richter, C., Semeena, V.S., Tsyro, S., Tuovinen, J.-P., Valdebenito, A., Wind, P., 659
(2012) The EMEP MSC-W chemical transport model – technical description. 660
Atmospheric Chemistry and Physics 12, 7825-7865. 661
Page 23
Trends of N deposition effects on Sphagnum
22
Tomassen, H.B.M., Smolders, A.J.P., Limpens, J., Lamers, L.P.M. & Roelofs, J.G.M. (2004) 662
Expansion of invasive species on ombrotrophic bogs: desiccation or high N 663
deposition. Journal of Applied Ecology, 41, 139-150. 664
Turunen, J., Roulet, N.T., Moore, T.R. & Richard, P.J.H. (2004) Nitrogen deposition and 665
increased carbon accumulation in ombrotrophic peatlands in eastern Canada. Global 666
Biogeochemical Cycles, 18, GB3002. 667
van Breemen, N. (1995) How Sphagnum bogs down other plants. Trends in Ecology & 668
Evolution, 10, 270-275. 669
Vitt, D.H. (1990) Growth and production dynamics of boreal mosses over climatic, chemical 670
and topographic gradients. Botanical Journal of the Linnean Society, 104, 35-59. 671
Vitt, D.H., Wieder, K., Halsey, L.A. & Turetsky, M., (2003) Response of Sphagnum fuscum 672
to nitrogen deposition: A case study of ombrogenous peatlands in Alberta, Canada. 673
The Bryologist, 106, 235-245. 674
Wallén, B. (1992) Methods for studying below-ground production in mire ecosystems. Suo, 675
43, 155-162. 676
Wieder, R.K., Vitt, D.H., Burke-Scoll, M., Scott, K.D., House, M. & Vile, M.A., 2010. 677
Nitrogen and sulphur deposition and the growth of Sphagnum fuscum in bogs of the 678
Athabasca Oil Sands Region, Alberta. Journal of limnology, 69, 161-170. 679
Yu, Z., Beilman, D.W., Frolking, S., MacDonald, G.M., Roulet, N.T., Camill, P. & Charman, 680
D.J. (2011) Peatlands and their role in the global carbon cycle. Eos, Transactions 681
American Geophysical Union, 92, 97-98. 682
683
Page 24
Trends of N deposition effects on Sphagnum
23
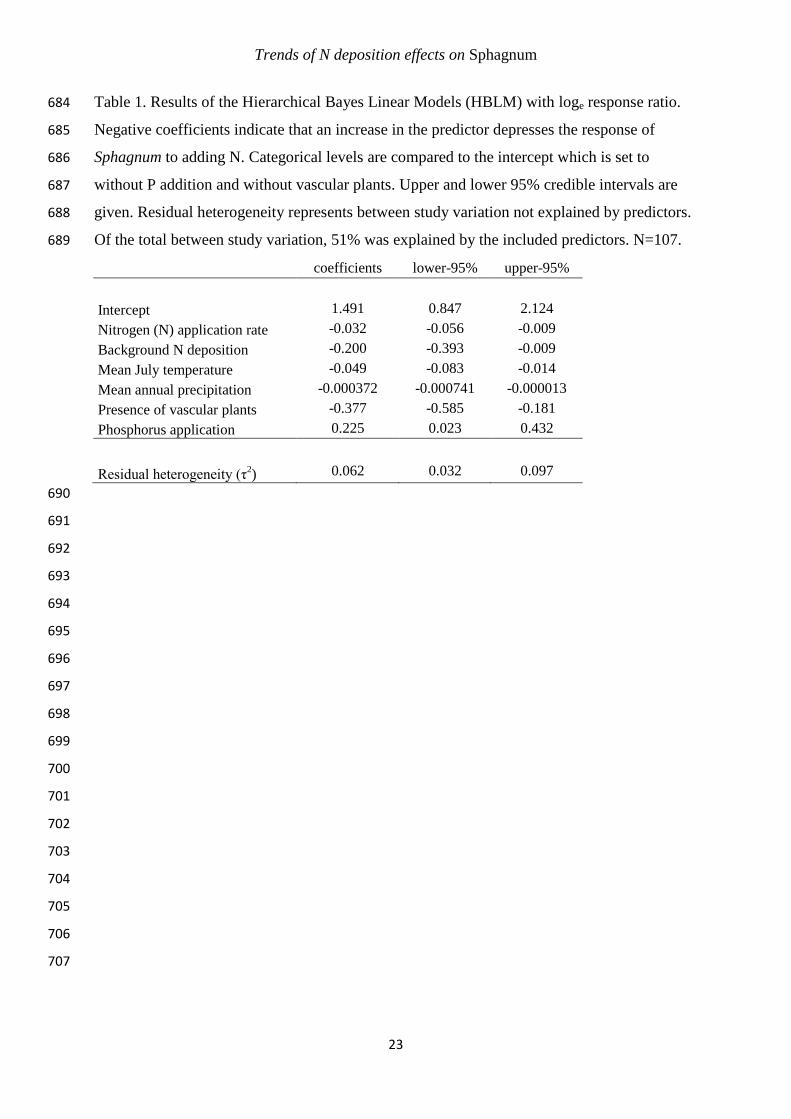
Table 1. Results of the Hierarchical Bayes Linear Models (HBLM) with loge response ratio. 684
Negative coefficients indicate that an increase in the predictor depresses the response of 685
Sphagnum to adding N. Categorical levels are compared to the intercept which is set to 686
without P addition and without vascular plants. Upper and lower 95% credible intervals are 687
given. Residual heterogeneity represents between study variation not explained by predictors. 688
Of the total between study variation, 51% was explained by the included predictors. N=107. 689
coefficients lower-95% upper-95%
Intercept 1.491 0.847 2.124
Nitrogen (N) application rate -0.032 -0.056 -0.009
Background N deposition -0.200 -0.393 -0.009
Mean July temperature -0.049 -0.083 -0.014
Mean annual precipitation -0.000372 -0.000741 -0.000013
Presence of vascular plants -0.377 -0.585 -0.181
Phosphorus application 0.225 0.023 0.432
Residual heterogeneity (τ2) 0.062 0.032 0.097
690
691
692
693
694
695
696
697
698
699
700
701
702
703
704
705
706
707
Page 25
Trends of N deposition effects on Sphagnum
24
Table 2. Summary statistics of model predictions at the European scale (see Fig.1 for 708
coverage). CLE N refers to the current legislation N emission scenario (GEA-CLE, here 709
called CLE N) and A1 clim change to the A1 climate scenario. Constant N keeps N deposition 710
at the mean of 2000-2010 and constant climate uses the mean of 1961-1990. Average effect of 711
N deposition on Sphagnum production and Sphagnum C balance of Sphagnum-dominated 712
peatlands are calculated as weighted means using peatland cover in grid cells as weights. Area 713
indicates total peatland area where Sphagnum is estimated to have been, or to be, affected 714
negatively or positively. The 1st and 99
th percentiles are given to show the range of the grid 715
cell predictions. 716
717
718
719
720
721
722
723
724
725
726
727
728
729
730
731
Period Scenario
Average effect on
production (1st, 99
th %ile)
(% change)
Average effect on
C balance (1st, 99th %ile)
(g m-2
yr-1
)
neg pos
1900 - 1950 - - - -
1950 - 2000 -6 (-46, 9) -6 (-46, 9) 0.84 0.36
2000 - 2050 CLE N, A1 Clim Change -12 (-65, 16) -12 (-65, 16) 1.11 0.44
CLE N, Constant climate -5 (-58, 25) -5 (-58, 25) 0.92 0.63
Constant N, A1 Clim Change -15 (-52, 0) -15 (-52, 1) 1.54 0.05
Constant N and Constant climate -8 (-49, 11) -8 (-49, 11) 1.22 0.37
Area
(mil. ha)
Page 26
Trends of N deposition effects on Sphagnum
25
732
Fig 1. (A) Modelled nitrogen (N) deposition over Europe in the year 1900 and changes in N 733
deposition over three time periods; (B) mean 1900-1950 compared to 1900, (C) mean 1950-734
2000 compared to the 1900-1950 mean, and (D), mean 2000-2050, compared to the 1950-735
2000 mean. Predictions for 2000-2050 (C) are based on the GEA-CLE deposition scenario. 736
Page 27
Trends of N deposition effects on Sphagnum
26
737
Fig. 2. Map showing the abundance (proportion of total land area) and distribution of open to 738
semi-open Sphagnum-dominated peatlands in Europe. Data are based on the JRC forest map 739
and the CORINE 2006 land cover map. The light brown colour indicates countries without 740
data. 741
742
Page 28
Trends of N deposition effects on Sphagnum
27
743
Fig 3. Effects of N deposition on Sphagnum production presented as percentage change 744
relative to 1900. Annual mean effect between (a) 1950 to 2000, (b) 2000 to 2050 under a 745
current legislation emission scenario (GEA-CLE, here called CLE N scenario) and the A1 746
climate change scenario, (c) 2000 to 2050 assuming constant N deposition (mean of 2000-747
2010) and climate change scenarioA1, (d) 2000 to 2050 assuming constant N deposition and 748
constant climate (1961-1990 average). Only open to semi-open Sphagnum dominated 749
peatlands were modelled. Yellow illustrates areas where N deposition were too low (< 0.4 g 750
Page 29
Trends of N deposition effects on Sphagnum
28
m-2
yr-1
increase since 1900) to make reliable predictions. Light brown colour indicates 751
countries without data on peatland distribution. 752
753
754
755
756
757
758
759
760
761
762
763
764
765
766
767
768
769
770
771
772
773
774
775
776
777
Page 30
Trends of N deposition effects on Sphagnum
29
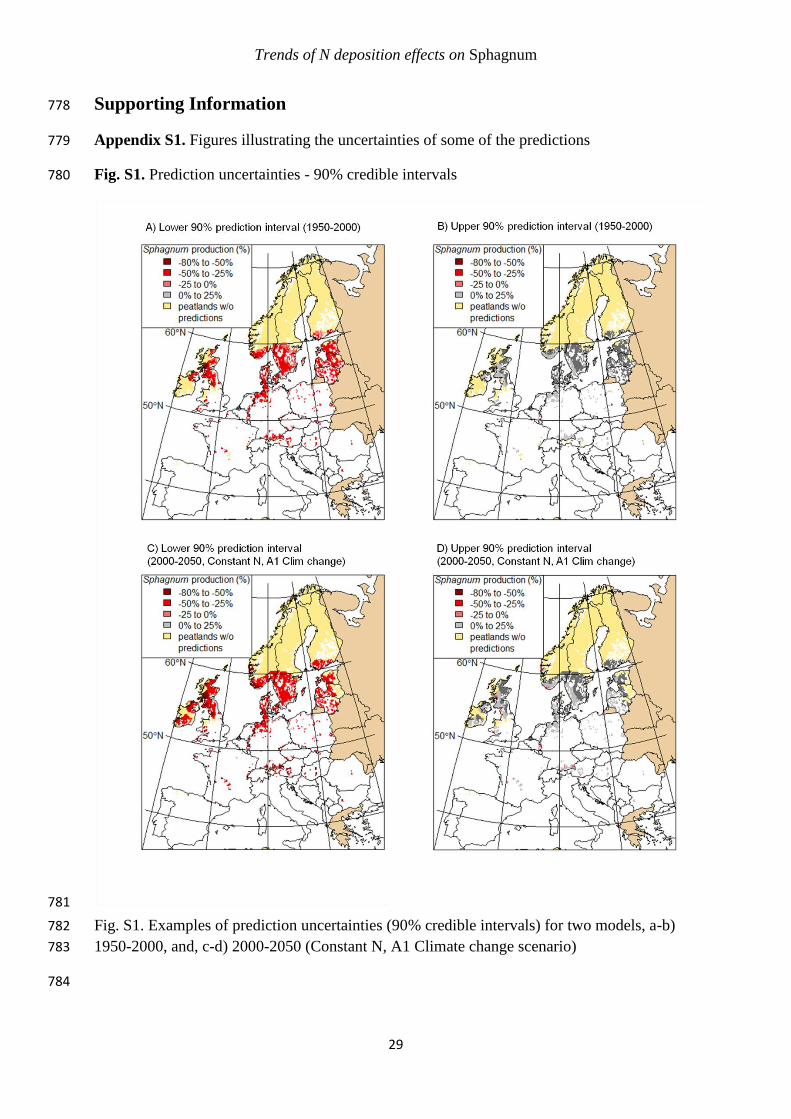
Supporting Information 778
Appendix S1. Figures illustrating the uncertainties of some of the predictions 779
Fig. S1. Prediction uncertainties - 90% credible intervals 780
781
Fig. S1. Examples of prediction uncertainties (90% credible intervals) for two models, a-b) 782
1950-2000, and, c-d) 2000-2050 (Constant N, A1 Climate change scenario) 783
784
Page 31
Trends of N deposition effects on Sphagnum
30
Fig. S2. Prediction uncertainties - 50% credible intervals 785
786
Fig. S2. Examples of prediction uncertainties (50% credible intervals) for two models, a-b) 787
1950-2000, and, c-d) 2000-2050 (Constant N, A1 Climate change scenario) 788
789


![Effect of Climate Change on Soil Productivity in ......how climate change has affected soil productivity because soil productivity plays a key role in agricultural development [20].There](https://static.documents.pub/doc/80x56/5f1b1e8069fa761e3c401861/effect-of-climate-change-on-soil-productivity-in-how-climate-change-has.jpg)


