Please cite this paper as:
Moriconi, G. and J. Bélanger (2015), “Student Behaviour andUse of Class Time in Brazil, Chile and Mexico: Evidence fromTALIS 2013”, OECD Education Working Papers, No. 112,OECD Publishing.http://dx.doi.org/10.1787/5js6bhlchwmt-en
OECD Education Working PapersNo. 112
Student Behaviour and Useof Class Time in Brazil, Chileand Mexico
EVIDENCE FROM TALIS 2013
Gabriela Moriconi, Julie Bélanger
Unclassified EDU/WKP(2015)1 Organisation de Coopération et de Développement Économiques Organisation for Economic Co-operation and Development 30-Jan-2015
___________________________________________________________________________________________
_____________ English - Or. English DIRECTORATE FOR EDUCATION AND SKILLS
STUDENT BEHAVIOUR AND USE OF CLASS TIME IN BRAZIL, CHILE AND MEXICO:
EVIDENCE FROM TALIS 2013
Education Working Paper No. 112
by Gabriela Miranda Moriconi, Fundação Carlos Chagas and Julie Bélanger, Organisation for Economic
Co-Operation and Development
This paper was prepared by Gabriela Miranda Moriconi and Julie Bélanger during the Thomas J. Alexander
Fellowship awarded to Gabriela Miranda Moriconi from September 2013 to September 2014.
Julie Bélanger, Analyst, EDU/ECS ([email protected])
Gabriela Miranda Moriconi, Fundaçao Carlos Chagas ([email protected])
JT03369943
Complete document available on OLIS in its original format
This document and any map included herein are without prejudice to the status of or sovereignty over any territory, to the delimitation of
international frontiers and boundaries and to the name of any territory, city or area.
ED
U/W
KP
(2015)1
Un
classified
En
glish
- Or. E
ng
lish
Cancels & replaces the same document of 29 January 2015
EDU/WKP(2015)1
2
OECD EDUCATION WORKING PAPERS SERIES
OECD Working Papers should not be reported as representing the official views of the OECD or of its
member countries. The opinions expressed and arguments employed herein are those of the author(s).
Working Papers describe preliminary results or research in progress by the author(s) and are
published to stimulate discussion on a broad range of issues on which the OECD works. Comments on
Working Papers are welcome, and may be sent to the Directorate for Education and Skills, OECD, 2 rue
André-Pascal, 75775 Paris Cedex 16, France.
This document and any map included herein are without prejudice to the status of or sovereignty over
any territory, to the delimitation of international frontiers and boundaries and to the name of any territory,
city or area.
You can copy, download or print OECD content for your own use, and you can include excerpts from
OECD publications, databases and multimedia products in your own documents, presentations, blogs,
websites and teaching materials, provided that suitable acknowledgement of OECD as source and
copyright owner is given. All requests for public or commercial use and translation rights should be
submitted to [email protected].
Comment on the series is welcome, and should be sent to [email protected].
This working paper has been authorised by Andreas Schleicher, Director of the Directorate for
Education and Skills, OECD.
-------------------------------------------------------------------------
www.oecd.org/edu/workingpapers
--------------------------------------------------------------------------
COPYRIGHT © OECD 2015
EDU/WKP(2015)1
3
Abstract
Teachers in Brazil, Chile and Mexico report having high percentages of students with behavioural
problems in their classes. Especially in Brazil, teachers report spending large amounts of time keeping
order in the classroom. Besides potentially significantly reducing instructional time and students’
opportunities to lean, student misbehaviour can also influence attracting and retaining teachers. Therefore,
this paper aims to investigate factors associated with time that lower secondary teachers report spending
keeping order in the classroom and factors associated with these teachers’ reports of student behavioural
problems in their class. It is based on in-depth analyses from the OECD Teaching and Learning
International Survey (TALIS 2013) data from Brazil, Chile and Mexico. Some of the major findings show
that aspects of initial teacher education, professional development and teacher professional collaboration
are associated with the time that lower secondary teachers report spending keeping order in the classroom,
while participation among stakeholders in schools is negatively associated with student behavioural
problems in the classroom.
Résumé
Au Brésil, au Chili et au Mexique, les enseignants font état d’importants pourcentages d’élèves ayant
des problèmes de comportement dans leurs classes. Au Brésil plus particulièrement, les enseignants
indiquent consacrer beaucoup de temps au maintien de l’ordre en classe. En plus de réduire potentiellement
de façon significative le temps d’instruction et les opportunités d’apprentissage, les problèmes de
comportement des élèves peuvent également avoir une incidence sur l’attrait de la profession d’enseignant
et le maintien des enseignants déjà en poste. Cet article document entend donc étudier les facteurs associés
au temps que les enseignants du premier cycle du secondaire indiquent consacrer au maintien de l’ordre en
classe et les facteurs associés aux déclarations que font ces enseignants de comportements perturbateurs
d’élèves dans leurs classes. Il se fonde sur des analyses approfondies des données de l’Enquête
internationale de l’OCDE sur l’enseignement et l’apprentissage (TALIS 2013) pour le Brésil, le Chili et le
Mexique. Parmi les principaux résultats, il apparaît que certains aspects de la formation initiale des
enseignants, de leur formation continue et de leur collaboration professionnelle entre pairs présentent un
lien avec le temps que les enseignants du premier cycle du secondaire indiquent consacrer au maintien de
l’ordre en classe, tandis que la participation des différents acteurs de l’établissement présente une relation
négative avec les problèmes de comportement des élèves en classe.
EDU/WKP(2015)1
4
TABLE OF CONTENTS
STUDENT BEHAVIOUR AND USE OF CLASS TIME IN BRAZIL, CHILE AND MEXICO:
EVIDENCE FROM TALIS 2013 ................................................................................................................... 5
Introduction .................................................................................................................................................. 5 Literature review .......................................................................................................................................... 7
Instructional time ...................................................................................................................................... 7 Research on student behaviour and use of class time in Latin American schools ................................... 8 Developing instructional skills to improve the use of class time ............................................................. 9
Empirical analysis ...................................................................................................................................... 11 Data ........................................................................................................................................................ 11 Methods .................................................................................................................................................. 14 Results .................................................................................................................................................... 16
Conclusions ................................................................................................................................................ 23
REFERENCES .............................................................................................................................................. 26
Tables
Table 1. Participation on TALIS and estimated size of lower secondary teacher population from
Brazil, Chile and Mexico ....................................................................................................... 12 Table 2. Teachers from TALIS 2013 who were excluded and who remained in the analysis ............ 12 Table 3. Characteristics of Teachers, Classes and Schools in the analysis.......................................... 13 Table 4. Variables included in the model for the analysis of time keeping order ............................... 15 Table 5. Variables included in the model for the behavioural problems analysis ............................... 16 Table 6. Time keeping order analysis - empty model.......................................................................... 17 Table 7. Time keeping order analysis - estimates with behavioural problems variables .................... 18 Table 8. Time keeping order analysis - estimates with socioeconomic variables ............................... 19 Table 9. Time keeping order analysis - estimates with type of school management variable (public or
private) ................................................................................................................................... 19 Table 10. Time keeping order analysis - full model .............................................................................. 20 Table 11. Behavioural problems analysis .............................................................................................. 22
Figures
Figure 1. Percentage of lower secondary teachers who report having more than 10% of their students
with behavioural problems in a target class ............................................................................. 6 Figure 2. Proportion of class time lower secondary teachers spend keeping order in a target class -
TALIS 2013 ............................................................................................................................. 6 Figure 3. Framework of results ............................................................................................................. 24
EDU/WKP(2015)1
5
STUDENT BEHAVIOUR AND USE OF CLASS TIME IN BRAZIL, CHILE AND MEXICO:
EVIDENCE FROM TALIS 20131
Introduction
In addition to frequently being the focus of media reports and professional literature, classroom
management and student discipline are some of the most commonly cited concerns by teachers
(McCormack, 1997; Husu, 2003). Moreover, student discipline and behavioural problems are some of the
areas for which teachers in many countries report the highest levels of need for professional development
(OECD, 2009, 2014a; Jensen et al., 2012).
Classrooms with severe disciplinary problems are less conducive to learning because teachers have to
spend time dealing with disruptions instead of actually engaging in teaching and learning activities.
Keeping order in the classroom can really consume a large proportion of class time, reducing students’
opportunities to learn (Cotton, 1989).
Student misbehaviour also contributes to teacher dissatisfaction and stress, affecting teachers’
attraction and retention. Along with low wages and low social status, student behaviour is one of the most
cited reasons for Brazilian high school students deciding not to enter the teaching profession (Tartuce et
al., 2010).
According to data from the OECD’s Teaching and Learning International Survey (TALIS), teachers’
perceptions of the level of student behavioural problems and disciplinary climate vary a great deal among
countries around the world (OECD, 2009, 2014a). While more than 60% of lower secondary teachers
report having more than 10% of students with behavioural problems in Brazil, the number is much lower in
Japan, where only 13% of teachers report the same (OECD, 2014a)2. Teachers in Chile and Mexico, the
two other Latin American countries that participated in TALIS 2013, also report high levels of student
behavioural problems in their classes.
1 . The first author received funding from the OECD Thomas J. Alexander fellowship program for carrying
out this work. The work should not be reported as representing the official views of the OECD or of its
member countries. The opinions expressed and arguments employed herein are those of the author(s).
2 . This is based on teachers’ answers to the question: “Please estimate the broad percentage of students who
have the following characteristics – Students with behavioural problems”.
EDU/WKP(2015)1
6
Figure 1. Percentage of lower secondary teachers who report having more than 10% of their students with behavioural problems in a target class
3
Source: OECD TALIS 2013 database.
Student misbehaviour can be associated with a reduction in students’ opportunities to learn
– especially in Brazil. Among all countries that participated in TALIS in both 2008 and 2013,
teachers in Brazil report spending the highest proportion of class time keeping order in the
classroom (18% in 2008 and 20% in 2013, compared to an international average of 13% in both
years). Chilean teachers are also among the countries in which teachers report spending higher
proportions of class time with disciplinary tasks, while Mexico is slightly below TALIS countries’
average.
Figure 2. Proportion of class time lower secondary teachers spend keeping order in a target class - TALIS 2013
Source: OECD TALIS 2013 database.
3 . The target class that teachers are asked to respond to is the first that they taught in that school after 11 a.m.
on the previous Tuesday. This is the strategy used by TALIS to obtain data from an average lesson for each
country.
EDU/WKP(2015)1
7
Although student misbehaviour can certainly result in teachers spending more time maintaining
discipline in the classroom, it is not the only factor that influences teachers’ use of class time. The first goal
of this paper is to investigate other factors which might be associated with the time teachers report
spending keeping order in the classroom, particularly focussing on aspects of teachers’ initial preparation
and engagement in professional collaboration. In doing so, the paper also aims to identify areas where
policies might better support teachers in dealing with student behavioural problems in their classroom.
Enhancing teachers’ capacity to deal with student behaviour should also be accompanied with other
strategies to reduce disciplinary problems and improve school climate. A second goal of this paper is
therefore to better understand the factors associated with student behavioural problems in order to identify
ways to reduce their incidence.
The study is based on in-depth analyses of TALIS 2013 data from the three Latin American countries
participating in the survey: Brazil, Chile and Mexico. As mentioned earlier, teachers in all three countries
report having high percentages of students with behavioural problems in their classes. Besides potentially
reducing actual instructional time, student misbehaviour can also influence attracting and retaining teachers
in all three countries and is therefore of great policy relevance.
This paper is further divided into three sections. The next section presents a brief literature review on
the use of time in schools and classrooms. The following section contains the empirical analyses and the
last section presents the conclusions of these analyses.
Literature review
Instructional time
Instructional time can be defined as the portion of classroom time actually spent teaching students
particular knowledge, concepts and skills pertaining to school subjects (Karweit and Slavin, 1981; Cotton,
1989), and can also be defined as a kind of “net measure of engaged teaching time” (Scheerens and
Hendricks, 2014). TALIS measures teachers' perceptions of instructional time by asking them to report the
percentage of class time they typically spend on actual teaching and learning.
There are many factors that may reduce the amount of time during which students are actually being
taught. These factors can be divided into two groups: those which occur before teaching starts – before
classes or between classes – and those which occur after instruction starts – during classes.
Students’ opportunities to attend classes may be reduced by several factors, including parties,
assemblies, medical screening, high-stakes examination, school closings due to inclement weather and
teacher strikes (Smith, 1998; Karweit, 1984). In developing countries, the school’s physical condition and
poor infrastructure (e.g. no roof or no walls, high noise levels, lack of ventilation or heating, lack of water),
natural calamities and political and social conflicts can also represent a relevant problem (EARC, 2003;
Benavot and Gad, 2004; Abadzi, 2007). These types of problems still affect some Latin American schools,
especially those in poorer areas of large urban cities or rural areas.
Due to low relative salaries, bad working conditions and/or difficult contexts, many educational
systems have difficulties hiring and retaining teachers, sometimes even more so in schools located in
poorer areas of large urban cities or rural areas (EARC, 2003). Since there is not always a substitute or
permanent teacher to replace one who left, students may spend days or even months without classes in a
specific subject. Teacher absenteeism can also be a factor that reduces instructional time (Abadzi, 2007).
According to TALIS 2013, between 18% and 21% of lower secondary teachers in Brazil, Chile and
Mexico work in schools where the principal reports that teacher absenteeism occurs at least weekly
(OECD, 2014a).
EDU/WKP(2015)1
8
Shortages of teachers and schools, especially in areas of high demand, also result in overcrowded
classes, with potential negative impact on the use of time in the classroom. According to TALIS 2013, in
Brazil, Chile and Mexico, the average class size in lower secondary is around 30 students, though in some
schools the average reaches 50 students in Brazil and Mexico, and 60 students in Chile. This means that a
significant group of teachers in these countries must engage more than 50 lower secondary students and
maintain a good disciplinary climate in the classroom – which can be a very challenging task.
Besides student interruptions (e.g. disruptive behaviour, peer conflicts) and teacher interruptions
(e.g. disciplinary actions, calling the office) there are other sources of lost instructional time such as
administrative tasks (e. g. recording attendance, handing out school information) (Karweit, 1984; Smith,
1998); transitions; and later starts and early dismissals (Hollowood et al., 1995). Smith (1998) found that,
on average, the rate of non-instructional time in Chicago public schools observed in her study was 23%. In
TALIS 2013, the average rate of non-instructional time reported by teachers ranged from 13% in Bulgaria
to 33% in Brazil – with an average of 21% among the participating countries. The average rate of non-
instructional time was 26% in Chile and 24% in Mexico.
Although there are other factors affecting time in the classroom, behavioural problems have been
identified as major causes of loss of instructional time (Cotton, 1989; Ratcliff et al., 2010). TALIS 2013
results support this idea. Teachers in TALIS 2013 report spending, on average, more class time dealing
with student discipline – 13% of class time – than on administrative tasks – 8% of class time.
Research on student behaviour and use of class time in Latin American schools
Although there is growing interest in how time is used inside the classrooms of Latin American
schools, there are only a few studies on this topic in the region. This section provides a very brief review of
the evidence in the region.
Carnoy, Gove and Marshall (2009) compared classrooms in Brazil, Chile and Cuba based on
observations of 3 rd grade mathematics lessons.
4 The results suggested that Cuban classes were considered
more efficient than Chilean, and especially Brazilian classes, since less instructional time was lost due to
transitions and interruptions. The authors affirm that the Brazilian sample was found to be consistently less
engaged: Brazilian students were sometimes visibly bored with the class or completely off task. In contrast,
Cuban students were consistently engaged and rarely presented body language that suggested a lack of
interest. Between those two extreme cases, they found the Chilean students: in private schools, student
engagement was similar to Cuban schools, but in public schools, the average was similar to Brazilian
schools. They point to the same difference in terms of disciplinary climate: in Cuban and Chilean private
schools, the classes had more orderly climate than Brazilian and Chilean public schools.
One possible reason for these results is lack of planning, which may be caused by lack of skills or
time – or both. Carnoy, Gove and Marshall (2009) found that Brazilian students spent much more time
copying instructions from the board than students from Chile and Cuba. Teachers used activities that were
already prepared in only a few Brazilian schools– which, in contrast, was commonly observed in Chile and
Cuba. The authors emphasise that having to copy mathematics problems from the board before starting to
solve them affected the use of time in the classroom.
Another possible reason is related to teaching style and opportunities for students to engage in
learning during classes. The evidence from municipal schools in Chile shows that the predominant
4 . While Carnoy et al. (2009) examines an earlier level of education than is the focus of this paper, it provides
interesting insights on educational practices in these countries that are likely to be found also in subsequent
levels of education, and is therefore included in this brief review of the literature.
EDU/WKP(2015)1
9
teaching style is characterised by directive pedagogy (Martinic and Vergara, 2007; Martinic, Vergara and
Huepe, 2013), in which most of the class time is spent by the teacher speaking to the whole class. In those
classes, most of the speech is focused on exposing content and explaining procedures, and is directed to an
“average student”, from which we can infer that differentiated instruction is not a common practice
(Martinic and Vergara, 2007; Martinic, Vergara and Huepe, 2013). A lower proportion of time is invested
in questions directed to students. Questions are focused on controlling the class flow and checking
information, being considered as of low cognitive complexity (González, Preiss and San Martín, 2008;
Preiss, 2009).
Moreover, there has been some evidence of inequalities in the use of class time, depending on the
socioeconomic status (SES) of students in Chile and Brazil. Carnoy, Gove and Marshall (2009) noted
important differences in content level and intensity of tasks according to student background in both
countries. These differences have been highlighted by other studies in Latin America. De La Cruz et al.
(2001) observed that students from poorer sectors in Argentina are more exposed to questions of low
cognitive complexity than students from wealthier sectors. Teachers in schools serving students from more
disadvantaged homes usually emphasise disciplinary aspects over cognitive aspects (De La Cruz et al.
2001; Martinic, Vergara and Huepe, 2013).
There is some evidence that cumulative factors might be at stake in Latin American schools: On the
one hand, Carnoy, Gove and Marshall (2009) observed that students from socio-economically
disadvantaged homes sometimes arrive at school with worse physical and emotional conditions, and may
also find worse school conditions to support their learning. On the other hand, based on their observations
in Argentinian schools, De La Cruz et al. (2001) affirm that teachers tend to shape their teaching according
to the representations they make of students from different backgrounds. Specifically, teachers tend not to
go as deeply into the content for students in disadvantaged areas, because they believe these students to be
less able to understand what students from more advantaged backgrounds might more easily understand.
Among the many conditions needed to reduce the loss of instructional time and engage students in
learning, none can substitute teachers’ effective teaching and classroom management (Hawley et al., 1984;
Smith, 1998; Gettinger and Seibert, 2002; Oliver, Wehby and Reschly, 2007). Teachers displaying
effective practices have higher proportions of instructional time (Smith, 1998) and of student time on task
(Espin and Yell, 2001). Although no study examining the effects of teacher pedagogical skills on the use of
class time was found in Latin America, studies from other educational systems may help shed some light
on initiatives that could support Latin American teachers in developing these skills and, therefore, in
improving their use of class time.
Developing instructional skills to improve the use of class time
Darling-Hammond, Wise, and Kline (1999) described teaching skills as follow:
Teaching skills include the abilities to transform knowledge into actions needed for effective
teaching - for example, abilities to evaluate student thinking and performance in order to plan
appropriate learning opportunities; abilities to critique, modify, combine, and use instructional
materials to accomplish teaching and learning goals; abilities to understand and use multiple
learning and teaching strategies; abilities to explain concepts clearly and appropriately, given the
developmental needs and social experiences of students; abilities to provide useful feedback to
students in constructive and instructionally helpful ways. (p.39)
One of the main contributions to the discussion about this knowledge required to be transformed into
effective teaching is given by Shulman (1987). Shulman’s (1987) knowledge base for teaching includes:
(1) content knowledge; (2) general pedagogical knowledge; (3) curriculum knowledge; (4) pedagogical
EDU/WKP(2015)1
10
content knowledge; (5) knowledge of learners; (6) knowledge of educational contexts; and (7) knowledge
of educational ends, purposes and values. The author particularly emphasises the pedagogical content
knowledge, which “represents the blending of content and pedagogy into an understanding of how
particular topics, problems or issues are organised, represented, and adapted to the diverse interests and
abilities of learners, and presented for instruction” (Shulman, 1987, p. 8).
Shulman’s (1987) knowledge base for teaching influenced teacher initial education in many countries
(Darling-Hammond and Lieberman, 2012). For example, it inspired the reform of the teaching profession
and the design of teacher initial education programs in Singapore (Goodwin, 2012), and it may be seen in
the ideas of teacher educators in Finland (Sahlberg, 2012) – two systems seen as leaders in the educational
field.
However, teacher initial education is not the only way to enhance teachers’ pedagogical knowledge
and skills. Many studies have shown that competencies in pedagogical strategies and classroom
management can be improved through specifically designed activities of professional development
(Supovitz and Turner, 2000; Garet et al., 2001; Desimone et al, 2002; Darling-Hammond et al., 2009).
Some characteristics of professional development considered to be effective in improving teaching
practices are: (1) content focus; (2) coherence; (3) active learning; (4) frequency and duration; and (5)
collective participation and collaboration (Garet et al., 1999, 2001; Desimone, 2009; Darling-Hammond et
al., 2009).
First, professional development should address concrete, everyday challenges involved in teaching
and learning specific academic subject matter, rather than focus on abstract educational principles or
teaching methods taken out of context (Darling-Hammond et al., 2009). Improving teachers’ knowledge of
subject-matter content and pedagogy is necessary for teachers who received insufficient or inadequate
initial education or training (Davis et al., 2011), but is also important to ensure that all teachers adapt to
changes in current understanding of subjects (Hawley and Valli, 1999).
Second, there is a need for coherence among professional development and the guidance that teachers
receive from multiple sources about what they are required to do, such as curriculum guidelines, textbooks,
assessments, teacher pre-service education, and so on (Garet et al., 1999; Supovitz, Mayer and Kahle,
2000). If there is a disconnect between what teachers learn during professional development and what is
required by other systems or school policies, teachers are less likely to implement the strategies learned in
professional development in their classroom (Darling-Hammond et al., 2009).
Third, teacher professional development should not be restricted to listening to lecturers talking about
abstractions and generalities: it must engage teachers in concrete teaching tasks, such as planning lessons
and evaluating students’ work (Darling-Hammond and McLaughlin, 1995; Garet et al., 2001). Lieberman
(1995) argues that for teachers to change their teaching they must have the opportunity to “talk, think, try
out, and hone new practices, which means they must be involved in learning about, developing and using
new ideas with their students” (p. 189).
Fourth, teacher professional development should be sustained over time (Hawley and Valli, 1999;
Garet et al., 1999; Supovitz and Turner, 2000). Professional development that occurs in a continuous way
(rather than one-off presentations) and at regular intervals is most effective for supporting changes in
teachers’ practices (Lieberman, 1995; Garet et al., 2001). More intensive activities are more likely to
provide an opportunity for in-depth discussion, while activities that extend over time are more likely to
allow teachers to try out new practices in the classroom and obtain feedback on their teaching (Garet et al.,
1999).
EDU/WKP(2015)1
11
Fifth, professional development can be conceived as a process of professional collaboration (Darling-
Hammond and McLaughlin, 1995; Hawley and Valli, 1999). Garret et al. (1999) indicate that collective
participation in professional development may help contribute to a shared professional culture, in which
teachers in a school, or teachers who teach the same grade or subject may all develop a common
understanding of pedagogical goals, methods, problems and solutions. Hawley and Valli (1999) affirm that
learning opportunities organised around collaborative problem solving give teachers the opportunity to
work together to address issues of common concern, which enables not only teacher change, but also
school change.
Collaboration among teachers and other members of the school community is also important to
overcome school challenges, such as poor school climate. This is of particular relevance for this study,
since it is hard to maintain a good classroom climate if there is a bad school climate. For example, Porter
(2006) recommends involving the school community when developing a school-wide disciplinary policy
that provides a framework for preventing and intervening with disruptions. Wide consultation with staff,
students and parents through the process improves policy effectiveness, besides being a moral obligation
(Porter, 2006).
This short review of the relevant literature suggests that these aspects of teacher initial education,
professional development and professional collaboration can be important ways of developing teacher
pedagogical skills, and therefore help teachers implement strategies to better engage their students in
learning. The main hypotheses of this paper are therefore that teachers in Brazil, Chile and Mexico who
take part in these types of initiatives will be more likely to develop skills that will allow them to engage
their students in learning and will spend a smaller proportion of time keeping order in their classroom.
The next section will present the analyses that investigate if these and other school and classroom
conditions are associated with student behaviour, and teachers’ reported use of class time.
Empirical analysis
Data
These analyses are based on data from TALIS 2013.5 TALIS is an international, large-scale survey
that focuses on the working conditions of teachers and the learning environment in schools. The first cycle
of TALIS was conducted in 2008 and surveyed teachers and school leaders of lower secondary education
in 24 countries. In the second cycle, TALIS 2013 expanded to include additional countries, with a total of
34 participants (OECD, 2014a, 2014b).
The target sample size for TALIS is 200 randomly selected lower-secondary schools per country, with
20 randomly selected teachers and 1 school leader per school. Brazil opted to sample in such a way so as to
represent the state system of education and the set of municipal systems of education in each of the 26
states of the Brazilian federation, plus the Federal District system of education. This resulted in a much
larger number of participating schools and teachers in Brazil than in the other participating countries, as
shown in Table 1.
5 . The complete database from TALIS 2013 is available at:
http://stats.oecd.org/Index.aspx?datasetcode=talis_2013%20
EDU/WKP(2015)1
12
Table 1. Participation on TALIS and estimated size of lower secondary teacher population from Brazil, Chile and Mexico
Brazil Chile Mexico
Number of participating schools 1 070 178 187
Responding teachers in participating schools 14 291 1 676 3 138
School participation before replacement (%) 97 88 95
School participation after replacement (%) 97 91 96
Teacher participation in participating schools (%) 94 93 91
Overall participation (%) 91 85 87
Weighted estimated size of teacher population 594 874 51 632 250 831
Source: OECD (2014a) - Table A.2.
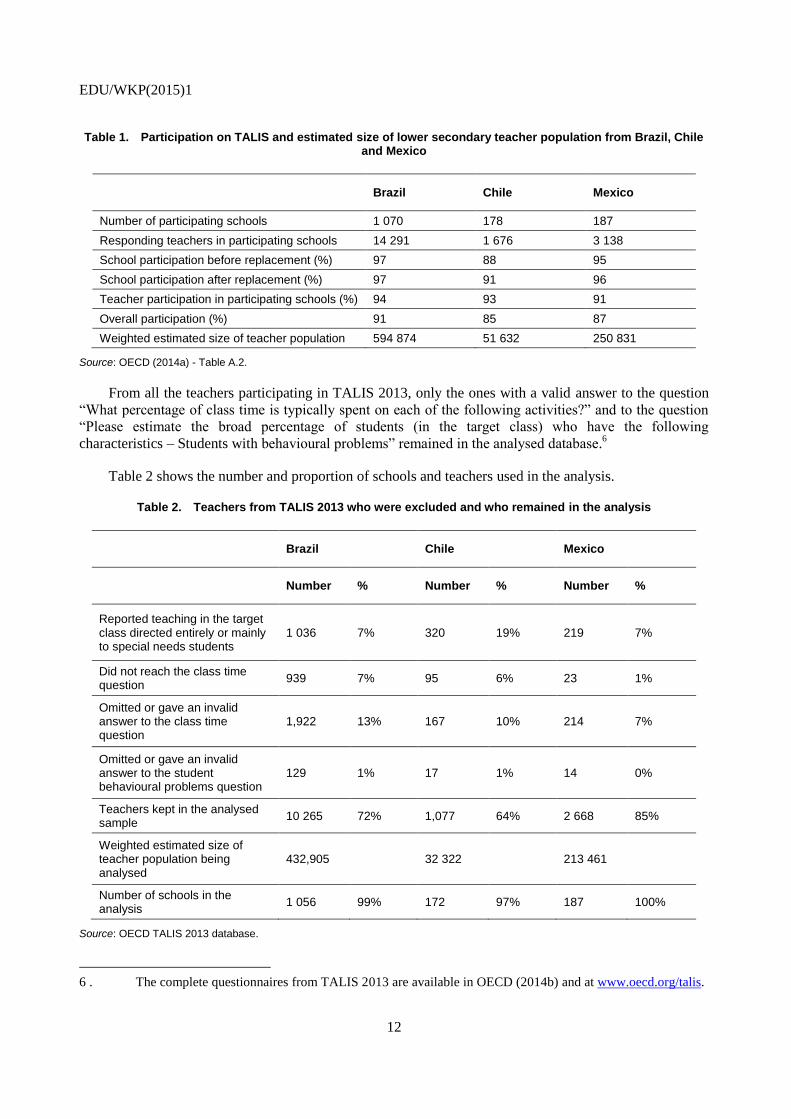
From all the teachers participating in TALIS 2013, only the ones with a valid answer to the question
“What percentage of class time is typically spent on each of the following activities?” and to the question
“Please estimate the broad percentage of students (in the target class) who have the following
characteristics – Students with behavioural problems” remained in the analysed database.6
Table 2 shows the number and proportion of schools and teachers used in the analysis.
Table 2. Teachers from TALIS 2013 who were excluded and who remained in the analysis
Brazil Chile Mexico
Number % Number % Number %
Reported teaching in the target class directed entirely or mainly to special needs students
1 036 7% 320 19% 219 7%
Did not reach the class time question
939 7% 95 6% 23 1%
Omitted or gave an invalid answer to the class time question
1,922 13% 167 10% 214 7%
Omitted or gave an invalid answer to the student behavioural problems question
129 1% 17 1% 14 0%
Teachers kept in the analysed sample
10 265 72% 1,077 64% 2 668 85%
Weighted estimated size of teacher population being analysed
432,905 32 322 213 461
Number of schools in the analysis
1 056 99% 172 97% 187 100%
Source: OECD TALIS 2013 database.
6 . The complete questionnaires from TALIS 2013 are available in OECD (2014b) and at www.oecd.org/talis.
EDU/WKP(2015)1
13
The analysis contains 72%, 64% and 85% of responding teachers in Brazil, Chile and Mexico,
respectively. Half of the exclusions in Brazil and Mexico, and more than half in Chile, were not related to
the class time and student behaviour questions: teachers either reported teaching entirely or mainly to
special needs students or they did not reach the class time question when filling in the questionnaire.
Furthermore, all the original schools remained in the Mexican database and almost all of them remained in
the Brazilian and Chilean databases. Thereby, the teachers and schools that remained in the databases do
not seem to represent a biased sample in these countries.
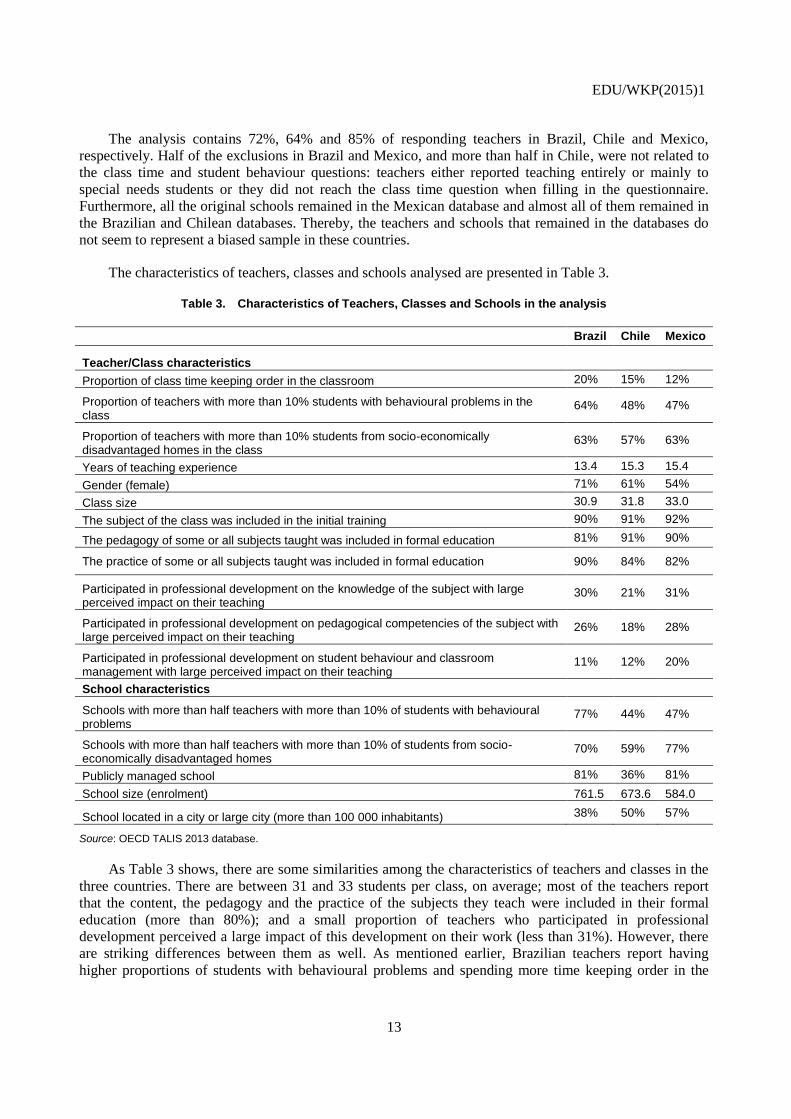
The characteristics of teachers, classes and schools analysed are presented in Table 3.
Table 3. Characteristics of Teachers, Classes and Schools in the analysis
Brazil Chile Mexico
Teacher/Class characteristics
Proportion of class time keeping order in the classroom 20% 15% 12%
Proportion of teachers with more than 10% students with behavioural problems in the class
64% 48% 47%
Proportion of teachers with more than 10% students from socio-economically disadvantaged homes in the class
63% 57% 63%
Years of teaching experience 13.4 15.3 15.4
Gender (female) 71% 61% 54%
Class size 30.9 31.8 33.0
The subject of the class was included in the initial training 90% 91% 92%
The pedagogy of some or all subjects taught was included in formal education 81% 91% 90%
The practice of some or all subjects taught was included in formal education 90% 84% 82%
Participated in professional development on the knowledge of the subject with large perceived impact on their teaching
30% 21% 31%
Participated in professional development on pedagogical competencies of the subject with large perceived impact on their teaching
26% 18% 28%
Participated in professional development on student behaviour and classroom management with large perceived impact on their teaching
11% 12% 20%
School characteristics
Schools with more than half teachers with more than 10% of students with behavioural problems
77% 44% 47%
Schools with more than half teachers with more than 10% of students from socio-economically disadvantaged homes
70% 59% 77%
Publicly managed school 81% 36% 81%
School size (enrolment) 761.5 673.6 584.0
School located in a city or large city (more than 100 000 inhabitants) 38% 50% 57%
Source: OECD TALIS 2013 database.
As Table 3 shows, there are some similarities among the characteristics of teachers and classes in the
three countries. There are between 31 and 33 students per class, on average; most of the teachers report
that the content, the pedagogy and the practice of the subjects they teach were included in their formal
education (more than 80%); and a small proportion of teachers who participated in professional
development perceived a large impact of this development on their work (less than 31%). However, there
are striking differences between them as well. As mentioned earlier, Brazilian teachers report having
higher proportions of students with behavioural problems and spending more time keeping order in the
EDU/WKP(2015)1
14
classroom than Chilean and Mexican teachers. Also, while most schools in Brazil and Mexico are publicly
managed, in Chile the opposite is the case – although a large part of them may be publicly funded.
Methods
This paper has two main goals. The first purpose of this work is to identify the factors that are
associated with the percentage of time teachers report spending keeping order in the classroom. The
analyses take into account the hierarchical nature of the TALIS data, in which teachers (and their classes)
are nested within schools, and schools are nested within countries. Teachers within a school share the same
school population, climate and internal procedures. Because of this, it is expected that two teachers
randomly chosen within the same school will tend to spend more similar amounts of time keeping order in
the classroom than two teachers randomly chosen from different schools. Hierarchical linear models
(HLM) are commonly used in the educational field due to their capacity to deal with the hierarchical nature
of educational data (Raudenbush and Bryk, 2002; Snijders and Bosker, 1999).
In this model, the dependent variable is the percentage of class time each teacher reports spending
keeping order in the classroom, which may theoretically vary from 0 to 100%. The explanatory variables
were created based on the questions available in TALIS that represent issues presented in the literature
review, but also some other factors that might be associated with the time spent keeping order in the
classroom.
Variables related to aspects of teacher initial education and professional development are of particular
interest since they represent factors that may be improved by educational policies in order to improve
teachers' skills for teaching and classroom management. In terms of teacher education, variables indicating
whether or not it included the content and the pedagogy of the content currently being taught by the teacher
– representing Shulman's (1987) pedagogical content knowledge – as well as classroom practices were
included. In terms of professional development, variables indicating teachers’ reported participation in
activities, which included content knowledge and pedagogical content knowledge, as well as student
behaviour and classroom management, were also included in the analyses. The variables related to teacher
preparation also included two indices of effective professional development and professional collaboration.
These indices contain the features discussed in the literature review and are described in Table 4, which
presents all the variables included in this model. The hypothesis of this analysis is that teachers who report
having participated in these initial teacher education, professional development and collaboration activities
developed better teaching and classroom management skills and, therefore, will report spending less time
keeping order in the classroom – all the control variables being held constant. Among the control variables
are context variables, such as student behaviour and socio-economic background. Control variables are
also presented in Table 4.
EDU/WKP(2015)1
15
Table 4. Variables included in the model for the analysis of time keeping order
Dependent Variable
Class time keeping order
Percentage of class time spent keeping order in the classroom in the target class (from 0 to 100%)
Independent Variables
Teacher/Class Level Variables
Student behaviour Percentage of students with behavioural problems in the target class (10% or less = 0; more than 10% = 1)
Student socioeconomic background
Percentage of students from socioeconomically disadvantaged homes in the target class (10% or less = 0; more than 10% = 1)
Teacher experience Teaching experience (number of years)
Teacher gender Gender (female = 1; male = 0)
Class size Class size (number of students in the target class)
Teacher formal education
Whether the subject of the target class was included in the teacher’s initial formal education (yes, in ISCED level 4 or above or in a subject specialisation as part of teacher training = 1; otherwise = 0) Whether the pedagogy of the subjects taught was included in the teacher’s formal education (yes, for all or some subjects taught = 1; no = 0) Whether the classroom practice (practicum, internship or student teaching) of the subjects taught was included in the teacher’s formal education (yes, for all or some subjects taught = 1; no = 0)
Teacher professional development
Index of teacher’s participation in effective professional development (ranging from 5.57 to 14.31). It is composed of teachers’ reports of whether their professional development was characterised by the following elements: A group of colleagues from my school or subject group Opportunities for active learning methods (not only listening to a lecturer) Collaborative learning activities or research with other teachers An extended time-period (several occasions spread out over several weeks or months) Participation in professional development covering knowledge and understanding of the teacher’s subject field, with large perceived impact on his/her teaching (yes = 1; no = 0) Participation in professional development covering pedagogical competencies in the teacher’s subject field, with large perceived impact on his/her teaching (yes = 1; no = 0) Participation in professional development covering student behaviour and classroom management, with large perceived impact on his/her teaching (yes = 1; no = 0)
School Level Variables
Student behaviour Percentage of teachers in the school who report having more than 10% of students with behavioural problems in their target class (from 0 to 100%)
Student socioeconomic background
Percentage of teachers in the school who report having more than 10% of students from socioeconomically disadvantaged homes in their target class (from 0 to 100%)
School sector School management (publicly managed school = 1; privately managed school = 0)a
Teacher engagement in professional collaboration
School mean index of professional collaboration (ranging from 3.93 to 14.49). It is composed of teachers’ reported engagement in the following activities: Teach jointly as a team in the same class Observe other teachers’ classes and provide feedback Engage in joint activities across different classes and age groups (e.g. projects) Take part in collaborative professional learning
a. Privately managed schools may or may not receive public funding.
Source: OECD TALIS 2013 database.
The second purpose of this paper is to identify the factors that are associated with higher percentages
of students with behavioural problems in the class. In other words, it aims to identify the profiles of
teachers – and their schools – who report having the highest proportions of students with behavioural
problems.
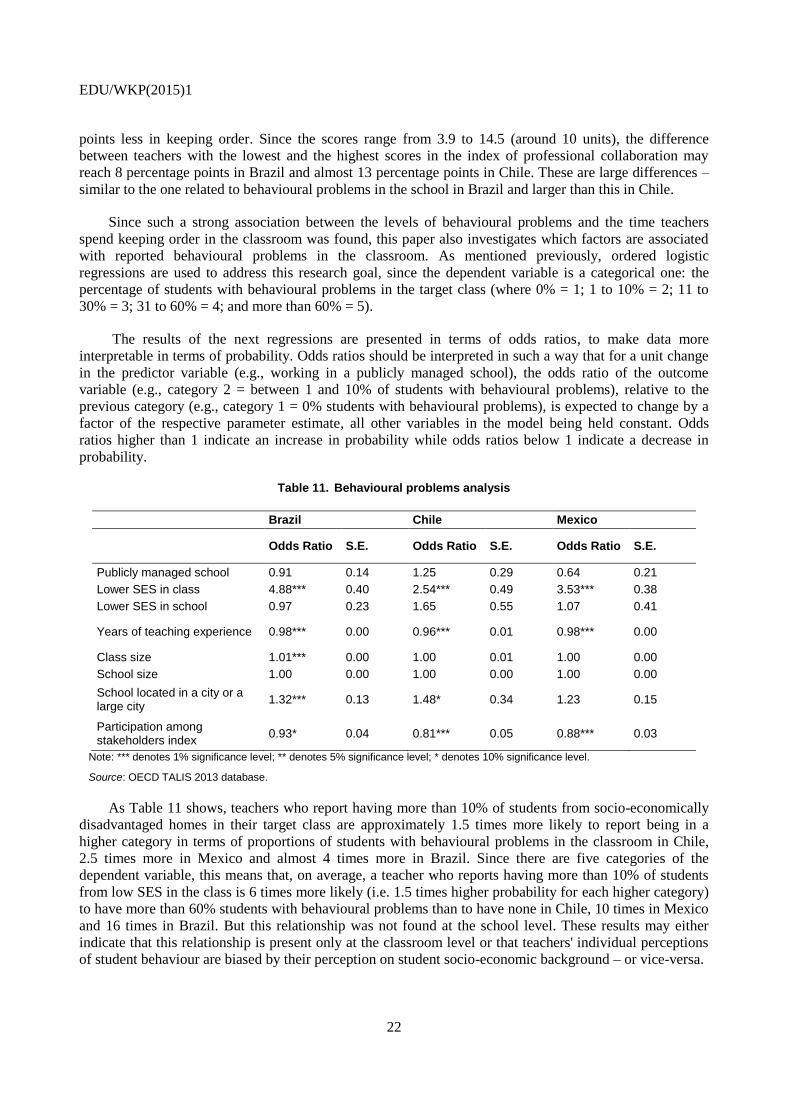
Since the proportion of students with behavioural problems in the classroom is captured by an ordered
categorical variable, ordered logistic regressions were conducted to address this research goal.
EDU/WKP(2015)1
16
The dependent variable was the variable representing the percentage of students with behavioural
problems in the target class (where 0% = 1; 1 to 10% = 2; 11 to 30% = 3; 31 to 60% = 4; and more than
60% = 5). In this case, there was a particular interest in investigating not only contextual factors, but also
whether higher participation in school decisions (by the school community) was associated with a lower
incidence of student misbehaviour. Therefore, the explanatory variables included an index of stakeholder
participation in school decisions. All the variables included in this model are described in Table 5.
Table 5. Variables included in the model for the behavioural problems analysis
Dependent Variable
Behavioural problems Percentage of students with behavioural problems in the target class (where 0% = 1; 1 to 10% = 2; 11 to 30% = 3; 31 to 60% = 4; and more than 60% = 5).
Independent Variables
Teacher/Class Level Variables
Student socio-economic background
Percentage of students from socioeconomically disadvantaged homes in the target class (10% or less = 0; more than 10% = 1).
Teacher experience Teaching experience (number of years).
Class size Class size (number of students in the target class).
School Level Variables
Student socio-economic background
Percentage of teachers in the school who report having more than 10% of students from socioeconomically disadvantaged homes in their target class (from 0 to 100%).
School size School size (number of students).
School location School location, according to population (in cities or large cities, with more than 100,000 inhabitants = 1; otherwise = 0).
Participation among stakeholders
School mean index of stakeholder participation in school decisions (ranging from 4.53 to 15.43). It is composed of teachers’ reports regarding the school climate on these aspects: This school provides staff with opportunities to actively participate in school decisions. This school provides parents or guardians with opportunities to actively participate in school decisions. This school provides students with opportunities to actively participate in school decisions. This school has a culture of shared responsibility for school issues. There is a collaborative school culture which is characterised by mutual support.
Source: OECD TALIS 2013 database.
All the indices presented in this paper were developed as a part of the TALIS 2013 study and are
included in the TALIS 2013 database. These indices were operationally defined by observable items and
constructed using complex procedures that involved scaling the items. The complex scales were first
evaluated with exploratory factor analysis: confirmatory factor analysis (CFA) was used to construct the
scales, and CFA with multiple comparison groups was used to validate the constructed scales. All the
details are described in OECD (2014b).
In all the analyses presented in this paper, the regressions were estimated for each country separately.
Results
The multilevel analysis of the percentage of class time teachers report spending on keeping order in
the classroom starts by running an empty model – a model with no independent variables. This allows us to
calculate the intraclass correlation coefficient (ICC), which expresses the degree of resemblance between
teachers and classes belonging to the same school. The ICC is called a correlation coefficient because it is
equal to the correlation between values of two randomly drawn teachers in the same, randomly drawn
school (Snijders and Bosker, 1999). The ICC can also be interpreted as the proportion of the total variance
of the dependent variable that may be attributed to group level characteristics. The results of the empty
model estimation are presented in Table 6.
EDU/WKP(2015)1
17
Table 6. Time keeping order analysis - empty model
Brazil Chile Mexico
Fixed effect Coefficient S.E. Coefficient S.E. Coefficient S.E.
Intercept 19.90 0.33 15.61 0.56 12.31 0.32
Random part Variance component
S.E. Variance component
S.E.
Level-two (school) variance
24.35 2.95 26.47 6.21 6.94 1.99
Level-one (teacher) variance
189.19 8.41 114.87 10.39 91.12 6.85
Intraclass Correlation Coefficient (ICC)
0.11 0.19 0.07
Source: OECD TALIS 2013 database.
As already noted in previous analyses of TALIS 2008 data, most of the variation in teachers’ reported
use of class time lies between teachers (OECD, 2009). The ICC is 7% in Mexico, 11% in Brazil and 19%
in Chile. This means that only 7% of the variation in the proportion of time teachers report spending
keeping order in the classroom in Mexico is due to school level factors, 11% in Brazil and 19% in Chile,
while the remaining portion of the variation is due to teacher and class level factors.
Even though the between-school variance can be considered small in all three countries, in Chile it is
somewhat larger compared to Brazil and Mexico. The high socio-economic status (SES) segregation7 of
the student population in Chile, which has been receiving increasing attention in the literature, is a
plausible explanation for this difference (Elacqua, 2012; Valenzuela et al., 2013). This is not to say that
there is no such segregation in Brazil and Mexico. But according to students’ responses to the PISA 2009
questionnaire, Chile is one of the countries in which lower proportions of students attend schools with a
socio-economically diverse student intake – which mean that the majority of Chilean students attend either
advantaged or disadvantaged schools (OECD, 2010). While around 40% of Brazilian and Mexican students
are enrolled in schools with an average or diverse socio-economic intake, only about 20% of Chilean
students are enrolled in such schools.
The next step in the analysis is to add explanatory variables to the equation, in order to test the
association between those variables and the time teachers report spending keeping order in the classroom.
These variables, in general, are expected to be related to time keeping order in the classroom. Nonetheless,
when other factors are considered in the model, their association may not be statistically significant. This
would imply that this direct relationship may not exist – it may come from differences in other factors that
might be more concentrated in teachers or schools with the characteristics previously tested.
In each table, the coefficients represent the percentage points added or subtracted in terms of
proportion of class time spent keeping order for a unit change in the analysed variables, all other variables
being held constant. For example, in Table 7, the first line regression coefficients represent the additional
percentage points (in terms of proportion of time spent keeping order in a class) for teachers with more
than 10% students with behavioural problems in their class. The second line regression coefficients
represent the additional percentage points (again, in terms of proportion of time spent keeping order in a
7. The uneven distribution among schools of children with different social and economic characteristics.
EDU/WKP(2015)1
18
class) for teachers in schools where all teachers have more than 10% of their students with behavioural
problems in their classes.
Table 7. Time keeping order analysis - estimates with behavioural problems variables
Brazil Chile Mexico
Fixed effect Coefficient S.E. Coefficient S.E. Coefficient S.E.
More behavioural problems in class
7.84*** 0.56 8.00*** 0.90 4.02*** 0.49
More behavioural problems in school
6.11*** 1.33 7.85*** 1.95 2.93* 1.50
Intercept 11.07*** 0.74 7.63*** 0.89 9.10*** 0.74
Random part Variance component
S.E. Variance component
S.E.
Level-two (school) variance
16.07 2.48 9.35 3.97 5.14 1.78
Level-one (teacher) variance
176.78 7.71 102.66 8.62 87.56 6.52
Intraclass Correlation Coefficient (ICC)
0.08 0.08 0.06
Note: *** denotes 1% significance level; ** denotes 5% significance level; * denotes 10% significance level.
Source: OECD TALIS 2013 database.
As shown in Table 7, teachers who report having more than 10% of their students with behavioural
problems in their class, and teachers who are in schools where all teachers report the same, also report
spending much more class time keeping order in Brazil and in Chile than those who don’t (the comparison
group of teachers). In Mexico, these differences are smaller than in Brazil and Chile.
Results presented in Table 8 show that the association between student SES (reported by teachers) and
the time teachers report spending keeping order in the classroom is weaker than the association with
student behavioural problems. In fact, in Mexico, there is no significant relationship between these
variables. In Brazil, teachers who report having higher proportions of students from lower SES report
spending more time keeping order than their colleagues with fewer students from lower SES. In Chile,
teachers in schools where all teachers report higher proportions of students from lower SES, also report
spending more time keeping order compared to teachers in schools where fewer teachers report high levels
of socio-economic disadvantage.
EDU/WKP(2015)1
19
Table 8. Time keeping order analysis - estimates with socioeconomic variables
Brazil Chile Mexico
Fixed effect Coefficient S.E. Coefficient S.E. Coefficient S.E.
Lower SES in class 4.02*** 0.70 1.66 1.23 0.13 0.67
Lower SES in school
1.21 1.29 4.94** 1.96 -0.93 1.25
Intercept 16.71*** 0.72 11.35*** 0.99 12.81*** 0.74
Random part Variance component
S.E. Variance component
S.E.
Level-two (school) variance
21.63 2.79 21.85 5.38 6.91 1.98
Level-one (teacher) variance
186.79 8.25 114.94 10.33 91.26 6.87
Intraclass Correlation Coefficient (ICC)
0.10 0.16 0.07
Note: *** denotes 1% significance level; ** denotes 5% significance level; * denotes 10% significance level.
Source: OECD TALIS 2013 database.
One might expect that teachers in public schools spend more time keeping order than their peers in
private schools, since public schools usually concentrate students from socio-economically disadvantaged
homes and the previous regression showed some evidence to support this. But this difference was only
observed in Brazil– and it was a small difference of only three percentage points, as Table 9 shows. In
Chile, there was no difference in time keeping order among teachers from publicly to privately managed
schools, which may seem contradictory to the previously mentioned data on particularly high SES
segregation of the student population in the country. This may happen because, in Chile, the category
"privately managed schools" includes a very diverse group of schools: from the schools that are 100%
privately funded to the schools that receive most of their funding from the government. So it might be the
case that the variable on school type was unable to capture the complexity of school management in Chile.
Table 9. Time keeping order analysis - estimates with type of school management variable (public or private)
Brazil Chile Mexico
Fixed effect Coefficient S.E. Coefficient S.E. Coefficient S.E.
Publicly managed school
3.15*** 0.77 0.84 1.31 -0.66 0.75
Intercept 17.43*** 0.68 15.12*** 0.71 12.82*** 0.66
Random part Variance component
S.E. Variance component
S.E.
Level-two (school) variance
21.67 2.84 30.41 7.23 6.91 2.02
Level-one (teacher) variance
189.26 8.47 112.43 10.35 91.50 6.88
Intraclass Correlation Coefficient (ICC)
0.10 0.21 0.07
Note: *** denotes 1% significance level; ** denotes 5% significance level; * denotes 10% significance level.
Source: OECD TALIS 2013 database.
EDU/WKP(2015)1
20
Nonetheless, there are some relevant changes in the results once all the explanatory variables are
included in the model. These results are presented in Table 10.
Table 10. Time keeping order analysis - full model
Brazil Chile Mexico
Fixed effect Coefficient S.E. Coefficient S.E. Coefficient S.E.
More behavioural problems in class
7.33*** 0.68 7.73*** 1.04 3.66*** 0.48
More behavioural problems in school
5.61*** 2.07 5.74** 2.42 3.67 2.34
Lower SES in class 1.41 0.93 0.61 1.65 -1.13 0.73
Lower SES in school -1.23 2.12 0.57 2.48 -2.07 2.55
Publicly managed school 1.69 1.21 -1.01 1.42 -0.09 1.82
Years of teaching experience
-0.10** 0.04 -0.10** 0.04 -0.06** 0.03
Teacher gender (female) 1.27** 0.60 -0.28 1.01 1.49*** 0.46
Class size -0.02 0.03 -0.03 0.05 0.09 0.04
The subject of the class was included in the initial training
-0.16 0.89 -5.87*** 1.97 -1.41 0.98
The pedagogy of subjects taught was included in formal education
-1.69* 0.94 -1.39 2.14 -2.15* 1.24
The practice of subjects taught was included in formal education
0.56 1.10 0.19 1.51 -0.02 0.81
Had PD on the knowledge of the subject with large impact
0.30 0.66 1.55 1.50 -0.10 0.65
Had PD on student behaviour and classroom management with large impact
-1.11 0.86 -0.31 1.42 -0.59 0.63
Had PD on pedagogical competencies of the subject with large impact
-1.19 0.73 -1.81 1.46 -1.90*** 0.71
Professional collaboration in school index
-0.82** 0.32 -1.29*** 0.42 0.00 0.36
Participation on effective PD index
-0.41*** 0.15 0.14 0.24 -0.08 0.13
Intercept 22.32*** 3.70 27.67*** 4.39 12.61*** 4.81
Random part Variance component
S.E. Variance component
S.E.
Level-two (school) variance 13.93 2.77 13.90 14.82 8.10 4.06
Level-one (teacher) variance
165.39 9.80 87.16 10.67 72.47 5.81
Intraclass Correlation Coefficient (ICC)
0.08 0.14 0.10
Note: *** denotes 1% significance level; ** denotes 5% significance level; * denotes 10% significance level.
Source: OECD TALIS 2013 database.
EDU/WKP(2015)1
21
As Table 10 shows, behavioural problems are still highly associated with the time teachers report
spending keeping order. This is particularly true in Brazil and Chile, where teachers who report having
more than 10% of students with behavioural problems in their class, report spending around 7 percentage
points more of their time keeping order than their colleagues with fewer students with behavioural
problems in their class. The same is true for teachers in schools where all teachers report higher
percentages of students with behavioural problems in their class: these teachers report spending around 6
percentage points more of their time keeping order compared to their colleagues. Considering that the
average proportion of time spent keeping order by Brazilian and Chilean teachers is, respectively, 20% and
15% of class time, these are important differences.
At the same time, in the full model, socio-economic background and working in a publicly managed
school do not seem to be associated with the reported time keeping order in any of the countries. Rather, it
appears that the differences between teachers from public and private schools or, according to SES
presented in Tables 8 and 9, come from differences in other factors that might be more concentrated in one
of these types of schools – and not by the type of school management itself.
Teacher experience shows one of the most consistent associations with the reported time keeping
order in the classroom, though still of small magnitude. In all three countries, the more experienced a
teacher is, the less time he or she reports spending keeping order. In Brazil and Chile, for each additional
year of experience, the average time spent keeping order is reduced by 0.1 percentage point. In Mexico, it
is reduced by 0.6 percentage point. This means that, for example, in Brazil and Chile, a teacher with 30
years of experience spends 3 percentage points less time keeping order than a new teacher, while in
Mexico this difference is 1.8 percentage point.
Female teachers spend more time keeping order in the classroom than male teachers in Brazil and
Mexico. There is a difference of 1.3 percentage points in Brazil and 1.5 percentage points in Mexico.
Interestingly, there is no significant association between class size and the time spent keeping order in
the classroom, which means there is no evidence of a direct relationship between these two factors in this
analysis.
There are also some interesting results linking teacher education and time keeping order in the
classroom. In Chile, teachers who had the subject of the class taught included in their formal education,
report spending less time keeping order in the classroom. And the difference is relatively large: 5.9
percentage points, similar to the effect reported for behavioural problems in the school. In Brazil and
Mexico, teachers who had the pedagogy of the subjects taught included in their formal education, report
spending less time keeping order in the classroom – 1.7 percentage points and 2.2 percentage points less,
respectively.
There is also some evidence linking teacher professional development (PD) and time keeping order in
the classroom. In Mexico, teachers who participated in PD with a focus on pedagogical competences of the
subject they teach, and who perceived a large impact on their teaching, report spending 1.9 percentage
points less of their class time keeping order in the classroom. In Brazil, the higher the score of a teacher on
the effective PD participation index, the lower the reported time spent keeping order in the classroom. For
each unit change in the score, teachers report spending 0.4 percentage point less keeping order. Since the
scores range from 5.6 to 14.3 (around 9 units), the difference between teachers with the lowest and the
highest scores in the effective PD participation index may reach 3.7 percentage points of class time.
In Brazil and Chile, teachers who report higher levels of professional collaboration in their schools
report spending less time keeping order in the classroom. For each unit change in the score, Brazilian
teachers report spending 0.8 percentage point less and Chilean teachers report spending 1.3 percentage
EDU/WKP(2015)1
22
points less in keeping order. Since the scores range from 3.9 to 14.5 (around 10 units), the difference
between teachers with the lowest and the highest scores in the index of professional collaboration may
reach 8 percentage points in Brazil and almost 13 percentage points in Chile. These are large differences –
similar to the one related to behavioural problems in the school in Brazil and larger than this in Chile.
Since such a strong association between the levels of behavioural problems and the time teachers
spend keeping order in the classroom was found, this paper also investigates which factors are associated
with reported behavioural problems in the classroom. As mentioned previously, ordered logistic
regressions are used to address this research goal, since the dependent variable is a categorical one: the
percentage of students with behavioural problems in the target class (where 0% = 1; 1 to 10% = 2; 11 to
30% = 3; 31 to 60% = 4; and more than 60% = 5).
The results of the next regressions are presented in terms of odds ratios, to make data more
interpretable in terms of probability. Odds ratios should be interpreted in such a way that for a unit change
in the predictor variable (e.g., working in a publicly managed school), the odds ratio of the outcome
variable (e.g., category 2 = between 1 and 10% of students with behavioural problems), relative to the
previous category (e.g., category 1 = 0% students with behavioural problems), is expected to change by a
factor of the respective parameter estimate, all other variables in the model being held constant. Odds
ratios higher than 1 indicate an increase in probability while odds ratios below 1 indicate a decrease in
probability.
Table 11. Behavioural problems analysis
Brazil Chile Mexico
Odds Ratio S.E. Odds Ratio S.E. Odds Ratio S.E.
Publicly managed school 0.91 0.14 1.25 0.29 0.64 0.21
Lower SES in class 4.88*** 0.40 2.54*** 0.49 3.53*** 0.38
Lower SES in school 0.97 0.23 1.65 0.55 1.07 0.41
Years of teaching experience 0.98*** 0.00 0.96*** 0.01 0.98*** 0.00
Class size 1.01*** 0.00 1.00 0.01 1.00 0.00
School size 1.00 0.00 1.00 0.00 1.00 0.00
School located in a city or a large city
1.32*** 0.13 1.48* 0.34 1.23 0.15
Participation among stakeholders index
0.93* 0.04 0.81*** 0.05 0.88*** 0.03
Note: *** denotes 1% significance level; ** denotes 5% significance level; * denotes 10% significance level.
Source: OECD TALIS 2013 database.
As Table 11 shows, teachers who report having more than 10% of students from socio-economically
disadvantaged homes in their target class are approximately 1.5 times more likely to report being in a
higher category in terms of proportions of students with behavioural problems in the classroom in Chile,
2.5 times more in Mexico and almost 4 times more in Brazil. Since there are five categories of the
dependent variable, this means that, on average, a teacher who reports having more than 10% of students
from low SES in the class is 6 times more likely (i.e. 1.5 times higher probability for each higher category)
to have more than 60% students with behavioural problems than to have none in Chile, 10 times in Mexico
and 16 times in Brazil. But this relationship was not found at the school level. These results may either
indicate that this relationship is present only at the classroom level or that teachers' individual perceptions
of student behaviour are biased by their perception on student socio-economic background – or vice-versa.
EDU/WKP(2015)1
23
As was observed in the time keeping order analysis, working in a publicly managed school does not
seem to be associated with the proportion of students with behavioural problems in the classroom, in any
of the countries.
In all three countries, the more experienced a teacher, the less likely he or she is to report being in a
higher category in terms of proportions of students with behavioural problems in the classroom. In Brazil
and Mexico, for each additional year of experience, a teacher is 2% less likely to report being in a higher
category in terms of proportions of students with behavioural problems in the classroom. In Chile, this
decrease is 4% for each year of experience. This means that, for example, in Chile a teacher with 20 years
of experience is 3.2 times less likely to report having more than 60% of students with behavioural
problems in their classroom than to report having none, in comparison with a teacher that has just been
hired.
In Brazil, the larger the class size, the higher the odds that the teacher will report having higher
percentages of student with behavioural problems in the classroom: 1% more for each additional student in
the class. This means that, for example, a teacher with 40 students in the class is 80% more likely to report
having more than 60% of students with behavioural problems than to report having none, compared to a
teacher with 20 students in the class. This association was not found in Chile or Mexico.
In Brazil and Chile, teachers in schools located in cities or large cities (with more than 100 000
inhabitants) are 32% and 48%, respectively, more likely to report being in a higher category in terms of
proportions of students with behavioural problems in the classroom. This means that, on average, a teacher
in a school located in cities with more than 100 000 inhabitants is 1.3 times more likely to have more than
60% students with behavioural problems, than to have none compared to a teacher in a school located in
cities with less people in Brazil this figure increases to almost 2 times in Chile.
Importantly, in all three countries, teachers who report higher levels of participation among
stakeholders in their schools are less likely to be in a higher category, in terms of proportions of students
with behavioural problems in the classroom. For each unit change in the score, Brazilian teachers are 7%
less likely to report being in a higher category, in terms of proportions of students with behavioural
problems in the classroom, while Mexican teachers are 12% less likely and Chilean teachers are 19% less
likely to report the same. Since the scores range from 4.5 to 15.4 (around 11 units), this means that a
teacher who reports the lowest score on the participation among stakeholders index is 2.8 times more likely
to have more than 60% students with behavioural problems than to have none, compared to a teacher who
reports the highest score in the participation among stakeholders index in Brazil, 5.2 times more in Mexico
and 8.3 times more in Chile.
Conclusions
Figure 3 presents a framework combining the evidence obtained from both sets of analyses in this
paper. The boxes in black indicate the factors that were significantly associated with the variables of
interest in the three countries. The boxes in medium grey indicate the factors that were significantly
associated with the variables of interest in two countries. And the boxes in light grey indicate the factors
that were significantly associated with the variables of interest in one country.
EDU/WKP(2015)1
24
Figure 3. Framework of results
Source: Produced by the authors.
As previously noted, teachers’ perception of the time they spend keeping order in the classroom is
highly associated with their perception of the proportion of students with behavioural problems in their
classes. This is the case not only at the individual level, but also when the perception of the group of
teachers from the same school is taken into account – with the exception of Mexico. Therefore, to improve
the use of class time it is important to understand what is associated with student behaviour and the time
spent by teachers keeping order in the classroom.
In all three countries analysed, it was shown that teachers who work in schools with higher reported
levels of participation among stakeholders are less likely to report high proportions of students with
behavioural problems in their class. These results show that participation in school decisions, combined
with a culture of shared responsibility and mutual support, can be associated with lower incidences of
student misbehaviour. Therefore, a good starting point to improve school climate may be to create or
improve mechanisms to promote students’, parents’ and staff participation in school decisions with shared
responsibility, including decisions on school behaviour policies (Porter, 2006).
Teachers from schools located in larger cities report having more students with behavioural problems
in their classes – with the exception of Mexico. Larger cities may present more challenges in terms of
inequalities, violence and other social problems that have an effect on school climate. This evidence
suggests that schools in larger cities should receive differentiated attention when policies to improve
school climate are developed at the system level.
EDU/WKP(2015)1
25
Only in Brazil is class size is associated to student behavioural problems. In the three countries
studied, the average class size is near 30 students, which can be considered high in comparison with the
TALIS 2013 average of 24 students per class. However, the major concern should not be the average, but
the fact that some classes are much larger, with around 50 students. Initiatives to reduce the size of these
particularly large classes should be a priority, in Brazil at least in an attempt to improve the conditions for
teachers to engage students in learning.
The number of years’ experience a teacher has plays an important role in all three countries. Less
experienced teachers are more likely to report having more students with behavioural problems and to
spend more time keeping order in the classroom. Possible explanations for these results include: (1)
throughout their careers, teachers improve their ability to provide effective teaching and classroom
management; (2) more experienced teachers have priority when it comes to selecting schools and classes,
and therefore tend to choose the ones where students have good behaviour; (3) some combination of these
hypotheses. In any case, allocating more experienced teachers to classes with more challenging
disciplinary climate as well as encouraging them to mentor less experienced teachers, could help reduce
time spent keeping order in the classroom.
In Brazil and Mexico, female teachers were shown to spend more time keeping order in the classroom
than male teachers. This evidence raises questions, to be further investigated, about gender-related
differences in teaching and classroom management styles, and also in student-teacher relations.
Having the content of the subject taught – in Chile – and the pedagogy of the subjects taught – in
Brazil and Mexico – included in teachers’ formal education is negatively associated with the reported time
keeping order in the classroom. In both cases, the hypothesis is that teachers who have content knowledge
and pedagogical content knowledge are better prepared to teach in ways that engage students in learning,
thereby reducing the need to keep order in the classroom.
Due to the lack of attractiveness of teaching, it is still common to find teachers who have not
completed a teacher initial education programme, or who have not received training in the subjects taught
in Latin America. This complex problem requires solutions that involve not only improving initial teacher
education but also teaching careers and working conditions, in order to attract and maintain qualified
people to the teaching profession.
There is some evidence of an association between teacher professional development and time keeping
order in the classroom. Teachers who participated in PD focused on the pedagogy of the subjects taught in
Mexico, those who report higher levels of participation in effective forms of PD in Brazil, and those who
report higher levels of professional collaboration in their schools in Brazil and Chile report spending less
time keeping order in their classrooms. All these initiatives focused on supporting teachers to improve their
teaching skills and to engage students in learning may help to improve the classroom climate.
It should also be highlighted that student behaviour and time spent keeping order are not associated
with the type of school management. Therefore, evidence provided by this paper should support policies to
improve student engagement and classroom climate in schools from both the public and private sectors in
Latin America.
Following these data analyses, two case studies (in Ontario, Canada and in England) were conducted
in order to better understand the types of policies that may be implemented, to support teachers and schools
in improving disciplinary climate. The main purpose of these case studies is, along with the TALIS 2013
data analysis, to provide policy recommendations to educational systems in which disciplinary climate is a
major concern, such as Brazil, Chile, and Mexico as well as many other countries. These case studies will
be published as a separate OECD Working Paper at a later date.
EDU/WKP(2015)1
26
REFERENCES
Abadzi, H. (2007). Instructional time loss and local level governance. Prospects, vol. XXXVII, no. 1,
March 2007.
Benavot, A. and Gad, L. (2004). Actual instructional time in African primary schools: factors that reduce
school quality in developing countries. Prospects, vol. XXXIV, no. 3, 291-310.
Carnoy, M., Gove, A. K. and Marshall, J. H. (2009) A vantagem acadêmica de Cuba: por que seus alunos
vão melhor na escola. São Paulo: Ediouro.
Cotton, K. (1989). Educational time factors. Close up #8. Portland, OR: Northwest Regional Educational
Laboratory.
Darling-Hammond, L. and Lieberman, A. (2012). Teacher Education around the world: what can we learn
from international practices? In: Darling-Hammond, L.; Lieberman, A. (eds.), Teacher Education
around the World. Routledge: London.
Darling-Hammond, L. and McLaughlin, M. (1995). Policies that support professional development in an
era of reform. Phi Delta Kappan, 76, 8, 597-604.
Darling-Hammond, L., Wei, R., Andree, A., Richardson, N. and Orphanos, S. (2009). Professional
learning in the learning profession: A status report on teacher development in the United States and
abroad. National Staff Development Council.
Darling-Hammond, L., Wise, A. E., and Klein, S. P. (1999). A License To Teach: Raising Standards for
Teaching. San Francisco, CA: Jossey-Bass.
Davis, C., Nunes, M. and Almeida, P. (2011). Formação continuada de professores: uma análise das
modalidades e das práticas em estados e municípios brasileiros. Estudos & Pesquisas Educacionais,
n.2, p. 81-166.
De La Cruz, M., Scheuer, N., Caíno, G., Huarte, M., Baudino, V. and Ayastuy, R. (2001). El discurso en
clase de maestros de nivel primario en distintos sectores socioculturales. Estudios pedagógicos, n.
27, pp. 33-41.
Desimone, L., Porter, A., Garet, M., Yoon, K. and Birman, B. (2002). Effects of professional development
on teachers' instruction: results from a three-year longitudinal study. Educational Evaluation and
Policy Analysis, Vol. 24, No. 2, pp. 81-112.
Desimone, L. (2009). Improving impact studies of teachers’ professional development: toward better
conceptualizations and measures. Educational Researcher, 38, 3, 181-199.
Educational Assessment and Research Centre (EARC) (2003). Teacher time-on-task. Washington, DC:
World Bank.
Elacqua, G. (2012). The impact of school choice and public policy on segregation: Evidence from Chile.
International Journal of Educational Development, 32, 444-453.
EDU/WKP(2015)1
27
Espin, C., Yell, M. (2001). Critical indicators of effective teaching for preservice teachers: relationships
between teaching behaviours and ratings of effectiveness. Teacher Education and Special
Education, 17, 154-169.
Garet, M., Birman, B., Porter, A., Desimone, L. and Herman, R. (1999). Designing effective professional
development: Lessons from the Eisenhower Program [and] technical appendices. American
Institutes for Research.
Garet, M., Porter, A., Desimone, L., Birman, B. and Yoon, K. (2001). What makes professional
development effective? Results from a national sample of teachers. American Educational Research
Journal, vol. 38, n. 4, 915-945.
Gettinger, M. and Seibert, J. (2002). Best practices in increasing academic learning time. Best practices in
school psychology, IV, v. 1, p. 773-787.
González, J., Preiss, D. and San Martín, E. (2008). Evaluando el discurso docente: Desarrollo de un
modelo de Rasch a partir de la evidencia audiovisual de profesores chilenos de primer ciclo de
educación básica en el área de lenguaje. Revista Iberoamericana de Evaluación Educativa, v. 1, n. 2,
pp. 137-147.
Goodwin, A. (2012). Quality teachers, Singapore style. In: Darling-Hammond, L.; Lieberman, A. (eds.),
Teacher Education around the World. Routledge: London.
Hawley, D., Rosenholtz, S., Goodstein, H. and Hasselbring, T. (1984). Good Schools: What Research Says
about Improving Student Achievement. Peabody Journal of Education, Vol. 61, No. 4, pp. iii-vi+1-
178.
Hawley, D. and Valli, L. (1999). The essentials of effective professional development: a new consensus.
In: Darling-Hammond, L.; Sykes, G. (eds.) Teaching as the learning profession: handbook of policy
and practice. San Francisco: Jossey-Bass.
Hollowood, T., Salisbury, C., Rainforth, B. and Palombaro, M. (1995). Use of instructional time
in classrooms serving students with and without severe disabilities. Exceptional Children,
Vol. 61(3), 242-252.
Husu, J. (2003). What a difference a discipline approach makes? Constructing performing quality in
teacher-student relations. Paper presented at the Biennial Conference of the European Association
for Research on Learning and Instruction in Padua, Italy.
Jensen, B., Sandoval-Hernández, A., Knoll, S. and Gonzalez, E. (2012). The Experience of New Teachers:
Results from TALIS 2008. Paris: OECD Publishing.
Karweit, N. (1984). Time-on-task reconsidered: synthesis of research on time and learning. Educational
Leadership, May 1984, 32-35.
Karweit, N. and Slavin, R. (1981). Measurement and modeling choices in studies of time and learning.
American Educational Research Journal, vol. 18, n. 2, 157-171.
Lieberman, A. (1995). Practices that Support Teacher Development: Transforming Conceptions of
Professional Learning. Innovating and Evaluating Science Education: NSF Evaluation Forums,
1992-94, p. 67-78.
EDU/WKP(2015)1
28
Martinic, S. and Vergara, C. (2007). Gestión del tiempo e interacción del profesor-alumno en la sala de
clases de establecimientos con jornada escolar completa en Chile. Revista Electrónica
Iberoamericana sobre Calidad, Eficacia y Cambio en Educación, vol. 5, No. 5e., pp. 3-20.
Martinic, S., Vergara, C. and Huepe, D. (2013). Uso del tiempo e interacciones en la sala de clases. Un
estudio de caso en Chile. Pro-Posições, v. 24, n. 1 (70), 123-135.
McCormack, A. (1997). Classroom management problems, strategies, and influences in physical
education. European Physical Review, 3(2), 102-115.
OECD (2014a) TALIS 2013 Results: An International Perspective on Teaching and Learning.
Paris: OECD Publishing.
OECD (2014b) TALIS 2013 Technical Report. Paris: OECD Publishing.
OECD (2010) PISA 2009 Results: Overcoming Social Background – Equity in Learning
Opportunities and Outcomes (Volume II). Paris: OECD Publishing.
OECD (2009) Creating effective teaching and learning environments: first results from TALIS.
Paris: OECD Publishing.
Oliver, R., Wehby, J. and Reschly, D. (2011). Teacher classroom management practices: effects
on disruptive or aggressive student behaviour. Campbell Systematic Reviews 2011.4.
Porter, L. (2006). Behaviour in schools: theory and practice for teachers. Maidenhead: Open
University Press.
Preiss, D. (2009). The Chilean instructional pattern for the teaching of language: A video-survey
study based on a national program of assessment of teaching. Learning and Individual
Differences, 19, 1-11.
Ratcliff, N., Jones, C., Costner, R., Savage-Davis, E., Sheehan, H. and Hunt, G. (2010). Teacher
Classroom Management Behaviours and Student Time-on-Task: Implications for Teacher
Education. Action in Teacher Education, 32:4, p. 38-51.
Raudenbush, S. and Bryk, A. (2002). Hierarchical linear models: applications and data analysis
methods. Thousand Oaks, CA: SAGE Publications.
Sahlbergh, P. (2012). The most wanted: Teachers and teacher education in Finland. In: Darling-Hammond,
L.; Lieberman, A. (eds.), Teacher Education around the World. Routledge: London.
Scheerens, J., Hendricks, M. (2014). State of Art of Time Effectiveness. In: Scheerens, J. (ed.)
Effectiveness of Time Investments in Education: Insights from a Review and Meta-Analysis.
Springer International Publishing.
Shulman, L. (1987). Knowledge and Teaching. Foundations of the New Reform. Harvard
Educational Review, Vol. 57, Nº1.
EDU/WKP(2015)1
29
Smith, B. (1998). It’s about time: Opportunities to learn in Chicago’s Elementary Schools.
Consortium on Chicago School Research.
Snijders, T. and Bosker, R. (1999). Multilevel Analysis: An Introduction to Basic and Advanced
Multilevel Modeling. Thousand Oaks, CA: SAGE Publications.
Supovitz, J., Mayer, D. and Kahle, J. (2000). Promoting inquiry-based instructional practice: the
longitudinal impact of professional development in the context of systemic reform.
Educational Policy, vol. 14, n. 3, 331-356.
Supovitz, J, Turner, H. (2000). The effects of professional development on science teaching
practices and classroom culture. Journal of Research in Science Teaching, v. 37, n. 9, 963-
980.
Tartuce, G., Nunes, M. and Almeida, P. (2010). Alunos do ensino médio e a atratividade da
carreira docente no Brasil. Cadernos de Pesquisa, v. 40, n. 140, p. 445-477.
Valenzuela, J., Bellei, C. and Ríos, D. (2014). Socioeconomic segregation in a market-oriented
school system: The case of Chile. Journal of Education Policy, 29(2), 217-241.