Atmos. Chem. Phys., 5, 2881–2900, 2005www.atmos-chem-phys.org/acp/5/2881/SRef-ID: 1680-7324/acp/2005-5-2881European Geosciences Union
AtmosphericChemistry
and Physics
Intercomparison of four different in-situ techniques for ambientformaldehyde measurements in urban air
C. Hak1, I. Pundt1, S. Trick1,*, C. Kern1, U. Platt1, J. Dommen2, C. Ordonez2, A. S. H. Prevot2, W. Junkermann3,C. Astorga-Llor ens4, B. R. Larsen4, J. Mellqvist5, A. Strandberg5, Y. Yu5, B. Galle5, J. Kleffmann6, J. C. Lorzer6,G. O. Braathen7, and R. Volkamer8
1Institute of Environmental Physics (IUP), University of Heidelberg, Germany2Laboratory of Atmospheric Chemistry, Paul Scherrer Institut (PSI), Villigen, Switzerland3Research Centre Karlsruhe, Institute for Meteorology and Climate Research – IFU, Garmisch-Partenkirchen, Germany4Institute for Environment and Sustainability, European Commission Joint Research Centre (JRC), Ispra, Italy5Department of Radio and Space, Chalmers Univ. of Technology (CTH), Goteborg, Sweden6Physikalische Chemie/FB C, Bergische Universitat Wuppertal (BUW), Germany7Norwegian Institute for Air Research, Kjeller, Norway8Dept. of Earth, Atmospheric, and Planetary Sciences, Massachusetts Institute of Technology, Cambridge, USA* now at: Department of Atmospheric and Oceanic Sciences, University of California, Los Angeles, USA
Received: 23 February 2005 – Published in Atmos. Chem. Phys. Discuss.: 9 May 2005Revised: 5 August 2005 – Accepted: 19 October 2005 – Published: 2 November 2005
Abstract. Results from an intercomparison of several cur-rently used in-situ techniques for the measurement of atmo-spheric formaldehyde (CH2O) are presented. The measure-ments were carried out at Bresso, an urban site in the pe-riphery of Milan (Italy) as part of the FORMAT-I field cam-paign. Eight instruments were employed by six indepen-dent research groups using four different techniques: Dif-ferential Optical Absorption Spectroscopy (DOAS), FourierTransform Infra Red (FTIR) interferometry, the fluorimetricHantzsch reaction technique (five instruments) and a chro-matographic technique employing C18-DNPH-cartridges(2,4-dinitrophenylhydrazine). White type multi-reflectionsystems were employed for the optical techniques in orderto avoid spatial CH2O gradients and ensure the sampling ofnearly the same air mass by all instruments. Between 23and 31 July 2002, up to 13 ppbv of CH2O were observed.The concentrations lay well above the detection limits of allinstruments. The formaldehyde concentrations determinedwith DOAS, FTIR and the Hantzsch instruments were foundto agree within±11%, with the exception of one Hantzschinstrument, which gave systematically higher values. Thetwo hour integrated samples by DNPH yielded up to 25%lower concentrations than the data of the continuously mea-suring instruments averaged over the same time period. The
consistency between the DOAS and the Hantzsch methodwas better than during previous intercomparisons in ambi-ent air with slopes of the regression line not significantlydiffering from one. The differences between the individualHantzsch instruments could be attributed in part to the cal-ibration standards used. Possible systematic errors of themethods are discussed.
1 Introduction
Formaldehyde (CH2O) is an important and highly reactivecompound present in all regions of the atmosphere, arisingfrom the oxidation of biogenic and anthropogenic hydrocar-bons. As an intermediate in the oxidation of hydrocarbons tocarbon monoxide (CO), formaldehyde plays a primary rolein tropospheric chemistry. Reactions of CH2O with the hy-droxyl radical OH (R1) and photolysis (R2, R3) are the mainloss processes (Lowe and Schmidt, 1983):
2882 C. Hak et al.: Intercomparison of in-situ formaldehyde measurements
Losses through dry and wet deposition may also be signif-icant. The lifetime of formaldehyde regarding the majorchemical and physical removal pathways is of the order ofa few hours in the troposphere (Possanzini et al., 2002). Typ-ical photolysis frequencies Jr and Jm as measured at localnoon (11:00 UTC, SZA=26◦) during the campaign at Bressoare given above. Since HCO reacts with O2 to form CO+HO2(R5), the rapid gas-phase destruction processes (R1–R3) leadto the production of CO. Through its second photolytic path-way (R3), CH2O serves as a major primary source of the hy-droperoxyl radical (HO2) by way of the following reactions:
H + O2 + M → HO2 + M (R4)
HCO+ O2 → HO2 + CO (R5)
In the presence of sufficient amounts of nitrogen oxides, theproduced odd hydrogen radicals (HOx) result in the forma-tion of tropospheric ozone (O3) by converting NO to NO2,thus providing OH radicals and leading to subsequent O3generation (Cantrell et al., 1990). Consequently, CH2O playsan important role in local O3 and OH photochemistry. It is akey component in our understanding of the oxidising capac-ity of the atmosphere.
Formaldehyde constitutes the most abundant carbonylcompound in both urban areas and the remote troposphere.Levels in the order of 100–500 pptv are common in cleanmarine environments (e.g. Heikes, 1992; Junkermann andStockwell, 1999). Typical concentrations in remote conti-nental locations range from a few hundred pptv to more than1 ppbv, whereas 3–45 ppbv are observed regularly in the pol-luted air of major cities (e.g. Tanner and Meng, 1984; Gros-jean, 1991). Concentrations of more than 100 ppbv can re-portedly cause irritation of the eyes, nose, and throat. Evenhigher concentrations of CH2O lead to headaches and dizzi-ness (NRC, 1980). In addition, formaldehyde is an air toxicclassified as potentially carcinogen (Lawson et al., 1990).
The main source of formaldehyde globally and in the re-mote background troposphere is its secondary formation bythe oxidation of methane (CH4) through the hydroxyl rad-ical (OH) (Lowe and Schmidt, 1983). Especially duringsummer months, the oxidation of various anthropogenic andbiogenic hydrocarbons as a result of intense sunlight con-tributes significantly to its formation (NRC, 1991) in theplanetary boundary layer over the continents. In rural ar-eas with dense vegetation, biogenic volatile organic com-pounds (B-VOCs) are often the dominant precursors. Forexample, isoprene and terpene oxidation initiated by reac-tions with either OH or O3 efficiently forms formaldehydealong with several other key atmospheric species (Duane etal., 2002; Calogirou et al., 1999). Besides secondary produc-tion, formaldehyde is also primarily emitted. In urban air, thedirect emission of CH2O by motor vehicles may contributesignificantly to atmospheric concentration levels. The releasefrom industrial processing and biomass burning also make
up important primary sources (Carlier et al., 1986). Smallamounts of formaldehyde can be emitted directly by vegeta-tion (Kesselmeier et al., 1997).
Accurate formaldehyde measurements are therefore cru-cial for our understanding of the overall tropospheric chem-istry associated with hydrocarbon oxidation, the mechanismsinvolving the cycling among odd hydrogen species (HOx)
and odd nitrogen species (NOx), and the global budgets ofOH and CO. The gained knowledge about formaldehydewill be of great value in validating and refining troposphericchemistry models as well as in validating satellite measure-ments of CH2O. The measurement of formaldehyde is alsoimportant from a public health point of view. It is thereforenecessary to obtain a better understanding of the causes ofdifferences between the various measurement techniques andto try to reduce the disagreement between them.
Several independent techniques for the detection offormaldehyde with different time resolutions and detectionlimits have become available over the last two decades. Themost common techniques currently applied for measure-ments of atmospheric formaldehyde comprise spectroscopic,chromatographic, and fluorimetric methods. In contrast tothe chromatographic and fluorimetric methods which contin-uously extract formaldehyde from the air, the spectroscopictechniques are non-destructive. Vairavamurthy et al. (1992)presented an overview of the various methods used for themeasuring of atmospheric formaldehyde until then. It shouldbe pointed out that different optical setups are in use foractive remote sensing methods (DOAS, FTIR). Results ob-tained with the long path setup are averages over a light pathof several km. For in-situ measurements, a folded light patharrangement (e.g. White system; White, 1976) was devel-oped. It combines the advantage of a long optical absorptionpath to attain adequate sensitivity with a small measurementvolume to allow for comparison with other in-situ measure-ments.
Despite its importance and the relatively large numberof different measurement techniques employed, there isstill considerable uncertainty in ambient measurements offormaldehyde. A number of direct intercomparison experi-ments have been performed, and CH2O measurements havebeen included into air chemistry related field campaignslike BERLIOZ (BERLIn OZone experiment) 1998 (Volz-Thomas et al., 2003), PIPAPO (PIanura PAdana Produzionedi Ozono) 1998 (Neftel et al., 2002), SOS (Southern Oxi-dants Study) 1995 (Lee et al., 1998). The data from thesecampaigns and intercomparisons indicate that there is stillsignificant disagreement between the individual techniques.In the following, a summary of previous formaldehyde inter-comparisons between various combinations of the techniquesapplied in the present study is given (also see Table 6).
– Kleindienst et al. (1988) compared five techniques toanalyse CH2O mixtures in zero air, photochemical mix-tures inside a smog chamber, and ambient air in a
C. Hak et al.: Intercomparison of in-situ formaldehyde measurements 2883
semi-rural area. In the zero air experiment, the averageof all the techniques was used as a reference. The val-ues obtained by the Hantzsch as well as the DNPH weresystematically higher than the overall average by 21%and 6%, respectively. For the measurements in ambientair, a comparison between the DNPH with an enzymaticCH2O monitor and a TDLAS (Tuneable Diode LaserAbsorption Spectroscopy) instrument yielded a correla-tion of r=0.91, but only 6 and 10 data points were taken,respectively. The Hantzsch was in a preliminary state ofdevelopment and therefore not included. The disagree-ment between the techniques was attributed to calibra-tion differences.
– An intercomparison performed by Lawson et al. (1990)in urban ambient air included DOAS and FTIR Whitesystems, Hantzsch, DNPH, TDLAS, and an enzymaticfluorimetric technique. The average of the spectro-scopic techniques was used as the reference. TheHantzsch technique produced values 25% lower thanthe spectroscopic average, the DNPH values were 15–20% lower. The slopes of the regression lines were0.74 and 0.75, respectively (correlationr=0.7–0.9). Themain conclusions were that good agreement was ob-served between the spectroscopic techniques and thatdifferences with the Hantzsch technique were caused bya decrease in the efficiency of the scrubber.
– A study carried out at low formaldehyde concentra-tions of below 2 ppbv is reported by Trapp and deServes (1995), who compared results from Hantzschand DNPH-cartridges technique taken in the tropics.The slope of the regression line was close to unity(b=1.02) and the coefficient of determination betweenthe two techniques wasr2=0.80 (r=0.89).
– Gilpin et al. (1997) conducted an intercomparison ex-periment with four continuous methods and two car-tridge methods. The experiment employed spiked mix-tures and ambient air. In ambient air, the Hantzsch re-sults were 36% higher than TDLAS, which was usedas a reference. Absolute gas standards were used inthis study. The differences observed between the TD-LAS and the other techniques were attributed to calibra-tion differences and collection efficiencies of the coilsand diffusion scrubbers used by some of the partici-pants. They recommended carrying out in-situ calibra-tions with gas-phase standards introduced at the instru-ments’ air inlets.
– Jimenez et al. (2000) report on measurements taken inthe Milan metropolitan area during the LOOP/PIPAPOfield experiment in May/June 1998. Results obtainedwith a commercial long path DOAS (DOAS 2000) anda DNPH-sampler were compared. For the seven days ofconcurrent measurements, the slope and intercept of the
DOAS vs. the DNPH were 0.78 and 1.96 ppbv (r=0.32).Due to a total optical path of only 425.2 m, the detectionlimit of the DOAS was high (around 3.75 ppbv). DOASresults were also compared to predictions by a 3-D Eu-lerian photochemical model.
– Cardenas et al. (2000) compared long path (LP) DOASinstruments, Hantzsch and TDLAS at a clean mar-itime site (Mace Head, Ireland) and a semi-polluted site(Weybourne, United Kingdom). They report correla-tion coefficients ofr=0.67 (r2=0.45) between an LP-DOAS and a Hantzsch at Mace Head (CH2O levels be-low 1 ppbv) after eliminating outliers, with the Hantzschmeasuring higher values (slopeb=0.62). At levels ofup to 4 ppbv measured at Weybourne, the agreementbetween two different LP-DOAS instruments and aHantzsch was improved, withr2=0.67 and 0.82, respec-tively. The Hantzsch measured higher values than bothLP-DOAS instruments (b=0.44 and 0.13). The coeffi-cient of determination for both DOAS instruments wasr2=0.50. One DOAS instrument measured significantlyhigher values than the other, with a slope of 0.36. Therewas good agreement between TDLAS and Hantzsch forindoor measurements (b=0.85,r2=0.94).
– Patz et al. (2000) measured formaldehyde with TDLASand Hantzsch during a field campaign at Schauinslandmountain. The concentrations measured by both instru-ments were very close to the theoretical concentrationof the employed reference gas. The comparison in am-bient air was carried out on a cloudy day with little pho-tochemical activity. The average difference between thetwo instruments was 0.22 ppbv at an average mixing ra-tio of 2 ppbv.
– Volkamer et al. (2002) show results of a CH2O com-parison of a Hantzsch monitor and a DOAS White cellat formaldehyde levels between 25 and 100 ppbv. Theexperiment was conducted in April 2002 in the EU-PHORE smog chamber under well controlled experi-mental conditions during a toluene oxidation experi-ment. The agreement was within 10% (slope of re-gression line = 0.89), with the Hantzsch measuring thehigher values. The standard from IFU was employedfor calibration. The DOAS calibration was based on thecross-section by Cantrell et al. (1990). The agreementin the presence of photooxidation products from tolueneoxidation indicates that cross-interferences are unlikelyto be a major error source in either technique.
– Klemp et al. (2003) report on a comparison of a com-mercial Hantzsch system and a TDLAS. The measure-ments were performed in the framework of the EVA ex-periment at a site located in the city plume of Augs-burg, Germany. Good agreement within 5% between
2884 C. Hak et al.: Intercomparison of in-situ formaldehyde measurements
both methods was observed during photochemically in-active conditions (b=1.05, r2=0.83). For heavily pol-luted events with ongoing photochemistry, the Hantzschmeasurements exceeded those of the TDLAS by a fac-tor of up to two (b=1.81,r2=0.71). Calibration errorsand negative interferences of the TDLAS were ruled outas reasons for the observed deviations. Positive interfer-ences of the Hantzsch remained among the possibilities.
– During the BERLIOZ field campaign, formaldehydewas measured by an LP-DOAS and a Hantzsch mon-itor (AL4001) at a rural site in Pabstthum, Germany(Grossmann et al., 2003). The mixing ratios measuredby the LP-DOAS were systematically larger. The re-gression analysis of the two data sets yielded a slope of1.23 on average (r2=0.66). During days with high pho-tochemical activity, however, the difference was a fac-tor of 1.7. Differences of even higher magnitude wereobserved at the BERLIOZ sites Eichstadt and Blossin(Volz-Thomas et al., 2003) during an intensive measure-ment period. The discrepancies could not be resolved.The cross-section by Meller and Moortgat (2000) wasused for the DOAS calibration.
– Measurements utilising FTIR and DOAS White sys-tems, Hantzsch and DNPH-cartridge methods were car-ried out in the EUPHORE smog chamber in Valenciaas part of the European project DIFUSO. The exper-iments were conducted at different concentration lev-els of formaldehyde, and under very different experi-mental conditions, e.g. with diesel exhaust in the darkor with mixtures of diesel exhaust and different hydro-carbons under irradiation with sunlight. For concentra-tions below 5 ppbv, i.e. close to the detection limit ofthe DOAS in EUPHORE, the DOAS method yieldedsystematically higher values than the Hantzsch mon-itor, whereas the FTIR had values comparable to theHantzsch. For concentrations between 10 ppbv and100 ppbv, the agreement between all methods was verygood (J. Kleffmann, personal communication).
In summary, during past intercomparison campaigns, thelevel of agreement varied from good to quite poor, with noobvious pattern being discernible. To effectively compare in-situ techniques with long path instruments one must keep inmind that spatial gradients of CH2O may occur. Althoughthis problem of probing different air volumes can be avoidedby using multi-reflection systems (e.g. White system), onlyone such comparison study has been published to date (Law-son et al., 1990; see above). The significant differences(±25%) were attributed to instrumental problems. The FTIRmethod was rarely used in the past for CH2O measurementsin ambient air.
Here, an intercomparison of several commonly used tech-niques for the measurement of formaldehyde is presented.The study was carried out to evaluate differences “between
the various techniques” and “among similar instruments”.Multi-pass systems were employed for the spectroscopictechniques to ensure probing of the same air volume by allinstruments. The assembly included eight instruments work-ing with four independent techniques, including two spec-troscopic techniques – Differential Optical Absorption Spec-troscopy (DOAS) (Sect. 2.1) and Fourier Transform InfraRed (FTIR) interferometry (Sect. 2.2) –, Hantzsch fluorime-try (Sect. 2.3), and DNPH cartridge sampling (Sect. 2.4).In this intercomparison, the Hantzsch technique was repre-sented by five similar Hantzsch instruments.
2 Description of participating instruments
In the following a brief description of the instruments, com-parison site and employed procedures is presented. SeeTable 1 for the detection limits, accuracy and precision ofthe individual instruments.
2.1 DOAS White system (IUP)
A modified version of the open White type multi-reflectionsystem utilising Differential Optical Absorption Spec-troscopy (DOAS) (e.g. Platt, 1994) was operated by IUP.The basic White (1976) system was improved for stabilityby using three quartz prisms that each also double the max-imum feasible lightpath of the mirror system (Ritz et al.,1993). The f/100 mirror system consisted of three spheri-cal concave mirrors of identical focal length – a field mirrorand two objective mirrors, which were located at a distanceof 15 m facing the field mirror. The total path length couldbe varied from 240 m (16 traversals) up to 2160 m (144 tra-verses) by adjusting the objective mirrors (e.g. Ritz et al.,1993). A xenon high-pressure lamp was used as light source.The optics of the White system were optimised for CH2Odetection, using a set of three dielectric mirrors, each witha reflectivity of>98% around 321±20 nm. The relative ad-justment of the two objective mirrors to the field mirror wasmaintained using a new laser adjustment system (C. Kern,personal communication). Aluminium coated mirrors wereused as transfer optics. A 30 cm Czerny-Turner spectro-graph equipped with a 1200 grooves/mm reflective gratingwas used to project the spectral interval from 303 to 366 nmonto a 1024-element diode array detector (HMT, Rauenberg)which was cooled by a Peltier element to−13◦C (disper-sion of 0.061 nm/pixel). The temperature of the spectrographwas stabilised to 35±0.1◦C in order to reduce temperaturedrifts. The integration time for individual scans varied be-tween 3–30 s, and several ten scans were typically binned toreduce photon noise. Lamp reference spectra were recordedtwice a day at the shortest path (240 m), and residual ab-sorptions over this reduced light path were characterised andsubtracted from the measured spectra. In the spectral anal-ysis procedure atmospheric spectra were corrected for dark
C. Hak et al.: Intercomparison of in-situ formaldehyde measurements 2885
Table 1. Detection limit, accuracy, precision of all the instruments for the field measurements during the intercomparison campaign as statedby the groups.a depends on present formaldehyde concentration (6% for 15 ppbv and 27% for 2 ppbv),b or 150 pptv (whatever is larger),c except IFU 3: 25–29 July.
Instrument / Type Institute Time period Det. lim. Accuracy Precision Time res.of operation [ppbv] [min]
DOAS White system IUP 24/07–19/08 0.9 ±6% 0.45 ppbv 1–2FTIR White system CTH 22/07–18/08 0.4 6–27%a 0.2 ppbv 5Hantzsch AL4021 PSI 23/07–26/07 0.15 ±15%b
±10%b∼1.5
Hantzsch AL4001 BUW 24/07–31/07 0.15 ±15%b±10%b
∼1.5Hantzsch AL4021 IFU 24/07–17/08c 0.15 ±15%b
±10%b∼1.5
DNPH JRC 23/07–18/08 0.5 ±10% 0.1 ppbv 120
current and electronic offset and divided by a lamp referencespectrum recorded the same day. The ratio spectrum washigh pass filtered by subtracting a triangular-smoothed copyof itself, thereby accounting for small changes in reflectivitynear the reflectivity drop-off of the dielectric mirrors as wellas Rayleigh and Mie scattering in the atmosphere.
Average trace gas concentrations of CH2O, NO2, O3, andHONO were retrieved by simultaneously fitting resolution-adjusted reference spectra using the combined linear-nonlinear least squares algorithm (e.g. Stutz and Platt, 1996)of the MFC software (Gomer et al., 1995). Formaldehydewas identified by its four strong absorption bands in the UVbetween 310 and 337 nm, and calibrated using the literaturecross-section by Meller and Moortgat (2000).
The stated uncertainty of the formaldehyde UV absorp-tion cross-section is±5% (Meller and Moortgat, 2000). Dif-ferences between the available CH2O cross-sections are dis-cussed in Sect. 4.4. The systematic error of the DOASspectrometer was determined to be<3% as described byStutz (1996). The total systematic error of the CH2O con-centrations, determined by the DOAS is therefore<6%. Amean detection limit of CH2O of 0.9 ppbv was determinedwith an average time resolution of 137 s.
2.2 FTIR White system (CTH)
In Fourier-Transform Infra Red (FTIR) interferometry, theabsorption of infrared light by various molecules is quanti-fied in the wavelength region between 2 and 15µm. Theopen path FTIR White system was set up by CTH and ransemi-continuously over 28 days, between 22 July and 18 Au-gust. The system consisted of an infrared spectrometer cou-pled to an open path multi-reflection cell (White cell) with abase path of 25 m and a total path length of 1 km. The Whitecell was based on the retroreflector design outlined by Ritzet al. (1993) with minor modifications. An FTIR (BOMEMMB 100) computer-controlled spectrometer with a resolutionof 1 cm−1 was employed. A 24 h dewar InSb detector wasused covering the spectral region from 1800 to 3500 cm−1.
During the field campaign, the computer, FTIR spectrom-eter and field mirror of the FTIR White system were locatedinside the shipping container which also housed the DOASsystem’s instrumentation. The objective mirrors of the FTIRWhite system were located on a tripod 25 m away from thefield mirror. The spectra were analysed using the non-linearfitting software NLM (D. Griffith, personal communication),which is a further development of the MALT code (Griffith,1996). In NLM, line parameters from the HITRAN compi-lation (Rothman, 1987) are convolved with appropriate in-strument parameters and subsequently least square fitted tothe measured spectra to derive the average concentration ofvarious molecules along the measurement path. Formalde-hyde was detected employing a characteristic doublet at 2779and 2781.5 cm−1. During most of the campaign, 64 consec-utively recorded spectra were binned, thus yielding a mea-surement time resolution of 5 min. The measurement pre-cision as obtained from the standard deviation of the CH2Omeasurements is around 0.2 ppbv. The overall accuracy, asdetermined from the uncertainty of 5% in the spectroscopicdata (Rothman et al., 1987), an offset which depends on theCH2O concentration and the precision, is specified to varyfrom 27% for a measured mixing ratio of 2 ppbv to 6% for15 ppbv.
This technique is based on sensitive wet chemical fluori-metric detection of CH2O, which requires the transfer offormaldehyde from the gas phase into the liquid phase. Thisis accomplished quantitatively by stripping the CH2O fromthe air in a stripping coil with a well defined exchange timebetween gas and liquid phase. The coil is kept at 10◦C to en-sure a quantitative sampling (>98%) of CH2O even at pres-sures as low as 600 hPa. The gas flow is controlled by amass flow controller with a precision of 1.5%, and a con-stant liquid flow is provided by a peristaltic pump. The de-tection of formaldehyde is based on the so-called “Hantzsch”reaction (Nash, 1953). It employs the fluorescence of
2886 C. Hak et al.: Intercomparison of in-situ formaldehyde measurements
3,5-diacetyl-1,4-dihydrolutidine (DDL) at 510 nm, which isproduced from the reaction of aqueous CH2O with a solutioncontaining 2,4-pentanedione (acetylacetone) and NH3 (am-monia). The excitation wavelength is 412 nm. Studies ofinterferences showed that the technique is very selective forformaldehyde, with the response for other molecules foundin typically polluted air masses being several orders of mag-nitude lower. The technique is described in detail by Kellyand Fortune (1994).
This type of instrument was operated by three groups. TheBUW used an Aero Laser CH2O analyser, model AL4001, acommercially available instrument. The PSI monitor and thethree IFU instruments were new versions of the AL4001, theAL4021, which is identical in the chemistry components, butwith slight modifications mainly concerning the temperaturestabilisation of the fluorimeter and the layout of the gas flow.All Hantzsch instruments were equipped with the same opti-cal filters. For the sake of brevity, the five instruments usedin this intercomparison will be referred to as IFU1, IFU2,IFU3, PSI, and BUW. The time resolution of the instrumentswas∼90 s with a delay time (0–90% of the final value af-ter a change in concentration) of about 4 min depending onthe flow rate settings. The systems were calibrated once perday using liquid standards, which were prepared indepen-dently by each group. Zero adjustment was performed onceper day (IFU), every six hours (PSI), and about six times perday (BUW), respectively. The Aero Laser instrument had agas-phase detection limit of 150 pptv in the field. The ac-curacy and precision are indicated as±15% or 150 pptv and±10% or 150 pptv, respectively. The ozone cross sensitiv-ity is stated to be a positive signal of 200 pptv CH2O per100 ppbv of ozone.
2.4 DNPH cartridges, HPLC/UV (JRC)
Carbonyl compounds were measured in two-hour periodsduring the day to determine their diurnal fluctuation in air.
Sampling was done according to the standard of the Eu-ropean Monitoring network, EMEP (Rembges et al., 1999).The air sample (flow 0.9–1.0 l/min) was drawn through anozone scrubber (Waters Sep-Pak KI cartridges) before pass-ing into the 2,4-dinitrophenylhydrazine (DNPH) coated C18cartridges (Waters Sep-Pak DNPH-cartridges). Airbornecarbonyls are hereby collected as their non-volatile 2,4-dinitrophenylhydrazone derivatives.
The cartridges were eluted with 2.5 ml of acetonitrile in thelaboratory, diluted with 2.5 ml of H2O and stored at 5◦C un-til analysis. The samples were analysed by HPLC-UV (highperformance liquid chromatography) with a temperature sta-bilised (20◦C) 30 cm×3.9 mm C18-coated silica gel (4µm)column (NOVO-PAK) run in the gradient mode (0.9 ml/min).Detection and quantification were carried out at 360 nm. Theemployed eluents were H2O (A-eluent) and acetonitrile (B-eluent). The gradient was programmed from 50% B to 90%
B in 42 min. The detection limit for this method was in therange of 5–20 ng formaldehyde (S/N=3).
A possible interference may be caused by the coelution ofhydrazones of target compounds with hydrazones of otheraldehydes and ketones. However, for the formaldehyde-hydrazone no interference has been reported to date. Dueto high humidity clogging the sample cartridges during thenight and early morning, the automatic sampling system wasnot used during night time and both the first and the last sam-ples were taken without ozone scrubber. Positive interferencein the form of a number of extraneous peaks in the HPLC-UVchromatograms has been reported for C18 DNPH-cartridges,when used at high atmospheric ozone concentrations withoutozone scrubber (Vairavamurthy et al., 1992). In the presentstudy, sampling without ozone scrubber was only carried outat low ozone concentrations. Thus, positive interference isunlikely. Moreover, no extraneous peaks were monitored.However, as in all kinds of chromatographic analysis, coelu-tion of unknowns with the target analytes cannot be excluded.In previous studies of ambient air from this area, we haveused the DNPH technique at low ozone concentrations with-out ozone scrubber and have been able to rule out interfer-ence from potential coelutants by analysis of the DNPH ex-tracts not only by HPLC-UV but also with HPLC coupledto atmospheric pressure mass spectrometry (Duane et al.,2002).
Blank samples were taken on a daily basis by exposingDNPH cartridges to open air without sample flow. Theformaldehyde blank levels were all below 2 nmol/cartridge.For an air volume of 120 l this leads to a detection limit of0.5 ppbv.
3 Description of the campaign
The intercomparison measurements were conducted inBresso (northern Italy) between 23 July and 31 July 2002as a part of the FORMAT-I campaign. The principal goal ofthe European project FORMAT “Formaldehyde as a tracerof photooxidation in the troposphere” was to obtain a betterknowledge of the regional distribution of formaldehyde andits temporal behaviour in interaction with other major pho-tochemical constituents. This can lead to better predictionof smog episodes and to better quantification of emissionsfrom traffic and biomass burning. The first week of the cam-paign was used to intercompare both similar instruments anddifferent in-situ techniques, before the instruments were dis-tributed to the other sites within the Po Basin for the remain-der of the campaign. Three sites, upwind, urban and down-wind of Milan, were chosen along a south to north axis deter-mined by the prevailing daytime wind direction. Bresso wasthe site representative for urban conditions. Measurementsof photooxidants at this site had already been conducted inthe LOOP/PIPAPO field experiment 1998 (e.g. Neftel et al.,2002).
C. Hak et al.: Intercomparison of in-situ formaldehyde measurements 2887
((a) b)(a) (b)
Fig. 1. (a)Surrounding area of the site at Bresso (MI), airfield and Parco Nord.(b) The setup of the instruments is shown on the right handside.
Bresso (at 45◦32.4′ N, 9◦12.1′ E, 146 m a.m.s.l.) is situ-ated on the northern outskirts of Milan, 5 km north of the citycentre, where vehicular and industrial emissions of CH2Ocan mix with photochemically produced formaldehyde fromanthropogenic and biogenic hydrocarbon emissions, so thatboth primary and secondary sources of CH2O are of impor-tance. Possible sources for biogenic hydrocarbons are nearbylocal parks.
3.1 The measurement site
The measurement site was located on the premises of a smallairfield (see Fig. 1a). The adjacent∼1.2 km2 in the west weregrass-covered. The closest sources for road traffic emissionswere a busy street 550 m to the west (Viale A. Grandi, with anadjacent residential area) and a major motorway (A4 Torino– Venezia) 1000 m to the north. The Parco Nord, a∼2.2 km2
green recreation area was located directly to the east. Severalhundred metres farther to the east, the Viale Fulvio Testi, amain road with high traffic density, leads to the city centre.There are no known emission sources for CH2O in the directsurroundings of the site, apart from two lorry events, whichare mentioned below.
The physical arrangement of the instruments is sketchedin Fig. 1b. A shipping container housed the main mirror ofthe FTIR and the spectrographs of both White systems. TheDOAS main mirror was placed in front of the container. Thelight paths of the White systems were set up approximately1.5 m above the ground with a crossing alignment. For thecomparison with the spectroscopic techniques, the samplingports of the Hantzsch monitors and the DNPH-sampler weremounted close to the intersecting pathways of both multi-reflection systems in a height of about 1.2 m above ground
and at a distance of a few metres from each other. Thus,sampling of the same air mass can be implied. The Hantzschmonitors were sampling from a 10 m common PFA inlet linewith 4 mm inner diameter, which lead to a hangar where theHantzsch instruments were operated. The sampling altitudewas 1.2 m above ground. The inlet line was protected fromapparent aerosols by a nuclepore inline filter (47 mm diame-ter, 0.5µm pore size), which was replaced once per day.
In addition to formaldehyde, ozone (up to 85 ppbv), nitro-gen dioxide (up to 40 ppbv), sulphur dioxide, nitrous acid,carbon monoxide, nitric oxide, other carbonyls and meteoro-logical parameters were measured simultaneously at the sitethroughout the campaign.
3.2 Atmospheric conditions during the intercomparison
During the first half of the intercomparison period, the syn-optic situation over Central Europe was affected by a zonalflow in the 500 hPa level. An upper-tropospheric ridge whichdeveloped after 27 July and an associated surface high pres-sure area extending over southern and central Europe gov-erned the second half of the intercomparison week, lead-ing to fair weather conditions. Its impact was supersededby a trough evolving over Ireland which introduced a low-pressure episode after 31 July. A cyclonic flow pattern devel-oped steering low pressure systems on a track passing overNorthern Italy.
Measurements of the standard meteorological parameterswere performed continuously at the intercomparison site.The temperature during the intercomparison week varied be-tween 17 and 32◦C with strong diurnal variations. The globalradiation reached 800 W/m2 every day. The conditions wereappropriate for moderate photooxidant production. Under
2888 C. Hak et al.: Intercomparison of in-situ formaldehyde measurements
these conditions, daytime ozone mixing ratios of up to85 ppbv were measured at the site. The ozone levels droppedto zero due to titration with NO from local emissions anddeposition during the night. The relative humidity reached75–100% during several nights and was typically 50–60%during the day, with an average of 62% over the completeweek. There were no rain events in the greater Milan areaduring the intercomparison week.
At night and during the early morning hours, the wind(measured at 2 m height) generally came from the north andwind speeds were low. Calm winds below 3.5 m/s withsoutherly components were observed during the day, begin-ning in the late morning thus providing air from downtownMilan. This diurnal change of air flow in the Po Basinarises from a mesoscale circulation which is orographicallyinduced by a heat low over the Alps, leading to a southernwind direction during daytime and a flow from north to southduring the night.
4 Results
4.1 Intercomparison of ambient measurements
After the campaign the final formaldehyde data of the indi-vidual groups was openly collected and compared. The tem-poral resolution of the data ranged from two to five minutesfor the optical instruments and the Hantzsch monitors (thesemethods will hence be referred to as “continuous methods”),whereas the DNPH method required two hours for each sam-ple. Due to the different measurement intervals of the var-ious instruments, each of the continuous instruments’ datasets was integrated and 30 min averages were calculated ona common time scale. When compared to the DNPH results,the data was integrated over two hours.
Figure 2 presents the formaldehyde mixing ratio time se-ries as measured (a) by the Hantzsch instruments, and (b)by the optical methods. Because large differences betweenDOAS and Hantzsch results were found (e.g. Grossmann etal., 2003), (c) shows a direct comparison between DOAS andBUW Hantzsch results. This Hantzsch monitor was operat-ing almost continuously. The time series of two-hour inte-grated values for each instrument is shown in (d), where thehorizontal bars denote the CH2O levels and the duration ofthe DNPH measurement periods.
Ambient mixing ratios between 1 and 13 ppbv (for the30 min averages) were detected by all instruments, and thetemporal variation was generally in good agreement. How-ever, the observations obtained from the IFU1 instrument aresystematically higher than those from all other instrumentsuntil 28 July. After that date, IFU1 measured considerablylower concentrations than the other instruments. On 25 and26 July, a diverging temporal behaviour of IFU2 was ob-served when compared to all other instruments (Fig. 2a). Af-ter 26 July, IFU2 levels are in good agreement with the other
Hantzsch levels. The accordance between the Hantzsch mon-itors IFU3, PSI and BUW was notably good. However, aslight offset between the results of IFU3 and PSI compared tothose of BUW is discernible. The overall agreement betweenthe DOAS measurements and the BUW Hantzsch is good(Fig. 2c). Particularly large offsets between the two meth-ods, as reported in previous comparisons (see Sect. 1), werenot detected. Occasionally occurring differences are likelydue to local inhomogeneities caused by cars or lorries. Forthe six days of DNPH measurements during the intercom-parison week, the rough temporal variation of the formalde-hyde concentration during the day was well described by thetwo-hour integrated measurements (Fig. 2d). The observedconcentration levels agree with those of most of the continu-ous instruments. The discrepancies mentioned for IFU1 andIFU2 are recognisable here as well.
During the intercomparison week the formaldehyde mix-ing ratios were comparatively low for an urban site, vary-ing between 1 and 6 ppbv most of the time. TypicalCH2O mixing ratios around 10 ppbv were reported for theLOOP/PIPAPO campaign 1998 at the same site in Bresso(e.g. Alicke et al., 2002). Five days of the present study ex-hibit a diurnal pattern with minimum values during night andhigher levels during daytime, whereas three consecutive daysfeature no pronounced diurnal variation and levels of around4 ppbv. Two events of particularly high formaldehyde con-centration occurred on 24 July and 30 July. The first eventwas caused by lorries usually stored in the hangar nearby.During this event, however, they were parked within 100 mof the measurement site with their engines running idle. Thisincident gave rise to an experiment conducted on 30 July,when the lorries were placed close to the instruments withthe diesel engines running. The rapid increase of CH2O, COand HONO within a few minutes indicates a distinct exhaust-gas plume and most probably an inhomogeneous formalde-hyde distribution within the probed air mass. Thus, the timeseries used for the intercomparison do not contain the datapoints from these two incidents. In the evening of 29 July,a change in the sampling line setup was performed. The in-lets of the Hantzsch instruments IFU1, BUW, and IFU2 weremounted at different height levels to measure possible verti-cal differences in the formaldehyde distribution. Therefore,the Hantzsch instruments were no longer sampling identicalair masses, and these data points are not included in the in-tercomparison either.
The data for the ambient measurements was comparedby pairing sets of data for all combinations of instrumentsfor which simultaneous measurements were taken. Linearregressions were calculated for each pair of instruments inorder to compare slopes, intercepts, and correlation coeffi-cients. Since both data sets in the regression are subjectto error, an ordinary least squares regression is inappropri-ate. Because only the vertical distances of the data points tothe regression line (only y direction) are minimised, the trueslope of the regression line is underestimated (Riggs et al.,
(d) DNP H, J R C DOAS White system, IUP F T IR White system, C T H Hantzsch 1, IF U Hantzsch 2, IF U Hantzsch 3, IF U Hantzsch, P S I Hantzsch, B UW
Fig. 2. (a–c)Formaldehyde time series as half hourly averages (ticks at 00:00 Central European Summer Time) at Bresso during the inter-comparison week as measured (a) by the five Hantzsch monitors, and (b) by the optical techniques FTIR and DOAS. (c) Direct comparisonof the DOAS (yellow triangles) and BUW Hantzsch monitor (blue rhombs) results. Note that the two peaks occurring on 30 July can beattributed to a local lorry emission source initiated by the experimentalists. Those points were omitted for the intercomparison.(d) Formalde-hyde measurements by the continuous instruments DOAS, FTIR and Hantzsch (as two hour averages) and DNPH (samples of two hours).The length of the horizontal lines corresponds to the duration of the DNPH measurement periods.
1978). Thus, the regressions were calculated using a methodwhich is often called orthogonal regression. This methodminimises the distance in both directions (both y and x di-rection). Individual errors of the data points are accountedfor by a weighted line fit described in Press et al. (1992).Scatter plots for almost all pairs of continuous instrumentsare shown in Fig. 3a–r. The statistical data for all combina-tions are depicted in the plots and summarised in Table 2.After a modification in the instrument on 28 July, IFU1 mea-sured lower values. The two time periods before and after
this modification are considered separately in the followingregression analysis, and the markers for the second period aredisplayed as stars in Fig. 3. After a change in the system on26 July, the agreement between IFU2 and the other instru-ments is good. Only the measurements taken after 26 Julyare considered reliable. Thus, the regression results of IFU2shown in Table 2 exclude the first two days of operation.
2890 C. Hak et al.: Intercomparison of in-situ formaldehyde measurements
10
8
6
4
2
0
Han
tzsc
h 1,
IFU
[ppb
v]
1086420Hantzsch, BUW [ppbv]
(a)
N = 142r = 0.96
y = 1.02 + 1.22 * x
2. period:r = 0.97 (N = 48)
y = 0.09 + 0.80 * x
10
8
6
4
2
0
Han
tzsc
h 1,
IFU
[ppb
v]
1086420Hantzsch, PSI [ppbv]
(b)
N = 83r = 0.93
y = 0.72 + 1.11 * x
10
8
6
4
2
0
Han
tzsc
h, P
SI [p
pbv]
1086420Hantzsch, BUW [ppbv]
(c)
N = 128r = 0.99
y = 0.45 + 1.04 * x
10
8
6
4
2
0
Han
tzsc
h 2,
IFU
[ppb
v]
1086420Hantzsch, BUW [ppbv]
(d)
all data:r = 0.75 (N = 205)y = 0.99 + 1.09 * x
r = 0.97 (N = 112)y = 0.81 + 0.95 * x
10
8
6
4
2
0
Han
tzsc
h 2,
IFU
[ppb
v]
1086420Hantzsch 1, IFU [ppbv]
(e)
N = 62r = 0.94
y = 0.64 + 0.64 * x
2.period:r = 0.99 (N = 49)
y = -0.00 + 1.33 * x
y = -1.33 + 1.20 * xr = 0.74 (N = 141)all data
10
8
6
4
2
0
Han
tzsc
h 3,
IFU
[ppb
v]
1086420Hantzsch, BUW [ppbv]
(f)
N = 155r = 0.88
y = 0.55 + 0.98 * x
10
8
6
4
2
0
Han
tzsc
h 3,
IFU
[ppb
v]
1086420Hantzsch, PSI [ppbv]
(g)
N = 55r = 0.98
y = -0.08 + 1.03 * x
10
8
6
4
2
0
Han
tzsc
h 1,
IFU
[ppb
v]
1086420Hantzsch 3, IFU [ppbv]
(h)
N = 103r = 0.85
y = 0.28 + 1.20 * x
2.period:r = 0.73 (N = 38)
y = 0.59 + 0.64 * x
10
8
6
4
2
0
Han
tzsc
h 3,
IFU
[ppb
v]
1086420Hantzsch 2, IFU [ppbv]
(i)
N = 101r = 0.78
y = -0.42 + 1.07 * x
all data:r = 0.45 (N = 151)y = -1.04 + 1.13 * x
Fig. 3. (a–r) Scatter plots for most pairs of the seven continuously measuring instruments taking part in the intercomparison. The CH2Omixing ratios are plotted versus one another for matched times of measurements, and linear regressions were calculated. The solid lines drawnthrough the data correspond to the weighted orthogonal least squares fit to the data (black) (York, 1966), and the one to one correspondenceline (grey), respectively. For the two periods of IFU1 measurements (before and after 28 July 12:00) individual regressions were calculated.Additional grey markers indicate questionable IFU2 data points before 26 July. Regression parameters for the overall data sets and subsetsare given in the plots.
4.1.1 Agreement among the Hantzsch instruments (a)–(i)
The Hantzsch instruments PSI, BUW, IFU1, and IFU3 cor-relate very well. The correlation coefficients exceed r=0.9for most combinations (Fig. 3a–g, Table 2). The highestdegree of correlation was found between the two Hantzschinstruments PSI and BUW with a correlation coefficient ofr=0.99 for the three days of simultaneous measurements.The slope of the regression line is near unity (b=1.04), butthere is a positive offset of 0.46 ppbv for PSI, significant atthe 95% level. A similar result was found for IFU3 with a
slope ofb=0.98 and an offset of 0.55 ppbv when comparedto BUW. IFU3 and PSI agree with a high degree of corre-lation (r=0.98). The linear regression reveals a slope notsignificantly different from unity and no offset. However,IFU1 measured systematically higher values for the first pe-riod, when compared to IFU3, PSI and BUW, which is ev-ident in the slopes of the regression lines: They are signif-icantly steeper than one and show non-zero intercepts. Forthe second period, IFU1 measures distinctly lower concen-trations than all other instruments. This becomes apparentby the second regression line.
C. Hak et al.: Intercomparison of in-situ formaldehyde measurements 2891
10
8
6
4
2
0
FTIR
Whi
te s
yste
m, C
TH [p
pbv]
1086420Hantzsch, BUW [ppbv]
(j)
N = 105r = 0.82
y = 0.63 + 0.90 * x
10
8
6
4
2
0
FTIR
Whi
te s
yste
m, C
TH [p
pbv]
1086420Hantzsch, PSI [ppbv]
(k)
N = 77r = 0.72
y = 0.25 + 0.88 * x
10
8
6
4
2
0
FTIR
Whi
te s
yste
m, C
TH [p
pbv]
1086420Hantzsch 1, IFU [ppbv]
(l)
2.period:r = 0.92 (N = 18)
y = -5.87 + 2.51 * x
y = -0.19 + 0.79 * xr = 0.65 (N = 73)
10
8
6
4
2
0
FTIR
Whi
te s
yste
m, C
TH [p
pbv]
1086420Hantzsch 3, IFU [ppbv]
(m)
N = 54r = 0.47
y = 0.60 + 0.77 * x
10
8
6
4
2
0
DO
AS W
hite
sys
tem
, IU
P [p
pbv]
1086420Hantzsch, BUW [ppbv]
(n)
N = 133r = 0.90
y = 0.39 + 0.96 * x
10
8
6
4
2
0
DO
AS W
hite
sys
tem
, IU
P [p
pbv]
1086420Hantzsch, PSI [ppbv]
(o)
N = 57r = 0.81
y = -0.15 + 0.92 * x
10
8
6
4
2
0
DO
AS W
hite
sys
tem
, IU
P [p
pbv]
1086420Hantzsch 1, IFU [ppbv]
(p)
2.period:r = 0.82 (N = 36)
y = 0.71 + 1.06 * x
y = -0.93 + 0.90 * xr = 0.71 (N = 79)
10
8
6
4
2
0
DO
AS W
hite
sys
tem
, IU
P [p
pbv]
1086420Hantzsch 3, IFU [ppbv]
(q)
N = 100r = 0.70
y = -0.02 + 0.98 * x
20181614121086420
DO
AS W
hite
sys
tem
, IU
P [p
pbv]
20181614121086420FTIR White system, CTH [ppbv]
(r)
r = 0.81 (N = 90)y = 0.40 + 0.92 * x
with lorry (10 min):r = 0.89 (N = 213)y = 0.10 + 1.03 * x
Fig. 3. Continued.
The correlation and regression analysis including IFU2results shows little agreement with correlation coefficientsbetween 0.45 and 0.75 if one considers the complete IFU2data set (grey markers). The data points are highly scatteredaround the regression lines (figures not shown here). Thescattering for IFU2 can partly be attributed to the divergingresults as a consequence of malfunction of the system on 25and 26 July (Fig. 2a). If one considers only the reliable IFU2data points after 26 July, there are no mutual points withPSI, but the comparison with BUW yieldsr=0.97,b=0.95,a=0.81. IFU1 and IFU2 agreed considerably better after 26July (r=0.94) than for the entire data set, but with a slopeof only b=0.64 (a=0.64), which to some degree matches thepreviously observed positive bias of IFU1.
Possible reasons for the disagreement among these fivenearly identical instruments are discussed in Sect. 4.3.
4.1.2 Agreement between spectroscopic and Hantzschtechniques (j)–(q)
The FTIR measurements compare quite well with the BUWHantzsch data, with a slope close to unity (b=0.90,a=0.63).Similarly, a regression line with no significant deviation fromthe one-to-one line was found for FTIR versus PSI. As asmaller number of data points was available, the degree ofcorrelation is somewhat lower (Fig. 3k). The correlation co-efficient between FTIR and IFU1 data for the time span un-til 28 July is lower (r=0.65). There is a significant deviationfrom the 1:1 line (b=0.79), with IFU1 showing the larger val-ues. After 28 July IFU1 measures significantly lower concen-trations than the FTIR. A good agreement was found betweenFTIR and IFU2 (values after 26 July) with a slope ofb=0.97(r=0.90), whereas the employment of the complete data set
2892 C. Hak et al.: Intercomparison of in-situ formaldehyde measurements
Table 2. Results of the orthogonal regression analysis (York,1966) between the continuous instruments (see also Fig. 3).[CH2O]y=a+b [CH2O]x, where y and x are the corresponding in-struments, and a and b are the intercept and slope of the regressionline, respectively with 95% confidence intervals.N is the numberof data points included in the regression, andr is Pearson’s corre-lation coefficient. The first column indicates the corresponding plotin Fig. 3 (for some regressions no plot is shown).
−0.22±0.71 0.97±0.15 0.90 35m) FTIR IFU 3 0.60±0.62 0.77±0.16 0.47 54n) DOAS BUW 0.39±0.27 0.96±0.08 0.90 132o) DOAS PSI −0.15±0.56 0.92±0.15 0.81 57p) DOAS IFU 1∗ −0.93±0.84 0.90±0.18 0.71 79-) DOAS IFU 2∗ −0.07±0.49 0.93±0.11 0.93 69q) DOAS IFU 3 −0.02±0.48 0.98±0.15 0.70 100r) DOAS FTIR 0.40±0.39 0.92±0.09 0.81 90
∗ Note that the regression results given for the IFU2 instrument werecalculated omitting the data of 25 and 26 July, and the regressionresults for IFU1 exclude data after 28 July, 09:15 CEST.
shows strong scattering. No coherence is recognizable be-tween FTIR and IFU3, where only 54 mutual data points areavailable. The observed concentration range is very smallhere.
A large amount of mutual data points was obtained for thepair DOAS and BUW, where a good correlation (r=0.90) isfound. The slope of the regression line is not significantlydifferent from unity (b=0.96). There was also good agree-ment between DOAS and PSI (r=0.81, b=0.92). The 1:1line is enclosed within the 95% confidence interval of theregression slope and there is no significant offset. IFU1first measured considerably higher values than the DOAS(b=0.90, a=−0.93). The result for the second period isshown by the second regression line in Fig. 3p. For values af-ter 26 July, the agreement between DOAS and IFU2 is good(r=0.93,b=0.93, no significant offset). However, includingthe complete IFU2 data set reveals less agreement. The re-gression between DOAS and IFU3 displays a slope not sig-nificantly different from unity and no significant offset.
Table 3. Linear orthogonal regressions (York, 1966) for the correla-tions between DNPH and the continuous methods (see also Fig. 4).The definition of parameters is specified in Table 2.
4.1.3 Agreement among spectroscopic techniques (r)
The FTIR measured predominantly during daylight hours,whereas the DOAS system was generally also operated atnight (Fig. 2b). Altogether, there are 90 mutual points be-tween the two White systems (30 min averages) during theintercomparison week. The correlation is moderate withr=0.81. At the 95% confidence level the regression slope(b=0.92) is not significantly different from unity.
Both instruments detect the average concentrations alongthe respective light paths. During the intensive lorry experi-ment, the lorries were located upwind of the air volume sur-veyed by both White systems. A comparison was performedusing 10 min averages, due to the temporal limitation of theexperiment to two events of 30 min each. Maximum valuesaround 19 ppbv (10 min average) were measured by both in-struments during the lorry experiment and a correlation ofr=0.89 and a slope ofb=1.03 were found, thus nearly yield-ing a one-to-one correspondence. The dashed line in Fig. 3ris the regression line to the ten minute data including the lorryexperiment (grey markers).
4.1.4 Agreement between continuous instruments andDNPH
The DNPH samples were taken every two hours during day-time. Therefore two hour averages of the continuous instru-ments were compared to the integrated results obtained fromthe cartridges. As mentioned before, the data containing thelorry plumes was omitted in the calculations. The resultsare presented in scatter plots in Fig. 4a–f. The statisticalparameters are summarised in Table 3. For all cases, theregression slopes are below unity, however for IFU2, IFU3and DOAS unity is included within the 95% confidence in-terval. The regression analysis for DNPH versus HantzschBUW and PSI revealed slopes ofb=0.76 and correlation co-efficients of aroundr=0.90. The instruments IFU1, IFU2,IFU3 attained correlation coefficients ofr=0.40, 0.59, 0.74(note the different measurement intervals; IFU2 values af-ter 26 July) with systematically higher values for IFU1 than
C. Hak et al.: Intercomparison of in-situ formaldehyde measurements 2893
10
8
6
4
2
0
DN
PH, J
RC
[ppb
v]
1086420Hantzsch, BUW [ppbv]
(a)
N = 30r = 0.90
y = 0.92 + 0.76 * x
10
8
6
4
2
0
DN
PH, J
RC
[ppb
v]
1086420Hantzsch, PSI [ppbv]
(b)
N = 26r = 0.86
y = 0.37 + 0.76 * x
10
8
6
4
2
0
DN
PH, J
RC
[ppb
v]
1086420FTIR White system, CTH [ppbv]
(c)
N = 31r = 0.66
y = 0.76 + 0.74 * x
10
8
6
4
2
0
DN
PH, J
RC
[ppb
v]
1086420Hantzsch 1, IFU [ppbv]
(d)
N = 27r = 0.40
y = 0.51 + 0.64 * x
10
8
6
4
2
0
DN
PH, J
RC
[ppb
v]
1086420Hantzsch 3, IFU [ppbv]
(e)
N = 23r = 0.74
y = 0.28 + 0.83 * x
10
8
6
4
2
0
DN
PH, J
RC
[ppb
v]
1086420DOAS White system, IUP [ppbv]
(f)
N = 23r = 0.75
y = 0.77 + 0.80 * x
Fig. 4. Regressions of the DNPH cartridge results from the intercomparison week plotted versus those from continuous techniques forconcordant two hour time spans. The solid black line drawn through the data is the orthogonal least squares fit to the data (York, 1966). Thegrey line represents the one to one correspondence.
for the DNPH. The slopes of IFU1, IFU2, IFU3 areb=0.64,0.97, 0.83. Plotting the DNPH data versus the FTIR dataalso reveals a regression slope lower than unity (b=0.74) andan intercept not significantly different from zero (correlationcoefficientr=0.66).
The mixing ratios measured by DNPH, Hantzsch, DOAS,and FTIR techniques correspond moderately well to eachother on the two hour time scale. However, short term varia-tions cannot be resolved. In summary, the DNPH results areslightly lower than those measured by the continuous instru-ments for up to 30 common data points in the concentrationrange from 1 to 8 ppbv.
4.2 Fractional differences
The agreement between measurements of the continuousinstruments and a reference instrument is summarised inhistograms of the fractional differencesδ=([CH2O]instr-[CH2O]ref)/[CH2O]ref. For the comparison among the con-tinuous instruments, the BUW Hantzsch was chosen as a ref-erence because it was almost continuously operating over theentire intercomparison period. The results are depicted inFig. 5a for the overall data sets. Figure 5b shows the resultingfractional differences for the two-hour integrated measure-ments of all instruments, using the DNPH data as reference.
The plots show the histograms of the data (shaded bars)and fitted Gaussian functions (black curve). The respectivestatistical information is given in the legend of each plot. Thefact that the average, median, and mode (i.e., the most prob-able fractional difference) of the PSI, IFU1, and IFU3 dis-tributions are similarly positioned suggests symmetry in thedistributions and therefore mostly random differences. ThePSI histogram has a narrow distribution with a standard de-viation ofσ=0.12. The DOAS, FTIR, IFU1, IFU2, and IFU3histograms showσ of 0.27, 0.27, 0.21, 0.66 and 0.18, re-spectively. The IFU2 histogram has a slightly skew distri-bution which is due to the erroneous results from 25 and 26July. After eliminating those outliers, the IFU2 histogramshows an almost symmetricalδ-distribution. In this case,the average, median, and mode are nearly collocated (aver-age=0.23, median=0.19, mode=0.21) and the standard devi-ation is decreased to 0.24. The distributions for the spectro-scopic techniques DOAS and FTIR are wider than those formost of the Hantzsch instruments. Most instruments showa positive bias with respect to the reference BUW Hantzschinstrument. The relative difference between the DOAS andthe BUW Hantzsch is +9%. On average, 3% lower val-ues were found for the FTIR than for the BUW. The PSI,IFU1, IFU2 and IFU3 values were approximately 20, 58, 21and 23% higher than the BUW results, respectively. Afterthe instrumental modification of IFU1, the results were 19%
H a n t z s c h 1 , I F Um e a n - 0 . 1 6 9 3 7 0 . 6 1 1 0 6m e d i a n - 0 . 1 8 2 7 4 0 . 5 7 8 8 6m o d e s - 0 . 1 8 5 5 2 0 . 5 7 7 4 4s t . d e v . 0 . 0 8 4 9 9 0 . 2 0 9 5 0N 5 4 1 4 2
H a n t z s c h 3 , I F Um e a n 0 . 2 2 9 8m e d i a n 0 . 2 3 4 1 2m o d e 0 . 2 3 2 5 1s t . d e v . 0 . 1 8 4 2 3N 1 5 5
D O A S , I U Pm e a n 0 . 1 2 7m e d i a n 0 . 0 9 3m o d e 0 . 0 8 7s t . d e v . 0 . 2 6 9N 1 3 9
F T I R , C T Hm e a n 0 . 0 2 6m e d i a n - 0 . 0 2 7m o d e - 0 . 0 3 3s t . d e v . 0 . 2 7 0N 1 1 2
H a n t z s c h , P S Im e a n 0 . 2 0 0m e d i a n 0 . 1 9 6 m o d e 0 . 1 9 8s t . d e v . 0 . 1 2 4N 1 2 9
H a n t z s c h 3 , I F Um e a n 0 . 2 3 0m e d i a n 0 . 2 3 4m o d e 0 . 2 3 2s t . d e v . 0 . 1 8 4N 1 5 5
H a n t z s c h 2 , I F Um e a n 0 . 5 2 4m e d i a n 0 . 3 2 5m o d e 0 . 2 3 7s t . d e v . 0 . 6 6 2N 2 1 1
H a n t z s c h 1 , I F Um e a n - 0 . 1 6 9 0 . 6 1 1m e d i a n - 0 . 1 8 3 0 . 5 7 9m o d e s - 0 . 1 8 5 0 . 5 7 7s t . d e v . 0 . 0 8 5 0 . 2 0 9N 5 4 1 4 2
Fig. 5. Fractional difference histograms for each of the formaldehyde instruments calculated relative to a reference instrument. For thecomparison of(a) the continuously measuring techniques, the reference instrument is the BUW Hantzsch monitor, in(b) the referenceinstrument is the DNPH sampler. Each panel shows the frequency for the data falling into 0.05 fractional difference bins (normalised to thenumber of coincident data pairs). The legends show the statistics for the complete data sets.
smaller than those from BUW. In order to verify the rela-tive differences between the results of the seven instruments,fractional differences were also calculated using DOAS as areference (Table 4, lower row). The previous result was con-firmed, with the Hantzsch measurements (except IFU1) be-ing within the±11% range of the DOAS. DOAS and FTIRagree within 5%. This is also consistent with the uncertaintyof the used cross-sections. The relative deviations obtainedwith the fractional differences are in line with the uncertain-ties expected from Table 2.
As the sample size is small for the fractional differencesrelative to DNPH (N=23–31, see Table 3), it was refrainedfrom fitting Gaussians to the histograms (Fig. 5b). The dis-tributions for DOAS, FTIR, PSI and IFU3 are almost sym-metrical. The histogram for IFU2 is less symmetrical be-cause of several higher fractional differences caused by theinstrumental problems during the first days. If these days areomitted, only two days of common data points are remaining.The data sets of DOAS, FTIR, PSI, IFU3, and BUW agreedwith the DNPH results within∼15%. For IFU1 and IFU2,the differences were larger. Mean and median coincide onlyin a few cases. Due to the small sample sizes of only 20–30 data points, the statistical information should be regardedcarefully in this part of the study.
4.3 Comparison of Hantzsch calibration standards
Formaldehyde solutions with a known concentration are re-quired in the calibration of the Hantzsch instruments. Thesesolutions are produced by diluting a commercially available37% CH2O-solution to a stock-solution of about 10−1 to10−2 mol/l, which is titrated regularly and is then furtherdiluted to about 10−6 mol/l for calibration (see also AeroLaser AL4001 HCHO analyser manual). Formaldehyde so-lutions with high concentrations contain a significant fractionof para-formaldehyde which interferes with the titration. Al-though the para-formaldehyde concentration is negligible indiluted solutions, a waiting time of at least 24 h between di-lution and titration is recommended to ensure the conversionof all para-formaldehyde. These diluted solutions are stableover years, with less than 0.2 percent deviation within oneyear.
The IFU 0.01 mol/l and PSI 0.05 mol/l diluted standardswere both shown to be stable within less than a percent devi-ation over several years. The field standards were taken fromthese working standards, stored in cooled boxes and furtherdiluted to concentrations of∼10−6 mol/l in the field for cal-ibration. At this level of dilution, the solution is no longerstable for more than one hour even when stored in a refriger-ator.
Relative to DOAS White cell – −5.1% +11.1% +41.3% +10.6% +7.2% −10.3%−19.2
The liquid formaldehyde standards, which were used byIFU, PSI and BUW for the calibration of their Hantzsch in-struments, were independently prepared by each group.
At the beginning of the campaign (on 24 July), the stan-dard solutions (levels about 10−6 mol/l) of the three groupswere compared using one of the IFU instruments (SN28, inthis study called ‘IFU3’). Each group prepared a solution of∼10−6 mol/l from the individual standards. The standards
by BUW and PSI agreed within 5% (PSI/BUW=1.05). How-ever, the results indicated a∼+30% deviation of the calibra-tion standards of IFU when compared to the other groups. A6% difference between the standard solutions of BUW andPSI was found on the same day using the PSI instrument(PSI/BUW=1.06).
After the first discrepancies were observed in the data, theworking standards of IFU and PSI were again analysed in
the PSI- and IFU-laboratories. The analyses again yielded a30% higher concentration for the IFU standard than for thePSI standard, although both stated to be 1.0×10⁻² molar ac-cording to the original titrations. Hence, there was a 30%difference between the titration methods used by IFU andPSI, even though both from dilution and titration they wereexpected to agree within a few percent.
Different titration methods are available and are com-monly used among the different laboratories for this concen-tration range. Unfortunately, they do not totally agree withone another. To date it was impossible to solve the apparentdifferences of up to 30%.
The difference of 30% between the IFU standard and thecalibration standards of other groups was obtained repeat-edly. It could explain the found disagreement between IFUinstruments and the BUW instrument, IFU2 and IFU3 valuesbeing 23% higher than BUW data. About 6% of the discrep-ancy between PSI and BUW can be explained by the differ-ent standards. The remaining 10–15% difference is undeter-mined. The IFU1 instrument deviates significantly from theresults of the majority of the Hantzsch instruments. A new,larger internal zero trap was installed in this instrument afterthe first week of the intercomparison following an instrumentmalfunction (flooding of the zero trap). The quality of thezero baseline is critical in this technique and the differencesof this instrument when compared to the other ones are mostprobably due to zero baseline problems.
Another process carried out differently by the three groupswas the preparation of the Hantzsch solution. The usedrecipes differ in the concentrations of the chemicals (seeoverview in Table 5), and minor differences exist in the pro-duction technique of the solution, i.e. if the solution was de-gassed, whether acetyl acetone was distilled, etc.
PSI and IFU used a modified recipe for the Hantzsch so-lution, compared to the original recipe from Kelly and For-tune (1994) used by BUW (less ammonium acetate but moreacetylacetone). Aero Laser now recommends the new recipefor concentration ranges up to 30 ppbv.
4.4 Comparison of UV absorption cross-sections
The spectroscopic methods FTIR and DOAS have an in-dependent absolute calibration, based on absorption cross-
- 0 . 1 0 - 0 . 0 5 0 . 0 0 0 . 0 5 0 . 1 00 . 5
0 . 6
0 . 7
0 . 8
0 . 9
1 . 0
1 . 1
4 . 0 x 1 0 - 2 0
4 . 5 x 1 0 - 2 0
5 . 0 x 1 0 - 2 0
5 . 5 x 1 0 - 2 0
6 . 0 x 1 0 - 2 0
6 . 5 x 1 0 - 2 0
7 . 0 x 1 0 - 2 0
7 . 5 x 1 0 - 2 0
8 . 0 x 1 0 - 2 0
B a s s , 1 9 8 0
M o o r t g a t , 1 9 8 0C a n t r e l l , 1 9 9 0
R o g e r s , 1 9 9 0
M e l l e r , 1 9 9 2B o g u m i l , 2 0 0 3
M e l l e r & M o o r t g a t , 2 0 0 0
P o p e , 2 0 0 5
Scalin
g fac
tor
S h i f t [ n m ]
Absorption cross section (314.3 nm band) [cm2]
Fig. 6. Overview on the differences in magnitude and wave-length calibration of the available highly-resolved absorption cross-sections of formaldehyde with respect to the spectrum by Mellerand Moortgat (2000).
section data of formaldehyde (and other trace gases absorb-ing in the observed spectral range) measured in the labora-tory. The absorption structure is a unique property of eachcompound. The accuracy of a DOAS measurement is influ-enced mostly by the accuracy of the used cross-section.
The DOAS method requires the knowledge of accurate ab-solute absorption cross-sections of the investigated species.A variety of high-resolution absorption cross-sections offormaldehyde in the UV spectral range are available. Since2002 the International Union of Pure and Applied Chem-istry (IUPAC) Subcommittee on Gas Kinetic Data Evalu-ation for Atmospheric Chemistry (Atkinson et al., 2002)recommends the use of the Meller and Moortgat (2000)data over the entire spectral range, yet the measured cross-sections are reported 5–10% higher than the values previ-ously recommended. However, the NASA evaluation of2003 (Sander et al., 2003), recommends the absorption cross-section by Cantrell et al. (1990), which only covers a limitedwavelength range (λ=300–375.5 nm).
Other cross-sections reported in literature were not rec-ommended due to various issues. Problems with the strongabsorption bands between 320 and 350 nm are reported forthe cross-section by Bass et al. (1980). Rogers (1990) re-portedly contains discrepancies at wavelengths shorter than280 nm (Meller and Moortgat, 2000). A very highly resolvedcross-section including two absorption bands between 313and 320 nm was recently published by Pope et al. (2005).
The seven available CH2O absorption cross-sections arecompared in the spectral range 300–360 nm, with the excep-tion of the cross-section by Pope et al. (2005), for which asmaller range was used. Since the spectra were recordedat different spectral resolutionsRi , they had to be adaptedto a common spectral resolution of 0.5 nm FWHM. Thiswas accomplished by convolution with Gaussian functions
C. Hak et al.: Intercomparison of in-situ formaldehyde measurements 2897
Table 6. Overview of previous formaldehyde intercomparisons including this study. Techniques which are also included in the present studyare marked bold.
Authors Methods Site / Project Conc. range Time span
Kleindienst et al. (1988) TDLAS semi-rural 1–10 ppbv 16/06–26/06/1986Si-Gel DNPH cartridges (North Carolina, USA)DNPH solutionHantzschEnzyme fluorimetry
Lawson et al. (1990) TDLAS urban (Los Angeles 4–20 ppbv 13/08–21/08/1986FTIR White system metropolitan area, USA)DOAS White systemC18-DNPH cartridgesHantzschEnzyme fluorimetry
Trapp and de Serves (1995)Hantzsch tropical continental <0.05–2 ppbv 10/09–23/09/1993C18-DNPH cartridges BL (Venezuela) / ASTROS
Klemp et al. (2003) Hantzsch urban (downwind of 0–4 ppbv 02/03–31/03/1998TDLAS Augsburg, Germany) / EVA
Kleffmann, pers. comm. FTIR White system smog chamber (EUPHORE, <0.1–100 ppbv May/June 2000DOAS White system Spain) / DIFUSOHantzschDNPH cartridges
this study FTIR White system urban (Milan, 1.5–13 ppbv 23/07–31/07/2002DOAS White system Italy) / FORMAT (30 min. avg.)Hantzsch (five)C18-DNPH cartridges
of FWHM Gi (G2i =(0.5 nm)2
−R2i ). For comparison of the
cross-sections a non-linear least-squares fit with five fittingparameters was employed: A quadratic polynomial (three pa-rameters) accounting for small baseline differences, a scalingcoefficient accounting for differences in the absolute mag-nitude of the cross-sections (one parameter), and a linearwavelength shift coefficient (one parameter) accounting fordifferences in the wavelength calibration. During non-linearfitting, a linear shift and a polynomial high pass filter were
employed to minimise the influence of wavelength shifts andof baseline drifts and stray light. With this method the cross-section by Meller and Moortgat (2000) was fitted to the othercross-sections. The observed differences in magnitude andwavelength shifts relative to the cross-section by Meller andMoortgat (2000) are summarised in Fig. 6.
The recommended CH2O cross-sections (Meller andMoortgat, 2000; Cantrell et al., 1990, see above) differby 11.4% in the spectral range between 300 and 360 nm.
2898 C. Hak et al.: Intercomparison of in-situ formaldehyde measurements
There is a small wavelength shift of about 0.02 nm betweenboth cross-sections. The differences in the absorption cross-sections imply a potential 11% difference in the concentra-tions determined by DOAS depending on the cross-sectionused by the particular authors. In previous comparisons, thecross-section employed in the DOAS retrieval process wasoften not specified by the authors.
5 Summary and conclusions
An intercomparison of most in-situ measurement techniquescurrently used for the detection of atmospheric formalde-hyde, including the Hantzsch technique, FTIR, DOAS, and aDNPH-sampler, is presented. Five Hantzsch instruments ofnearly identical design, operated by three laboratories, sam-pled from a common inlet line. The use of White-type multi-reflection systems for the spectroscopic DOAS and FTIRtechniques ensured probing of nearly the same air volumeby all eight instruments. The measurement conditions andequipment used during this and previous comparison studiesare summarised in Table 6.
CH2O mixing ratios varied between 1 and 13 ppbv. TheHantzsch results showed a rather large variation. Afterelimination of some apparently unreliable measurement se-quences of two instruments, the results varied within±11%among each other, except for one instrument, which system-atically gave much higher values. The agreement of the twooptical methods was within 5%, which is within the uncer-tainties of the UV and IR absorption cross-sections (both5%). Hantzsch and spectroscopic techniques agreed within15%. DNPH measurements were generally lower than thecontinuous techniques by up to 25%. Observed discrepanciesamong the Hantzsch instruments can partly be attributedto the different calibration standards used by the differentgroups. The apparent differences in the titration methodsfor the 10−2 molar standard solution could not be solved fi-nally within this project and could account for absolute dif-ferences of about 30%. The Hantzsch instruments BUW andPSI show an excellent correlation but an offset of 20% in theresults. The reason for this could not be ascertained. Such aneffect could occur when the zeroing is insufficient due to amalfunctioning formaldehyde scrubber or too short a zeroingtime. The found differences in magnitude of the comparedUV absorption cross-sections imply possible differences ofup to 11% in the concentrations determined by DOAS, de-pending on the employed cross-section.
It is usually difficult to compare DOAS or FTIR long pathmeasurements with point measurements since the probed airmasses often differ from one another. In urban areas, this ismainly caused by primary emissions on a local scale and fastsecondary formation as a consequence of the oxidation ofanthropogenically emitted VOCs. In rural areas, especiallyclose to forests, secondary formation due to the oxidationof biogenically emitted VOCs, plays an important role. The
measurement setup used during this intercomparison, sam-pling a uniform air mass by the folding of the light beamsin the White cells, was therefore most favourable to mea-sure under homogeneous conditions with the employed tech-niques.
The Hantzsch results agree generally well with the re-sults of the spectroscopic techniques. With three indepen-dent techniques (DOAS, FTIR, and Hantzsch) applying com-pletely different ways of determining the formaldehyde con-centration, results within 15% were obtained. Previously ob-served significant differences in mixing ratios obtained byHantzsch monitors and the DOAS technique (e.g. BERLIOZcampaign, see Grossmann et al., 2003) could not be observedin this study. No systematic difference between DOAS andHantzsch was found under the conditions present during thecomparison measurements. It is assumed that the improve-ment is due to the employment of multi-reflection setups inthe spectroscopic techniques which ensured that all instru-ments sampled essentially the same air volume.
Previously reported differences between DOAS andHantzsch techniques seem to be larger than the uncertaintiesin CH2O measurements as characterised in this study, andthus may have been caused by spatial (vertical) gradients ofCH2O concentrations.
Acknowledgements.The authors would like to thank the staff ofthe Italian Red Cross section at the airport in Bresso (Milano) fortheir great hospitality. This work is part of the FORMAT project,a study supported by the EU to improve scientific understandingof the role of formaldehyde in photochemistry (project FOR-MAT, http://www.nilu.no/format/, grant EVK2-CT-2001-00120).R. Volkamer is grateful for support from M. and L. Molina and aDreyfus Postdoctoral Fellowship.
Edited by: G. O. Braathen
References
Alicke, B., Stutz, J., and Platt, U.: Impact of nitrous acid pho-tolysis on the total hydroxyl radical budget during the Lim-itation of Oxidant Production/Pianura Padana Produzione diOzono study in Milan, J. Geophys. Res., 107(D22), 8196,doi:10.1029/2000JD000075, 2002.
Atkinson, R., Baulch, D. L., Cox, R. A., et al.:http://www.iupac-kinetic.ch.cam.ac.uk/datasheets/photol/P1 HCHO+hv.pdf, 2002.
Bass, A. M., Glasgow, L. C., Miller, C., Jesson, J. P., and Filkin,D. L.: Temperature dependent absorption cross sections forformaldehyde (CH2O): The effect of formaldehyde on strato-spheric chlorine chemistry, Planet. Space Sci., 28, 675–679,1980.
Bogumil, K., Orphal, J., Homann, T., Voigt, S., Spietz, P., Fleis-chmann, O. C., Vogel, A., Hartmann, M., Kromminga, H.,Bovensmann, H., Frerick, J., and Burrows, J. P.: Measurementsof molecular absorption spectra with the SCIAMACHY pre-flight model: instrument characterization and reference data for
C. Hak et al.: Intercomparison of in-situ formaldehyde measurements 2899
atmospheric remote-sensing in the 230–2380 nm region, J. Pho-tochem. Photobiol. A, 157, 167–184, 2003.
Calogirou, A., Larsen, B. R., and Kotzias, D.: Gas-phase terpeneoxidation products – a review, Atmos. Environ., 33, 1423–1439,1999.
Cantrell, C. A., Davidson, J. A., McDaniel, A. H., Shetter, R. E.,and Calvert, J. G.: Temperature-dependent formaldehyde crosssections in the near-ultraviolet spectral region, J. Phys. Chem.,94, 3902–3908, 1990.
Cardenas, L. M., Brassington, D. J., Allan, B. J., Coe, H., Alicke,B., Platt, U., Wilson, K. M., Plane, J. M., and Penkett, S. A.: In-tercomparison of formaldehyde measurements in clean and pol-luted atmospheres, J. Atmos. Chem., 37, 53–80, 2000.
Carlier, P., Hannachi, H., and Mouvier, G.: The Chemistry of Car-bonyl Compounds in the Atmosphere – a review, Atmos. Envi-ron., 20, 2079–2099, 1986.
Duane, M., Poma, B., Rembges, D., Astorga, C., and Larsen, B.R.: Isoprene and its degradation products as strong ozone precur-sors in Insubria, Northern Italy, Atmos. Environ., 36, 3867–3879,2002.
Gilpin, T., Apel, E., Fried, A., Wert, B., Calvert, J., Genfa, Z., Das-gupta, P., Harder, J. W., Heikes, B., Hopkins, B., Westberg, H.,Kleindienst, T., Lee, Y. N., Zhou, X., Lonneman, W., and Sewell,S.: Intercomparison of six ambient [CH2O] measurement tech-niques, J. Geophys. Res., 102, 21 161–21 188, 1997.
Griffith, D. W. T.: Synthetic calibration and quantitative analysis ofgas-phase infrared spectra, Appl. Spectrosc., 50, 59–70, 1996.
Grosjean, D.: Ambient Levels of Formaldehyde, Acetaldehyde, andFormic Acid in Southern California: Results of a One-Year Base-Line Study, Environ. Sci. Technol., 25, 710–715, 1991.
Grossmann, D., Moortgat, G. K., Kibler, M., Schlomski, S.,Bachmann, K., Alicke, B., Geyer, A., Platt, U., Hammer,M. U., Vogel, B., Mihelcic, D., Hofzumahaus, A., Holland,F., and Volz-Thomas, A.: Hydrogen peroxide, organic perox-ides, carbonyl compounds, and organic acids measured at Pab-stthum during BERLIOZ, J. Geophys. Res., 108(D4), 8250,doi:10.1029/2001JD001096, 2003.
Heikes, B. G.: Formaldehyde and Hydroperoxides at Mauna LoaObservatory, J. Geophys. Res., 97, 18 001–18 013, 1992.
Jimenez, R., Martilli, A., Balin, I., v. d. Bergh, H., Calpini,B., Larsen, B. R., Favaro, G., and Kita, D.: Measurement ofFormaldehyde (HCHO) by DOAS: Intercomparison to DNPHMeasurements and Interpretation from Eulerian Model Calcula-tions, Proceedings of the 93rd Annual Conference & Exhibition,Air & Waste Management Association, Paper #829, Salt LakeCity, Utah, June 18–22, 2000.
Junkermann, W. and Stockwell, W. R.: On the budget of photooxi-dants in the marine boundary layer of the tropical South Atlantic,J. Geophys. Res., 104(D7), 8039–8046, 1999.
Kelly, T. J. and Fortune, C. R.: Continuous monitoring of gaseousformaldehyde using an improved fluorescence approach, Int. J.Environ. Anal. Chem., 54, 249–263, 1994.
Kesselmeier, J., Bode, K., Hofmann, U., Muller, H., Schafer, L.,Wolf, A., Ciccioli, P., Brancaleoni, E., Cecinato, A., Frattoni, M.,Foster, P., Ferrari, C., Jacob, V., Fugit, J. L., Dutaur, L., Simon,V., and Torres, L.: Emission of short chained organic acids, alde-
hydes and monoterpenes from Quercus Ilex L. and Pinus PineaL. in relation to physiological activities, carbon budget and emis-sion algorithms, Atmos. Environ., 31, SI, 119–133, 1997.
Kleindienst, T. E., Shepson, P. B., Nero, C. M., Arnts, R. R., Tejada,S. B., Mackay, G. I., Mayne, L. K., Schiff, H. I., Lind, J. A.,Kok, G. L., Lazrus, A. L., Dasgupta, P. K., and Dong, S.: AnIntercomparison of Formaldehyde Measurement Techniques atambient Concentration, Atmos. Environ., 22, 1931–1939, 1988.
Klemp, D., Mannschreck, K., and Mittermaier, B.: Comparison oftwo different HCHO Measurement Techniques: TDLAS and acommercial Hantzsch Monitor – Results from Long term Mea-surements in a City Plume during the EVA Experiment, in: Emis-sions of Air Pollutants – Measurements, Calculations and Uncer-tainties, edited by: Friedrich, R. and Reis, S., Springer Verlag,2003.
Lawson, D. R., Biermann, H. W., Tuazon, E. C., Winer, A. M.,Mackay, G. I., Schiff, H. I., Kok, G. L., Dasgupta, P. K., andFung, K.: Formaldehyde measurement methods evaluation andambient concentrations during the Carbonaceous Species Meth-ods Comparison Study, Aerosol Sci. Technol., 12, 64–76, 1990.
Lee, Y. N., Zhou, X., Kleinman, L. I., Nunnermacker, L. J.,Springston, S. R., Daum, P. H., Newman, L., Keigley, W. G.,Holdren, M. W., Spicer, C. W., Young, V., Fu, B., Parrish, D.D., Holloway, J., Williams, J., Roberts, J. M., Ryerson, T. B.,and Fehsenfeld, F. C.: Atmospheric chemistry and distribution offormaldehyde and several multioxygenated carbonyl compoundsduring the 1995 Nashville/Middle Tennessee Ozone Study, J.Geophys. Res., 103(D17), 22 449–22 462, 1998.
Lowe, D. C. and Schmidt, U.: Formaldehyde (HCHO) Measure-ments in the Nonurban Atmosphere, J. Geophys. Res., 88(C15),10 844–10 858, 1983.
Meller, R. and Moortgat, G. K.: Temperature dependence of the ab-sorption cross sections of formaldehyde between 223 and 323 Kin the wavelength range 225–375 nm, J. Geophys. Res., 201(D6),7089–7101, 2000.
Nash, T.: The colorimetric estimation of formaldehyde by means ofthe Hantzsch reaction, Biochem. J., 55, 416–421, 1953.
National Research Council (NRC): Formaldehyde – An Assessmentof its Health Effects, National Academy of Sciences, Washing-ton, D.C., 1980.
National Research Council (NRC): Rethinking the Ozone Problemin Urban and Regional Air Pollution, National Academy Press,Washington D.C., 1991.
Neftel, A., Spirig, C., Prevot, A. S. H., Furger, M., Stutz, J., Vo-gel, B., and Hjorth, J.: Sensitivity of photooxidant production inthe Milan Basin: An overview of results from a EUROTRAC-2Limitation of Oxidant Production field experiment, J. Geophys.Res., 107(D22), 8188, doi:10.1029/2001JD001263, 2002.
Patz, H. W., Corsmeier, U., Glaser, K., Vogt, U., Kalthoff, N.,Klemp, D., Kolahgar, B., Lerner, A., Neininger, B., Schmitz, T.,Schultz, M. G., Slemr, J., and Volz-Thomas, A.: Measurementsof trace gases and photolysis frequencies during SLOPE96 anda coarse estimate of the local OH concentration from HNO3 for-mation, J. Geophys. Res., 105, 1563–1583, 2000.
Platt, U.: Air monitoring by Differential Optical Absorption Spec-troscopy (DOAS), in: Air Monitoring by Spectroscopic Tech-niques, edited by: Sigrist, M. W., Chemical Analysis Series,vol. 127, John Wiley & Sons, Inc., 1994.
2900 C. Hak et al.: Intercomparison of in-situ formaldehyde measurements
Pope, F. D., Smith, C. A., Ashfold, M. N. R., and Orr-Ewing, A.J.: High-resolution absorption cross sections of formaldehyde atwavelengths from 313 to 320 nm, Phys. Chem. Chem. Phys., 7,79–84, 2005.
Possanzini, M., Di Palo, V., and Cecinato, A.: Sources and photode-composition of formaldehyde and acetaldehyde in Rome ambientair, Atmos. Environ., 36, 3195–3201, 2002.
Press, W. H., Teukolsky, S. A., Vetterling, W. T., and Flannery, B. P.:Straight-Line Data with Errors in Both Coordinates, in: Numer-ical Recipes in C, The Art of Scientific Computing, CambridgeUniversity Press, 1992.
Rembges, D., Fantecchi, G., Dutaur, L., and Brun, C.: AIRMONAnnual Report, European Commission, EUR 19665 EN, 1999.
Riggs, D. S., Guarnieri, J. A., and Addelman, S.: Fitting straightlines when both variables are subject to error, Life Sciences, 22,1305–1360, 1978.
Ritz, D., Hausmann, M., and Platt, U.: An improved open-path mul-tireflection cell for the measurement of NO2 and NO3, in: Op-tical methods in atmospheric chemistry, edited by: Schiff, H. I.and Platt, U., SPIE Proceedings, 1715, 200–211, 1993.
Rogers, J. D.: Ultraviolet Absorption Cross Sections and Atmo-spheric Photodissociation Rate Constants of Formaldehyde, J.Phys. Chem., 94, 4011–4015, 1990.
Rothman, L. S., Gamache, R. R., Goldman, A., Brown, L. R., Toth,R. A., Pickett, H. M., Poynter, R. L., Flaud, J. M., Camy-Peyret,C., Barbe, A., Husson, N., Rinsland, C. P., and Smith, M. A. H.:The HITRAN database: 1986, Appl. Opt., 26, 4058–4097, 1987.
Sander, S. P., Kurylo, M. J., Orkin, V. L., et al.: Chemical Kineticsand Photochemical Data for Use in Atmospheric Studies, NASAPanel for Data Evaluation, JPL Publication 02-25, 2003.
Stutz, J.: Messung der Konzentration tropospharischer Spurenstoffemittels Differentieller Optischer Absorptionsspektroskopie: Eineneue Generation von Geraten und Algorithmen, PhD thesis,Univ. Heidelberg, 1996.
Stutz, J. and Platt, U.: Numerical analysis and estimation of the sta-tistical error of differential optical absorption spectroscopy mea-surements with least-squares methods, Appl. Opt., 35, 30, 6041–6053, 1996.
Tanner, R. L. and Meng, Z.: Seasonal Variations in Ambient Levelsof Formaldehyde and Acetaldehyde, Environ. Sci. Technol., 18,723–726, 1984.
Trapp, D. and de Serves, C.: Intercomparison of FormaldehydeMeasurements in the tropical Atmosphere, Atmos. Environ., 29,3239–3243, 1995.
Vairavamurthy, A., Roberts, J. M., and Newman, L.: Methods forDetermination of Low Molecular Weight Carbonyl Compoundsin the Atmosphere: A Review, Atmos. Environ., 26A, 11, 1965–1993, 1992.
Volkamer, R., Junkermann, W., Wirtz, K., and Platt, U.: Formationof Formaldehyde, Glyoxal and Methylglyoxal from the Toluene+ OH reaction in the presence of NOx, poster presented at EGSXXVII General Assembly, Nice, France, 21–26 April, 2002.
Volz-Thomas, A., Geiss, H., Hofzumahaus, A., and Becker,K. H.: Introduction to Special Section: Photochemistry Ex-periment in BERLIOZ, J. Geophys. Res., 108(D4), 8252,doi:10.1029/2001JD002029, 2003.
White, J. U.: Very Long Optical Paths in Air, J. Opt. Soc. Am., 66,411–416, 1976.
York, D.: Least-square fitting of a straight line, Can. J. Phys., 44,1079–1086, 1966.

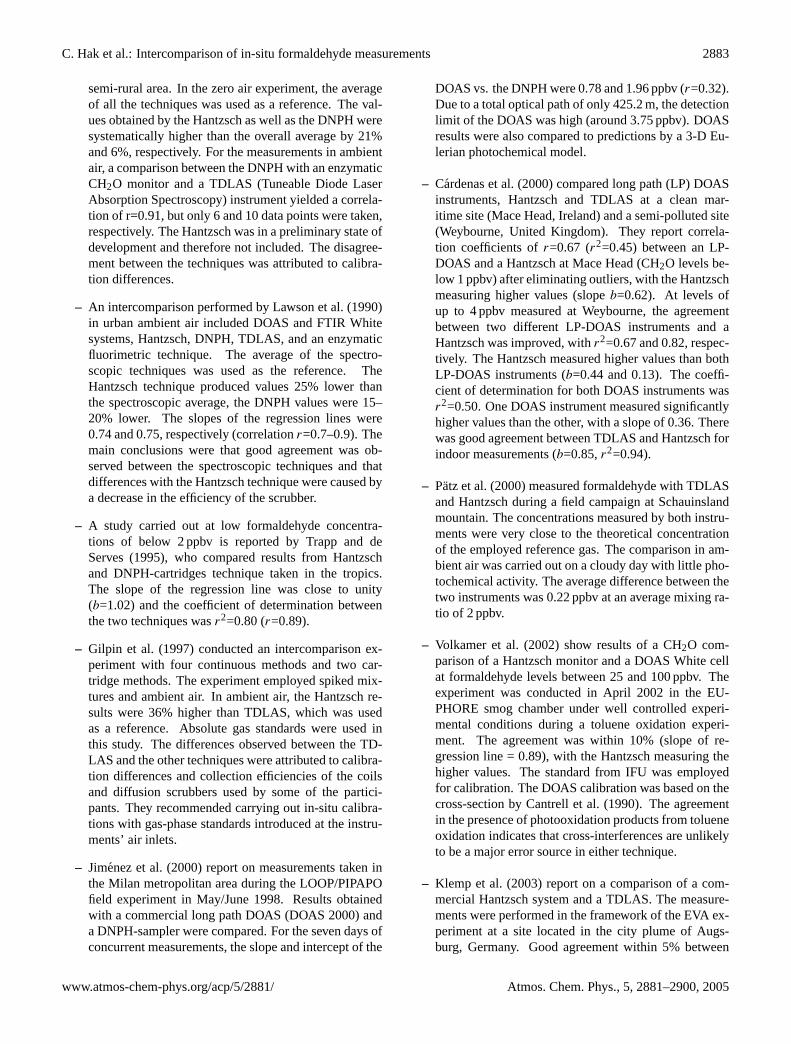


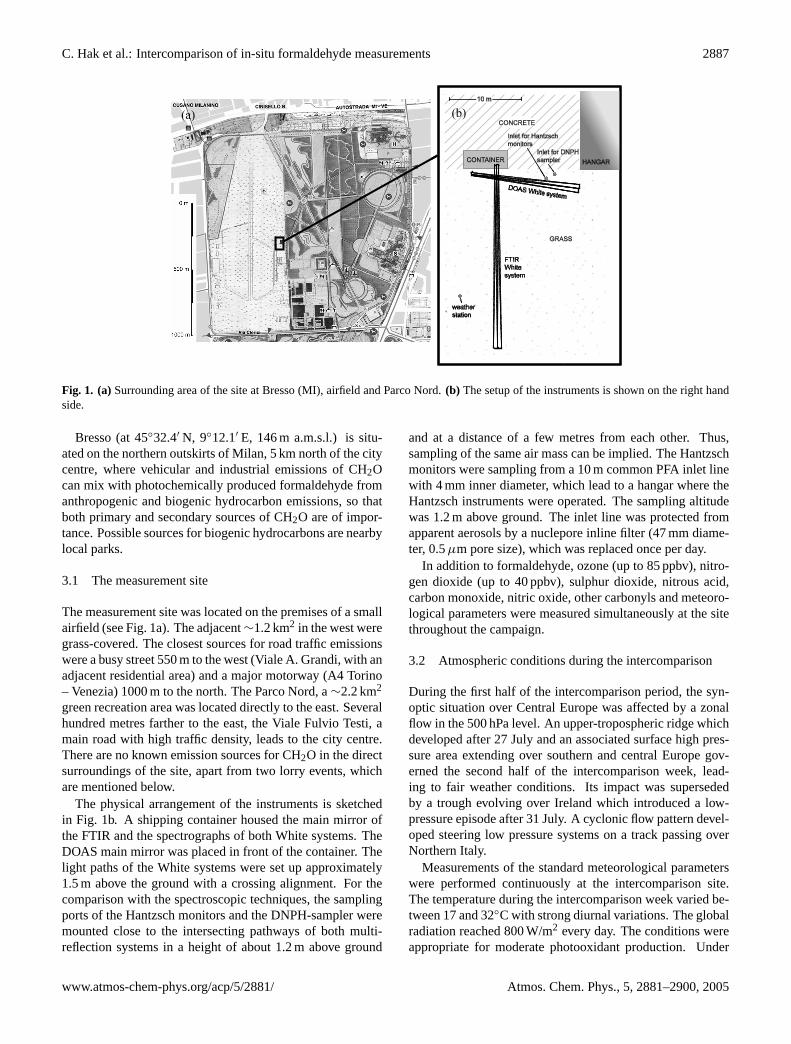


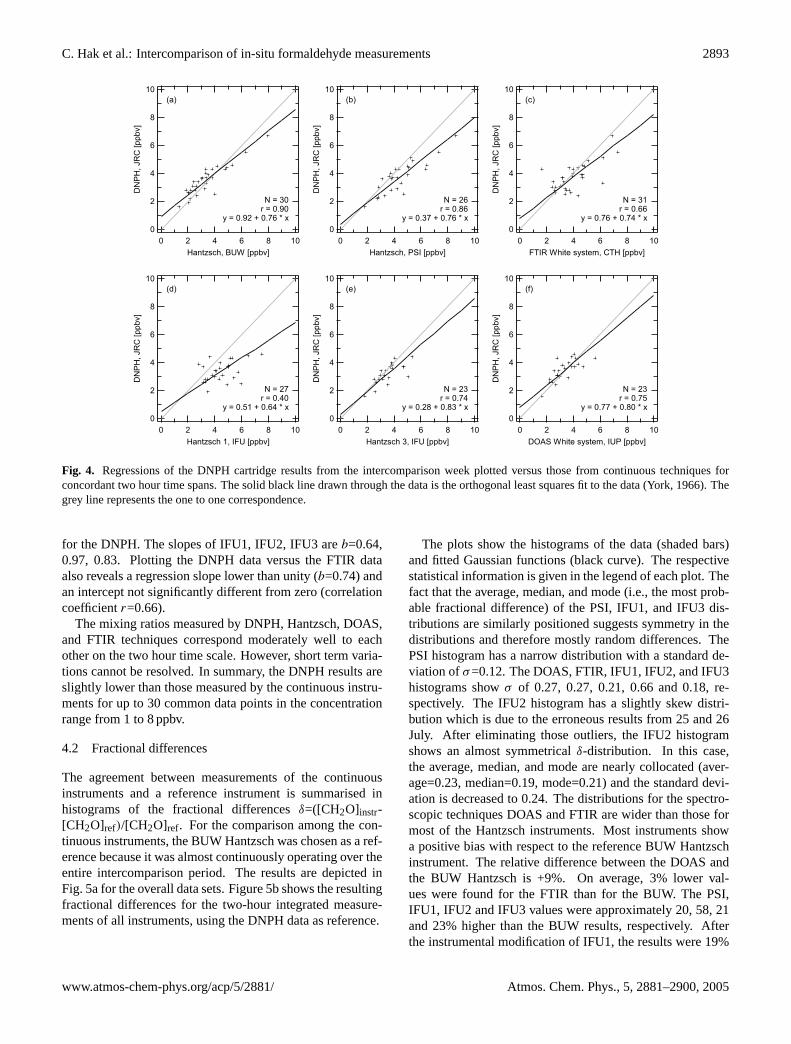


![Second EC-JRC aromatic compounds intercomparison with automatic analyzer …publications.jrc.ec.europa.eu/repository/bitstream... · 22523 EN], this intercomparison exercise follows](https://static.documents.pub/doc/80x56/612a209d98299b656d0b7fd0/second-ec-jrc-aromatic-compounds-intercomparison-with-automatic-analyzer-22523-en.jpg)


