8
· THIRD EDITION AND SUPPLEMENT TO HISTORY of RANDLEIGH FARM SECOND EDITION LOCKPORT, NEW YORK JUNE, 1940

· THIRD EDITION
AND SUPPLEMENT TO
HISTORY of
RANDLEIGH FARM
SECOND EDITION
LOCKPORT, NEW YORK
JUNE, 1940

CHAPTER XIV-C
EXPERIMENTS IN NUTRITIONAL VALUE OF MILK
THIS RESEARCH WAS DONE AT RANDLEIGH FARM DURING THE WINTER OF 1939 BY MR E. D. HILDRETH
Introduction
The question of ,quality milk has long been discussed in research, clinics, and by the farm operators. Much speculation was offered as to the relative merits of various types of milks in nutrition. A large amount of work was done to single out those factors . which are responsible for growth and maintenance of health.
The efforts of Randleigh Dairy Farm have been designated to improve the nutritional value of natural milk. With the research staff employed by Randleigh Farm, the efforts have been intensified to the problem of development of foodstuffs for high record milk and but~erfat production for several successive official test periods, ,as well as problems of reprodu,ction, arid improvement of nutrition of milk produced by these cows. The work on quality 'milk is a oontinuation of that by Scott and Erfl in which they showed that 'milk is subjected to 'wide variation in its food value as' affected by the type of food intake of the cow. Further evidence is supported by Luce\ Cary and Meigs5, and PricelO•
in 1918, Osborne and Mendel,2.3 found milk to be comparatively poor iIi antineuritic properties and they also found milk not to be a good source of water-soluble vitamins. Chick and Roscoe7 contend that the vitamin A value. of milk ' is entirely dependent upon the diet of the cow. Skurnik and Stenberg16 proved that milk and blood of cows fed on special food contained 1112-2 times as much vitamin A and carotene as those from cows fed straw. Krauss9 contends that cow milk is a relatively poor source of vitamin C. Riddell and Whitnah12
show that no significant increase in the vitamin C content of milk occurred when cows were transferred from good winter , ratiOns to pasture. Later, Whitnah and RiddelP4 explained that the "Season of the year, individuality and breea of cow, and stage of lactation appear to be most important factors causing 'variations in vitamin C content of fresh milk from well-fed cows." Sharpl3 shows that the vitamin C content of fresh milk is relatively constant throughout the year. However, Ferdinand15 demonstrates that the vitamin C content of cow's milk is lower in spring than in winter. Cultrera and BeIlinP7 proved
214

~ISTORY o F RANDLEIGH FARM
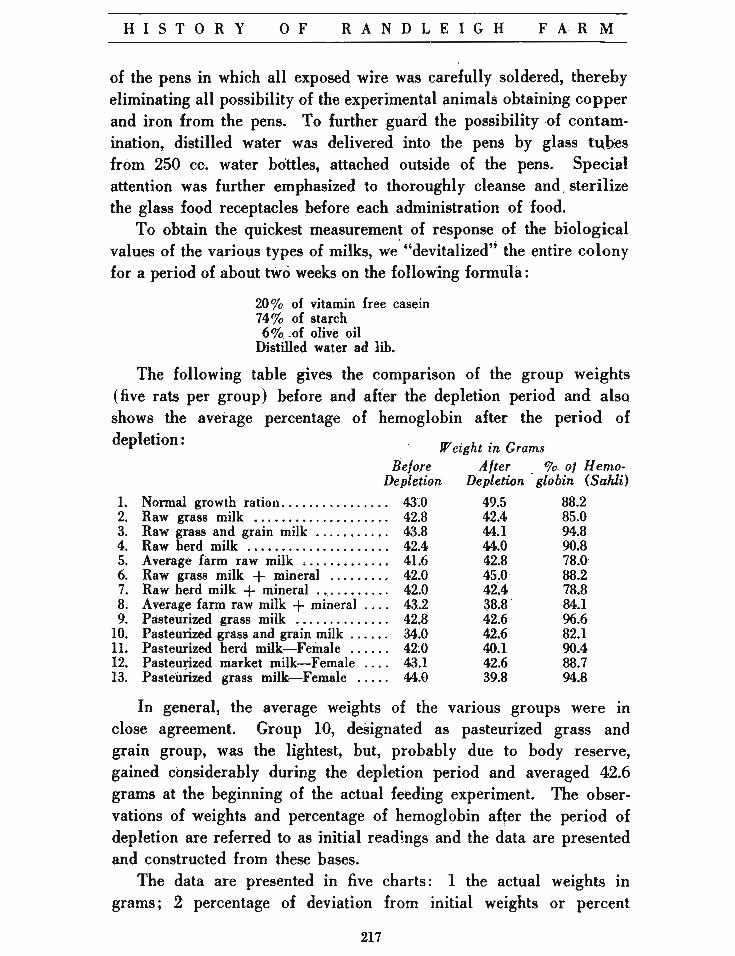
Rat fed only raw milk from cows fed dry ice grass silage and grain. Notice absence of acrodynia.
Rats fed only pasteurized milk from cows fed dry ice grass silage. Hairless areas (acrodynia) are due to a deficiency of vitamin Be.
that the ~itamin C cont~nt of cow's milk averages 25-30 mg. for one liter over the whole period of lactation, being greatest during ~arch, April, 'and May; the average daily total being 280 mg. No airect relation could be found between types of feed and vitamin C secretion. Hunt and Kraussll contend that cows fed on early pasture during its vigorous state of growth . produced a milk higher in vitamin G (&) than those fed on over-mature pasture, and that vitamin B (Bl) content of milk is much less affected by the state of pasture, but is slightly higher on fresh grass than on over-mature grass diet.
It is interesting to observe in the summary by Ladd et al.6 that the use of certified raw milk without orange juice or cod liver oil p;oduced a considerably greater g~in in body weight in babies than
215

HISTORY o F RANDLEIGH FARM
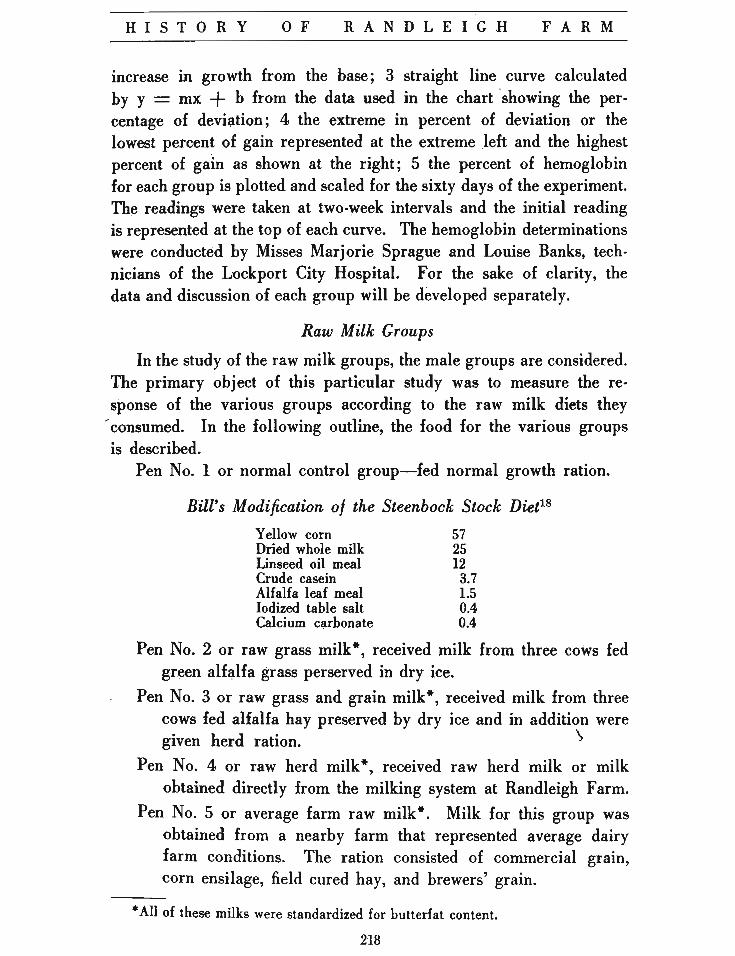
Rat fed on pasteurized milk from cows ,fed dry ice grass silage and grajn. A striking example of a deficiency of riboflavin and other co-mplex growth factors.
Rat fed mineral supplemented pasteurized milk 'from cows fed only dry ice grass silage. Condition of rat is due to a deficien~y of thiamin, riboflavin, and other
complex growth fac~ors. T~is rat lived a week after picture was taken.
did pasteurized milk alO'ne O'r in cO'mbinatiO'n with O'range juice and CO'd liv~r O'il. Certified milk prO'duced, normal dentitiO'n and prO'tected frO'm rickets. Larger use O'f certified milk in infant fe~ing is advocated. Further interest alO'ng this is substantiated by Lewis8
in which he used each type O'f milk in the diet O'f O'ver 100 infants. Certified milk prO'duced greater average gains in weight and grO'wth and mO're freedO'm frO'm rickets.
Experimental
In the selectiO'n O'f the five rats fO'r each pen, the mean average weight was emphasized to' DO't have much variatiO'n between the grO'ups of the entire cO'IO'ny .. Special attentiO'n -was given to' the cO'nstructiO'n
216
HISTORY o F RANDLEIGH FAR M
of the pens in which all exposed wire was carefully soldered, thereby eliminating all possibility of th~ experimental animals obtaining copper and iron from the pens. To further guard the possibility ·of contamination, distilled water was delivered into the pens by glass tU.bes from 250 cc. water bottles, attached outside of the pens. Special attention was further emphasized to thoroughly cleanse and . sterilize the glass food receptacles before each administration of food.
To obtain the quickest measurement of response of the biological values of the various types of milks, we ' "devitalized'; the entire colony for a period of about tWo weeks on the following formula:
200/0 of vitamin free casein 74% of starch
60/0. .of olive oil Distilled water ad lib.
The following table gives the comparison of the group weights (five rats per group) before and atter the depletion period and also shows the average percentage of hemoglobin after the period of depletion:
Weight in Grams Before After (,70. 01 H emo-
Depletion Depletion globin (Sahli)
1. Nonnal growth ration................ 43;0 49.5 88.2 2. Raw grass milk ................... . 42.8 42.4 85.0 3. Raw grass and grain milk ........... 43.8 4. Raw herd mlIk ..................... 42.4
44.1 94.8 44.0 90.8
5. Average farm raw milk ,............ 41.6 42.8 78.0-6. Raw grass milk + mineral ......... 42.0 45.0 88.2 7. Raw herd milk + mineral............ 42.0 42.4 78.8 8. Average fann raw milk + mineral .... 43.2 38.8' 84.1 9. Pasteurized grass milk .............. 42.8 42.6 96.6
10. Pasteurized grass and grain milk. .. ... 34.0 42.6 82.1 11. Pasteurized herd milk-Female ...... 42;0 40.1 90.4 12. Pasteurized market milk-Female .... 43.1 13. Pasteurized grass milk-Female ..... 44.0
42.6 88.7 39.8 94.8
. In general, the average weights of the various groups were in close agreement. Group 10, designated as pasteurized grass and grain group, was the lightest; but, probably due to body reserve, gained considerably during the depletion period and averaged 42.6 grams at the beginning of the actual feeding experiment. The observations of weights and percentage of hemoglobin after the period of depletion are referred to as initial read1.ngs and the data are presented and constructed from these bases.
The data are presented in five charts: 1 the actual weights in grams; 2 percentage of deviation from initial weights or percent
217
HISTORY o F RANDLEIGH FARM
increase in growth from the base; 3 straight line curve calculated by y == mx + b from the data used in the chart 'showing the percentage of deviation; 4 the extreme in percent of deviation or the lowest percent of gain represented at the extreme left and the highest percent of gain as shown at the ri~ht; 5 the percent of hemoglobin for each group is plotted and scaled for the sixty days of the experiment. Th~ readings were taken at two-week intervals and the initial reading is represented at the top of each curve. The hemoglohln determinations were conducted by Misses Marjorie Sprague and Louise Banks, technicians of the Lockport City Hospital. For the sake of clarity, the data and discussion of each group will be developed separately.
Raw Milk Groups
In the study of the raw milk groups, the male groups are considered. The primary object of this particular $tudy was to measure the response of the various groups according to the raw milk diets they
~ consumed. In the following outline, the food for the various groups is described.
Pen No.1 or normal control group-fed normal growth ration.
Bill's Modification 0/ the Steenbock Stock Diet18
Yellow corn 57 Dried whole milk 25 Linseed oil meal 12 Crude casein 3.7 Alfalfa leaf meal 1.5 Iodized table salt 0.4 Calcium cl,lrbonate 0.4
Pen No. 2 or raw grass milk*, received milk from three cows fed green alfalfa grass perserved in dry ice.
Pen No. 3 or raw grass and grain milk*, received milk from three cows fed alfalfa hay preserved by dry ice and in addition were given herd ration. '\
Pen No. 4 or raw herd milk*, received raw herd milk or milk obtained directly from the milking system at Randleigh Farm.
Pen No. 5 or average farm raw milk*. Milk for this group was obtained from a nearby farm that represented average dairy farm conditions. The ration consisted of commercial gram, corn ensilage, field cured hay, and brewers' grain.
• All of these milks were standardized for butterfat content.
218

HISTORY o F RANDLEIGH FAR M
There was a 1.4 gram average variation in the group weights before the depletion, and that difference was most marked between groups 1 (normal control group) and 5 (average farm raW miik). After the de'pletion and at the time the feeding experiment was begun, group 1 (normal growth ration) was the heaviest and represented a difference of 6.7 grams from group 5 (average farm raw milk); showed an
. average, of 78% hemoglobin which we considered slightly low as compared with the average of other groups. In Chait 3, the actual percent of hemoglobin is plotted and in all cases except in the normal control group, the general trend of the readings wa~ a sharp downward curve. In the raw grass group in sixty days, the hemoglobin dropped from 85% to 17%, this group showing the most severe anemias. However, the other three milk groups made a,' corresponding drop)n percent of hemoglobin and the difference, comparatively speaking, is not significant. In the case of the normal control group, the hemoglobin dropped to 40% in one month's time after the depletion. period, while on the normal dietj after thirty days, the rejuvenation was marked and the; hemoglobiri returned to 92% and by the end of the sixty-day period was 6% higher than at the beginning of the experiment. The percent of hemoglobin of the other four groups showed a very abrupt drop. The anemia of. "these groups proved to be very severe and did not show any signs ~o£- rt!juvtmation throughout the test period.
In the analysis of the weig~t charts, we find two distinct groupings. Referring to the ' Chart, ·we note that at the begiIl9.i.~g and continuing for 15~18 days of the feeding trial, the groups showed a very SImilar growth curve. From this period on to the completion of the , work, there were two distinct reactions. Groups 1 (normal growth ration), 3 (raw grass + grain milk) and 4 (raw herd milk) made parallel gains, while group 2 (raw grass milk) and 5 (average farm raw milk) showed a comparative loss. When this data is calculated in the percent of deviation from the initial weights, we still have in groups 1 (normal growth ration), 3 (raw grass + grain milk) and 4 (raw herd milk), a distinCt gain over groups 2 (niw grass milk) and 5 (average farm raw milk). When this data is calculated on a straight li,ne curve formula, y = mx + b, the trend of the group variations is clearly read. The most marked variation is shown in group 5 (average farm raw milk). In the Chart No.2, the extremes of percent of deviation are interesting. The raw grass
219

HISTORY RANDLEIGH FARM
and grain group made the outstandinggaiil in weight. The herd milk group was next, and both were superior to the normal controls. the raw grass group made the least gain and the ' average: farm milk was second lowest.
Conclusion
1. The group of rats fed on Randleigh herd milk and the grass and grain group showed superior response after the depletion period.
2. The raw grass group and the average farm herd milk group showed an inferior growth gain.
3. Severe anemia occurred in ' all groups, showing the milk to be lacking in anti-anemic factors.
220


