17


The world and the EU market for natural and synthetic graphite ..... 3
Synthetic graphite – Key markets and new developments ..... 4Electrodes ..... 5
Speciality graphite ..... 5
Refractories ..... 6
Natural graphite in Europe ..... 7
A contribution to Europe’s growth and sustainability ..... 9Resource efficiency ..... 9
Improving Health and Safety ..... 10
A contribution to Europe’s climate change and energy policies ..... 11The Role of Carbon in energy storage .... 12The Lithium-Ion Batteries .... 13Electric Vehicles .... 13Current and future trends in EVs and HEVs .... 14
Graphene: the latest innovation ..... 17
ForewordThe year 2012 was expected to still be a year of recovery and for the first half of the year that seemed to be the case. However, towards the end of the year the economic development weakened again and the last quarter was the weakest since the second quarter in 2009. In general, manufacturing and services saw again a serious contraction which of course had an impact on the metals industry and hence also on the graphite industry. This was also reflected in the employment rates in Europe continuously dropping in 9 con-secutive months.
At the same time for many industries the input costs in terms of raw materials and energy continued to rise which stretched the eco-nomic viability of many operations.
Despite all of these developments the graphite industry continues to invest into their existing instal-lations on the one hand and into research and development of new products.
The sector responds to political and societal challenges and increases its energy and resource efficiency, although the room for manoeuvre is limited having mad major efforts in the past which resulted in efficiencies in both areas. It should not be forgotten that graphite electrodes are an in-dispensable part of Europe’s steel recycling industry and that many specialty graphite applications are key to Europe’s mobility and other technical and social services.
Energy is a key cost in producing synthetic graphite and the European producers are under severe competition from other worldwide producers that do not have energy prices as high as Europe or additional costs such as the CO2 costs imposed by the ETS regulation. Competition from low labour and energy cost countries can only be met by superior quality and short delivery distances. However, high quality in graphite is mainly a result of higher energy throughput and know-how. This becomes a vicious circle.
The graphite industry welcomes the European Commission’s initiative to address raw material sup-ply questions for Europe, and is equally looking forward to a revised energy and climate change policy that will combine climate change policies with a successful economic policy enhancing the industries competitiveness for the benefit of Europe.
Dr. Bruno Toniolo, President
Table of contents

ECGA Annual Report 2012page 3 European Carbon and Graphite AssociationChapter 1
Natural & Synthetic Graphite Powder 9%
Synthetic Graphite Fibres 30%
Synthetic Graphite Specialitie 18%
Synthetic Graphite Electrode 37%
Synthetic Graphite Other 6%
The world and the EU market for natural and synthetic graphite
700
600
500
400
300
200
100
2004 2005 2006 2007 2008 2009 2010 20110
Asia Europe Northern America Other
Source: Roskill’s Natural & Synthetic Graphite: Global Industry Markets and Outlook, 8th Edition 2012
Regional demand for graphite (kt)Total Worldwide Graphite Market Estimated to be: 10.3 Billion EUR
The consumption of graphite varies considerably across the world.The total worldwide graphite market is estimated to be about 10.2 Billion EUR. It is served by natural and synthetic graphite, most of the time either of them going into dis-tinctive applications since certain applications require specific purities. In some areas both can be used or complement each other.

ECGA Annual Report 2012Chapter 2 page 4 European Carbon and Graphite Association
Synthetic graphite – Key markets and new developments
World: Estimated consumption of natural and synthetic graphite by region and end-use, 2011 (kt)
Asia Europe N.America S. America Others Total
Electrodes 355 185 130 30 10 800Refractories 375 50 30 20 10 485Lubricants 65 35 25 7 4 136Foundries 60 30 25 10 5 130Graphite shapes 50 37 21 1 1 110Batteries 71 4 4 4 2 85Friction products 21 12 8 7 2 50Recarburising 20 - - 15 - 35Others1 256 158 98 36 31 579Total 1,273 511 341 130 155 2,410
Note: 1 - Including sythetic graphite consumption in foundries, friction materials, refractories and recarburisersSource: Roskill. Natural & Synthetic Graphite: Global Industry Markets and Outlook, 8th edition 2012
Electrodes 33%
Refractories 20%
Lubricants 6%
Foundries 5%
Graphite shapes 5%
Batteries 4%
Friction products 2%
Recarburising 1%
Others 24%
Global demand for graphite, 2011
Source: Roskill’s Natural & Synthetic Graphite: Global Industry Markets and Outlook, 8th Edition 2012
ECGA Annual Report 2012Chapter 2 page 5 European Carbon and Graphite Association
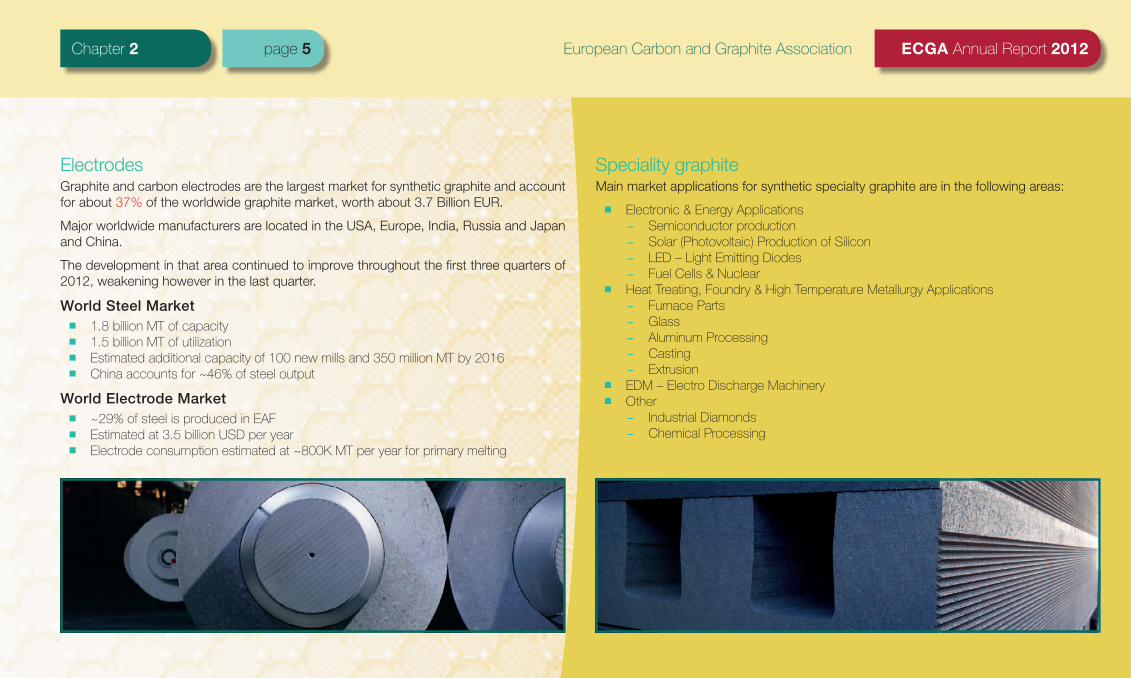
ElectrodesGraphite and carbon electrodes are the largest market for synthetic graphite and account for about 37% of the worldwide graphite market, worth about 3.7 Billion EUR.
Major worldwide manufacturers are located in the USA, Europe, India, Russia and Japan and China.
The development in that area continued to improve throughout the first three quarters of 2012, weakening however in the last quarter.
World Steel Market
▪ 1.8 billion MT of capacity
▪ 1.5 billion MT of utilization
▪ Estimated additional capacity of 100 new mills and 350 million MT by 2016
▪ China accounts for ~46% of steel output
World Electrode Market
▪ ~29% of steel is produced in EAF
▪ Estimated at 3.5 billion USD per year
▪ Electrode consumption estimated at ~800K MT per year for primary melting
Speciality graphiteMain market applications for synthetic specialty graphite are in the following areas:
▪ Electronic & Energy Applications
- Semiconductor production
- Solar (Photovoltaic) Production of Silicon
- LED – Light Emitting Diodes
- Fuel Cells & Nuclear
▪ Heat Treating, Foundry & High Temperature Metallurgy Applications
- Furnace Parts
- Glass
- Aluminum Processing
- Casting
- Extrusion
▪ EDM – Electro Discharge Machinery
▪ Other
- Industrial Diamonds
- Chemical Processing

ECGA Annual Report 2012Chapter 2 page 6 European Carbon and Graphite Association
RefractoriesThe second largest market segment is the synthetic specialty graphite which accounts for 18.0% of the worldwide graphite market, estimated to be around 1.9 Billion EUR.
Key Worldwide Manufacturers (excluding China) are located in the USA, India, Europe, Brazil, and Japan.
Global refractories production was around 42.6 Mt ($22.9 Bn) in 2011 and can grow to 59 Mt ($31 Bn) in 2015. By 2016, the graphite market for refractories could grow to 560,000 tpy. Only a small proportion of refractories contain graphite but the industry is the main consumer of natural material, particularly flake.
The Forecast for Graphite in Refractories:
▪ The opposite trends. The increase of market for oxide-carbon refractories by BRIC-countries (mainly India and Brazil), increase the consumption of natural graphite. But decreasing consumption for refractories per ton of steel in the ad-vanced economies may lead to decreases in consumption of graphite.
▪ Unshaped refractories. The increase in consumption of unshaped refractory materials also may reduce the consumption of graphite. However there may be increases in the proportion of carbon concrete.
▪ New technologies. There may emerge new types of linings and applications (e.g., GrafTech International and their technology “Freeze Lining”) that will change the type of refractories used. This may lead to a decrease or an increase in the consumption of graphite (e.g. by replacing the natural graphite to the synthetic graphite).
▪ The exotic graphite. In the future applications of the nano-graphite and other ex-otic types of graphite will increase (e.g., 3D, graphite fibre, etc.). This may signifi-cantly reduce the amount of carbon used in refractories.
▪ The graphite deposit for refractory companies. Due to the instability in raw material markets refractory companies are trying to secure themselves with raw materials (e.g., magnesite deposits of RHI, Magnezit Group, Magnesita S.A., etc.). As graphite is a basic raw material for oxide-carbon refractories, refractory players will buy or have already bought graphite deposits
ECGA Annual Report 2012Chapter 3 page 7 European Carbon and Graphite Association
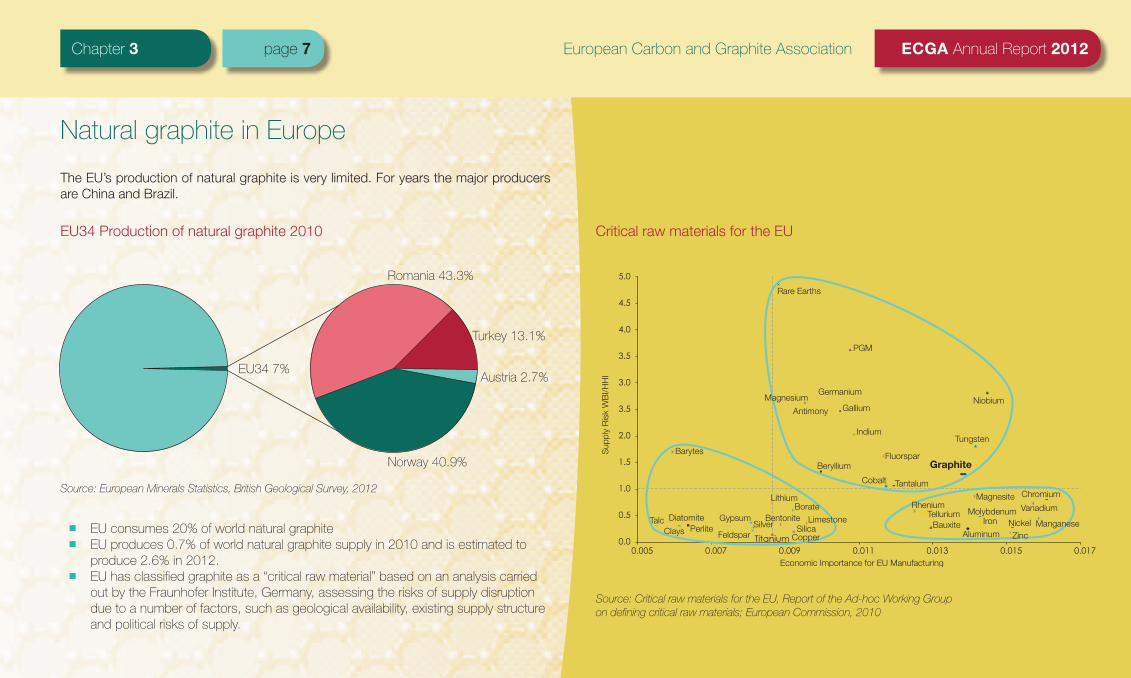
Turkey 13.1%
Austria 2.7%
Norway 40.9%
Romania 43.3%
EU34 7%
Titanium
4.0
4.5
5.0
2.0
3.5
3.0
3.5
0.0
0.5
1.0
1.5
0.005 0.007 0.009 0.011 0.013 0.015 0.017
Barytes
DiatomiteTalcPerlite
Gypsum
Feldspar
Sup
ply
Ris
k W
BI/H
HI
ClaysCopper
Limestone
BorateLithium
Beryllium
Indium
Economic Importance for EU Manufacturing
Silver SilicaBentonite
Magnesite
Aluminum
Fluorspar
GalliumMagnesium
Germanium
PGM
Tungsten
Niobium
Graphite
Rare Earths
RheniumTellurium
Bauxite
Chromium
Vanadium
ManganeseMolybdenum
Iron
ZincNickel
TantalumCobalt
Antimony
Natural graphite in Europe
▪ EU consumes 20% of world natural graphite
▪ EU produces 0.7% of world natural graphite supply in 2010 and is estimated to produce 2.6% in 2012.
▪ EU has classified graphite as a “critical raw material” based on an analysis carried out by the Fraunhofer Institute, Germany, assessing the risks of supply disruption due to a number of factors, such as geological availability, existing supply structure and political risks of supply.
EU34 Production of natural graphite 2010 Critical raw materials for the EU
The EU’s production of natural graphite is very limited. For years the major producers are China and Brazil.
Source: European Minerals Statistics, British Geological Survey, 2012
Source: Critical raw materials for the EU, Report of the Ad-hoc Working Group on defining critical raw materials; European Commission, 2010

ECGA Annual Report 2012Chapter 3 page 8 European Carbon and Graphite Association
Imports of graphite (tonnes)
Country 2006 2007 2008 2009 2010
Austria 10704 17757 30863 4622 18501
Belgium 1836 2309 3624 5048 7243
Bulgaria 433 250 158 132 66
Czech Republic 3485 5301 6233 2554 3605
Denmark 268 212 185 269 303
France 19430 19250 20618 10376 9981
Germany 45884 54627 62180 33293 56333
Greece 83 111 142 918 219
Hungary 192 178 147 126 113
Iceland 2 - 11 2132 18
Italy 11548 11362 11832 5995 8308
Macedonia 648 1969 1522 761 875
Netherlands 5632 13463 42612 2487 16692
Norway 296 980 561 508 400
Poland 3658 5701 4474 3078 6933
Portugal 1954 2210 1493 73 66
Romania 488 542 304 144 1499
Slovakia 1382 2246 2981 962 1899
Slovenia 161 108 141 89 295
Spain 10143 15582 24284 15669 34268
Sweden 1252 1592 1091 835 1315
Switzerland 722 966 931 306 848
Turkey 6300 6095 13230 6788 11191
United Kingdom 16978 17225 14309 7850 6989
Note(s): (1) This table excludes synthetic graphite
The import statistics give a clear indication of the downstream user industries and their location in the various EU countries.
Source: Adapted from European Mineral Statistics 2006-10 British Geological Survey
Exports
Thousand tonnes
Graphite - EU34 trade in 2010
Imports
GermanySpainAustriaNetherlandsTurkeyFranceItalyBelgiumUnited KingdomPolandCzech RepublicSlovakiaRomaniaSwedenMacedoniaSwitzerlandNorwayDenmarkSloveniaGreece
-30 -20 -10 0 10 20 30 40 50 60
European Natural Graphite Market
Source: European Minerals Statistics, British Geological Survey, 2012

ECGA Annual Report 2012Chapter 4 page 9 European Carbon and Graphite Association
Resource efficiencyThe carbon and graphite industry’s products contribute actively to the saving of resources and energy through its efficient process management and through its products.
The European Carbon and Graphite industry supports the EU’s Imitative on the sustain-able access to resources which was published in 2008 and was reinforced by the new Communication in 2011 and which was followed up by the Commission in 2012 with the announcement of the creation of a European Innovation Partnership (EIP) on Raw Materials.
This EIP will address three basic pillars:
▪ increasing access to resources from world markets;
▪ increasing access to resources from European sources;
▪ improving the efficiency of resource use in the EU coupled with the increase of the knowledge base about our resources.
The expectation is that this will give a boost to the development of raw materials and eventually also intermediate products which are needed by the EU’s downstream in-dustries.
Raw material prices have increased substantially in the past few years and have had an impact on the competitiveness of the carbon and graphite, but also on the downstream user industries.
The carbon and graphite industry has major concerns with regard to the access to natural graphite, but also pet coke.
Since natural graphite had been identified as a critical raw material, increased research into its uses and applications has been launched.
In order to understand the implications of the EU’s resource efficiency policies on a sec-tor like the graphite industry it is important to understand that for example higher quality electrodes require higher energy input which however is later saved in the steel furnace due to the longer lifetime of the electrode in the steel furnace.
Highly conductive materials such as graphite can reduce energy losses in many electric applications.
Steel and aluminium are materials which are infinitely recyclable. They fully comply with the overall EU’s resource efficiency policies and so does the graphite that is required to produce these metals, be it in the form of electrodes or cathodes.
A contribution to Europe’s growth and sustainability
GE specific consumption2,5
2,0
1,5
1,0
0,5
2006 2007 2008 2009 2010 2011 20120
EU average Worldwide average
kg/t

ECGA Annual Report 2012Chapter 5 page 10 European Carbon and Graphite Association
Improving Health and SafetyIn order to continuously improve its sustainability, the ECGA members are striving to re-duce their accident frequency and their accident severity. This is achieved through risk assessments at the workplace, continuous training and monitoring of accident rates.
Following the REACH regulation the sector had submitted a series of REACH dossiers on the substances produced by the sector. The second wave of registrations for the tonnage band below 1000 t was under preparation through 2012 and resulted in further registra-tions.
At the same time, the sector as a downstream user of HT coal tar pitch assessed the dos-sier that had been submitted by the coal tar pitch producers and following the discussions with the pitch producers in 2011 developed its own Chemical Safety Report assessing the safe handling of coal tar pitch throughout the carbon and graphite industry.
HT coal tar pitch is an indispensable substance in the production of anodes, cathodes and electrodes and therefore crucial for the carbon and graphite industry. In the past the industry had conducted many times research into substitutes which never yielded any successes. All proposed substitutes so far have are either not delivered on performance, or on environmental, health and safety improvement. Therefore the sector is spending much time and effort on making its workplaces as safe as possible.
14000
16000
18000
12000
10000
8000
6000
4000
2000
0
1998
1999
2000
2001
2002
2003
2004
2005
2006
2007
2008
2009
2010
2011
2012
Safety Performance Index for ECGA members(the overall performance independently of the number of employees)

ECGA Annual Report 2012Chapter 6 page 11 European Carbon and Graphite Association
A contribution to Europe’s climate change and energy policiesThe products and their contribution to energy efficiencyThe carbon and graphite sector is contributing to the goal of energy efficiency in many different ways. On the one hand through these products and on the other had through a continued strive of the operations to reduce their own energy consumption and op-timisation of processes.
Cost of energy and competitivenessOf equal importance is securing energy at competitive prices for European industries.
In this context in particular the sector, itself also a user of considerable amounts of electrical energy, has been monitoring the rising costs in the past few years which have threatened its competitiveness in comparison to its global competitors.
Parts of the carbon and graphite industry can be considered energy-intensive due to the fact that, for example, the graphitisation step in the production leading to elec-trodes - an integral part of all types of steelmaking - requires substantial amounts of energy in order to achieve higher longevity of the electrode in the steel furnace.
The EU’s climate change policy – the ETS schemeHowever, the new proposal for the European Emission trading scheme post 2013 will be another constraint on the competitiveness of the European graphite industry by imposing further costs on the enterprises which competing producers worldwide do not have to reckon with.
It is therefore crucial that energy-intensive industries which face fierce competition are given special allowances in this new scheme.
In 2012 the ECGA monitored the implementation of the new rules in the various Member States which were delayed. In 2013 the sector will engage in the revision of the Carbon Leakage List.
The potential impact of the legislation after 2013 is immense and hence the sector will continue to argue its case vis-à-vis the authorities.
ECGA Annual Report 2012Chapter 6 page 12 European Carbon and Graphite Association
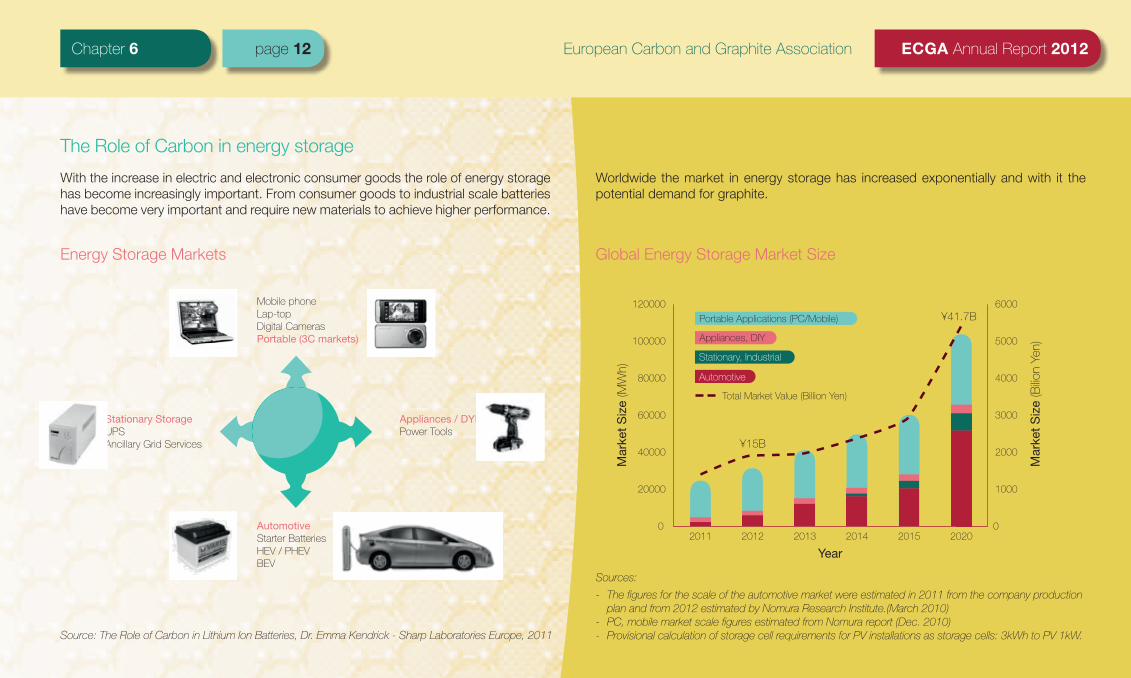
The Role of Carbon in energy storage
Energy Storage Markets Global Energy Storage Market Size
Sources:
- The figures for the scale of the automotive market were estimated in 2011 from the company production plan and from 2012 estimated by Nomura Research Institute.(March 2010)
- PC, mobile market scale figures estimated from Nomura report (Dec. 2010) - Provisional calculation of storage cell requirements for PV installations as storage cells: 3kWh to PV 1kW.
120000
100000
80000
60000
40000
20000
Mar
ket S
ize
(MW
h)
Year
¥15B
¥41.7B
Mar
ket S
ize
(Bilio
n Ye
n)
2011 2012 2013 2014 2015 20200
6000
5000
4000
3000
2000
1000
0
Portable Applications (PC/Mobile)
Stationary, Industrial
Appliances, DIY
Automotive
Total Market Value (Billion Yen)
Source: The Role of Carbon in Lithium Ion Batteries, Dr. Emma Kendrick - Sharp Laboratories Europe, 2011
With the increase in electric and electronic consumer goods the role of energy storage has become increasingly important. From consumer goods to industrial scale batteries have become very important and require new materials to achieve higher performance.
Worldwide the market in energy storage has increased exponentially and with it the potential demand for graphite.
AutomotiveStarter BatteriesHEV / PHEVBEV
Mobile phoneLap-topDigital CamerasPortable (3C markets)
Stationary StorageUPSAncillary Grid Services
Appliances / DYIPower Tools

ECGA Annual Report 2012Chapter 6 page 13 European Carbon and Graphite Association
The Lithium-Ion Batteries ▪ Energy Storage Markets
▪ 3C
▪ Automotive
▪ Stationary
▪ Energy Storage Requirements
▪ Lithium Ion Batteries
▪ Electrode Development
▪ Graphite in Lithium-Ion Batteries
Electric Vehicles
Source: Takeshita tutorial 2011 - THE 28th INTERNATIONAL BATTERY SEMINAR & EXHIBIT Modified for % EV-type (Takeshita 2009-10)
120000
10000
8000
6000
4000
2000
No.
Car
s x
1000
/ u
nits
Year2009 2010 2011 2012 2013 2014 2015 2016 2017 2018 2020
0
HEV, 5852
BEV, 3051.4
PHEV, 1536.15
The development of the lithium-Ion battery is driven mainly by the development of electric (EV) and hybrid electric (HEV) vehicles and the intended electrification of the European, but potentially later also Asian market. The continued urbanization is fostering this development.

ECGA Annual Report 2012Chapter 6 page 14 European Carbon and Graphite Association
Current and future trends in EVs and HEVs
Global demand for graphite, 2011
Source: Roskill’s Natural & Synthetic Graphite: Global Industry Markets and Outlook, 8th Edition 2012
10%
20%
30%
40%
50%
60%
70%
80%
90%
100%
Electrodes
Refractories
Lubricants
Foundries
Graphite shapes
Batteries
Friction products
Recarburising
Others
0
Asia Europe Northern America Southern America Other
Source: Roskill’s Natural & Synthetic Graphite: Global Industry Markets and Outlook, 8th Edition 2012
700
600
500
400
300
200
100
2004 2005 2006 2007 2008 2009 2010 20110
Asia Europe Northern America Other
Regional demand for graphite (kt)
In 2011 the global demand for graphite in this market amounted to 2.41 Mt and the pro-duction was around 2.45 Mt.
Batteries accounted for ~85,000t of graphite demand (65% natural and 35% synthetic) By far the largest graphite demand for use in batteries comes from Asia, around 50-55%. The graphite demand was recovering throughout 2012 coming out of the global economic downturn and future demand could increase significantly if EVs and HEVs take off on a large scale.

ECGA Annual Report 2012Chapter 6 page 15 European Carbon and Graphite Association
World: Production of cars and light vehicles (M units)
Source: Roskill’s Natural & Synthetic Graphite: Global Industry Markets and Outlook, 8th Edition 2012
10
20
30
40
50
60
70
80
90
Car
and
ligh
t veh
icle
pro
duct
ion
(M u
nits
)
Year
-on-
year
cha
nge
(%)
2002 2004 2006 2008 2012f2010 2014f 2016f0
10
20
30
40
50
60
70
80
90
0
Total Market Value (Billion Yen)
Asia Europe Northern America Southern America Africa Oceania
Battery type Use of graphite Types of graphite
Lithium-ion Anode – main host material Primary synthetic, spheroidal flake
Primary alkaline Cathode - additivePrimary synthetic, purified flake and purified expanded flake
Lead-acid Anode/cathode – additiveFuel cell Bi-polar plates – main filler material
Source: Roskill’s Natural & Synthetic Graphite: Global Industry Markets and Outlook, 8th Edition 2012
Major uses of graphite in batteries and fuel cells
Graphite in Li-ion batteriesBoth high purity synthetic and natural graphite can be used. Natural flake must undergo a high level of expensive processing to change it into spherical-shaped, high-purity graph-ite. High performing spherical graphites are increasingly produced at a price similar to those of synthetic graphite and so competition is increasing between the two materials.
Li-ion batteries are one of the few industries where natural and synthetic graphite com-pete. Finally, it often comes down to price and availability, which may depend on the loca-tion of the lithium-ion anode manufacturer.
In 2011 >70% of the graphite used in batteries was consumed in Li-ion batteries
The worldwide consumption in batteries is forecasted to increase to about 114,000t by 2016 mainly due to the Li-ions in consumer products, but to some extent from EV/HEV production.

ECGA Annual Report 2012Chapter 6 page 16 European Carbon and Graphite Association
Forcasted global graphite consumption in batteries, 2011 and 2016f
Source: Roskill’s Natural & Synthetic Graphite: Global Industry Markets and Outlook, 8th Edition 2012
Summary
▪ In 2011 >70% of the graphite used in batteries was consumed in Li-ion batteries
▪ Graphite consumption in batteries to increase to 114,000t by 2016 mainly due to Li-ions in consumer products, but to some extent from EV/HEV production
▪ Accelerated growth after 2015/16 as Li-ions take an increasing market share from NiMH batteries in HEVs
▪ Growth in EVs/HEVs underpinned by the desire to increase efficiency and de-crease emissions, both from the consumer and from governments
▪ Demand will increase both for synthetic and for natural graphite and is already encouraging the development new flake deposits and synthetic capacity
2011 2016f
Synthetic
Natural
Synthetic
Natural
65%
35%
58%
42%

ECGA Annual Report 2012Chapter 7 page 17 European Carbon and Graphite Association
The IUPAC (International Union of Pure & Applied Chemistry) compendium of technology states: “previously, descriptions such as graphite layers, carbon layers, or carbon sheets have been used for the term graphene... it is incorrect to use for a single layer a term which includes the term graphite, which would imply a three-dimensional structure. The term graphene should be used only when the reactions, struc-tural relations or other properties of individual layers are dis-cussed.”
Graphene is the first 2-dimensional material that humankind has experienced. It holds a wide array of possibilities in ad-vancing thermal conductivity, material strengthening and lighter weight composite applications.
Graphite is a logical source to make graphene scalable. Gra-phene derived from natural graphite sources may allow natu-ral graphite miners a possible entry into the synthetic graph-ite market and beyond.
Properties:
▪ Thinnest imaginable material
▪ Good(and tunable) electrical conductor
▪ Strongest ever measured
▪ Stiffest known material (stiffer than diamond)
▪ Highly stretchable crystal (up to 20%)
▪ High flexibility
▪ Chemical stability
▪ High charge carrier mobility (>106 cm2 V-1s-1)
▪ High transparency (97.7%)
Graphene: the latest innovation
Graphene – Fields of potential application
Electronics Composites Energy
Nanoelectronics / Quantum computing
Lightweight & Superstrong materials
Electrodes for batteries and supercaps
Fast photodetectors/Optoelec-tronics
Epoxy based composites Fuel cells
Light emitting devices Polymer composites Paper batteriesConductive inks (Printed/flexible electronics) RF tags
Bone regrowthReplacement for Indium-Tin-Oxide (ITO)
Sensors Siloxane base composites Flexible and transparent solar cells Sources: “The World Market for Graphene 2017”, Future Markets, Inc. 2011; Carbon Nanotubes and Gra-phene for Electronics Applications: Technologies, Players and Opportunities”, IDTechEx, 2010
Source: “The World Market for Graphene 2017”, Future Markets, Inc. 2011; “Carbon Nanotubes and Gra-phene for Electronics Applications: Technologies, Players and Opportunities”, IDTechEx, 2010
Graphene production, 2009-2017
50
0
100
150
200
250
300
350
400
450
2009 2010 2011 2012 2013 2014 2015 2016 2017
TONS
Graphite
Single atomic plane of carbon atoms


