IntroductionUnderstanding the formation and evolution of Archeancratons remains one of the holy grails of earth science.The existence of these ancient continental coresindicates that cratonic formation was widespread before~2.5 Ga, and a wide range of petrologic, geochemical,and seismological evidence suggests that these nucleiapparently formed under conditions unique to theArchean (e.g., Jordan, 1988; Rudnick et al., 1998; Carlsonet al., 2000; James and Fouch, 2002; Niu and James,2002). It is not surprising that conditions in the Archeanwere somewhat different than processes operating onEarth today, but it is striking that these dissimilaritiesmay be of a fundamental nature. Understanding the relationship of continental structures to the evolution of both the crust and mantle of continentalinteriors is integral to improving our understanding ofcratons.
Nearly three decades ago, Jordan (1975) advocatedthe term “tectosphere” to describe the deep layer of theArchean mantle that remains attached to the continentalcraton through geologic time. By that model, extensivemelt depletion of the cratonic mantle producedcompositionally-induced low density refractory residues,resulting in cold cratonic roots that are isostaticallybalanced against warmer, yet compositionally denser,mantle beneath ocean basins. The term tectosphere is
meant to distinguish this stable mantle root beneathcratons from the rest of the convecting mantle and todifferentiate the Archean cratonic keel from post-Archean lithospheric mantle.
The existence of a chemically and physically distinctmantle tectosphere suggests processes or conditionsunique to the Archean. Cratons are characterized byboth low heat flow (Jones, 1988) and a very lowgeothermal gradient (McDonough and Rudnick, 1998;Jaupart and Mareschal, 1999; Nyblade, 1999; Rudnickand Nyblade, 1999) relative to Proterozoic mantle.Cratonic mantle xenoliths show that the tectosphericroot, or “keel”, is composed of highly depletedperidotite with low normative density and high seismicvelocity (Boyd and McCallister, 1976; Jordan, 1979;James et al., 2004). Refractory keels beneath cratonsextend to mantle depths of at least 200km or deeper(e.g., Jordan, 1975; Lerner-Lam and Jordan, 1987; Jaupartand Mareschal, 1999; Rudnick and Nyblade, 1999;Shapiro et al., 1999; Ritsema and van Heijst, 2000; Jameset al., 2001; James et al., 2003).
Variations in crustal and crust/mantle boundarystructure also support the concept of major differencesin Archean and post-Archean craton formationprocesses. For instance, Archean crust is typicallythinner than surrounding Proterozoic terranes (e.g., Durrheim and Mooney, 1991; Durrheim and
MATTHEW J. FOUCH, DAVID E. JAMES, JOHN C. VANDECAR, SUZAN VAN DER LEEAND THE KAAPVAAL SEISMIC GROUP
SOUTH AFRICAN JOURNAL OF GEOLOGY, 2004, VOLUME 107, PAGE 33-44
33
Mantle seismic structure beneath the Kaapvaaland Zimbabwe Cratons
Matthew J. FouchDepartment of Geological Sciences, Arizona State University, Tempe, AZ 85287, USA
Figure 1. Map showing topography, principal geologic provinces, and station locations of the Southern Africa Seismic Array (SASE). Circles
denote the fifty-five broadband seismic stations of the larger Kaapvaal Seismic Array (KSA), which were installed in April 1997 in South
Africa, Botswana, and Zimbabwe. A total of 79 sites were occupied over the two-year deployment. Stations in light blue were re-deployed
in April 1998 to sites indicated in yellow. Dark blue stations remained in the same location throughout the experiment period. Small open
circles denote the dense Kimberley Telemetered Array (KTA), which was installed for a period of five months during the KSA deployment.
Data from three GSN broadband stations located in the region (open triangles) are also incorporated in the tomographic analysis. The array
extends from the Cape Fold Belt in the south, through the Proterozoic Namaqua-Natal mobile belt, across the Kaapvaal Craton and Bushveld
Complex, through the Archean Limpopo Mobile Belt and into the Zimbabwe Craton. In the west, the array covers part of the Kheis and
Okwa Proterozoic fold and thrust belts of Botswana and western South Africa.
Mooney, 1994; Clitheroe et al., 2000; Nguuri et al., 2001;Assumpçao et al., 2002; Niu and James, 2002;Stankiewicz et al., 2002), although there is not consensuson this issue (e.g. Rudnick and Fountain, 1995).Furthermore, the crust-mantle discontinuity (the “Moho”) beneath Archean regions is commonlysharper than that beneath post-Archean regions (e.g., Nguuri et al., 2001; Assumpçao et al., 2002; Niuand James, 2002). The lower crust beneath cratons mayalso be less mafic than beneath Proterozoic terranes(Griffin and O’ Reilly, 1987; Durrheim and Mooney,1994; Niu and James, 2002).
The southern African subcontinent provides a naturallaboratory for detailed examinations of tectospheric keelstructure. The region has long been the focus of intensegeologic study by virtue of its economic importance.The Kaapvaal Project (Carlson et al., 1996) wasundertaken with the key objective of extending ourunderstanding of the formation and evolution of cratoniccrust and mantle. Data from the Project have providedimportant constraints on the geologic, petrologic,geochemical, and geophysical structure of the Kaapvaalcraton and surrounding terranes. The centerpiece of theProject, the Southern Africa Seismic Experiment (SASE),has provided a unique opportunity to image crust andmantle structure over a wide range of spatial scalesbeneath southern Africa.
Results from seismic data collected during the SASEhave yielded important new constraints on crust andmantle structure beneath southern Africa. Studies have included work on crustal thickness, Mohosharpness, and lower crustal composition (e.g., Nguuri et al., 2001; Niu and James, 2002; Stankiewicz et al.,2002), upper mantle discontinuity structure (e.g., Gao et al., 2002; Stankiewicz et al., 2002), 1D surface wave velocity and anisotropy structure (e.g., Freybourger et al., 2001; Saltzer, 2002), and mantle seismic anisotropy(e.g., Silver et al., 2001; Fouch et al., 2004b; Silver et al.,2004). More recent work has been undertaken tointegrate these results and provide better constraints onthe nature of craton formation and evolution (e.g., James and Fouch, 2002; Shirey et al., 2002; Jameset al., 2003; James et al., 2004). In addition, SASE datahave begun to provide constraints on lower mantle seismic velocity and anisotropy (e.g., Ni et al.,2002; Ni and Helmberger, 2003a).
This paper provides recent results of mantle seismicvelocity variations using data from the Kaapvaal SeismicArray and is an update of preliminary work published byJames et al. (2001). We present images from threedimensional (3D) tomographic inversions for P-waveand S-wave velocity variations within the upper mantlebeneath the Kaapvaal and Zimbabwe cratons and their adjacent mobile belts. We interpret the seismicresults in terms of the geology, geochemistry andpetrology of the crust and mantle beneath southernAfrica and consider their implications for cratonformation and evolution.
Data and MethodsThe Southern Africa Seismic ExperimentThe SASE was comprised of two passive broadbandseismometer arrays deployed across southern Africa(Figure 1), and formed the seismic component of theKaapvaal Project.
The primary component of the SASE was the KaapvaalSeismic Array (KSA), which consisted of 55 broadbandseismic stations deployed across southern Africa fromApril 1997 to July 1999. Approximately half the stationswere re-deployed to new sites in April and May 1998 fora total of 79 stations. Average station spacing for the KSAwas ~100km and had a footprint of nearly 1 million km2
(Figure 1). Permanent broadband stations BOSA, LBTB,and SUR supplemented KSA data, providing a total of 82 stations used in the analyses presented here. Nearly all stations used in the KSA were comprised ofStreckheisen STS2 broadband seismometers and RefTekhigh resolution 24-bit digitizer/dataloggers with GPStiming, and recorded continuously at 20 samples/s. At thetime of installation, the KSA was one of the largesttemporary broadband seismic networks ever deployed.The array spans geological provinces across South Africa, Zimbabwe and Botswana, and traverses geologicterranes ranging in age from Early Archean toPhanerozoic.
Relative Arrival Time AnalysisWe analyzed broadband seismic waveforms todetermine relative arrival times of phases P, PKPdf, S,and SKS via a multi-channel cross-correlation technique(VanDecar and Crosson, 1990). In this method, allpossible waveform pairs for a given phase recorded atan array from a single event are cross-correlated todetermine the best-fitting relative arrival time for eachwaveform. The resulting data are therefore not absolutetravel times, but rather relative arrival times across thearray. The advantage of this analysis method is that itenables one to quantify errors in the arrival time dataset,which is not possible with most traditional arrival timephase picking methods.
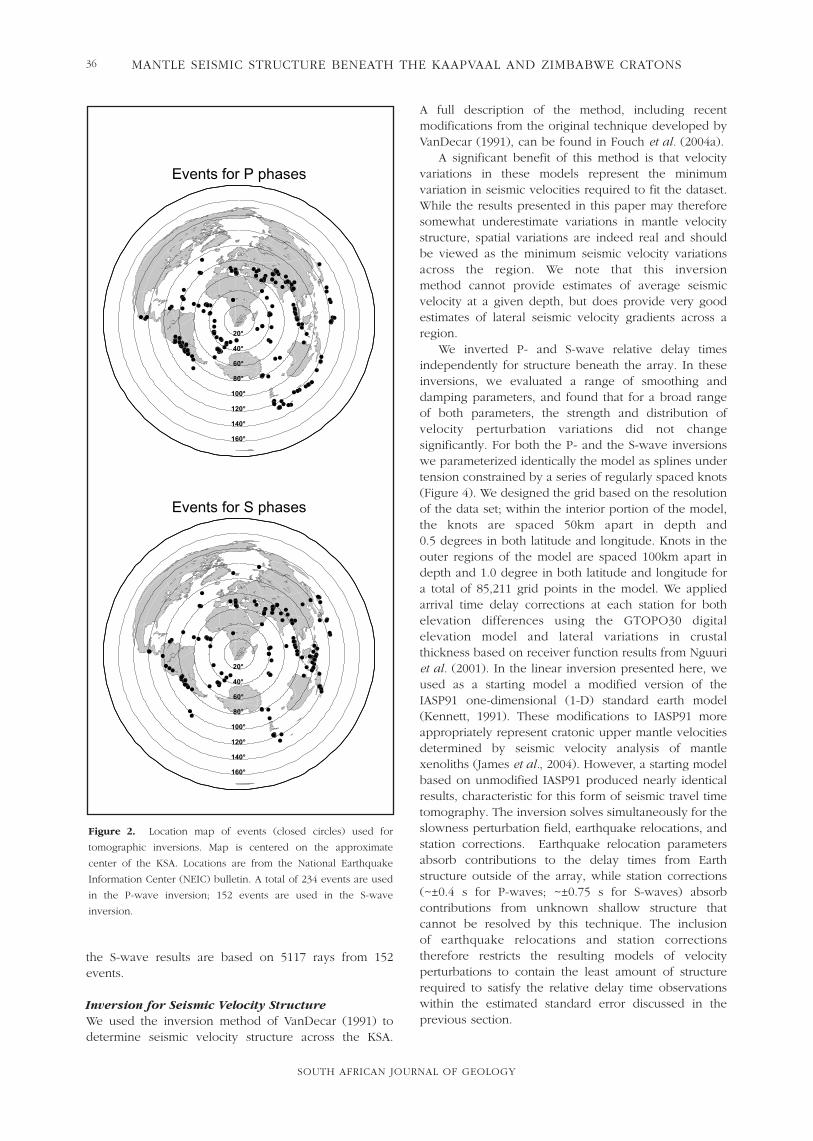
Azimuthal coverage is good for both P- and S-wavedatasets (Figure 2), although the northeast andsouthwest quadrants (middle East/Himalayan andAndean regions, respectively) provide the majority ofevents for both models. The timing accuracy for most of the dataset is about 0.001 s, and all data with potentialtiming errors greater than 0.01s were eliminated from the analysis. Record section waveforms examplesfor both P and S phases are shown in Figure 3, whichdemonstrate the very high signal-to-noise and overallexcellent quality of data used in this study. Typicalrelative arrival time standard deviations for our dataset are ~0.03 s for P-waves and ~0.06 s for S-waves. These low standard deviations in relativearrival time result in very small velocity perturbations,and are significantly below the resolution of the finalinversions. The P-wave inversion results presented inthis study are based on 8693 rays from 234 events;
MATTHEW J. FOUCH, DAVID E. JAMES, JOHN C. VANDECAR, SUZAN VAN DER LEEAND THE KAAPVAAL SEISMIC GROUP
SOUTH AFRICAN JOURNAL OF GEOLOGY
35
the S-wave results are based on 5117 rays from 152events.
Inversion for Seismic Velocity StructureWe used the inversion method of VanDecar (1991) todetermine seismic velocity structure across the KSA.
A full description of the method, including recentmodifications from the original technique developed byVanDecar (1991), can be found in Fouch et al. (2004a).
A significant benefit of this method is that velocityvariations in these models represent the minimumvariation in seismic velocities required to fit the dataset.While the results presented in this paper may thereforesomewhat underestimate variations in mantle velocitystructure, spatial variations are indeed real and shouldbe viewed as the minimum seismic velocity variationsacross the region. We note that this inversion method cannot provide estimates of average seismicvelocity at a given depth, but does provide very goodestimates of lateral seismic velocity gradients across aregion.
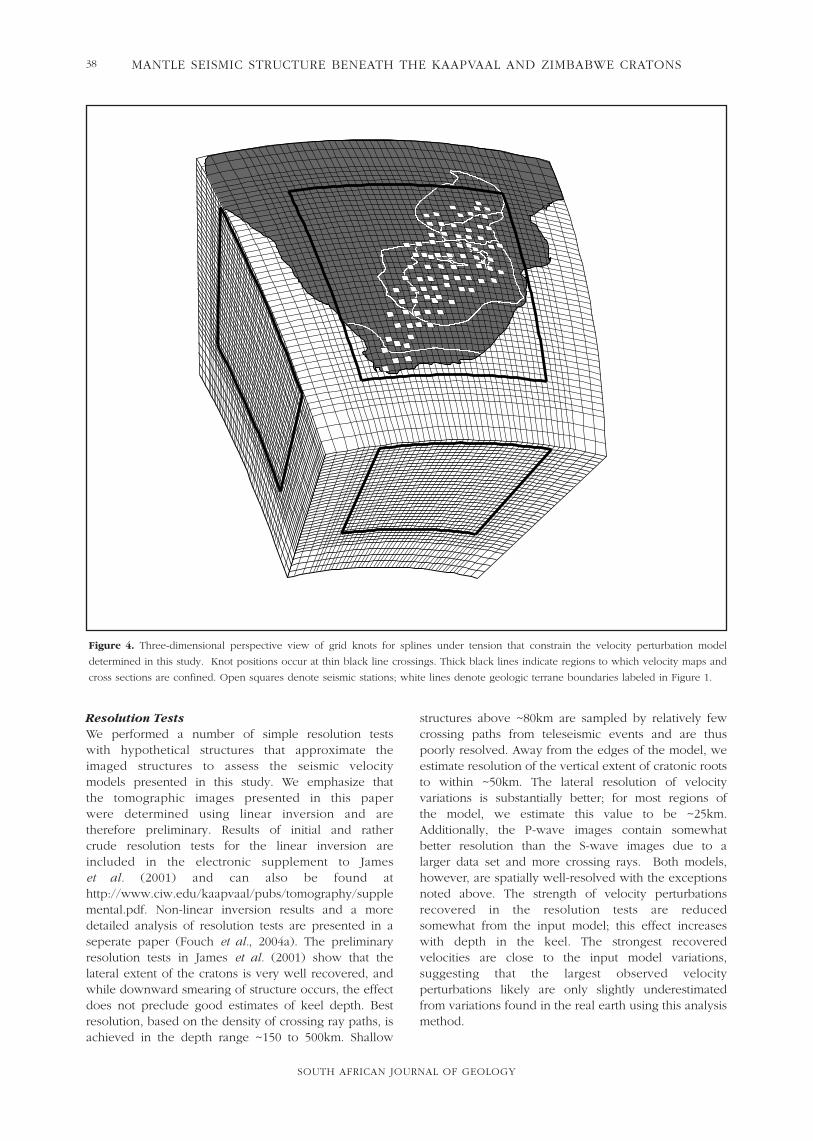
We inverted P- and S-wave relative delay timesindependently for structure beneath the array. In theseinversions, we evaluated a range of smoothing anddamping parameters, and found that for a broad rangeof both parameters, the strength and distribution ofvelocity perturbation variations did not changesignificantly. For both the P- and the S-wave inversionswe parameterized identically the model as splines undertension constrained by a series of regularly spaced knots(Figure 4). We designed the grid based on the resolutionof the data set; within the interior portion of the model,the knots are spaced 50km apart in depth and 0.5 degrees in both latitude and longitude. Knots in theouter regions of the model are spaced 100km apart indepth and 1.0 degree in both latitude and longitude fora total of 85,211 grid points in the model. We appliedarrival time delay corrections at each station for bothelevation differences using the GTOPO30 digitalelevation model and lateral variations in crustalthickness based on receiver function results from Nguuriet al. (2001). In the linear inversion presented here, weused as a starting model a modified version of theIASP91 one-dimensional (1-D) standard earth model(Kennett, 1991). These modifications to IASP91 moreappropriately represent cratonic upper mantle velocitiesdetermined by seismic velocity analysis of mantlexenoliths (James et al., 2004). However, a starting modelbased on unmodified IASP91 produced nearly identicalresults, characteristic for this form of seismic travel timetomography. The inversion solves simultaneously for theslowness perturbation field, earthquake relocations, andstation corrections. Earthquake relocation parametersabsorb contributions to the delay times from Earthstructure outside of the array, while station corrections(~±0.4 s for P-waves; ~±0.75 s for S-waves) absorbcontributions from unknown shallow structure thatcannot be resolved by this technique. The inclusion of earthquake relocations and station correctionstherefore restricts the resulting models of velocityperturbations to contain the least amount of structurerequired to satisfy the relative delay time observationswithin the estimated standard error discussed in theprevious section.
SOUTH AFRICAN JOURNAL OF GEOLOGY
MANTLE SEISMIC STRUCTURE BENEATH THE KAAPVAAL AND ZIMBABWE CRATONS36
20°
40°
60°
80°
100°
120°
140°
160°
Events for P phases
20°
40°
60°
80°
100°
120°
140°
160°
Events for S phases
Figure 2. Location map of events (closed circles) used for
tomographic inversions. Map is centered on the approximate
center of the KSA. Locations are from the National Earthquake
Information Center (NEIC) bulletin. A total of 234 events are used
in the P-wave inversion; 152 events are used in the S-wave
inversion.
MATTHEW J. FOUCH, DAVID E. JAMES, JOHN C. VANDECAR, SUZAN VAN DER LEEAND THE KAAPVAAL SEISMIC GROUP
SOUTH AFRICAN JOURNAL OF GEOLOGY
37
68
70
72
74
76
78
80
82
84
Epi
cent
ral d
ista
nce
(deg
)
-10 0 10 20
Time (sec)
42
44
46
48
50
52
54
56
58
Epi
cent
ral d
ista
nce
(deg
)
-10 0 10 20
Time (sec)
P SA B
Figure 3. Record sections of typical velocity waveforms used for relative delay time analysis. Time series are aligned at 0 s on peak of
phase used in analysis; amplitudes are normalized for all waveforms in record section. Typical delay time standard deviations for our dataset
are ~0.03 s for P-waves and ~0.06 s for S-waves. (a) Vertical component waveforms from a South Sandwich Islands event (October 5, 1997;
depth 274km; mb 6.0) used for P-wave analysis. Waveforms have been bandpass filtered between 0.4 Hz and 2.0 Hz. (b) Transverse
component waveforms from a Hindu Kush event in South Sandwich Islands (May 13, 1997; depth 196km; mb 6.1) used for S-wave analysis.
Waveforms have been bandpass filtered between 0.02 Hz and 0.2 Hz.
Resolution TestsWe performed a number of simple resolution tests with hypothetical structures that approximate theimaged structures to assess the seismic velocity models presented in this study. We emphasize that the tomographic images presented in this paper were determined using linear inversion and aretherefore preliminary. Results of initial and rather crude resolution tests for the linear inversion are included in the electronic supplement to James et al. (2001) and can also be found athttp://www.ciw.edu/kaapvaal/pubs/tomography/supplemental.pdf. Non-linear inversion results and a moredetailed analysis of resolution tests are presented in aseperate paper (Fouch et al., 2004a). The preliminaryresolution tests in James et al. (2001) show that thelateral extent of the cratons is very well recovered, andwhile downward smearing of structure occurs, the effectdoes not preclude good estimates of keel depth. Bestresolution, based on the density of crossing ray paths, isachieved in the depth range ~150 to 500km. Shallow
structures above ~80km are sampled by relatively fewcrossing paths from teleseismic events and are thuspoorly resolved. Away from the edges of the model, weestimate resolution of the vertical extent of cratonic rootsto within ~50km. The lateral resolution of velocityvariations is substantially better; for most regions of the model, we estimate this value to be ~25km.Additionally, the P-wave images contain somewhatbetter resolution than the S-wave images due to a larger data set and more crossing rays. Both models,however, are spatially well-resolved with the exceptionsnoted above. The strength of velocity perturbationsrecovered in the resolution tests are reduced somewhat from the input model; this effect increaseswith depth in the keel. The strongest recoveredvelocities are close to the input model variations,suggesting that the largest observed velocityperturbations likely are only slightly underestimatedfrom variations found in the real earth using this analysismethod.
SOUTH AFRICAN JOURNAL OF GEOLOGY
MANTLE SEISMIC STRUCTURE BENEATH THE KAAPVAAL AND ZIMBABWE CRATONS38
Figure 4. Three-dimensional perspective view of grid knots for splines under tension that constrain the velocity perturbation model
determined in this study. Knot positions occur at thin black line crossings. Thick black lines indicate regions to which velocity maps and
cross sections are confined. Open squares denote seismic stations; white lines denote geologic terrane boundaries labeled in Figure 1.
MATTHEW J. FOUCH, DAVID E. JAMES, JOHN C. VANDECAR, SUZAN VAN DER LEEAND THE KAAPVAAL SEISMIC GROUP
SOUTH AFRICAN JOURNAL OF GEOLOGY
39
i
700
600
500
400
300
200
100
0
Depth
(km
)
B B'
-1.0 -0.5 0 0.5 1.0
P-wave velocity perturbation(%)
Namaqua-Natal
Mobile BeltZimbabwe
Craton
Kaapvaal
CratonCape Fold
Belt
Bushveld
Province
700
600
500
400
300
200
100
0
Depth
(km
)B B'
-1.2 -0.6 0 0.6 1.2
S-wave velocity perturbation(%)
Namaqua-Natal
Mobile BeltZimbabwe
Craton
Kaapvaal
CratonCape Fold
Belt
Bushveld
Province
B
B'
14 16 18 20 22 24 26 28 30 32 34 36
16
18
20
22
24
26
28
30
32
34
36
La
titu
de
So
uth
Depth = 300 km
SAF03a_P
16
18
20
22
24
26
28
30
32
34
36
La
titu
de
So
uth
14 16 18 20 22 24 26 28 30 32 34 36
B
B'
14 16 18 20 22 24 26 28 30 32 34 36
16
18
20
22
24
26
28
30
32
34
36
La
titu
de
So
uth
Depth = 300 km
SAF03a_S
16
18
20
22
24
26
28
30
32
34
36
La
titu
de
So
uth
14 16 18 20 22 24 26 28 30 32 34 36
B
B'
14 16 18 20 22 24 26 28 30 32 34 36
Longitude East
16
18
20
22
24
26
28
30
32
34
36
La
titu
de
So
uth
Depth = 150 km
SAF03a_P
16
18
20
22
24
26
28
30
32
34
36
La
titu
de
So
uth
B
B'
14 16 18 20 22 24 26 28 30 32 34 36
Longitude East
16
18
20
22
24
26
28
30
32
34
36
La
titu
de
So
uth
Depth = 150 km
SAF03a_S
16
18
20
22
24
26
28
30
32
34
36
La
titu
de
So
uth
A
B
C
D
E
F
Figure 5. Horizontal and vertical cross sections for P- and S-wave velocity perturbation models determined by inversion of delay times
after correction for elevation and crustal thickness. Color scales show percent velocity perturbation (note slightly different range for P- and
S-models). Surface topography (light blue) is plotted at 20 times actual scale. Uppermost 50km in vertical sections (shaded area) denotes
regions where station delay time residuals are incorporated in model calculations. Colors fade to black for ray hit counts less than 10 within
the model to represent the most poorly-resolved regions of the model. Panels a-c are images of P-wave velocity perturbations; panels d-f
are images of S-wave velocity perturbations. Panels a and b are P-wave depth slices at 150 and 300km, respectively; panels d and e are
S-wave depth slices at 150 and 300km, respectively; panels c and f are vertical cross section views of P- and S-wave velocity perturbations,
respectively, across B-B’ profile shown in map view panels.
Mantle Seismic Structure Beneath Southern AfricaResults for the linear, smoothed, and damped relativetravel time inversions for both P- and S-waves exhibit arange of trends that clearly relate to geologic structure atthe surface (Figure 5). For the most part, the P- and Swave models are quite similar, and suggest that thevelocity inversions are robust. These variations providekey insights into the relationship between crustalgeology and deeper mantle structure beneath southernAfrica.
The most robust feature in the tomographic imagesis that regions of highest velocity mantle coincide closelywith the boundaries of both the Archean Kaapvaal and Zimbabwe cratons. The region of maximum positivevelocity perturbations (blue regions, Figure 5) outlines the present-day core of the Kaapvaal craton,from the southernmost Proterozoic Bushveld Complexsouth-southwest to the inferred contact with the Proterozoic Namaqua-Natal mobile belt in thesouthwestern region of the array. North of the BushveldComplex, similar mantle structure exists across both theArchean Limpopo mobile belt and Zimbabwe craton.The strong positive velocity perturbations across theregion suggest that the seismically-defined keel extends to depths of ~250 to 300km beneath theKaapvaal craton, and perhaps slightly less (~225 to250km) beneath the Limpopo mobile belt andZimbabwe craton.
A significant break in the highest velocity regions isevident near the ~2.05 Ga Bushveld Complex (Walraven and Hattingh, 1993; Buick et al., 2001) (Figure 5). Lower than average mantle velocities near theBushveld Complex appear to extend not only into the mantle beneath the layered intrusion itself, but alsowell to the west, particularly in the higher-resolution P-wave models. While the overall pattern of reducedvelocities across the Bushveld Complex is well-resolved,the localized higher order variations of the P-waveperturbations (i.e., structures <25km in lateraldimension) are not well-resolved.
Another significant velocity anomaly exists in theuppermost mantle near the Proterozoic Namaqua-Natalmobile belt south and west of the Kaapvaal craton. Thismobile belt is thought to be the remnants of a majornorth to south convergent margin that extended as farnorth as the Zimbabwe craton (de Wit et al., 1992), andis characterized by velocity perturbations slightly lowerthan those observed beneath cratonic regions. We observe patches of higher velocity material in the200 to 400km depth range beneath this region, however,and these higher velocities appear to exhibit continuitywith the high velocity material beneath the adjacentKaapvaal craton. Finally, the reduced velocityperturbations beneath the Cape fold belt are likely due to poor resolution in this region and possibly lowermantle low velocity anomalies (i.e., Ritsema et al., 1998; Ni and Helmberger, 2003b). We therefore do notdiscuss further the Cape Fold belt anomalies in ouranalysis.
DiscussionThe depth extent of cratonic roots has long been acontentious issue. Part of the debate has been withregard to Jordan’s tectosphere hypothesis (Jordan, 1975;1978), in which the concept of deep, cold, andchemically distinct keels beneath continents wascontested when first proposed (e.g. Okal and Anderson,1975; Anderson, 1979; Sclater et al., 1980). Morerecently, however, the tectosphere hypothesis has beenstrengthened substantially by petrologic andgeochemical studies of mantle nodules, particularly datafrom southern Africa. For instance, Re-Os model agedeterminations show that mantle nodules erupted fromeven the greatest depths beneath the craton (~200km)are Archean in age (Pearson et al., 1995; Carlson et al.,2000). Moreover, recent analyses of xenolith pressureand temperature data suggest that the craton geothermlikely intersects the mantle adiabat between depths of160km and 300km. Current “best” estimates place themantle adiabat intersection in the range of 220 to 250kmbeneath the cratons if the Brey and Kohler (1990)geothermobarometry methodology is assumed (Rudnicket al., 1998; Rudnick and Nyblade, 1999; James et al.,2004). Other thermobarometric methods, however, mayproduce lower geotherms that imply greater depths tothe mantle adiabat intersection (James et al., 2004).
The keel thickness estimates from petrologic andgeochemical data are consistent with the results of thisstudy, which show that positive velocity perturbationsbeneath the cratons extend to depths of at least 250km,and possibly as deep as 300km. With the exception ofthe reduced velocity region near the Bushveld Complex,the mantle beneath the Zimbabwe and Kaapvaalcratons, and the Limpopo mobile belt exhibits astrikingly coherent pattern of high velocity anomalies todepths of at least 250km. These results are in generalagreement with regional seismic studies of several othercratonic regions (e.g., VanDecar et al., 1995; van der Leeand Nolet, 1997; Ritsema and van Heijst, 2000; Goes andvan der Lee, 2002), which suggest keel thicknesses asgreat as 300km in some areas. The high velocityperturbations that extend below 300km in the southernKaapvaal could be real, although resolution tests suggestthat these deeper high velocity anomalies may be due tovertical smearing of velocities in the inversion process(Fouch et al., 2004a). Additionally, independentevidence from heat flow studies does not suggest suchgreat keel thicknesses, although such estimates arehighly model dependent (Jones, 1988; Rudnick andNyblade, 1999).
The velocity perturbations observed in this study areconsistent with those computed from recent surfacewave studies. For example, a 1-D isotropic regionalstudy by (Zhao et al., 1999) found a maximum of a ~3%increase in velocities across the southern Africa region.Similarly, a 3-D, isotropic, regional study of fundamentalmode Rayleigh waves by Ritsema and van Heijst (2000)found similar degrees of velocity perturbations, and amaximum keel thickness of ~250km. A pair of 1-D
SOUTH AFRICAN JOURNAL OF GEOLOGY
MANTLE SEISMIC STRUCTURE BENEATH THE KAAPVAAL AND ZIMBABWE CRATONS40
MATTHEW J. FOUCH, DAVID E. JAMES, JOHN C. VANDECAR, SUZAN VAN DER LEEAND THE KAAPVAAL SEISMIC GROUP
SOUTH AFRICAN JOURNAL OF GEOLOGY
41
studies using the KSA dataset incorporated anisotropyinto the analyses and found a maximum keel thicknessof ~220km (Freybourger et al., 2001; Saltzer, 2002).While these studies do not agree on the location andstrength of the lithospheric anisotropic zone, they clearlyshow higher than average velocities extending to depths>200km.
We find no evidence for a low seismic velocity layerbeneath subregions of the southern African keel system.If a ubiquitous, homogeneous low-velocity zone (LVZ)existed beneath the entire region, we would not be ableto resolve it with our tomographic analysis method.Given the complexity in keel structure observed in thisstudy, a simple homogeneous zone of reduced velocitiesacross the region is not likely; we therefore should beable to image areas containing LVZ structure if present.The absence of an LVZ is consistent with several recentsurface wave studies of the region that possess goodvertical resolution (Ritsema and van Heijst, 2000;Freybourger et al., 2001; Saltzer, 2002; Gore, 2004;Nguuri, 2004), but it is not consistent with previous 1-D isotropic studies (Cichowicz and Green, 1992; Qiu et al., 1996; Priestley, 1999). The results of Freybourgeret al. (2001) and Saltzer (2002), however, used KSA datato demonstrate that a low-velocity zone beneath thehigh velocity keel may be artificially derived ifanisotropy is not included in the 1-D calculation. Whilesome thermal blanketing may influence velocitiesimmediately beneath the craton, the velocityperturbations we find in the 200 to 300km depth rangeare too high to reflect “cool” asthenospheric mantle.Even to depths of ~400km, the velocity perturbations we observe are too high for suboceanic mantlevelocities.
The most prominent upper mantle velocity anomalywithin the Kaapvaal craton is associated with theBushveld layered intrusion and its western extensioninto Botswana. The tomographic results are alsoconsistent with evidence from geological andgeophysical data that Bushveld Complex structuresextend westward into Botswana (Ranganai et al., 2002).While the zone of reduced mantle velocities in theregion is clearly real, resolution tests reveal difficulties inquantifying the magnitude of the velocity contrast andsuggest that this contrast may be somewhat smaller thanthat obtained from the data inversion (Fouch et al.,2004a). Assuming the observed velocity reductions of~0.5% in P and ~0.8% in S, elementary calculations fromthermal/chemical/velocity relationships (Christensen,1982) suggest that a temperature anomaly of ~100ºCwould be required to produce the velocity reductionobserved.
The reduced mantle velocities near the region of theBushveld Complex suggest that considerable mantlemodification has occurred in the region, probably at thetime of intrusion of Bushveld magmas. One explanationof relatively low velocities beneath the BushveldComplex is compositional “refertilization” (i.e., ironenrichment) of the mantle during the Bushveld event.
Indeed, it is plausible that pervasive mantle metaso-matism, as may have accompanied the Bushveldmagmatism, could significantly reduce seismic velocitiesin the mantle. Jordan showed, for example, thatrefertilized cratonic samples have normative seismicvelocities up to 1% lower and densities up to 2 to 3%higher than the depleted nodular peridotites (Jordan, 1979). Moreover, increased proportions oforthopyroxene can occur by reaction of metasomaticfluids with olivine, providing an attractive explanationfor the substantially larger P-wave anomaly relative tothe S-wave anomaly in the region (James et al., 2004). A similar origin to the pattern of large positive P-waveanomalies relative to S has been observed for regions ofthe Wyoming craton in the western United States (Goesand van der Lee, 2002).
A temperature anomaly on the scale of ~100ºC,however, is impossible to verify with current data.While the mantle xenoliths from the Premier mine onthe edge of the Bushveld Complex do exhibit veryslightly higher geotherms than those from theundisturbed craton to the south (James et al., 2004), the fact that the xenoliths were erupted ~1.2 Ga rendersthem meaningless for estimating present-day geotherms.Heat flow measurements (Jones, 1988) from theBushveld region seem to indicate, however, thatgeotherms in the region of the Bushveld Complex areonly marginally higher, if at all, relative to thesurrounding region. What is clear is that the BushveldComplex was a major mantle event as evidenced byrecent data from Re-Os isotope analysis, which showthat ~1.2 Ga mantle samples from the Bushveld provincewere heavily overprinted and reset with ProterozoicBushveld Complex ages of ~2.05 Ga (Carlson et al.,2000). The isotopic resetting of an entire volume ofArchean Kaapvaal mantle almost certainly requiredmaterial addition to the mantle (Carlson et al., 2000;Shirey et al., 2002).
Other interpretations of this enigmatic region are alsoplausible. For example, analyses of Premier minexenolith samples notably indicate that neither peridotitemajor element composition nor orthopyroxeneabundance differ significantly from xenoliths eruptedthrough undisturbed Kaapvaal craton (F.R. Boyd,personal communication 2001). Conversely, eclogiticmaterials, if present (Shirey et al., 2002), would tend toincrease both average velocity and average density ofthe depleted peridotitic mantle and therefore cannot bean explanation for reduced seismic velocities. Finally,Duncan (A. Duncan, personal communiucation 2002)has suggested that the Bushveld anomaly observed inthis study may be due to a thermal perturbation resultingfrom Karoo magmatism at ~183 Ma (Duncan et al.,1997). Further work will be required to assess thevalidity of these various competing hypotheses.
Data provided by the SASE continue to be animportant source for a broad range of studies currentlyin progress, which will provide further informationregarding the seismic structure of the Kaapvaal region.
For instance, preliminary 2-station surface wave analyseshave been performed by (Gore, 2004) and (Nguuri,2004). (Larson et al., 2003) currently are extending thiswork, which will provide high-resolution estimates oflateral variations in crust and uppermost mantle velocitystructure across the entire southern Africa region. Inother related efforts, body wave relative delay timescollected from this study are being combined withsurface wave phase delay data to invert for mantleseismic velocities (van der Lee et al., 2001). Thesestudies will provide better constraints on the depthextent of the cratonic keel across the region. In addition,Li (A. Li, pers. comm. 2003) is utilizing both fundamentalmode Love and Rayleigh waves recorded by the SASE toconstrain mantle anisotropy and velocity structurebeneath the Kaapvaal region.
ConclusionsTomographic images of seismic body waveperturbations beneath southern Africa exhibit a clearcorrespondence with geologic terrane boundaries. Themantle keel beneath the Kaapvaal craton appears toextend to a depth of ~250 to 300km. The maximum keelthickness beneath the Zimbabwe craton is somewhatless, reaching a local maximum of ~225 to 250km. Thetotal contrast in velocity perturbation within both cratonsis between 0.4% and 0.6%, consistent with (but notnecessarily due to) compositional variations observed inmantle nodules. The Archean Limpopo mobile beltappears to be underlain by a mantle keel with a typicalcratonic signature, despite a highly complex crustalstructure. The mantle beneath the ~2.05 Ga BushveldComplex exhibits anomalously reduced velocities,which may be due either to compositional variationsresulting from mantle fertilization during Bushveldmagmatism or to thermal variations from more recentmagmatic events associated with 183 Ma Karoovolcanism.
AcknowledgmentsThe existence of the Kaapvaal Project owes much to the efforts and enthusiasm of Anglo-American’sindefatigable Eddie Kostlin. Special thanks goes toMaarten de Wit, Steve Richardson, and John Gurney fororganizing the Kaapvaal Craton Workshop in Capetown,South Africa, and to all of the participants thatcontributed to its success. The seismic component of theproject was made possible by the efforts of a largeinternational team of scientists and technicians (seehttp://www.ciw.edu/kaapvaal). The exceptional qualityand volume of the Kaapvaal array and Kimberley arraydatasets are due in no small part to the Herculean effortsof two people. Dr. Rod Green of Green’s Geophysicssited and constructed the vast majority of the broadbandinstallations, deployed many of the stations himself, andtended to the on-site array operation during theexperiment. Seismology technician extraordinaire RandyKuehnel activated most of the seismological equipmentand trained crews in southern Africa in the art of
servicing stations and collecting data. Thanks also to thevery able personnel of the IRIS/PASSCAL InstrumentCenter, and specifically to Carl Ebeling, forinstrumentation and logistical assistance. Many othershelped with data acquisition, including Sue Webb, Dr. Jock Robey, Josh Harvey, Lindsey Kennedy, Dr. Frieder Reichhardt, Magi Reichhardt, Jane Gore, Dr. Teddy Zengeni, Tarzan Kwadiba, Cedric Wright,Peter Burkholder, Mpho Nkwaane, Rhod McRae-Samuel,and several other members of the DeBeers geologygroup in Kimberley. We thank the extraordinarilyefficient staff of the IRIS Data Management Center whoarchived and distributed the data collected by thisexperiment. Susan Webb provided digitized geologicterrane boundaries for map figures. This manuscriptbenefited from careful reviews from Susan Webb andJeroen Ritsema. Funding for the Kaapvaal Project wasprovided by U.S. National Science Foundation (NSF)award EAR-9526840. MJF was supported by NSF awardEAR-0126199 and a Harry Oscar Wood PostdoctoralFellowship while at the Carnegie Institution ofWashington.
ReferencesAnderson, D.L. (1979). The deep structure of continents. Journal of
Geophysical Research, 84, 7555-7560.
Assumpçao, M., James, D. and Snoke, A. (2002). Crustal thicknesses in SE
Brazilian Shield by receiver function analysis: Implications for isostatic
compensation. Journal of Geophysical Research, 107. Doi:
10.1029/2001JB000422.
Boyd, F.B. and McCallister, R.H. (1976). Densities of fertile and sterile garnet
peridotites. Geophysical Research Letters, 3, 509-512.
Brey, G.P. and Kohler, T. (1990). Geothermobarometry in four-phase
lherzolites II: New thermobarometers and practical assessment of existing
thermobarometers. Journal of Petrology, 31, 1353-1378.
Buick, I.S., Maas, R. and Gibson, R. (2001). Precise U-Pb titanite age
constraints on the emplacement of the Bushveld Complex, South Africa.
Journal of the Geological Society of London, 158, 3-6.