RESTRICTED GENERAL AGREEMENT ON BOP/W/142 28 February 1992 Limited Distribution TARIFFS AND TRADE Committee on Balance-of-Payments Restrictions 1991 CONSULTATION WITH INDIA UNDER ARTICLE XVIII:12(a) Background paper by the Secretariat This paper has been prepared in accordance with paragraph 7 of the Declaration on Trade Measures Taken for Balance-of-Payments Purposes, adopted by the CONTRACTING PARTIES on 28 November 1979 (BISD 26S/207). I. Previous consultations with India 1. India has consulted regularly with the CONTRACTING PARTIES on its balance-of-payments restrictions, initially under Article XII, and, since 1960, under Article XVIII, section B (see BISD 8S, page 74, paragraph 3). Full consultations have been held in 1960, 1962, 1964, 1967, 1969, 1973, 1978. 1987 and 1989: simplified consultations under the procedures introduced in 1972 (BISD 205/47) have been held in 1975, 1977, 1980, 1982, 1984 and 1986. 2. At the last full consultation under Article XVIII: 12(b), held in October 19S89, the Committee noted that India's balance-of-payments and reserves position had deteriorated markedly since the last consultation, due to a number of factors including the effects of rapid economic growth on the demand for imports and a sharp rise in debt repayment obligations. It noted that future pursuit of more rapid growth in India's economy was likely to imply continuation of pressures on the balance of payments. It took note of the view expressed by the IMF that control of fiscal deficits, monetary restraint and a supportive exchange rate policy would be necessary to contain any further deterioration in the external position without intensifying import restrictions, and recognized that these efforts would need to be complemented by adequate aid flows and access to markets. The Committee welcomed the steps being taken. by India, despite growing difficulties, to liberalize and expand trade, including the easing and rationalization of import and export regulations and procedures. It noted that the structure of restrictions remains broad and complex, and encouraged the Indian authorities to continue as vigorously as feasible the process of simplification and liberalization, bearing in mind the provisions of the 1979 Declaration. 3. The Committee also noted that the Indian authorities were in the process of improving the transparency of import policy by drawing up a 92-0246
Transcript
RESTRICTED
GENERAL AGREEMENT ON BOP/W/14228 February 1992
Limited Distribution
TARIFFS AND TRADECommittee on Balance-of-Payments Restrictions
1991 CONSULTATION WITH INDIA UNDERARTICLE XVIII:12(a)
Background paper by the Secretariat
This paper has been prepared in accordance with paragraph 7 of theDeclaration on Trade Measures Taken for Balance-of-Payments Purposes,adopted by the CONTRACTING PARTIES on 28 November 1979 (BISD 26S/207).
I. Previous consultations with India
1. India has consulted regularly with the CONTRACTING PARTIES on itsbalance-of-payments restrictions, initially under Article XII, and, since1960, under Article XVIII, section B (see BISD 8S, page 74, paragraph 3).Full consultations have been held in 1960, 1962, 1964, 1967, 1969, 1973,1978. 1987 and 1989: simplified consultations under the proceduresintroduced in 1972 (BISD 205/47) have been held in 1975, 1977, 1980, 1982,1984 and 1986.
2. At the last full consultation under Article XVIII: 12(b), held inOctober 19S89, the Committee noted that India's balance-of-payments andreserves position had deteriorated markedly since the last consultation,due to a number of factors including the effects of rapid economic growthon the demand for imports and a sharp rise in debt repayment obligations.It noted that future pursuit of more rapid growth in India's economy waslikely to imply continuation of pressures on the balance of payments. Ittook note of the view expressed by the IMF that control of fiscal deficits,monetary restraint and a supportive exchange rate policy would be necessaryto contain any further deterioration in the external position withoutintensifying import restrictions, and recognized that these efforts wouldneed to be complemented by adequate aid flows and access to markets. TheCommittee welcomed the steps being taken. by India, despite growingdifficulties, to liberalize and expand trade, including the easing andrationalization of import and export regulations and procedures. It notedthat the structure of restrictions remains broad and complex, andencouraged the Indian authorities to continue as vigorously as feasible theprocess of simplification and liberalization, bearing in mind theprovisions of the 1979 Declaration.
3. The Committee also noted that the Indian authorities were in theprocess of improving the transparency of import policy by drawing up a
92-0246
BOP/W/142Page 2
detailed schedule of import restrictions on a tariff line basis, accordingto the Harmonized System. The Committee, welcoming this development,invited India to notify such a list to GATT as soon as possible. TheCommittee took note of all the points made regarding elements relating tothe need for access for India's exports, under paragraph 12 of the 1979Declaration. It recognized that the Uruguay Round negotiations remainedthe most appropriate forum within which the problems raised by India shouldbe resolved.
4. Subsequently, at a meeting in March 1991, some members of theCommittee took note of new restrictions notified by India in L/6765. Theserestrictions had, in their view, intensified the overall level - India'simport restrictions substantially and merited the holding of a consultationduring 1991 pursuant to Article XVIII:12 (a).
5. Following further informal discussion, it was agreed by the GATTCouncil that a consultation under Article XVIII:(a) would be held inNovember 1991 according to the normal procedures for full consultations.2(C/M/249). In November, however, the consultation was postponed to March1992 due to the constraints of the Uruguay Round (BOP/R/196).
II. India's trade regime: General background and recent developments
Introduction
6. Trade policy in India has historically reflected its importsubstitution strategy, together with structural problems in the field ofbalance of payments. This has involved extensive protection of domesticindustry complemented by export promotion.
7. Changes in trade policy since the mid-1980s have attempted to impartgreater continuity and stability to trade policy by announcing it for threeyears; provide quicker and easier access to inputs by making more itemsavailable under Open General Licence; provide further incentives forexporting; encourage greater efficiency in.import substitution; facilitatetechnological upgrading and modernization; and gradually substitutetariffs for quantitative restrictions.
1The note on the meeting is contained in BOP/R/192.
2BISD 18S/48.
BOP/W/142Page 3
8. In response to a balance of payments crisis, restrictions were
re-introduced temporarily on imports of a number of capital goods, raw
materials, components, spares etc., and some other items, from20 July 1990. Some of these restrictions were eased in October 1990.Between March and July 1991, exchange restrictions were generallytightened, while easing exchange regulations applying to exporters.During the same period, a number of tariff changes were also made.
9. Since July 1991, the Indian Government has been easing importlicensing conditions, particularly for exporters and export-orientedindustries. Further plans include the liberalization of most importlicensing for capital goods and raw materials, the introduction of moreliberal foreign exchange conditions and the convertibility of the rupeewithin three to five years.
10. A new industrial licensing policy has also been announced which is inpart aimed at facilitating foreign investment in India.
Import Policy
11. India's import policy divides imports into three categories:consumer goods, intermediate goods and capital goods. The policy does notpermit imports of consumer goods, except for a limited range of essentialcommodities such as foodgrains, edible oils, medicines, books and specifiedfabrics.
12. The means of regulating permitted imports include both tariffs andquantitative restrictions, often used in conjunction. Importers areclassified as 'Actual Users', 'Registered Exporters' and others (seeAppendix 1). All imports require import licenses or a customs clearancepermit unless otherwise exempted. Goods can be imported under Open GeneralLicence, or through Supplementary Licences, Automatic Licences, CapitalGoods Licences, Import Replenishment (REP) Licences, Advance Licences,Import Licences and, until recently,5 Additional Licences (see Appendix 1
for a description of these licenses).
3See L/6765. L/6846.
4See L/6839.
5Actual user licences are divided into two categories: General Currency Area Licencesand Specific Licences, used for imports from specific countries.
BOP/W/142Page 4
13. The import regime for intermediate goods is based on the twincriteria of "essentiality" and "indigenous nor-availability". The importsof these goods are classified as (i) Banned, (ii) Restricted, (iii) LimitedPermissible, (iv) Canalised and (v) Open General Licence (OGL). The degreeof restriction implicit in these categories depends on the proportion ofdomestic demand that can be met through domestic production (and is not afunction of domestic prices of importable inputs - i.e. indigenousavailability is defined in physical rather than economic terms). The OpenGeneral Licence (OGL), includes goods which are deemed to be essential butof which there is no domestic production; for goods in the RestrictedList, Limited Permissible List and Canalised List, there is a varyingdegree of indigenous availability and imports may be allowed to meetshortages. Actual users (industrial) can usually import under OGL goodswhich do not appear on any of the lists. While import licenses are used ineach category, their allocation becomes increasingly stringent according towhether the goods are under OGL, in the Limited Permissible List, or on theRestricted List. Furthermore, the licences (with the exception of importreplenishment licences issued to exporters) are non-transferable.
14. Most bulk imports of intermediate goods, including fertilisers, crudeoil, petroleum products, iron and steel, non-ferrous metals, newsprint andcement (and some consumer goods, e.g. foodgrains and vegetable oils) are"canalised" - i.e. purchased by the Government or State-tradingenterprises. The reasons for this include the expectation of obtainingmore favourable prices through bulk purchases, realising economies of scalein trading operations and planning for the volume of imports to manage thesupply of essential inputs and commodities.
15. The import regime for capital goods has a rationale similar to thatfor intermediate goods. Machinery and equipment imports are classifiedinto those on the Restricted List, those on the OGL List (i.e. eligible forimport by actual users subject to specified conditions), and those onneither list. In the last case applications for import by actual users aredecided on individual merit with import allowed on the basis of acertificate of essentiality by the sponsoring authority, indigenousclearance by the technical authority and approval by the concerned CapitalGoods Committee. The import of instruments is allowed under the sameprocedure as capital goods if imported as capital goods and underSupplementary Licensing if imported as components or spares.
Export PolicY
15. The Exports (Control) Order, 1988, regulates the export ofcommodities. Most items can be exported freely, but the export of some
BOP/W/142Page 5
items is not allowed (e.g. beef, butter and certain chemicals. metals andminerals) and of some others is subject to ceilings which are determined bydomestic requirements (e.g. grains and flour). Certain export items, suchas coal and coke, are canalised. Goods imported under OGL cannot beexported without the permission of the Chief Controller of Imports andExports, New Delhi.
17. Three kinds of incentives are provided to exporters:
(a) Fiscal incentives: These comprise a duty drawback system,reimbursing exporters for tariffs paid on the imported rawmaterials and intermediate goods, as well as central exciseduties paid on domestically produced inputs entering intoexport production; market development assistance, untilrecently consisting principally of a cash compensatory scheme(CCS) designed to enable exporters to meet foreign competition,to develop marketing competence and to neutralise disadvantagesinherent in the present stage of development of the economy;and partial exemption from income tax on export earnings.
(b) Import Entitlement Schemes: Under these, exporters receiveimport replenishment (REP) licences when domestic substitutesare inadequate in terms of price, quality or delivery dates.REP licences are freely transferable and normally trade at apremium. These licences are now issued at rates related to thevalue of exports, but until 4 July 1991 the rates used to bedifferent for different categories of exports.
(c) Free Trade Zones (FTZs) and 100 per cent Export Oriented Units(EOUs): Their rationale is to provide duty free access toimports of intermediate goods and technology on OGL, withoutany significant licensing restrictions. Units in FTZs areallowed to sell 25 per cent of their output in the domesticmarket against valid import licenses.
III. Changes since the last full consultation
18. The initial thrust of Government policy since 1989, was towardsgreater liberalization of the trade regime. The Import-Export Policy,1988-91 was terminated a year earlier than scheduled and the newImport-Export Policy, 1990-93 was put in place from 1 April 1990. Thepolicy moved towards reducing discretionary controls on exporters andactual users by allowing them to i:iport a broad range of capital goods,instruments, raw materials and components against REP and AdditionalLicences granted on the basis of past exports.
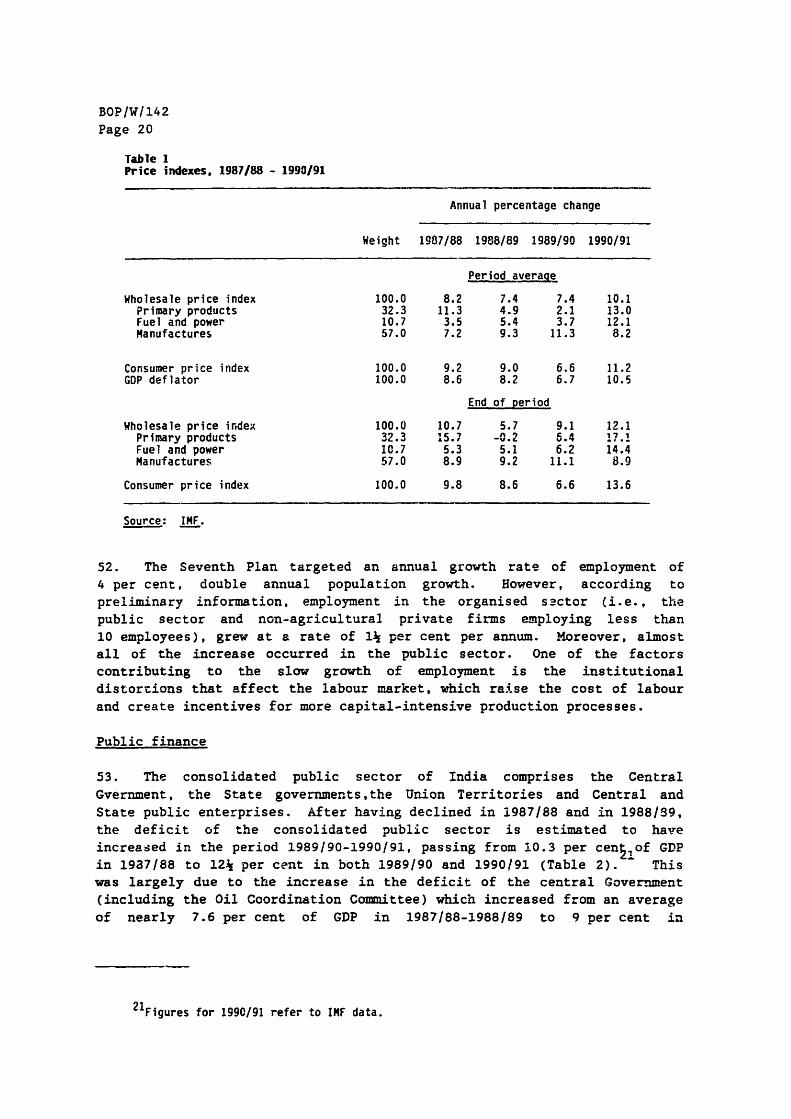
BOP/W/142Page 6
19. Following severe balance-of-payments problems in late 1990 and early1991, partly resulting from the Gulf crisis, trade and paymentsrestrictions were tightened between July 1990 and July 1991.
20. Since 4 July 1991, the new Government has announced structuralreforms in the area of trade policy, aimed at reducing and eliminatingimport licensing and at promoting exports. There have also beensignificant complementary changes in industrial policy, including measuresrelating to foreign direct investment.
The April 1990 Policy Changes
21. One of the main features of the Import-Export Policy 1990-93,introduced in April 1990, was a simplification of the Import ReplenishmentLicensing (REP) scheme, increasing the scope of the categories of itemsthat could be imported. Under the scheme, exporters, except those in thegems and jewellery sector, could obtain REP licences to replenish rawmaterials, components, consumables and packing materials used in themanufacture of products exported, provided these inputs were classified as'Limited Permissible" or "Canalised". To encourage the export ofelectronic products, import of restricted items was permitted on REPlicences earned against such exports made to General Currency Area (GCA)countries only. But the 1990 Policy still retained variable replenishmentrates for different categories, with the intention of encouraging exportsof higher value-added categories. The number of these rates was, however,reduced to four (i.e. 20 per cent, 15 per cent, 10 per cent and 5 per cent)with exceptions for handicrafts (40 per cent) and newspapers, journals andperiodicals (50 per cent).
22. Flexibility was also introduced in Additional Licences, which couldbe used for the import of raw materials and components classified asLimited Permissible or Canalised. Exporters displaying high exportperformance, categorised as Export Houses and Trading Houses (see Appendix1) were entitled to Additional Licences at the rate of 10 per cent of NFE,while the new category of Star Trading Houses (NFE of over Rs 750 million)were entitled to Special Additional Licences at the rate of 15 per cent.
23. A scheme for the import of capital goods by exporters at aconfessional rate of customs duty of 25 per cent of c.i.f. value wasintroduced. Under this scheme, regular manufacturer-exporters becameeligible to import capital goods up to a value of Rs 100 million (c.i.f.)with an obligation to undertake exports of a value equal to three times thevalue of the imported capital goods within a period of four years from thedate of import, in addition to maintaining the past average performance ofexports.
BOP/W/142Page 7
24. The 1990 Policy for the first time included service exports likesoftware, computer consultancy and management-consultancy in the REPscheme, with entitlements at the rate of 10 per cent of the net foreignexchange earned. The Duty Exemption Scheme, under which imports of rawmaterials, components and spares meant for export production can take placefree of tariffs, was also streamlined. To this end, a Blanket AdvanceLicensing Scheme" was introduced to eliminate some of the existingprocedural irritants. The Import-Export Pass Book Scheme (see Appendix 1)was abolished.
25. Several new elements were introduced in the policy regarding actualusers. Industrial actual users were entitled to automatic Licences toimport raw materials and components up to the value of 50 per cent of theSupplementary Licences issued to them in the preceding year to enableprocurement of the necessary inputs without delay. To provide support toindigenous research and development institutions and facilitatetechnological upgrading, regular R&D Units were permitted to import theirrequirements of raw materials, components, capital goods, instruments andessential professional grade consumer durables, including those in theRestricted List, under OGL, on their own certification. The import ofprecision measuring instruments, process control instruments and qualitycontrol instruments was liberalized to upgrade the quality of industrialproduction in general and export production in particular. Exporters, notentitled to any other export incentives, were provided ad hoc licences tothe value of 5 per cent of the f.o.b. value of their exports to facilitateimport of capital goods, spares and instruments necessary to upgradetechnology. Companies securing project contracts in India against globalcompetitive bidding were permitted to import machinery and equipmentrequired for project construction which did not involve the outflow offoreign exchange from the country, without the need for prior indigenousclearance from the Directorate-General of Technical Development. ServiceCentres recognised by the Development Commissioner for Small ScaleIndustries were permitted to import spares and components up to the valueof Rs 100,000 per annum to encourage their growth and help generateemployment for skilled technicians.
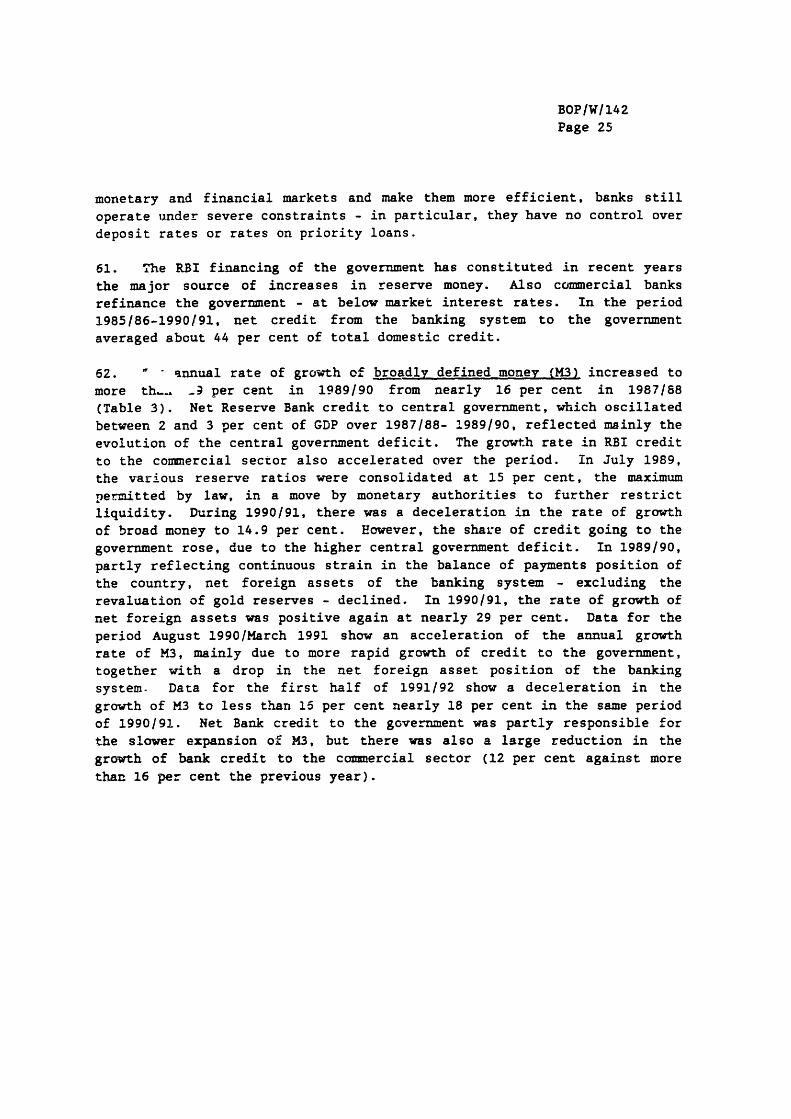
26. In the 1990 Policy, 82 capital goods, consisting mainly of machineryrelating to the electronics, textiles, food processing and sea foodsectors,were added to the OGL List. At the same time, 17 items of CapitalGoods were shifted from the OGL list because of their indigenousavailability. The imposition of restrictions on the import of goods oncethey are produced domestically seems to suggest that availability continuesto be defined in physical rather than economic terms. Twelve items wereadded to the list of life-saving drugs allowed for import under OGL. Theminimum value limit of Rs 5,000 on import licences issued to dealers
BOP/W/142Page 8
engaged in dry fruits trade was raised to Rs 20,000.
Other Changes in Import Policy in 1990
27. Soon after the announcement of the April 1990 Policy, several otherchanges were made. Primary product trade with Nepal was freed fromregulation. A similar facility was also granted to certain manufacturedmaterials from Nepal, where these contained not less than 65 per cent ofNepalese materials. The requirement of indigenous clearance was dispensedwith for capital goods imports under international competitive biddingprocedure for externally aided power projects.
28. From July 1990, in response to growing balance of paymentsdifficulties, steps were taken to curtail selected imports which wereperceived to be inessential or of low priority. Particular emphasis wasplaced on discouraging the build-up of stocks of imported inputs.Thirty-four items of capital goods and 13 items of raw materials wereshifted from the OGL list to the licensing category on 20 July 1990 (seeL/6765). The residual* category of imports under Open General Licence,comprising unlisted items of raw materials, components, consumables andspares, was shifted to the Limited Permissible list with effect from6 November 1990. Several items were shifted from OGL to the licensablecategory initially for a period of 3 months. These amendments were thenextended to the end of June, 1991 and further to the end of July, 1991.The import of gold for use by jewellery exporters was stopped, andprovisions made to supply jewellers with confiscated gold. The facilityfor the import of dry fruits for stock and sale purposes, and provisionsfor granting separate licences for the import of almonds, were withdrawnwith effect from 1 April 1991 (see L/6839).
29. Restrictions were also placed on the import of components, spares andraw materials, particularly in electronics, automobiles and consumerdurables. Actual Users engaged in the manufacture of automobiles,electronic items and consumer durables were required from 20 July 1990 tofollow the List Attestation Procedure (see Appendix 1) for import of rawmaterials and components under OGL (see L/6765). A 15 per cent cut was
6These included hydraulic baling presses for the jute industry, and certain items fromthe following categories: machinery for printing and allied processes. machine tools,cinematographic studio and film laboratory equipment, machinery for the manufacture oftelecommunication equipment and components, and dairy industry equipment.
BOP/W/142Page 9
made in the import of components, raw materials and after sales servicespares by Actual Users operating in the automobiles, electronics andconsumer durables sectors with effect from 24 July 1990 (see L16765). Thecut was applicable to imports under OGL as well as under SupplementaryLicences. On 9 October 1990, it was decided to exempt Actual Users engagedin the manufacture of automobile head lamps and bulbs, automobile bodies,automotive tyres and tubes, and plastic products manufactured by use ofimported polymers from these cuts (see L/6846). Furthermore, to preventthe curtailment of industrial production, the cuts can be restored on thesurrender of REP or Additional Licences (see L/6765). The cut of15 per cent on imports of raw materials components, consumables and sparesunder Open General Licence by Actual Users engaged in the manufacture ofautomobiles, electronics and consumer durables was withdrawn in August1991. Consequently, the requirement of obtaining OGL Import EntitlementCertificate for imports of listed OGL items, i.e. those appearing in Lists8 and 10 of Appendix 6 of the Import and Export policy for 1990-93, wasalso abolished (see L/6846).
30. The 1990/91 budget rationalized the existing customs duty rates(basic plus auxiliary) on imported items. At the same time, customs dutieswere increased on a broad range of items, including chemicals andpetrochemicals, iron and steel, and non-ferrous metals, while customsduties were reduced on imports of pharmaceuticals, standard newsprint,textiles, stainless steel and various machinery. In November 1990, thebasic customs duty on high grade, raw, ground sponge iron imported for themanufacture for iron powder was increased from 30 per cent ad valorem to50 per cent. The customs duty on computer equipment and software wasreduced by 25 per cent. Specific items, when imported for use inready-made garments or the hosiery industry, were exempted from basiccustoms duty in excess of 40 per cent ad valorem, and auxiliary duty inexcess of 5 per cent ad valorem. On 15 December 1990, the auxiliary dutyrates on imports were increased for product categories previously subjectto the rates of 30 per cent or 45 per cent, to 50 per cent, and for productcategories subject to the rate of 5 per cent, to 25 per cent. Importduties for carpet grade wool, other raw wool, rayon grade wood pulp andother wood pulp were also increased.
31. In March-July 1991, the Reserve Bank of India announced severalmeasures to moderate import growth and protect foreign exchange reserves.The cash margins/deposit requirements for opening Letters of Credit (LCs)for imports other than capital goods was raised from 50 to 133.33 per cent
7Ministry of Comerce Public Notice. No. 199-ITC (PN)/90-93, 29.08.1991.
BOP/W/142Page 10
on 19 March 1991, and then to 200 per cent on 22 April 1991. For importsunder specific licences, cash margins were specified at8 110 per cent.Margins for LCs under other categories were also raised. Imports ofcapital goods became permissible only through foreign currency lines ofcredit available with financial institutions or subsequently against 360days of supplier's credit (see L/6839). From 9th May 1991 a surcharge of25 per cent was imposed on bank credit for imports to discourage the use ofbank credits to finance imports. Subsequently, imports by units in ExportProcessing Zones, 100 per cent Export Oriented Units and by exporters ofmajor products were exempted from cash margin requirements to facilitatecritical imports required by the exporters. Recently, in view of theimprovement in foreign exchange reserves position and import compressionlevels achieved, the Reserve Bank of India reduced import curbs relating tocash margins requirements to 25 per cent with effect from 1 January 1992.
32. Consequent on the policy decision to withdraw subsidies on interestrates, and with a view to ensuring early repatriation of export proceedsand to make credit costly to those who delay repatriation of exportearnings, the RBI restructured the interest rates on pre-shipment andpost-shipment credit during April-October, 1991. To facilitateavailability of adequate export credit, the refinance facility by RBI tothe commercial banks was enlarged. For the first time in India, a schemefor pre-shipment credit in foreign currency was introduced by the Exim Bankon 28 November 1991, to finance foreign exchange costs of import inputs forexport production payable in foreign currency from the proceeds of therelevant exports on a self-liquidating basis. A new schenme forpost-shipment export credit, denominated in United States dollars, was alsointroduced by the RBI on 21 December 1991 as an additional finance facilityto exporters.
Policy changes since July 19919
33. Under policy changes introduced in July 1991, the ImportReplenishment Licensing Scheme has been enlarged and restructured. The REPlicenses have been renamed "EXIM Scrip" and are freely tradeable. 1 All
8The imports exempted from these restrictions include imports by Governmentdepartments, petroleum and lubricants, fertilizers. edible oils, newsprint. foodgrains andlife saving drugs.
9See document L/6969, 10 January 1992.
IOExports to hard currency areas were made eligible for Exim Scrips valid for hardcurrency imports while exports to rupee areas would be issued Exim Scrips valid for importsfrom these areas only.
BOP/W/142Page 11
exports, other than gems and jewellry, certain metal-based handicrafts,cinema films and books and journals, were accorded a uniform REP rate of?.0 per cent of the f.o.b value of exports - representing a significantincrease over the previous rates of between 5 per cent and 20 per cent formost categories. The new REP scheme clearly gives maximum incentive to
exporters whose import intensity is low since they are free to sell theirsurplus entitlements at a premium to other manufacturers.
34. A large number of items previously subject to various restrictionswere permitted to be imported using Exim Scrips:
- any items in the limited permissible or non-sensitive canalizedlists, and goods listed in List 8 part I and List 10 ofAppendix 6 of the Import/Export Policy 1990-93;
- export and trading houses were entitled to import 'limitedpermissible and 'non-sensitive canalized' items to the fullvalue of the additional licences given to them;
- imports of raw materials, components, consumables and spares,previously allowed against supplementary licences. For thesegoods no indigenous clearance or certification of essentialityis now required. The supplementary licensing system for mostraw materials, components and spares was abolished;
- manufacturers of capital goods listed in Appendix 4 of theImport/Export Policy were permitted to meet their fullrequirements of raw materials, components and consumablesthrough Exim Scrips; the facility was also extended to importsof after-sales service spares by manufacturers of machinery andequipment listed in Appendix 9 of the Order; replenishment of30 per cent was extended to a number of other products fromAppendix 12 of the Order;
- the category of Unlisted OGL was abolished and items previouslyfalling under the category were made importable only throughthe Exim Scrip scheme.
11For the exports of certain products, such as value-added agricultural products,electronics, bulk drugs, marine products and certain categories of advanced engineeringgoods, the Exim scrips rate has been set at 40 per cent of the f.o.b. value.
BOP/W/142Page 12
35. Given the changes in the trade regime, and the devaluation of theexchange rate, the Cash Compensatory Scheme was deemed redundant and wassuspended with effect from 3 July 1991. All imports actually affecteduntil midnight 2 July 1991, remained entitled to the benefits of CCS.
36. On 24 July 1991, the budget for 1991/92 introduced several changesin taxes on both imports and exports. The ad valorem rate of basic andauxiliary customs duties was reduced to a maximum of 150 per cent. Importduties on capital goods for general projects and machinery were reducedfrom 85 per cent to 80 per cent. More items were included in the list ofmachinery which is charged a concessional duty of 50 per cent under atechnology upgrading scheme. A duty relief of 10 percentage points wasgiven to almost every item which suffered an increase of 20 percentagepoints on 15 December, 1990. On some items, deemed to be important forreasons such as environmental protection and export promotion, the customsduty rates were rolled back to those prevailing before 15 December, 1990.12To encourage the growth of the finished Leather and artifical diamondindustries, the import duty on certain raw materials required by theseindustries was reduced from 150 per cent to 40 per cent. To promotetourism, the import duty on adventure sports equipment was reduced fromrates between 100 and 300 per cent to 40 per cent. Tax concessions werealso extended to exports of software and processed minerals, and to 100per cent Export Oriented Units.
3'. Further measures announced in August-October 1991 include:
- increased Exim Scrip allowances for exporters of engineeringgoods, stainless steel products; exporters operating under theDuty Exemption Scheme; producers of a variety of processedfood, drug, electronics and high technology engineeringproducts; exports made on the basis of duty free importsobtained against advance licences; 100 per cent ExportOriented Units and exporters operating in export processing orfree trade zones; exporters working under customs bond;
- simplification of procedures for imports of capital goods(including the indigenous availability clearance) and of thesystem of Advance Licences;
12These items include waste paper, wood in the rough, ethylene, machinery for fuelinjection equipment and certain items of machinery for printing and newspaper industries.
13See L/6959.
BOP/W/142Page 13
- transfer of a number of chemicals and other raw materials andconsumables from 'restricted' to "limited" permissible status;
- entitlement of a number of raw materials, components andconsumables to be imported against Exim Scrip
- de-canalization of some products, either to open generallicence or to Exim Scrip status;
- abolition of the 15 per cent cut on OGL imports bymanufacturers of cars, electronic items and consumable goods;
- further expansion of Exim Scrip facilities in September 1991;
- liberalization of certain foreign exchange procedures inrespect of Open General Licence items imported by manufacturerssubject to the Phased Manufacturing Programme.
38. A decision was made to harmonize the classification s stem used inthe import-export policy and the systems used by Customs. This wasintended to reduce the scope for discretionary decision making at lowerlevels and introduce greater transparency in the import policy, includingthe tariff structure. The office of the Chief Controller of Imports andExports was redesignated as the Directorate General of International Trade,with the principal function of promoting exports and facilitating imports.
39. Among the planned future changes are the removal over three yearstime of all import licensing for capital goods and raw materials, exceptfor a small negative list. Furthermore, all items except those that areessential are planned to be decanalised. It is planned to replace the EXIMScrip with Foreign Exchange Certificates (FECs) which will be more easilytradeable and more effective in the area of service exports. Finally, itis hoped to make the rupee fully convertible on the trade account in 3 to5 years.
14 copy of the import-Export Policy 1990-93 classified according to the HarmonizedSystem, was sent to the GATT Secretariat in November 1991 (L/6910).
BOP/W/142Page 14
IV. Changes in industrial policy
40. To complement the changes in trade policy, certain changes inindustrial policy were announced on 24 July 1991. These changes related to
the areas of industrial licensing, foreign investment, foreign technologyagreements, public sector policy and the Monopolies and Restrictive TradePractices (MRTP) Act. Industrial licensing was abolished for allindustries except for certain specified ones, which will continue to belicensed because of strategic and security concerns, safety andenvironmental concerns or because they produce articles of "elitistconsumption". To facilitate foreign investment in high priorityindustries, requiring large investments and advanced technology, approvalwas given for 51 per cent foreign equity ownership (instead of the previousthreshold limit of 40 per cent) in 34 categories of industries. Foreignequity will be required to cover the foreign exchange needed for importedcapital goods. The Reserve Bank of India will monitor the payment ofdividends to ensure that outflows of foreign exchange are balanced byexport earnings over a period of time. A four-member Board was formed tonegotiate with large foreign companies who intend to make long terminvestments in India, and serve as a single window clearance agency forprojects. The Government has decided to allow 100 per cent equityparticipation in the power sector and international companies have alsobeen allowed to explore natural gas and develop gas fields. The Government
will give automatic permission for technology agreements related to highpriority industries within specific parameters (a maximum lump sum paymentof Rs 10 million; or royalties of 5 per cent for domestic sales and8 per cent for exports, subject to total payments of 8 per cent of salesover a 10 year period).
41. Future public investment will mostly be limited to areas of strategicimportance, high technology, essential infrastructure and oils and mineralresources. Areas of exclusivity for the public sector are to be opened upto the private sector, while the public sector will also be allowed toenter areas not specifically reserved for it. In a bid to subject certainpublic enterprises to the discipline of the market, the Government hasdecided to partially disinvest its holding in the equity share capital ofthese companies. Accordingly, up to 20 per cent of their equity will beoffered to investment institutions, the employees and the general public.
15Industries which will continue to be licensed include coal, petroleum, sugar, motorcars, cigarettes, hazardous chemicals, drugs and pharmaceuticals.
16These include metallurgical industries. electrical equipment. industrial machinery.agricultural machinery. drugs and pharmaceuticals, hotels and tourism-related industry.
BOP/W/142Page 15
It has been recognised that the "interference" of the Government throughthe Monopolies and Restrictive Trade Practices Act in the investmentdecisions of large companies has had an adverse effect on industrialgrowth. The Government intends to restructure the KATP Act so thatapproval will no longer be required for the expansion of existing units orthe establishment of new undertakings by companies with assets overRs 1 billion. The provisions relating to mergers, amalgamations andtakeovers will also be repealed, Instead, the emphasis will be onregulating monopolistic, restrictive and unfair business practices.
V. Macroeconomic and trade developments17
Introduction
42. In the 'Last three years of the Seventh Five-Year Plan (1987/88-1989/90), the average annual rate of growth of India's real GDP was about64 per cent, 14 per cent above the Plan's target.1i Growth resultedlargely from a rapid expansion of industrial production - which benefitedfrom the liberalisation of industrial and trade policies - and the servicessector. Contrary to expectations, agricultural performance was poor exceptin 1988/89. The share of private investment in GDP averaged 13 per cent.Funds to finance increased investment came not from savings in the publicsector (as called for by the Plan), but rather from foreign sources. Thecontinuation of the process of import liberalisation to remove theanti-export bias of the trade regime, and the adoption of a flexibleexchange rate policy, were largely responsible for the significant growthof export volume. The international reserve position of India, however,weakened during the period 1987/88-1990/91 largely as a result of theincrease in the government budget deficit (especially in the budget of theCentral administration), which in turn widened the current account deficit.In the period 1987/88-1989/90, a number of measures to deregulate financialmarkets were taken, together with tax reforms seeking to widen the tax baseand improve tax administration. The recently approved 1991/92 budgetcontains taxation and expenditure reforms that aim at achieving a notablereduction in the overall public sector deficit.
17Data contained in this section are drawn principally from IMF sources.
18The fiscal year starts on April: 1.
BOP/W/142Page 16
Aggregate supply and demand
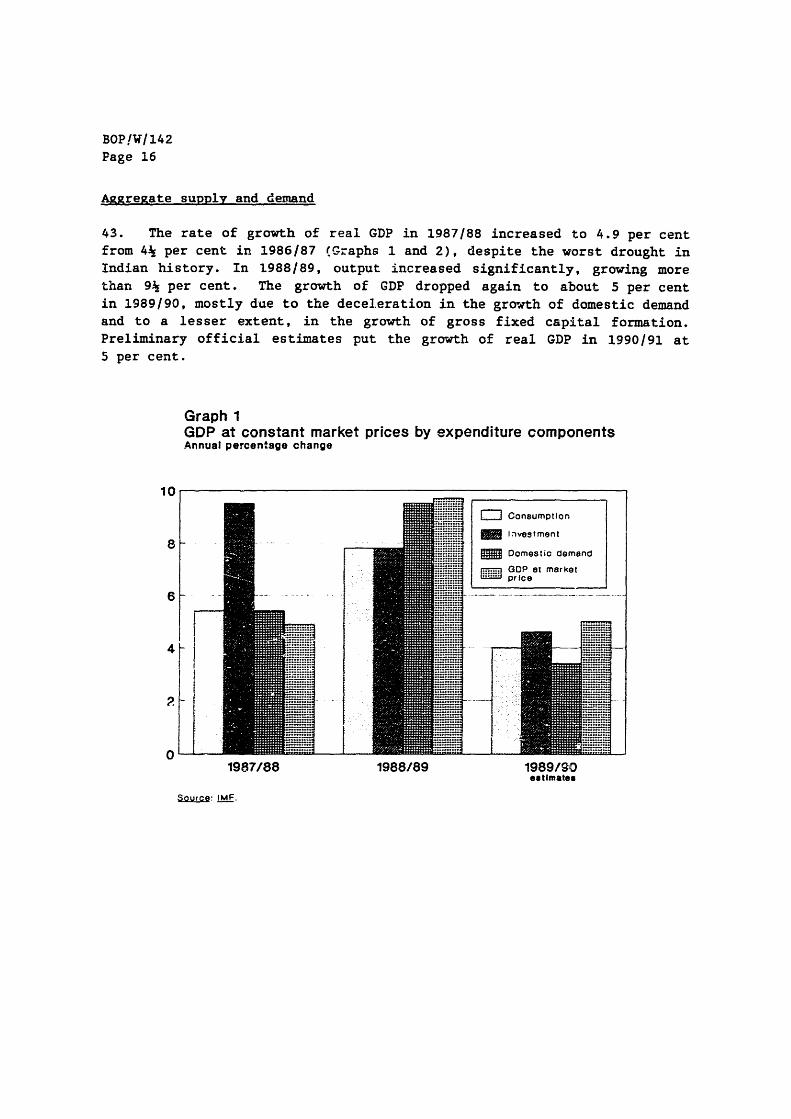
43. The rate of growth of real GDP in 1987/88 increased to 4.9 per centfrom 44 per cent in 1986/87 (Graphs 1 and 2), despite the worst drought inIndian history. In 1988/89, output increased significantly, growing morethan 94 per cent. The growth of GDP dropped again to about 5 per centin 1989/90, mostly due to the deceleration in the growth of domestic demandand to a lesser extent, in the growth of gross fixed capital formation.Preliminary official estimates put the growth of real GDP in 1990/91 at5 per cent.
Graph 1GDP at constant market prices by expenditure componentsAnnual percentage change
10
. Consumption
Investment
Domestic demand
GDPat market
4-
01987/88 1988/89 1989/90
estimates
Source IMF.
BOP/W/142Page 17
Graph 2GDP at factor cost by sectorAnnual percentage change
16
14Agriculture
12 _ iIndustryb __ _ .:: Services
10 _ _ _ <8 _ _ Air ~~~~~~~~~~~~~~~~~~~~~~...... ...6
4
6 _ .-.:,-..IE...... .... -- .. o _ ...~~~~~~~.......... ..._ a/ '.'.i-.' ' l , ,., ~~~~~~~~~~~~~~.......+.....',~~~~~~~~~~~~~~. .'..''.-.:-.......
2.. ....... -!
1987/88 1988/89 1989/90a Includes mining and quarrying estimatesb ticludes manufacturing. construction. electricity. gas and weter supplySource: IMF
44. In 1987/88, despite the effects of drought, the share of domesticcapital formation in GDP rose to nearly 224 per cent as a result of thestrength of private sector investment. The public sector, in contrast,reduced capital formation in an effort to maintain total outlays withinbudgeted limits in case of a rise in current expenditure. Domestic capitalformation was on average about 24 per cent of GDP in 1988/89-1989/90, thehighest level since 1950/51. This resulted from the continued buoyancy ofthe private sector's gross capital formation.
45. In 1987/88, gross domestic savings increased to nearly 204 per centof GDP despite the decline in savings of the public sector (reflectingprimarily increased central government current expenditure). In the period1988/89-1989/90, gross domestic savings continued to rise, reaching21.7 per cent of GDP (the second highest level since 1950/51) while publicdomestic savings (the excess of public receipts over public currentexpenditure - -iaich excludes government capital expenditure) declined tojust 1.7 per cent of GDP. Largely due to the continuation of the financialliberalisation programme, which drew resources into new assets offering ahigher real return and strong income growth, domestic private savingsjumped from 18 per cent of GDP in 1987/88 to 20 per ceit in 1989/90.
BOP/W/142Page 18
46. In 1987/88, agricultural output in value added terms showed almost nogrowth (about ls per cent) as rainfall was 80 per cent below normal levelsin 60 per cent of the country. With the exception of oilseeds andsugarcane, the output of all crops declined. Agricultural output recoveredin 1988/89, growing 15 per cent. Good rains, the effects of price changesand the largest ever rise in the consumption of fertilisers (more than25 per cent), contributed to the strong recovery (yields per hectare forall major crops increased between 13 and 31 per cent). In 1989/90, valueadded in agriculture grew a modest 2.7 per cent, causing agriculture'sshare in GDP to fall to just over one-third.19
47. After a slowdown in the pace of reform in 1987/88, the Indiangovernment continued its policy of liberalization of industrial activityduring the period 1988/89-1990/91. Measures included the halving of thenumber of industries requiring licenses to expand capacity; an increase inthe threshold for investment and foreign exchange outlays requiringlicense; a further relaxation of controls on market activities of dominantcompanies; greater freedom for firms to adjust their output capacity toimprove cost-efficiency in the long-run; the simplification of proceduresfor manufacturers to use licensed capacity to produce similar products(broadbanding); establishing growth centres to facilitate the location ofindustries in less developed regions; and steps to simplify theadministration of industrial policy by removing procedural impediments.Similarly, trade policy liberalisation has improved firms' access tocheaper imported inputs, while export promotion policies together with amore flexible exchange rate policy, have resulted in a doubling of thevolume of manufacturing exports. Despite these positive developments,there has been an increase in the number of firms which the Indiangovernment has placed on its official 'sick firm' list. Policy measuresfor the revival of sick industrial units continued to be pursued,contributing to the increase in subsidies and thus to the budget deficitproblems. At the end of 1988, the total of 'sick' and "weak, units was242,584, of which nearly 93 per cent were considered non-viable. Totaloutstanding bank credit to all units was nearly 2 per cent of 1988/89 GDP,with 45 per cent of it locked into non-viable units.
48. In 19872(88, industrial output in value added terms grew a robust6.7 per cent. Growth of the manufacturing sector was almost 8 per cent.Largely as a result of government incentives to promote the electronics and
19Government subsidies on imported and domestically produced fertilisers increased from0.6 per cent of GDP in 1987/88 to 1 per cent in 1989/90.
20Industry includes manufacturing, construction, electricity, water and gas supply.
BOP/W/142Page 19
computer sector, electric machinery was the fastest growing sector,followed by chemicals and chemical products (except petroleum and coal) andother manufacturing. In 1988/89, value added by industry rose about8 per cent and in 1989/90, more than 64 per cent, accounting for 27 percent of GDP. In 1988189-1989/90, manufacturing grew at an average rate ofmore than 84 per cent. The most rapidly growing sectors in 1989/90included textile products, non-metallic products and machinery and machinetools. In 1989/90, instead, gross output growth was more evenlydistributed across sectors. The growth of industrial productiondecelerated in 1990/91. However, the deceleration was confined to themining and electricity sectors as manufacturing output growth jumped to9.2 per cent. In the first half of 1991/92, industrial production wasinhibited by import restrictions. Raw materials, components and capitalgoods have been particularly scarce.
49. In 1988/89-1989/90, crude oil production recovered growing at anaverage rate of 6 per cent, after a small decline in 1987/88. Refineryoutput grew between 24 per cent and nearly 64 per cent largely due toincreased capacity utilization. However, both sectors reported decliningoutput in 1990/91. Crude oil production dropped more than 54 per cent,partly due to disturbances in Assam. In the period under analysis, importsof oil continued to increase.
50. During the period 1987;88-1989/90, the services sector continued toincrease its share of total output reaching 39 per cent in 1989/90. The7 per cent average annual growth in the period 1987/88-1989/90 resultedDrimarily from the strong growth of industrial demand for transportationand trade related-services, the liberalisation of financial markets whichgenerated high rates of growth of banking and insurance services, and therapid growth of public administration and defence.
Prices and employment
51. Inflation declined modestly over the period 1987/88-1989/SO(Table 1). In 1989/90, however, two events foreshadowed a future worseningof inflation in India: (1) the rise in the central government deficit andthe corresponding increase in the growth of broad money (M3); and (2) theincrease in the domestic money price of imports that resulted from a largedepreciation of the rupee. As a result, and despite an excellentagricultural performance, the March 1990 wholesale price index (end ofperiod) was 9.1 per cent above the year earlier level. Inflation continuedto accelerate in 1990/91 as the wholesale price index rose by 12.1 per centand the change in the consumer price index more than doubled to13.6 per cent. In the first five months of 1991/92, the consumer priceindex rose by 13 per cent, compared to less than 10 per cent in the sameperiod of 1990/91.
BOP/W/142Page 20
Table 1Price indexes. 1987/88 - 1990/91
Annual percentage change
Weight 1987/88 1988/89 1989/90 1990/91
Period average
Wholesale price index 100.0 8.2 7.4 7.4 10.1Primary products 32.3 11.3 4.9 2.1 13.0Fuel and power 10.7 3.5 5.4 3.7 12.1Manufactures 57.0 7.2 9.3 11.3 8.2
Wholesale price index 100.0 10.7 5.7 9.1 12.1Primary products 32.3 15.7 -0.2 5.4 17.1Fuel and power 10.7 5.3 5.1 6.2 14.4Manufactures 57.0 8.9 9.2 11.1 8.9
Consumer price index 100.0 9.8 8.6 6.6 13.6
Source: IMF.
52. The Seventh Plan targeted an annual growth rate of employment of4 per cent, double annual population growth. However, according topreliminary information, employment in the organised sector (i.e., thepublic sector and non-agricultural private firms employing less than10 employees), grew at a rate of 14 per cent per annum. Moreover, almostall of the increase occurred in the public sector. One of the factorscontributing to the slow growth of employment is the institutionaldistortions that affect the labour market, which raise the cost of labourand create incentives for more capital-intensive production processes.
Public finance
53. The consolidated public sector of India comprises the CentralGvernment, the State governments,the Union Territories and Central andState public enterprises. After having declined in 1987/88 and in 1988/99,the deficit of the consolidated public sector is estimated to haveincreased in the period 1989/90-1990/91, passing from 10.3 per cenjof GDPin 1987/88 to 124 per cent in both 1989/90 and 1990/91 (Table 2). Thiswas largely due to the increase in the deficit of the central Government(including the Oil Coordination Committee) which increased from an averageof nearly 7.6 per cent of GDP in 1987/88-1988/89 to 9 per cent in
21Figures for 1990/91 refer to IMF data.
BOP/W/142Page 21
1989/90-1990/91. The finances of the States and Union Territories alsodeteriorated in the period under consideration, passing from an averagedeficit of 3.8 per cent of GDP in 1987/88-1988189 to an estimated44 per cent in 1990/91. The major factors behind these developmentsinclude stagnant revenue, the increasing burden of interest payments, andthe growth of subsidy outlays. Interest paid by the central governmentreflected both a larger debt and higher interest rates. Domesticliabilities of the central government grew from less than 52 per cent ofGDP in 1987/88 to nearly 544 per cent of GDP in 1990/91, and the governmenthad to pay higher interest rates due to increased competition for funds asfinancial market liberalization proceeded.
Table 2Consolidated Public Sector. 1987/88L199C091l
Revenue and grants 22.7 22.2 22.9 23.4 21.6Total expenditure and
net lending 32.9 32.1 35.3 33.8 34.2
Overall deficit C-) -10.3 -10.0 -12.5 -10.4 -12.5
a/ Covers consolidated budgetary transactions at Central and State Governmentsincluding Central and State public enterprises and the Oil CoordinationCommittee (OCC).
b/ Including internal resources of Central and State enterprises.c/ Including investment spending by Central and State enterprises.
Source: IMF.
BOP/W/142Page 22
54. Total revenue and grants of the central government stagnated at11½ per cent of GDP in 1987/88-1990/91. Most of the tax revenue in theperiod 1987/88-1990/91 came from excise taxes (which remained the majorsource of tax revenue) and from taxes on international trade - importvolume growth was buoyant and the domestic currency depreciated. In
1990191, despite post-budget increases in custom duties and excise levies,tax revenue was lower than expected. Several tax reforms in recent yearshave widened the tax base, reduced the nominal marginal tax and streamlinedthe administration of the tax system. Changes in 1990/91 included anincrease in the exception limit on personal income; a widening of thepersonal income tax base; the simplification of the system of taxallowances; and the reduction of the rate of corporate income tax.
55. Total expenditure and net lending of the central government grew0.4 per cent of GDP to 20.1 per cent between 1987/88 and 1990/91. Thisresulted from a rise in current expenditure, largely on interest paymentsand subsidies. Gross interest payments rose from 17.2 per cent of totalexpenditure and net lending of the central government in 1987/88 to21.1 per cent in 1990/91. Over the same period, subsidies (notably forfertilisers and export promotion) rose from 9.1 to 10.3 per cent of totalexpenditure and net lending. Capital expenditure and net lending declinedduring the same period, mostly as a resu1i of the pressure to reduce theprimary deficit of the central government.
56. The Central government deficit has increasingly been financed by thedomestic banking system, notably the Reserve Bank of India (RBI) (Graph 3).The share of domestic financing is estimated to have increased from nearly894 per cent in 1987/88 to nearly 93 per cent in 1990/91. After increasingto nearly 69 per cent in 1989/90, the share of the banking system droppedto 61 per cent in the 1990/91 budget. Budget financing through fa11savings' rose from 144 per cent in 1987/88 to 20 per cent in 1990/91.
220ata supplied by the Indian authorities show a small decline in total CentralGovernment expenditure but a larger rise in subsidies.
23Small savings include post office deposits, national' savings, and social securitycertificates.
BOP/W/142Page 23
Graph 3Sources of Central Government budget deficit financing"Share
80
R0
40
20
External financing M Banking system
Em Small savings _ Other
O7LSt rUIU ranIrlE\1987/88 88/89 89/90 90/911,
el Excludes 00C balance.b/ officIel revised estimate.Source: IMF.
57. After some improvement in 1988/89 mostly due to a decline inexpenditure that more than offset a drop in tax revenue, the finances ofthe State and Union Terr-itories worsened in 1989/90, causing their budgetdeficit to increase to 4.1 per cent of GDP. According to IMF estimates for1990191, the deficit increased further to 44 per cent of GDP. The majorfactors behind this widening of the deficit were a rise in non-developmentexpenditure and interest payments. Beginning in 1990/91, transfers fromthe Central government to the States will be based on the projecteddeficit; any overrun will not be covered by the Central government.
58. The central government budget for 1991/92 aims to achieve a deficitof 64 per cent of GDP against an estimate of 9 per snt the previous year.A number of measures for controlling expenditures and increasing governmentrevenue are called for. On the expenditure side, it is recognised that thereduction of interest payments is possible only in the medium-term as aby-product of the reduction of the overall budget deficit (interestpayments for the fiscal year 1991/92 are estimated to have risen to about42 per cent of central government revenue. Expenditure-reducing measuresinclude the elimination of export subsidies; the freeing of the prices andtrade of certain fertilisers; an increase of 30 per cent in the price ofall other fertilisers (the first in 10 years); the elimination of thesubsidy on sugar; and increases of between 10 and 20 per cent in the
BOP/W/142Page 24
prices of petroleum products (excluding kerosene for non-industrial use anddiesel). In contrast, a 6 per cent rise in food subsidies is provided for.Different schemes for assistance to agriculture are to be continued and newones introduced, including credit availability to offset the rise in theprices of fertilisers.
59. In the central government budget for 1991/92, a number of measuresare to be taken on the revenue side. These include reductions of taxes ondividend income and long-term gains obtained by offshore funds; the saleof 20 per cent equity in selected public sector undertakings; a rise incorporate taxes; the reduction of the depreciation rate allowed for taxbenefit; the increase of the basic exemption from taxes on long termcapital; the withdrawal of the tax exemption for the IndustrialDevelopment Bank; and a new tax of 3 per cent on interest earnings offinancial institutions, banks and private finance companies. In order toprovide for foreign exchange mobilisation, incentives have been given toprofessionals earning income in a foreign currency, including authorisingthe State Bank of India to issue bonds denominated in. U.S. dollars withinterest exempt from tax and no limit on total investment. In the area ofindirect taxes, the budget provides for reductions in most categories ofexcise and customs duties, while cigarettes and consumer durables are infor higher taxes.
Money and credit
60. The Indian financial system comprises the Reserve Bank of India(RBI), commercial banks, specialized lending institutions and other nonbankinstitutions. The Government determines annual targets for aggregate andsectoral credit expansion, although there has been a progressive switch totargeting monetary aggregates instead. The responsibilities of the RBI gobeyond the management of monetary and credit conditions to include theprovision of financing to the public sector - the Central government andthe States - and of preferential financing to specifies activities.Recently, advances to the States have been severely limited. Although asignificant number of measures have been taken since 1985/86 to liberalize
24The instruments of monetary policy used by the RBI are the cash reserve ratio (now atthe maximum permitted level of 5 per cent) and an additional statutory liquidity ratio(SLR); refinance policy by the Reserve Bank (used mostly for exports in the last part of the1980's); bank lending guidelines; selective credit controls (including priority creditguidelines); interest rate policy; and open market operations.
BOP/W/142Page 25
monetary and financial markets and make them more efficient, banks stilloperate under severe constraints - in particular, they have no control overdeposit rates or rates on priority loans.
61. the RBI financing of the government has constituted in recent yearsthe major source of increases in reserve money. Also commercial banksrefinance the government - at below market interest rates. In the period1985/86-1990/91, net credit from the banking system to the governmentaveraged about 44 per cent of total domestic credit.
62. ' - annual rate of growth of broadly defined money (M3) increased tomore th- _3 per cent in 1989/90 from nearly 16 per cent in 1987/88(Table 3). Net Reserve Bank credit to central government, which oscillatedbetween 2 and 3 per cent of GDP over 1987/88- 1989/90, reflected mainly theevolution of the central government deficit. The growth rate in RBI creditto the commercial sector also accelerated over the period. In July 1989,the various reserve ratios were consolidated at 15 per cent, the maximumpermitted by law, in a move by monetary authorities to further restrictliquidity. During 1990/91, there was a deceleration in the rate of growthof broad money to 14.9 per cent. However, the share of credit going to thegovernment rose, due to the higher central government deficit. In 1989/90,partly reflecting continuous strain in the balance of payments position ofthe country, net foreign assets of the banking system - excluding therevaluation of gold reserves - declined. In 1990/91, the rate of growth ofnet foreign assets was positive again at nearly 29 per cent. Data for theperiod August 1990/March 1991 show an acceleration of the annual growthrate of M3, mainly due to more rapid growth of credit to the government,together with a drop in the net foreign asset position of the bankingsystem. Data for the first half of 1991/92 show a deceleration in thegrowth of M3 to less than 15 per cent nearly 18 per cent in the same periodof 1990/91. Net Bank credit to the government was partly responsible forthe slower expansion of M3, but there was also a large reduction in thegrowth of bank credit to the commercial sector (12 per cent against morethan 16 per cent the previous year).
BOP/W/142Page 26
Table 3Selected factors affecting changes in broad money (R3)
- Banking sector's netnon-monetary liabilitiesother than time deposits- (11.4) (13.3) (18.3) (26.8) ...
a/ Includes investment in securities by banks, RBI commercial credit, andcredit extended by cooperatives.
Source: Economic Survey 1990-91, Ministry of Finance, Government of India and IMF.
63. The growth of reserve money in India has traditionally been closelylinked to the size of the budget deficit. Between 1987/88 and 1990/91, RBIcredit to the government was the main factor explaining the growth ofreserve money (Graph 4), whereas in 1990/91, the other sources of change inreserve money had even a net contractionary effect. More specifically,net RBI credit to government represented about 74 percent of the184 per cent average annual change in reserve money in 1987/88-1988/89,while in 1989/90, an acceleration in the growth of reserve money to morethan 23 per cent was largely the result of a deterioration of the Centralgovernment finances - with net RBI credit to the government accounting formore than 96 per cent of the increase. Measures taken by the authoritiesto reduce liquidity resulted in a deceleration of the rate of growth ofreserve money to 13.1 per cent in the period 1990/91. However, net RBIcredit to the government was equivalent to nearly 300 per cent of the risein reserve money, but was partially offset by a strong net contraction inRBI credit to banks and to the commercial sector. Reserve money growthaccelerated again to more than 164 per cent in the first half of 1991/92.This was mostly due to the growth in net RBI credit to the government.However, claims to banks rose significantly (57 per cent against a declineof nearly 7 per cent in the same period of the previous year).
BOP/W/142Page 27
Graph 4Selected sources of change in reserve moneyBillion rupees, end of period
Assets Liabilities
1987/88 _____
1988/89
1989/90 _ _ _ _ _
1990/91
April-Sept1991/92 -W__, _ __ _
150 100 50 0 50 100 150
e'ea e ess.ems ___ pese- 'e
64. Bank interest rates in India have traditionally been setadministratively rather than by market forces. Beginning in April 1987 aseries of changes were introduced with the aim of reducing the cost offunds and imparting flexibility to interest rate policy. However, theGovernment continues to obtain a large part of its finance requirementsthrough issues of 3-month Treasury bills at a below the market rate of4.6 per cent, unchanged since 1974 (rates on 5-15 year bonds are in the10-11 per cent range). In 1989, money market rates on transactions amongbanks and financial institutions were freed, as were the rates payable onlarge deposits, including certificates of deposit (CDs). Interest rateceilings on non-priority leading were replaced by interest rate floorsresulting in higher rates on commercial bank loans. Measures accompanyingthe 1991/92 budget have authorised the private sector to float mutualfunds. As well the restrictions on the coupon rates on corporate bondshave been removed. In the first seven months of 1991 major increases haveoccurred in several interest rates.
BOP/W/142Page 28
Balance of payments and current account
65. During the second half of the 1980's, the Indian authoritiescontinued the process of structural reforms initiated at the beginning ofthe decade. These reforms have affected, directly and indirectly, thebalance of payments performance of the country (Table 4). Importliberalization measures reduced the anti-export bias of trade policy,lowered the costs of industrial imports and increased the efficiency of theexport sector. As a result, in the period 1987/83-1990(91, the volume ofmerchandise exports grew significantly. The flexibility of the exchangerate policy served to partly absorb the continuous deterioration in thecountry's terms of trade during the period (Graph 5). Nonetheless, thecurrent account deficit widened as fiscal and monetary imbalancesincreased. Interest payments on foreign debt also grew rapidly. After amarginal reduction in 1987/88, the current account deficit of India Isestimated to have increased to an average of 3.1 per c.nt of GDP in
1988/89-19-?/90 and to 3.4 per cent of GDP (or $ 9.8 billion" in 1990/91(Graph 7). The combination of an increased current account deficit and adecline in net capital inflows caused the level of international reserves(excluding gold) to drop to about two weeks of merchandise imports in June1991 from 4.5 months in 1987/88 (Graph 6). Reserves started to increase inSeptember, however, and were at $ 2.8 billion at the end of November 1991(equivalent to 1.4 months of 1990/91 imports).
25According to the Indian authorities, the Gulf crisis' impact on the current account -including a rise in Lie import bill, losses in workers' remittances, emergency repatriation.and export losses - amounted to about $ 2.9 billion.
a! Estimates.bt/ Excluding crude oil exports.c/ Including net crude oil imports.d/ Includes accrued interest on nonresident deposits.e/ Also includes valuation adjustment on non-bS. dollar reserves.
Source: IMF.
BOP/W/142Page 30
Graph 5Net barter terms of trade and real effectiveexchange rateAnnual percentage change; end of period
2
0
-2
-4
-6
-8
Net barterterms of trade
Real effectiveexchange rate
10 _
-12 .1987/88 1988/89 1989/90
Source IMF.
Graph 6International reserves (excluding gold)and months of merchandise imports
Months of Imports
1987/88 1988/89 1989/90 1990/91 November 1991
Nte: Import figures for June 1991 are considered with respect to merchandise Imports of 1990/91
Source: FS. IMF. August 1991.
1990/91
USS billion7
6
5
4
3
2
1
0
BOP/W/142Page 31
Graph 7Current account balancePercentage of ODP
0
-0.5
-1
-1.5
-2
-2.5
-3
-3.5
-41987/88 1988/89 1989/90 1990/91
estimates
Source: IMF.
A. Merchandise trade
66. In 1987/88-1990/91, the annual growth of the volume of merchandiseexports averaged about 12 per cent while the growth in the volume ofmerchandise imports averaged 34 per cent (Graph 8). The excellentmerchandise export performance was largely due to the improvement in theincentives given to exporters, including lower interest rates on exportcredit, more generous drawback and cash compensatory arrangements, morecompetitive access to raw materials and capital equipment because ofreduced trade barriers, and a more flexible exchange rate policy thatpermitted an average annual depreciation of the real exchange rate of therupee of about 7 per cent in 1987/88-1989/90. In 1990/91, export growthslowed mostly due to less buoyant world demand for imports and tradedevelopments in Central and Eastern Europe and the USSR (traditionallyimportant trading partners for India). The dollar value of merchandiseimports grew an average of about 12 per cent per annum in 1987/88-1990/91mostly due to rises in import prices. In the year 1988/89, the sharpincrease in the value of merchandise imports of more than 19 per cent wasdue to both domestic demand pressures and the restocking needs caused bythe previous years' drought. The trade deficit (on a customs basis) rose
BOP/W/142Page 32
to $ 5.5 billion in 1988189, declined to $ 4.6 billion in 1989/90, and roseagain to nearly $ 6 billion in 1990/91. (Graph 9) Recent data for thefirst half of 1991/92 show, however, more than a halving of the merchandisetrade deficit to about $ 1.34 billion (compared to S 3.04 billion in thefirst half of 1990/91). This resulted from a substantial reduction in thevalue of India's trade, but particularly of imports, which fell by17k per cent while overall exports dropped by more than 6 per cent.However, exports to hard currency areas rose more than 51f per cent, whileexports to rupee payment areas fell by 54 per cent.
Graph 8Value and volume of merchandise imports and exports,1987/88-1990/91 a/Annual percentage change
30
20
10
0
1987/88 1988/89 1989/90 1990/91a/ Bastnce of payments basis. not of crude oil exports.S9ourc: L tF
Graph 9Value of merchandise trade, 1987,88-1990/91aUSS billion
20
10
0
.,10
-20
-30-1987/88 1988/89 1989/90 1990/91
a Customs basis
lODcq: ED. IMF, August 1991.
BOP/W/142Page 33
67. Export growth was mainly in manufactured goods, whose share in totalmerchandise exports rose to nearly three quarters between 1987/88 and1990/91 (Table 5). Textiles and garments, engineering goods and chemicalswere the fastest growing categories. Reflecting the import liberalization--easures, the share of intermediate goods imports increased. Fertilizersand chemicals, petroleum products and gems were most conspicuous categories(Table 6). Over the period 1987188-1989/90, the volume of capital goodsimports fell to around one quarter of the total.
Table 5India - Principal merchandise exports.(Value percentage share)
Total merchandiseimports (c.i.f.) 17 157 19 504 21 252
a Estimates.
Source: IMF
BOP/W/142Page 35
68. The pattern of merchandise exports of India shows that between1987/88 and 1989/90 there was a shift towards trading with OPEC and EasternEurope at the expense of North America, the European Communities and Japan(Graph 10-11). This pattern was reversed afterwards.
Graph 10Regional pattern of merchandise exportsPercentage share
1987/88
0. 3
1989/90
9.9
7 2 4
25 1 17 1
22 1
I 5 19 3
|E iOrth America | OPEC |5 Japan M- Eastern EuropeIE EEC E Other
Source Economic Survey 1990-91. Ministry of Finance. Governmentof India
BOP/W/142Page 36
Graph 11Regional pattern of merchandise importsPercentage share
1987/88 1989/90
10.3
13.3
9.6 8.4
M North America U OPECEJapan M Eastern EuropeEl EEC E: Other
Source: Economic Surve QQ9-9 . Ministry oft Finence, Government of India.
a. The invisibles balance
69. In the period 1987188-1990/91, the services balance of India passedfrom a surplus of $ 742 million to a deficit of more than $ 1 billion. Thisresulted largely from the -increase in net outflows of net investmentincome, notably interest payments, as a result of the growing externaldebt. According to preliminary data for 1990/91, the rise in net inflowsrelated to tourism is likely to have stabilised due to the decline intourists arrivals. Workers' remittances, the major component of privatetransfers, were severely hit by the Gulf crisis in 199C/91 (however, theyhad been declining prior to the crisis). The crisis also imposed the costof repatriating non-resident Indians. Interest payments are estimated tohave continued their upward trend growing more than 15 per cent. Netreceipts of official transfers (including food assistance) are expected tohave increased more than 16 per cent.
13.3
BOP/W/142Page 37
B. The capital account and external indebtedness
70. In the second half of the 1980s, current account deficits exceededthe availability of aid on concessional terms. As a result, externalborrowing from commercial banks and deposits from non-resident Indians wereincreasingly used by the authorities. International reserves were alsoreduced. Consequently, the share of net external aid in current accountfinancing declined from 47 per cent 1987/88 to about 30 per cent in1990/91. Reduced need for drought-related aid and delays in providing thedomestic fund counterparts to foreign aid, were also responsible for thedecline. Net commercial borrowing together with non-resident depositssteadily increased their shares of total capital inflows from about474 per cent in 1987/88 to nearly 584 per cent in 1989/90. This share,however, declined in 1990/91 mostly as a result of a halving of the inflowsof non-resident deposits. Net direct investment and portfolio investmentinflows have risen between 1987/88 and 1990/91 but they are still a verymodest component of the capital account.
71. In 1990/91, provisional data show a slight drop in net aid inflows,excluding official transfers, of about $ 17 million to nearly $ 2980 million.Net commercial borrowing is estimated to have declined to $ 2.3 billion,largely as a result of the downgrading of India's credit rating in acontext of reduced availability of international credit. Net inflows underthe Foreign Currency Non-Resident Accounts declined by 89 per cent and theoutflow of Non-Resident External Rupee Accounts - not protected againstexchange rate risk - recorded some rise. According to the lateststatistics, the recent partial relaxation of foreign direct investmentrestrictions has not yet produced a significant change in this flow offunds. The financing need was covered by a further decrease in externalreserves and exceptional financing from the IMF. Measures adopted in July1991, strengthened somewhat the external liquidity position of India.
BOP/W/142Page 38
Graph 12External debt indicatorsPercentage
30
25
20
15
10
5
01987188 1988/89 1989/90 1990/91
estimatesNote: EDT refers to total external dent
TDS referS to totet Oats serviceXGS referS to current receipts
Source: !sF.
72. India's ratio of total external debt to GDP increased from less than214 per cent in 1987/88-1988/89 to an estimated 24 per cent in 1990/91(Graph 12). The value of total external debt of India was an estimated$ 66.5 billion in 1990191. The bulk was medium- and long-term debt whichrepresented more than 72 per cent, about the same proportion as in 1987/88;the share of short-term debt, in contrast, was 8.7 per cent up from lessthan 64 per cent in 1987/88; non-resident deposits represented more than15 per cent of the total in 1990/91, with debt to the IMP accounting fortne remainder. The share of long-term debt on concessional terms declinedover the period 1987/88-1990/91. The debt service ratio to current accountreceipts improved to 27.8 per cent last year (after peaking at almost30 per cent in 1988/89), reflecting mostly strong merchandise export growthand reduced liability toward the IMF. The share of interest payments intotal debt service increased to nearly 574 per cent in 1990j91 from about47 per cent in 1987/88.
BGP/W/142Page 39
C. The exchange rate system
73. India maintains a complex exchange rate system that affectsparticularly direct foreign investment, nonresident deposits and paymentsfor invisibles. There are also exchange restrictions resulting frombilateral payments arrangements. It applies a 15 per cent tax on foreignexchange for travel abroad and an exchange rate guarantee on interest andprincipal on foreign currency resident accounts. Recently, a number ofmeasures liberalising payments on current and capital accounts have beenintroduced (see Section IV).
74. India fixes the value of the rupee in relation to a weighted basketof currencies of major trading partners within a margin of 10 percent. Theintervention currency is the pound sterling. The RBI makes periodicchanges in the exchange rate. Between 1987/88 and 1990/91, the rupeedepreciated more than 38 percent with respect to the dollar and more than50 per cent with respect to the pound sterling and the deutsche mark. Thereal effective exchange rate depreciated an accumulated 28.7 per centbetween 1987/88 and 1990/91. Beginning in October 1990, the real exchangerate of the rupee appreciated as a result of a depreciation of the nominalexchange rate that did not fully offset inflation in India. Late in 1990,the RBI proceeded to adjust downward the nominal exchange rate. In July1991, the exchange rate was devalued by 18.7 per cent with respect to thedollar and the authorities announced their intention to keep the ratestable subsequently.
BOP/W/142Page 40
APPENDIX 1
1. Actual User means a person who applies forlsecures a licence for theimport of any item (or an allotment of an imported item) for his own use,and not for business or trade in it. Actual User (Industrial) means anindustrial undertaking engaged in the manufacture or any goods for which itholds a license or registration certificate from the appropriate Governmentauthority.
2. Registered Exporter means a person holding a valid RegistrationCertificate issued by an Export Promotion Council, Commodity Board or otherregistering authority designated by the Government for the purpose ofexport promotion.
3. Export House/Trading House/Star Trading House means a RegisteredExporter holding a valid Export House/Trading House/Star Trading HouseCertificate issued by the Chief Controller of Imports and Exports, NewDelhi. Export Houses are Registered Exporters with a net foreign exchangeearnings (NFE) of not less than Rs 60 million in the base period, TradingHouses have a NFE of not less than Rs 300 million, while Star TradingHouses have a NFE of not less than Rs 1250 million (with exports spreadover a minimum of two export product groups and the NFE from a singleproduct group not exceeding 75 per cent of the NFE prescribed forrecognition). Recently, an option has also been provided to get thesestatus based only on the past one year performance in terms of NFE. TheNFE Value for this purpose is Rs 120 million for Export House;Rs 600 million for Trading House and Rs 1500 million for Star TradingHouse.
4. General Currency Area Licences are valid for import from allcountries except those from which import is prohibited, while SpecificLicences are valid for import from specified country or countries(generally the former CMEA countries).
5. Open General Licence (OGL): Instead of licences for particularpurposes, the Government may give general permission fo: che import ofcertain goods, subject to specific conditions. Such permission is calledthe OGL. The list of such items is given in the publi.ned Import PolicyBook. Under OGL, the import of certain items is allowed for actual usersonly while other items can be imported for stock and sale purposes also.
6. Supplementary Licences: Actual Users (Industrial) whose requirementsof imported raw materials, components, consumables and spares cannot befully met under the provisions of the OGL or from the supplies by thecanalising agencies, may apply for the grant of a Supplementary Licence.Imports of goods on the Restricted List and the Limited Permissible List
BOP/W/142Page 41
may be allowed against such a licence. From 4 July 1991, SupplementaryLicences can only be used by producers in the small scale sector and thoseproducing life-saving drugs/equipment.
7. Automatic Licences: these can be used for the import of raw materialsand components (including those on the on the Restricted List and theLimited Permissible List) by all actual users (industrial) to the extent of50 per cent of the value of the Supplementary Licence issued to them in thepreceding year to enable procurement of the necessary imported inputswithout delay. The quantity/value of the regular Supplementary Licence issubsequently adjusted to take into account the Automatic Licence.
8. Advance Licences and Blanket Advance Licences are given in advance to
Registered Exporters to enable the duty free import of items used in themanufacture of the export product.
9. Import Replenishment (REP) Licences can be obtained by registeredexporters up to a specified percentage of the value of realised exports.These licenses are transferable and may be used to import raw materials,components, consumables and packing materials on the list of limitedpermissible and the list of non-sensitive canalised items. In addition,against the export of specific products, the REP Licences are valid for theimport of items on the restricted list and the list of sensitive canaliseditems. These licenses may also be used to import permissible capital goodswithout undergoing the essentiality and indigenous clearance requirements.For gems and jewellery, the import of all items required for exportproduction is allowed under these licenses.
10. Additional Licences are given to Export Houses, Trading Houses inaddition to their entitlement of REP Licences. They were transferable andcould be used like REP Licences.
11. Special Additional Licences are given to Star Trading Houses. Theyare transferable.
12. Diamond Imprest Licences allow the import of rough diamonds to beeventually exported as cut and polished diamonds. The value of suchlicences is debited to the REP entitlement.
13. Import-Export Pass Book Scheme (in use until 1 April 1990) wasdesigned to provide duty-free inputs for export production tomanufacturer-exporters and Export/Trading Houses. The maximum importentitlement was related to export performance, and the beneficiaries weresubject to certain export obligations.
BOP/W/142Page 42
14. List Attestation Procedure: Under this procedure customs authoritiesallow clearance of imported components under OGL on the basis of listsattested by the concerned sponsoring body.