40
ANDREW Y OUNG SCHOOL OF POLICY STUDIES

ANDREW YOUNG SCHOOL O F P O L I C Y S T U D I E S

1
The Airport Concession Industry:Important Issues and Trends
Bruce A. Seaman, Ph.D.*
Final VersionJuly 2011
Bruce A. Seaman is Associate Professor of Economics, the Andrew Young School of PolicyStudies, Georgia State University, and member of the Adjunct Faculty of the School of PublicPolicy at Georgia Tech. However, the research for this report was done independently.
2
I. Introduction
Airport growth in the United States was historically facilitated by long-term contracts withprime concession operators yielding guaranteed revenues, which was considered important tosupport the revenue bonds that were critical to the financing of airport expansion. As noted byBoudreau and Davies (2010/2011), such contracts were successful in guaranteeing concessionrevenues to airports, but they also “produced high prices, poor service, and lackluster shopsand restaurants with an unfavorable reputation that has taken years to overcome” (p. 3).
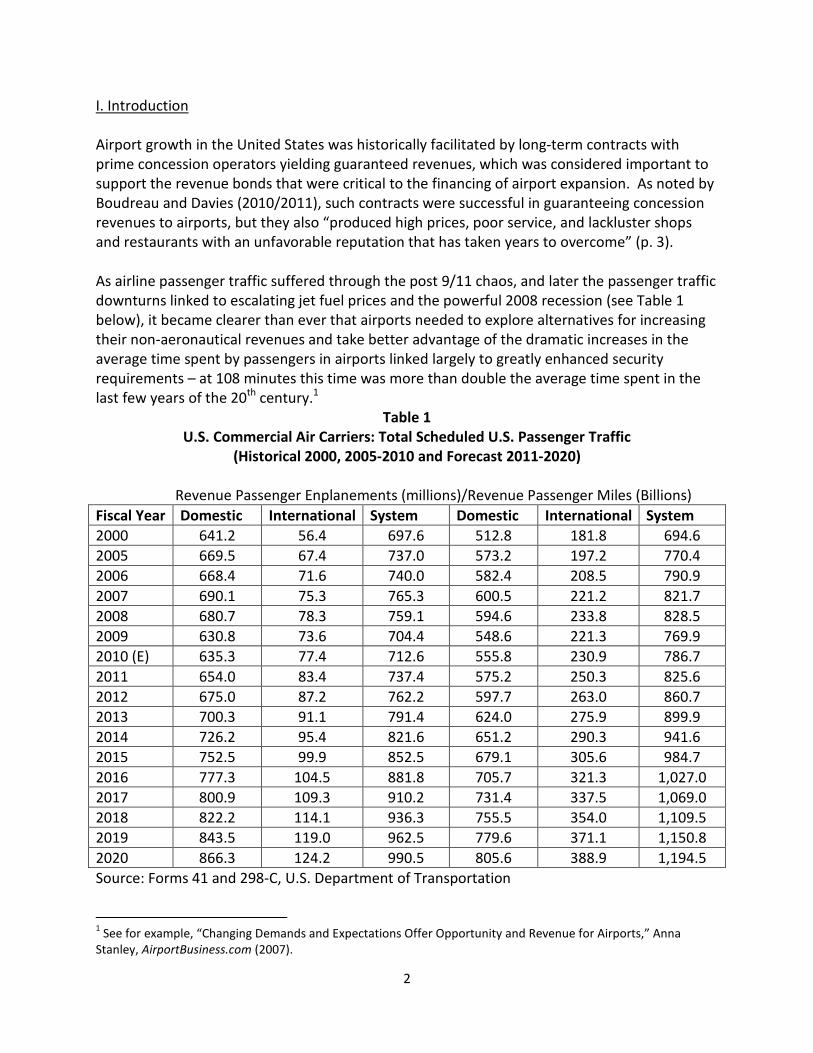
As airline passenger traffic suffered through the post 9/11 chaos, and later the passenger trafficdownturns linked to escalating jet fuel prices and the powerful 2008 recession (see Table 1below), it became clearer than ever that airports needed to explore alternatives for increasingtheir non-aeronautical revenues and take better advantage of the dramatic increases in theaverage time spent by passengers in airports linked largely to greatly enhanced securityrequirements – at 108 minutes this time was more than double the average time spent in thelast few years of the 20th century.1
Table 1U.S. Commercial Air Carriers: Total Scheduled U.S. Passenger Traffic
(Historical 2000, 2005-2010 and Forecast 2011-2020)
Revenue Passenger Enplanements (millions)/Revenue Passenger Miles (Billions)
Fiscal Year Domestic International System Domestic International System
2000 641.2 56.4 697.6 512.8 181.8 694.6
2005 669.5 67.4 737.0 573.2 197.2 770.4
2006 668.4 71.6 740.0 582.4 208.5 790.9
2007 690.1 75.3 765.3 600.5 221.2 821.7
2008 680.7 78.3 759.1 594.6 233.8 828.5
2009 630.8 73.6 704.4 548.6 221.3 769.9
2010 (E) 635.3 77.4 712.6 555.8 230.9 786.7
2011 654.0 83.4 737.4 575.2 250.3 825.6
2012 675.0 87.2 762.2 597.7 263.0 860.7
2013 700.3 91.1 791.4 624.0 275.9 899.9
2014 726.2 95.4 821.6 651.2 290.3 941.6
2015 752.5 99.9 852.5 679.1 305.6 984.7
2016 777.3 104.5 881.8 705.7 321.3 1,027.0
2017 800.9 109.3 910.2 731.4 337.5 1,069.0
2018 822.2 114.1 936.3 755.5 354.0 1,109.5
2019 843.5 119.0 962.5 779.6 371.1 1,150.8
2020 866.3 124.2 990.5 805.6 388.9 1,194.5
Source: Forms 41 and 298-C, U.S. Department of Transportation
1See for example, “Changing Demands and Expectations Offer Opportunity and Revenue for Airports,” Anna
Stanley, AirportBusiness.com (2007).

3
And the top airports in the United States, including Atlanta Hartsfield Jackson InternationalAirport were hardly immune to the weakness or decline in airline passenger travel, althoughAtlanta suffered relatively less than many of the other top ten airports and less than theaverage, as reflected in Table 2.
Table 2Top 10 Domestic Airports: Passengers and % Change 2007-2009
Airport # of Passengers2008
% Change 2007-2008
# Passengers2009
% Change 2008-2009
Atlanta (ATL) 90,039,280 0.7 87,993,451 (2.3)
Chicago (ORD) 69,353,532 (9.0) 64,397,891 (8.8)
Los Angeles (LAX) 59,820,855 (4.3) 56,518,605 (5.5)
Dallas-Fort Worth(DFW)
57,086,367 (4.5) 56,030,457 (1.9)
Denver (DEN) 51,245,334 2.7 50,167,485 (2.1)
New York (JFK) 47,799,090 0.2 45,912,430 (3.9)
Las Vegas (LAS) 44,074,707 (7.7) 40,460,310 (8.2)
Houston (IAH) 41,703,048 (3.0) 39,993,236 (4.1)
Phoenix (PHX) 39,891,193 (5.4) 37,824,982 (5.2)
San Francisco(SFO)
37,275,073 4.8 37,366,287 0.2
Average (2.55) (4.18)
Source: Airports Council International: Worldwide Airport Traffic Report; Calendar Years 2008and 2009.
Even prior to the tumultuous consequences of the financial meltdown and recession of 2008,the challenge facing airports had become clear. As stated in the Airport Access Newsletter(March 15, 2003), in an article dramatically entitled “Are You Prepared for the MajorTransformation of the Airport/Airline Industry that is Currently Underway?” the case for urgentaction was made:
“The fact is there’s never been a time in the history of public aviation that the need fornew innovative products, services and approaches to problem solving at all levels wasgreater. The need for new technology in security services and products, new revenuesources, new cost cutting measures, new methods and techniques of providingcustomer service in an industry where the customers have been forgotten are toonumerous and truly overwhelming to enumerate.”
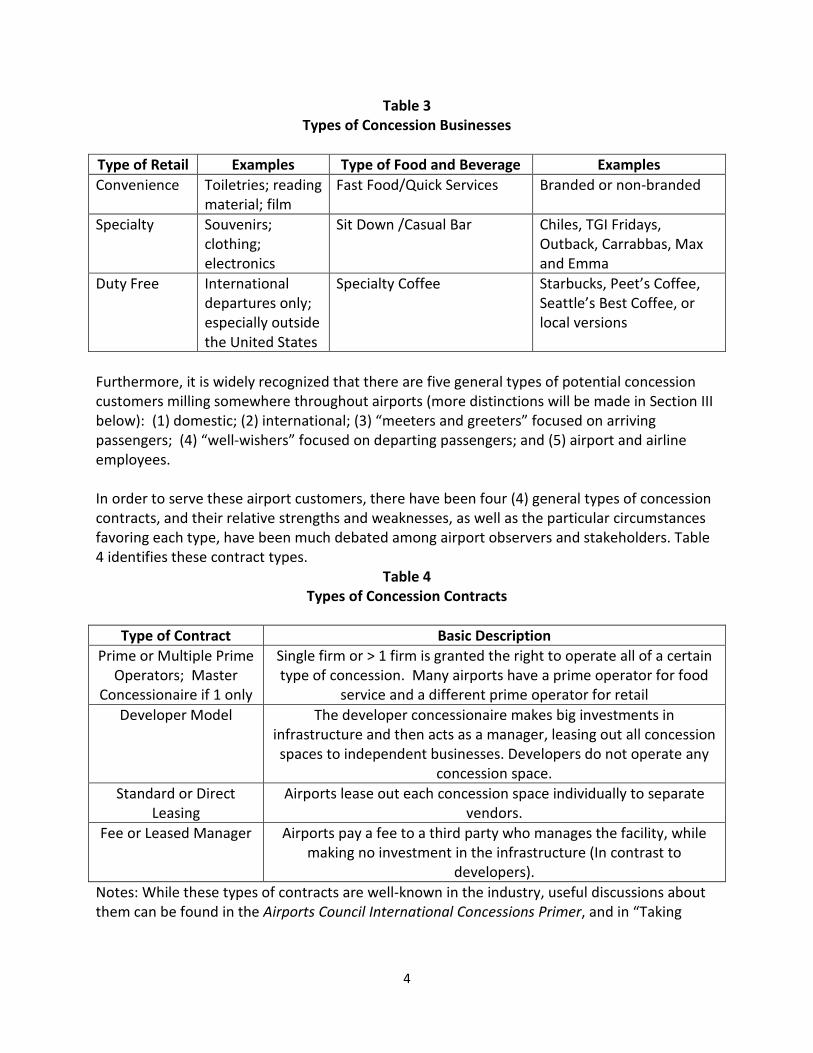
Clearly, it is passenger enplanements rather than passenger miles In Table 1, and the number oftotal passengers in Table 2 that are vital to the ability of airports to generate concession basedrevenues, and try to meet the challenge to public aviation and airports identified In the AirportAccess Newsletter. The airport concession industry generally recognizes three types of retailconcessions and three distinct types of food and beverage concessions, as identified in Table 3.
4
Table 3Types of Concession Businesses
Type of Retail Examples Type of Food and Beverage Examples
Convenience Toiletries; readingmaterial; film
Fast Food/Quick Services Branded or non-branded
Specialty Souvenirs;clothing;electronics
Sit Down /Casual Bar Chiles, TGI Fridays,Outback, Carrabbas, Maxand Emma
Duty Free Internationaldepartures only;especially outsidethe United States
Specialty Coffee Starbucks, Peet’s Coffee,Seattle’s Best Coffee, orlocal versions
Furthermore, it is widely recognized that there are five general types of potential concessioncustomers milling somewhere throughout airports (more distinctions will be made in Section IIIbelow): (1) domestic; (2) international; (3) “meeters and greeters” focused on arrivingpassengers; (4) “well-wishers” focused on departing passengers; and (5) airport and airlineemployees.
In order to serve these airport customers, there have been four (4) general types of concessioncontracts, and their relative strengths and weaknesses, as well as the particular circumstancesfavoring each type, have been much debated among airport observers and stakeholders. Table4 identifies these contract types.
Table 4Types of Concession Contracts
Type of Contract Basic Description
Prime or Multiple PrimeOperators; Master
Concessionaire if 1 only
Single firm or > 1 firm is granted the right to operate all of a certaintype of concession. Many airports have a prime operator for food
service and a different prime operator for retail
Developer Model The developer concessionaire makes big investments ininfrastructure and then acts as a manager, leasing out all concessionspaces to independent businesses. Developers do not operate any
concession space.
Standard or DirectLeasing
Airports lease out each concession space individually to separatevendors.
Fee or Leased Manager Airports pay a fee to a third party who manages the facility, whilemaking no investment in the infrastructure (In contrast to
developers).
Notes: While these types of contracts are well-known in the industry, useful discussions aboutthem can be found in the Airports Council International Concessions Primer, and in “Taking
5
Flight: Airport Shopping and Dining: A Retail Evolution is Taking Shape in the Nation’s Airports,”Mark R. Knight, Research Review, 14(2):37-40, 2009.
Most airports have used either the multiple prime concessionaire or the standard/direct leasingapproaches, including Atlanta Hartsfield Jackson International, which has been home toConcessions International’s largest airport operation since 1995 (Concessions Paschals, whichcontinues to be the largest concessionaire at Hartsfield-Jackson).2 The developer model wasfirst used by the company BAA USA in 1992 at the Pittsburgh International Airport, with thetrademark registered AIRMALL concept. Other locations for either this private developerconcept or some form of a developer model include Boston Logan International Airport,Baltimore/Washington International Thurgood Marshall Airport, Cleveland HopkinsInternational Airport, George Bush International Airport (Terminal E), JFK (Terminals 8 and 9),LaGuardia (Central Terminal), Miami International (Central Terminal), and Orlando (retail only).3
Jacobs Consultancy has also identified Philadelphia and Newark as using the developer model(see footnote 2 below).
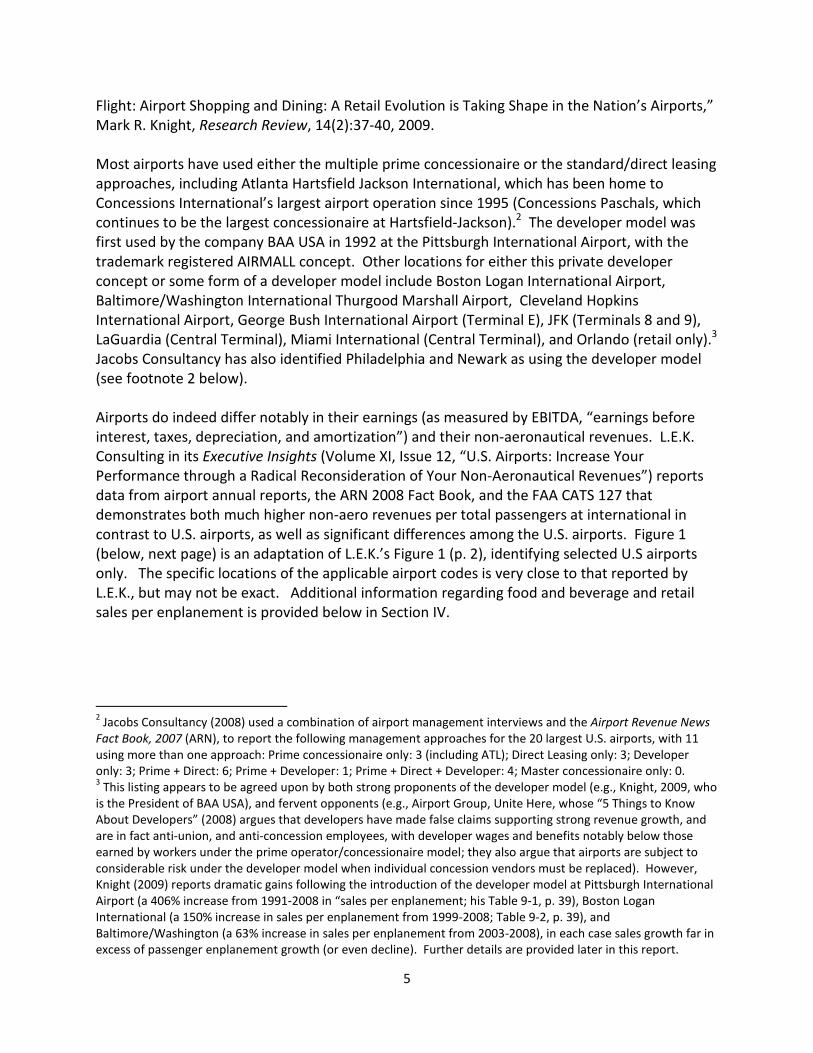
Airports do indeed differ notably in their earnings (as measured by EBITDA, “earnings beforeinterest, taxes, depreciation, and amortization”) and their non-aeronautical revenues. L.E.K.Consulting in its Executive Insights (Volume XI, Issue 12, “U.S. Airports: Increase YourPerformance through a Radical Reconsideration of Your Non-Aeronautical Revenues”) reportsdata from airport annual reports, the ARN 2008 Fact Book, and the FAA CATS 127 thatdemonstrates both much higher non-aero revenues per total passengers at international incontrast to U.S. airports, as well as significant differences among the U.S. airports. Figure 1(below, next page) is an adaptation of L.E.K.’s Figure 1 (p. 2), identifying selected U.S airportsonly. The specific locations of the applicable airport codes is very close to that reported byL.E.K., but may not be exact. Additional information regarding food and beverage and retailsales per enplanement is provided below in Section IV.
2Jacobs Consultancy (2008) used a combination of airport management interviews and the Airport Revenue News
Fact Book, 2007 (ARN), to report the following management approaches for the 20 largest U.S. airports, with 11using more than one approach: Prime concessionaire only: 3 (including ATL); Direct Leasing only: 3; Developeronly: 3; Prime + Direct: 6; Prime + Developer: 1; Prime + Direct + Developer: 4; Master concessionaire only: 0.3
This listing appears to be agreed upon by both strong proponents of the developer model (e.g., Knight, 2009, whois the President of BAA USA), and fervent opponents (e.g., Airport Group, Unite Here, whose “5 Things to KnowAbout Developers” (2008) argues that developers have made false claims supporting strong revenue growth, andare in fact anti-union, and anti-concession employees, with developer wages and benefits notably below thoseearned by workers under the prime operator/concessionaire model; they also argue that airports are subject toconsiderable risk under the developer model when individual concession vendors must be replaced). However,Knight (2009) reports dramatic gains following the introduction of the developer model at Pittsburgh InternationalAirport (a 406% increase from 1991-2008 in “sales per enplanement; his Table 9-1, p. 39), Boston LoganInternational (a 150% increase in sales per enplanement from 1999-2008; Table 9-2, p. 39), andBaltimore/Washington (a 63% increase in sales per enplanement from 2003-2008), in each case sales growth far inexcess of passenger enplanement growth (or even decline). Further details are provided later in this report.
6
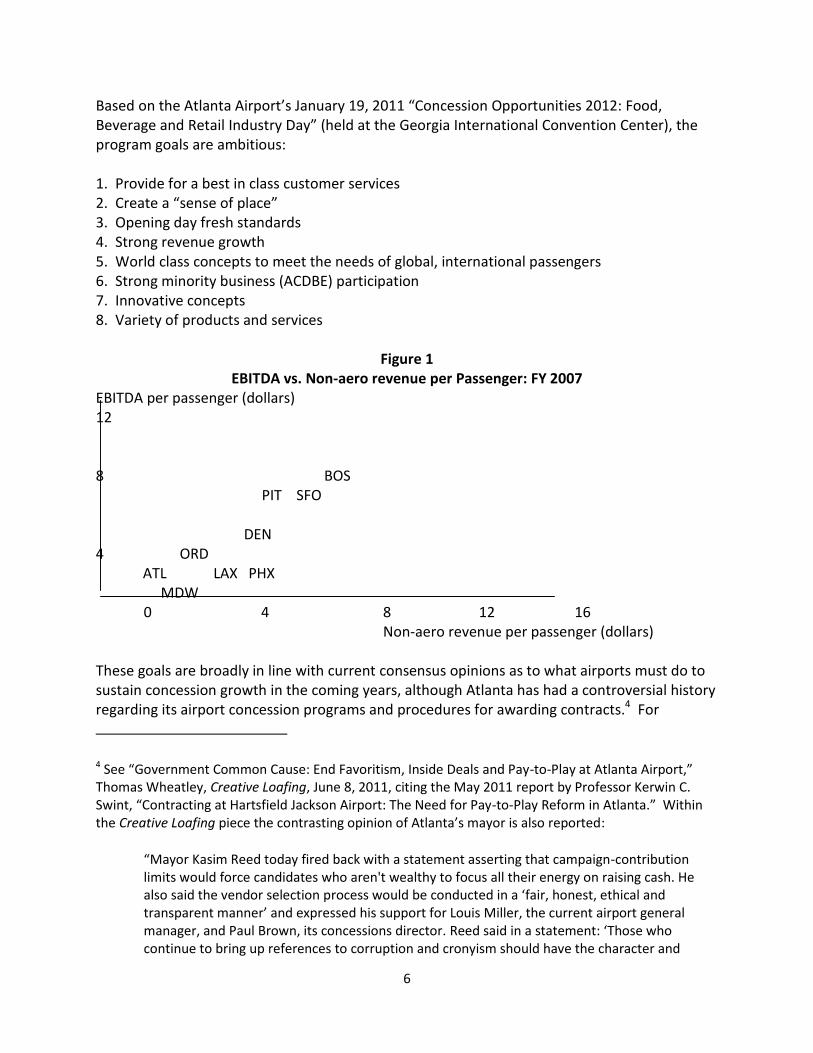
Based on the Atlanta Airport’s January 19, 2011 “Concession Opportunities 2012: Food,Beverage and Retail Industry Day” (held at the Georgia International Convention Center), theprogram goals are ambitious:
1. Provide for a best in class customer services2. Create a “sense of place”3. Opening day fresh standards4. Strong revenue growth5. World class concepts to meet the needs of global, international passengers6. Strong minority business (ACDBE) participation7. Innovative concepts8. Variety of products and services
Figure 1EBITDA vs. Non-aero revenue per Passenger: FY 2007
EBITDA per passenger (dollars)12
8 BOSPIT SFO
DEN4 ORD
ATL LAX PHXMDW
0 4 8 12 16Non-aero revenue per passenger (dollars)
These goals are broadly in line with current consensus opinions as to what airports must do tosustain concession growth in the coming years, although Atlanta has had a controversial historyregarding its airport concession programs and procedures for awarding contracts.4 For
4 See “Government Common Cause: End Favoritism, Inside Deals and Pay-to-Play at Atlanta Airport,”Thomas Wheatley, Creative Loafing, June 8, 2011, citing the May 2011 report by Professor Kerwin C.Swint, “Contracting at Hartsfield Jackson Airport: The Need for Pay-to-Play Reform in Atlanta.” Withinthe Creative Loafing piece the contrasting opinion of Atlanta’s mayor is also reported:
“Mayor Kasim Reed today fired back with a statement asserting that campaign-contributionlimits would force candidates who aren't wealthy to focus all their energy on raising cash. Healso said the vendor selection process would be conducted in a ‘fair, honest, ethical andtransparent manner’ and expressed his support for Louis Miller, the current airport generalmanager, and Paul Brown, its concessions director. Reed said in a statement: ‘Those whocontinue to bring up references to corruption and cronyism should have the character and

7
example, a 2009 Arthur D. Little report (Mastering Airport Retail: Roadmap to New IndustryStandards) identifies the following five “key drivers to compensate for the effects of thedownturn for airports:”
Developing the density of the retail surface to maximize performance (sales perdeparting passenger)
Adapting the offer to reflect the passenger profile
Using a range of approaches to convert browsers into buyers, and to increase timespent shopping
Extending their price advantage over city-center retailers
Expanding customer target groups to include non-travelers and arrival passengers anddiversifying distribution channels
The other sections of this report provide more detail, documentation and discussion ofimportant issues relevant to the more effective design and contracting of successful airportconcessions in the current economic, technological and demographic environment.
II. The Demographics of Commercial Airline Travel
In its January 19 presentation to potential concessionaries, the Atlanta Airport provided thefollowing summary demographic data regarding its passenger base (clearly heavily influencedby the experience of its primary hub airline, Delta Air Lines), based on a second quarter 2010AIR Survey:
Atlanta Hartsfield-Jackson International Airport Demographic Summary
44% male; 56% female Average age 40 Average income $83,700 Originating passengers: 30%; Transfer passengers: 70% Enplaning domestic passengers: 90.2%; International: 9.8% Purpose of travel: Business: 48%; Leisure: 52% Average free time in the airport: 100 minutes
The 100 average minutes at the airport are reasonably similar to the 108 average minutes citedearlier (those eight minutes represent 7.4% fewer minutes). But how do these demographicscompare to those reported by other airlines, other airports, and by independent sources?
integrity to back up their allegations, or refrain from smearing the reputations of the dedicatedemployees who manage and work at what is arguably the most successful airport in the nation.It’s time to stop resurrecting the past and instead, focus on the present and the future’.”
8
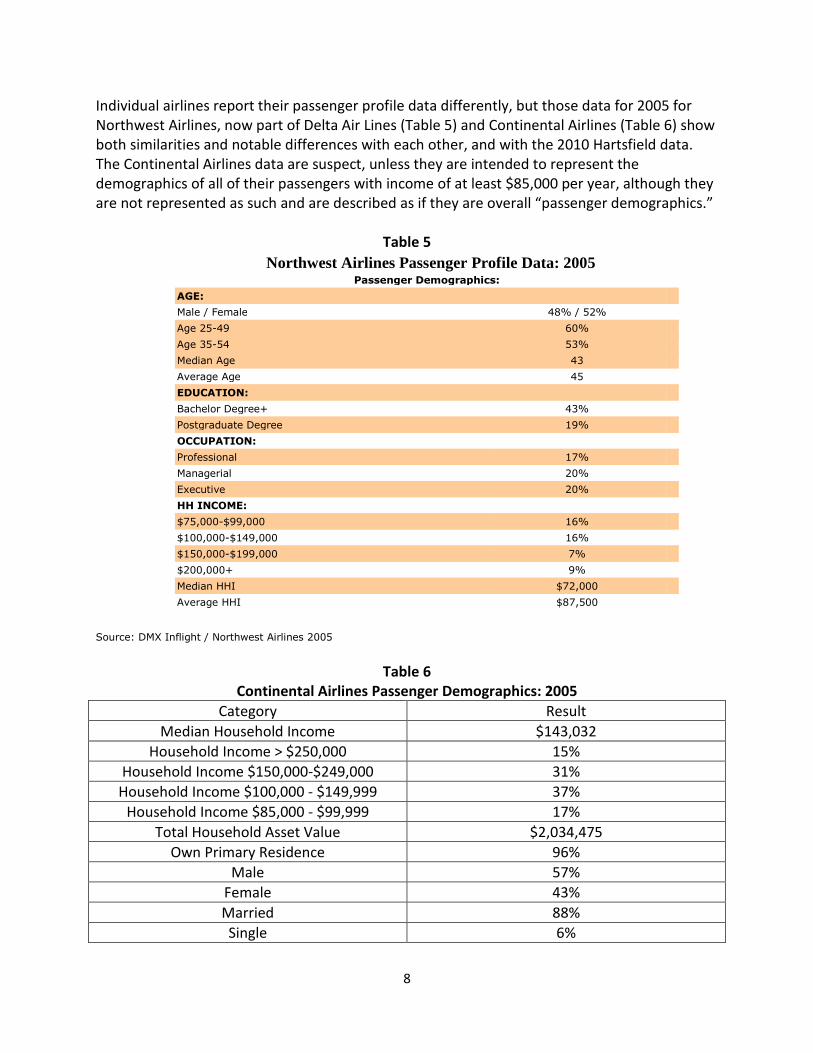
Individual airlines report their passenger profile data differently, but those data for 2005 forNorthwest Airlines, now part of Delta Air Lines (Table 5) and Continental Airlines (Table 6) showboth similarities and notable differences with each other, and with the 2010 Hartsfield data.The Continental Airlines data are suspect, unless they are intended to represent thedemographics of all of their passengers with income of at least $85,000 per year, although theyare not represented as such and are described as if they are overall “passenger demographics.”
Table 5
Northwest Airlines Passenger Profile Data: 2005Passenger Demographics:
AGE:
Male / Female 48% / 52%
Age 25-49 60%
Age 35-54 53%
Median Age 43
Average Age 45
EDUCATION:
Bachelor Degree+ 43%
Postgraduate Degree 19%
OCCUPATION:
Professional 17%
Managerial 20%
Executive 20%
HH INCOME:
$75,000-$99,000 16%
$100,000-$149,000 16%
$150,000-$199,000 7%
$200,000+ 9%
Median HHI $72,000
Average HHI $87,500
Source: DMX Inflight / Northwest Airlines 2005
Table 6Continental Airlines Passenger Demographics: 2005
Category Result
Median Household Income $143,032
Household Income > $250,000 15%
Household Income $150,000-$249,000 31%
Household Income $100,000 - $149,999 37%
Household Income $85,000 - $99,999 17%
Total Household Asset Value $2,034,475
Own Primary Residence 96%
Male 57%
Female 43%
Married 88%
Single 6%
9
College or Post-Grad 60%
Managerial Professional 65%
Median Age 46
Source: 2005 Continental Airlines enplanement data, as reported by In-Flight Media Associates,Inc. at www.in-flightmedia.com.
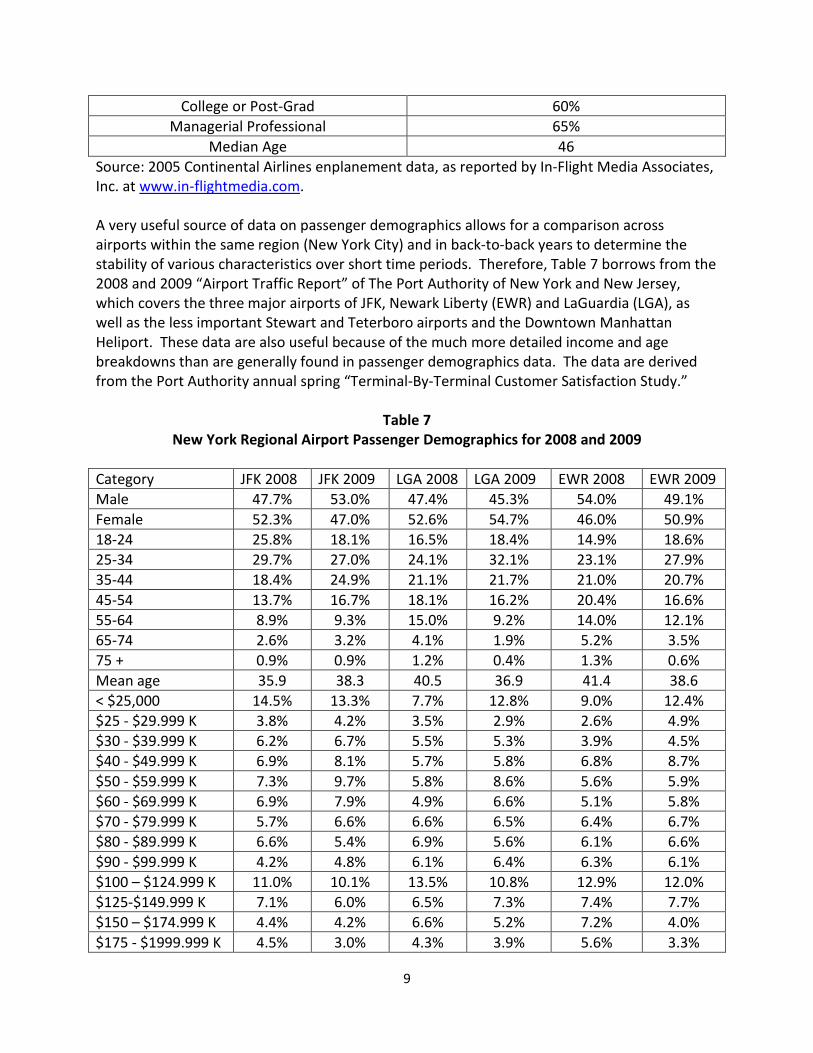
A very useful source of data on passenger demographics allows for a comparison acrossairports within the same region (New York City) and in back-to-back years to determine thestability of various characteristics over short time periods. Therefore, Table 7 borrows from the2008 and 2009 “Airport Traffic Report” of The Port Authority of New York and New Jersey,which covers the three major airports of JFK, Newark Liberty (EWR) and LaGuardia (LGA), aswell as the less important Stewart and Teterboro airports and the Downtown ManhattanHeliport. These data are also useful because of the much more detailed income and agebreakdowns than are generally found in passenger demographics data. The data are derivedfrom the Port Authority annual spring “Terminal-By-Terminal Customer Satisfaction Study.”
Table 7New York Regional Airport Passenger Demographics for 2008 and 2009
Category JFK 2008 JFK 2009 LGA 2008 LGA 2009 EWR 2008 EWR 2009
Male 47.7% 53.0% 47.4% 45.3% 54.0% 49.1%
Female 52.3% 47.0% 52.6% 54.7% 46.0% 50.9%
18-24 25.8% 18.1% 16.5% 18.4% 14.9% 18.6%
25-34 29.7% 27.0% 24.1% 32.1% 23.1% 27.9%
35-44 18.4% 24.9% 21.1% 21.7% 21.0% 20.7%
45-54 13.7% 16.7% 18.1% 16.2% 20.4% 16.6%
55-64 8.9% 9.3% 15.0% 9.2% 14.0% 12.1%
65-74 2.6% 3.2% 4.1% 1.9% 5.2% 3.5%
75 + 0.9% 0.9% 1.2% 0.4% 1.3% 0.6%
Mean age 35.9 38.3 40.5 36.9 41.4 38.6
< $25,000 14.5% 13.3% 7.7% 12.8% 9.0% 12.4%
$25 - $29.999 K 3.8% 4.2% 3.5% 2.9% 2.6% 4.9%
$30 - $39.999 K 6.2% 6.7% 5.5% 5.3% 3.9% 4.5%
$40 - $49.999 K 6.9% 8.1% 5.7% 5.8% 6.8% 8.7%
$50 - $59.999 K 7.3% 9.7% 5.8% 8.6% 5.6% 5.9%
$60 - $69.999 K 6.9% 7.9% 4.9% 6.6% 5.1% 5.8%
$70 - $79.999 K 5.7% 6.6% 6.6% 6.5% 6.4% 6.7%
$80 - $89.999 K 6.6% 5.4% 6.9% 5.6% 6.1% 6.6%
$90 - $99.999 K 4.2% 4.8% 6.1% 6.4% 6.3% 6.1%
$100 – $124.999 K 11.0% 10.1% 13.5% 10.8% 12.9% 12.0%
$125-$149.999 K 7.1% 6.0% 6.5% 7.3% 7.4% 7.7%
$150 – $174.999 K 4.4% 4.2% 6.6% 5.2% 7.2% 4.0%
$175 - $1999.999 K 4.5% 3.0% 4.3% 3.9% 5.6% 3.3%
10
$200 - $249.999 K 3.7% 3.5% 4.0% 3.9% 5.5% 3.3%
$250 - $299.999 K 2.2% 1.8% 3.3% 2.3% 2.3% 2.6%
> $ =300,000 5.1% 4.9% 9.0% 6.0% 7.2% 5.3%
Mean Income $97,600 $92,600 $117,600 $102,800 $115,900 $99,400
The data in Table 7 reveals somewhat surprising variations in passenger demographics bothacross major airports within the same region, and even over a two-year period with both yearscharacterized by overall economic hardship (although the most dramatic effects of the 2008financial/economic meltdown were felt throughout the entire year 2009, as well as the fourthquarter of 2008). Even the gender composition at JFK, for example, shows notable changebetween 2008 and 2009, virtually reversing the gender composition (although within relativelynarrow bounds). Newark also displayed gender variability, while LaGuardia remained relativelystable. The mean age was also surprisingly variable across that two-year period, rising at JFKand falling at LaGuardia and Newark. But it was not a surprise, given the overall macro-economy, that mean income fell at all airports, although the magnitude and variability was notas predictable (about 5% at JFK, 12% at LaGuardia, and 14% at Newark). Also, given the strongemphasis that airlines themselves put upon their higher income customers, it is useful torecognize that about 13% (overall) of the departure passengers at these New York City airportshad incomes less than $25,000 (and that percentage rose in 2009 compared to 2008 in two ofthem, and fell only slightly in the other, JFK).
But despite the more detailed and informative data provided in Table 7, the overall messageabout airport passenger demographics is not changed: such passengers are relatively well-offeconomically, with higher than average educations overall, In age ranges prone to significantdiscretionary spending, and with increasing time on their hands in airports.
In flight-media.com is also an interesting source of current data for its three current airlinecustomers, for whom it provides the in flight programming: Delta Air Lines, American Airlinesand Virgin America. These data are confirming of the overall “high powered” demographics ofairport passengers, despite the fact that the general trend over many years of commercial airtravel has been toward a “democratization” of such travel, with ever increasing percentages ofthe population at least flying periodically. However, this data source provides very differentdata for those three airlines since those data were supplied by the airlines themselves fromdiffering underlying sources. For example, for American Airlines, it indicates only that 57% of its“viewers” are male and 43% female, the median age is 45, and that 59% have householdincome above $100,000. For Virgin America, citing the data source as Scarborough Research,we are told that 52% are male, 66% are age 18-49, 54% are college-educated, and the medianincome is $71,400. In flight-media.com also provides Arbitron data regarding some overall“audience” characteristics.
Summary Characteristics of Airline Travelers (Arbitron data)
o Airline travelers are 80% more likely to have an annual household income of $100,000or more.

11
o Frequent flyers are over three times as likely to live in $100,000+ households.o Airline travelers are sophisticated shoppers and are more likely to have a propensity for
designer clothes, luxury cars and cutting-edge personal digital devices.o Airline travelers are avid moviegoers and are more likely to have seen a movie recently
or to be avid DVD collectors. -o Airline travelers spend less time with television, and twice as many Americans fly as
read Time or Newsweek magazines.
By far the most detailed data currently reported by In-flight media.com were provided directlyby Delta Air Lines, and given the importance of Delta to Hartsfield-Jackson International Airport,those results are reported in Table 8. Perhaps the most notable results revealed in Table 7 are(1) there is indeed something odd about the Table 6 results reported for Continental Airlines for2005, since not only are the income demographics excessively skewed toward high incomehouseholds, but even the percentage married seems far too high compared to other airlinedata sources, and the known demographics within the United States; (2) the percentage ofDelta Air Lines flyers holding a valid passport (78%) is remarkably high given the well-documented relative dearth of passport holders within the American population; and (3) thepercentage of frequent flyers seems suspiciously low (48%), given the other results reported inthat table (e.g., see Table 9 below, where that figure is 95%, with 46% being members of four ormore programs).
Table 8Delta Air Lines Passenger Profile Data
Category Results
Male 53%
Female 47%
Age 18-49 67%
Age 25-54 70%
Age 35-49 37%
Married 66%
Single 35%
College Educated 78%
Graduate School + 47%
Post Graduate Degree 16%
Employed full-time 71%
Professional/Managerial 43%
Top Management 12%
Household Income $75,000 + 61%
Household Income $100,000 + 46%
20 + Nights in a Hotel per year 53%
Frequent Flyer Members 48%
Own a Valid Passport 78%
7 + Car Rental Days per year 29%

12
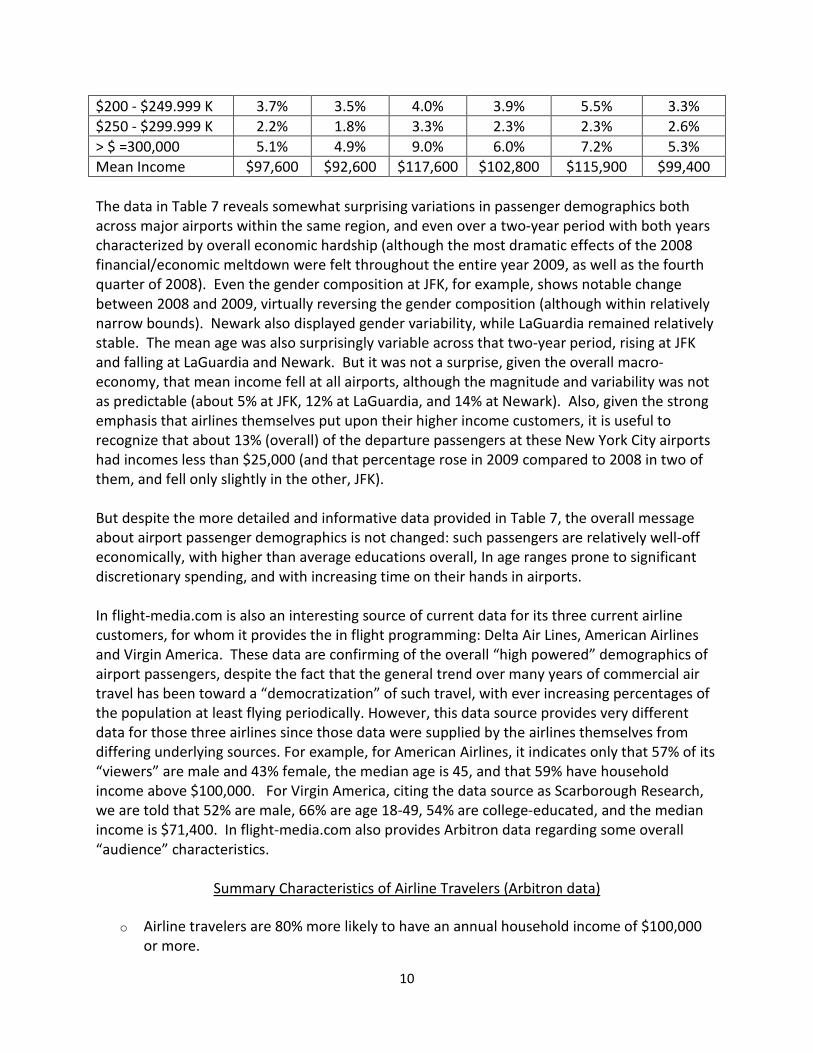
The website Frequentflier.com (http://www.frequentflier.com/demographics.htm), whichrepresents itself as the “Internet’s premier site for frequent flyer program information andadvice,” is another very useful source of airline passenger data and provides the followingcurrent information about its readers.
Table 9Reader Profile and Demographics:
All Frequent Flyers for All Airlines: Current
1) PROFILE
Prosperous, Well-Educated Adults
72% graduated college; 31% have graduate degrees. 66% have household incomes in excess of $50,000, and 32% make more than $100,000. 98% are 25 years or older; 61% are over 45.
Heavy Internet Users Who Research & Buy Travel Online
53% spend 11+ hours/week online. 91% research airline flights and 77% book flights online. 82% research hotels and 70% book rooms online. 65% research car rentals and 59% book cars online. 72% are "Likely" or "Very Likely" to purchase travel online in the next 6 months.
Frequent Travelers, for Business & Pleasure
Classic frequent-traveler demographic skews somewhat male (56% versus 44% female). 77% traveled 3 or more times during the past 12 months; 25% logged 10+ trips. 95% participate in airline frequent flyer programs; 46% are members of 4 or more
programs.
2) DEMOGRAPHICS
AGE
18-24 2%
25-34 15%
35-44 22%
45-54 30%
55-64 21%
65+ 10%
GENDER
Male 56%
Female 44%
EDUCATION
Some College 21%
College Grad 31%
Some Post-Grad 10%
13
Post-Grad Degree 31%
HOUSEHOLD INCOME
Under $20K 3%
$20K-$35K 6%
$35K-$50K 10%
$50K-$75K 18%
$75K-$100K 16%
$100K+ 32%
OCCUPATION
Sr. Management 12%
Other Management 11%
Professional 27%
Technical 8%
Sales 8%
Admin 5%
Retired 16%
WEEKLY INTERNET USE
1-2 Hours 4%
3-5 Hours 16%
6-10 Hours 26%
11-20 Hours 25%
20+ Hours 28%
TRIPS DURING PAST 12 MONTHS
1-2 20%
3-5 38%
6-10 14%
10+ 25%
BUSINESS VERSUS LEISURE TRAVEL BREAKDOWN
100% Business 3%
75% Business/25% Leisure 26%
50% Business/50% Leisure 17%
25% Business/75% Leisure 17%
100% Leisure 37%
USE OF THE INTERNET
Research travel destinations 88%
Research airline flights/fares 91%
Research hotel accommodations/prices 82%
Research car rental availability/rates 65%
Book airline tickets online 77%
Book hotel rooms online 70%
Book rental cars online 59%
AIRLINE FREQUENT FLYER PROGRAM PARTICIPATION
None 5%
1-3 Programs 50%
4-6 Programs 34%
7-9 Programs 8%

14
10 or More 3%
The passenger demographics from different sources, different airlines, airports and timeperiods described in this section contain both comforting confirmation of basic characteristics,as well as some surprising variations. Other trends, such as the ongoing increase in the averageweight of passengers, are not revealed in such data, although it is well-recognized andincreasingly discussed. And the seemingly never abating increase in the use of social media ofincreasing varieties within the general population, and among airport clients and airlinepassengers, is an important technological development that is discussed in more detail in thenext section.
III. Buying Habits of Airport Visitors
In the introductory section five general (and fairly obvious) types of potential concessioncustomers were identified based on their primary reason for being in an airport: (1) domestic;(2) international; (3) “meeters and greeters” focused on arriving passengers; (4) “well-wishers”focused on departing passengers; and (5) airport and airline employee. However, thiscategorization provides no useful information on the buying habits of such airport visitors. Toclarify those buying habits, survey/questionnaire methods are required, sometimessupplemented in academic research by further statistical analysis. Such academic research hasalso attempted to develop other typologies of airport shoppers.
In Section II, the Port Authority of New York and New Jersey “Terminal-By-Terminal CustomerSatisfaction Study” provided useful data regarding demographic characteristics of airlinepassengers and how such characteristics vary across New York regional airports and over ashort two-year period. Airline passengers represent two of the five potential airport concessioncustomers above, and with the exception of airline/airport employees, the customers likely tospend the most time within airports. That same data source also provides importantinformation about the buying habits of such passengers, including vital information regardingwhere within the airport most purchases are made, the average “dwell” times for both localoriginating-destination (O-D) versus connecting passengers, the motivations for retail purchasescompared to food and beverage (F/B) purchases, and the types of mobile communicationdevices utilized by such passengers. As further discussed in the Section IV, developing effectivestrategies for communicating with customers via such mobile devices is widely recognized ascritical for the future of airport concessions. Table 10 replicates the format of Table 7,reporting such findings for the three major New York regional airports for both 2008 and 2009.A few new categories were introduced in 2009.
Table 10New York Airports Departing Passenger Buying and Related Habits for 2008 and 2009
Category JFK 2008 JFK 2009 LGA 2008 LGA 2009 EWR 2008 EWR 2009
Check in: maincounter
49.1% 52.4% 30.6% 38.0% 46.6% 45.7%

15
Self-check in atkiosk
33.4% 25.2% 44.1% 39.7% 20.7% 27.7%
Printed boardingpass at home
10.6% 17.4% 14.8% 14.2% 24.5% 19.8%
Curbside checking 5.5% 4.2% 10.4% 7.5% 7.5% 4.5%
Check in airportlounge
1.4% 0.5% 0.1% 0.0% 0.8% 0.2%
Download board-pass via cell phone
NA 0.3% NA 0.7% NA 2.2%
Avg. dwell time 0-D 127 mins. 115 mins. 106 mins. 100 mins. 116 mins. 120 mins.
Avg. dwell timeconnecting
203 mins. 186 mins. 115 mins. 138 mins. 177 mins. 201 mins.
Accompanied bywell-wisher
NA 10.1% NA 8.6% NA 8.9%
Bought F/B pre-security
12.3% 8.1% 9.7% 7.6% 10.0% 10.0%
Bought F/B post-security
60.1% 58.3% 55.7% 49.5% 58.4% 60.4%
Impromptu F/Bpurchase
46.2% 49.2% 41.4% 42.8% 46.7% 47.1%
Planned in advanceF/B purchase
39.0% 34.1% 40.1% 36.6% 41.2% 34.9%
Bought F/B toconsumer on plane
20.4% 16.0% 21.6% 19.5% 14.1% 12.6%
Avg. $ spent on F/B $15.46 $16.77 $11.02 $12.19 $10.71 $15.52
Bought retail pre-security
5.2% 2.5% 5.0% 2.6% 3.8% 3.0%
Bought retail post-security
19.8% 19.3% 17.5% 14.5% 16.7% 16.2%
Impromptu retailpurchase
46.5% 54.5% 47.7% 46.6% 41.6% 43.0%
Planned in advanceretail purchase
37.8% 25.2% 36.5% 30.3% 39.4% 28.7%
Bought retail due toforgot to pack
7.7% 6.8% 2.8% 4.6% 7.7% 9.1%
Avg. $ spent retail $32.75 $34.70 $17.31 $16.83 $23.80 $33.84
Avg. travel partysize
2.5 2.3 1.8 1.9 2.2 2.1
Kids < 10 in party 6% 10% 4% 6% 7% 6%
Carrying Wifienabled laptop
27.8% 27.0% 26.8% 24.7% 32.2% 22.8%
Carrying handheldPDA device
NA 35.1% NA 36.3% NA 28.0%
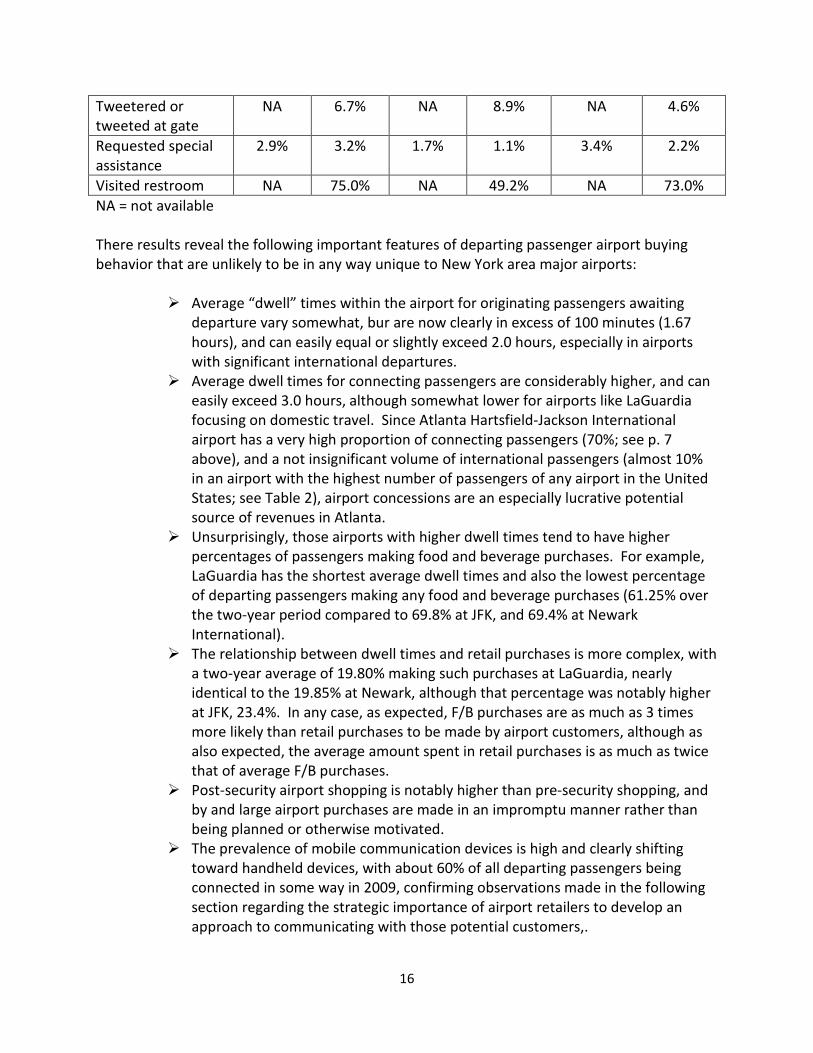
16
Tweetered ortweeted at gate
NA 6.7% NA 8.9% NA 4.6%
Requested specialassistance
2.9% 3.2% 1.7% 1.1% 3.4% 2.2%
Visited restroom NA 75.0% NA 49.2% NA 73.0%
NA = not available
There results reveal the following important features of departing passenger airport buyingbehavior that are unlikely to be in any way unique to New York area major airports:
Average “dwell” times within the airport for originating passengers awaitingdeparture vary somewhat, bur are now clearly in excess of 100 minutes (1.67hours), and can easily equal or slightly exceed 2.0 hours, especially in airportswith significant international departures.
Average dwell times for connecting passengers are considerably higher, and caneasily exceed 3.0 hours, although somewhat lower for airports like LaGuardiafocusing on domestic travel. Since Atlanta Hartsfield-Jackson Internationalairport has a very high proportion of connecting passengers (70%; see p. 7above), and a not insignificant volume of international passengers (almost 10%in an airport with the highest number of passengers of any airport in the UnitedStates; see Table 2), airport concessions are an especially lucrative potentialsource of revenues in Atlanta.
Unsurprisingly, those airports with higher dwell times tend to have higherpercentages of passengers making food and beverage purchases. For example,LaGuardia has the shortest average dwell times and also the lowest percentageof departing passengers making any food and beverage purchases (61.25% overthe two-year period compared to 69.8% at JFK, and 69.4% at NewarkInternational).
The relationship between dwell times and retail purchases is more complex, witha two-year average of 19.80% making such purchases at LaGuardia, nearlyidentical to the 19.85% at Newark, although that percentage was notably higherat JFK, 23.4%. In any case, as expected, F/B purchases are as much as 3 timesmore likely than retail purchases to be made by airport customers, although asalso expected, the average amount spent in retail purchases is as much as twicethat of average F/B purchases.
Post-security airport shopping is notably higher than pre-security shopping, andby and large airport purchases are made in an impromptu manner rather thanbeing planned or otherwise motivated.
The prevalence of mobile communication devices is high and clearly shiftingtoward handheld devices, with about 60% of all departing passengers beingconnected in some way in 2009, confirming observations made in the followingsection regarding the strategic importance of airport retailers to develop anapproach to communicating with those potential customers,.

17
The detailed Arbitron surveys generally confirm and expand upon such findings. Their 2007report highlights the following conclusions:
Nearly 50% of American adults are exposed to airport media each year. While frequent flyers constitute about one-fourth of all airline travelers, they
account for over 70% of all trips taken and a majority of all airport media“impressions.”
Going beyond the measure of average number of dwell time minutes, 65% ofairline travelers spend more than 30 minutes in the airport terminal afterpassing through security, with almost one-third spending longer than an hourwaiting to board their flight.
Airline travelers are especially heavy users of on-line access compared to timespent watching television, spending 18% less time per watching TV compared tothe average American 18 years and older, with frequent flyers spending 24%less time watching TV.
Seventeen percent (17%) of frequent flyers self-identify as “early adopters” ofnew goods and services, compared to only 9% of all Americans who apply thatterm to themselves.
Further confirming and elaborating upon the Port Authority NY/NJ dataregarding the use of cutting edge mobile technologies, frequent flyers are 2.5times more likely than the average consumer to own a “portable wireless hand-held device,” and are 71% more likely to use a digital video recorder such asTiVo, 74% more likely to use a portable audio player (e.g., iPod), and 31% morelikely to own a combined digital audio/video player.
The earlier 2004 Arbitron airport advertising study included a number of additional insights intothe shopping behavior of airline travelers.
Airline travelers have a greater propensity than the average American consumer to buydesigner clothes and luxury cars, as well as personal digital devices, and to regularly seemovies, and they shop on-line and spend more than average consumers. Of course, thisbehavior is highly correlated with the Section II demographic data indicating that airlinetravelers, especially frequent flyers, have relatively high incomes and educations,.
While there are sometimes perceptions that airline travel is highly seasonal (and thereare indeed modest peaks from November to January), passenger traffic is relativelystable month by month.
Given that airport waiting (dwell) periods have been rising, it is noteworthy that whilewaiting travelers read airport advertising, with 72% of travelers who recall noticing suchads actually taking the time to read them, and an even higher 82% of frequent flyerswho notice such ads taking time to read them.
Because about 11% of all Americans fly during an average month, but 21% fly at leastonce during an average three-month period, longer running ads will be about twice aseffective in reaching the flying public as short-term one-month ads.

18
Other Airport Shopping Typologies
Geuens, Vantomme and Brengman (2004) attempt to further clarify the shopping motivationsof airport visitors so as to further isolate potentially unique features of the airport environment.They essentially attempt to test the hypothesis that airport shopping will exhibit both standardmotivations for domestic shopping (“functional, social, and experiential”) as well as uniquetravel dominated motivations (“contrast day-to-day routine,” “be out-of-place,” reduceboredom during long waiting times, souvenir buying, and in international settings, unloadexcess foreign currency; see p. 617). Some unique issues related to the role of brand names areaddressed in the following section.
The attempt to categorize shoppers is hardly new, and Geuens et al. identify some standardshopping types form the marketing academic literature and their own previous research (p.618):
o Convenience shoppers having limited time and no particular interest in social interactionor novel experiences (“experiential interest)”.
o Low price shoppers having a lot of time and also no social/experiential interesto Social shoppers with limited time but social interesto Intense social shoppers with much more time and also social, but no experiential
interest.o Experiential shoppers, with limited time but high experiential interest.o Recreational shoppers who are experiential shoppers but with a lot of available time.
Recognizing that airports also attract some unique types of potential shoppers (as noted above,airline passengers and those dropping off or greeting them, as well as airline/airportemployees, plus the occasional business meeting attendees attending meetings convenientlyscheduled at airports), Sulzmaier (2001) is cited (p. 618) as having developed the following four“core” airport shopping segments based on their “motivational structures.” Those four typesare:
1) Strollers and half-day trippers, motivated by “the international flair, the excitingatmosphere and the variety of offerings” at airports.
2) Leisure interested employees, amusement seekers and airline crew membersstaying overnight, whose primary concern is extended operating hours, bothearly in the morning and late into the evening.
3) Employees during their working hours interested in customizedproducts/services.
4) Local residents who are convenience shoppers, and persons picking uppassengers (called “pragmatics”), who have relatively low expectations and arehence “easy to serve.”
Having provided these background observations, Geuens et al. (2004) generate unique datafrom written questionnaires distributed at the Brussels airport among departing Belgian
19
travelers with sample characteristics of 42% holiday travelers, 50% business travelers, and 8%traveling for both reasons, 29% between ages 20-30, 55.5% aged 31-50, and 15.5% older than50; 37.4% female and 62.6% male. While it is unclear if this particular non-American sample issufficiently reflective of North American attitudes, some unusual questions were included thatwould appear important to current discussions regarding airport design and modernization. Forexample, they inquire as to whether “airports resembling shopping malls is disturbing,”whether they would prefer bigger shops that require less search time, and whether “shops atthe airport should be centralized vs. shops should be near to a departure gate” (p 621, Table 3).They distinguish among “mood” shoppers, who were identified by scoring high on “airportatmosphere” related motivations, moderately on experiential motivations, and being slightlynegative regarding airport infrastructure and functional motivations; “apathetic” or indifferentshoppers (see p. 620), who score low on all dimensions of the shopping experience, andshopping “lovers,” who score high across all dimensions, including the airport-infrastructure,experiential, and functional motivational dimensions (see p. 620). The results of this studygenerate some potentially useful information regarding marketing strategies for airport shopowners:
1. Mood shoppers are largely male, impulsive shoppers who prefer centralized shops, andare generally motivated to shop by boredom or by especially attractive airportatmospheres.
2. Apathetic shoppers are also largely male, but surprisingly seem more likely to pre-plantheir purchases.
3. Perhaps predictably, shopping lovers are primarily female, but they have otherattributes that are hardly obvious. They prefer one large shop to many smaller shops,have only a slight preference for shops located near departure gates, and are morelikely to buy on impulse than pre-plan purchases.
4. The role of gender appears to be the key determining factor in distinguishing shoppingmotivations and behaviors, inasmuch as there was no statistically significant differenceacross the shopping types regarding age and travel frequency, nor was there anystatistically significant difference between businessperson and tourists, an especiallyunexpected result given the general presumption that those two groups experienceairport shopping in quite different ways. This also suggests that airports should notnecessarily try to position stores based on business vs. tourist type travelers.
5. Because there is very limited “functional” shopping (in stark contrast to standardshopping away from airports), airports should recognize that experiential, travel-relatedand atmospheric factors are much more important in stimulating passengers to makepurchases.
6. For both airport shop owners and airport managements, the primary attractive targetshopper is clearly the shopping lover, and they seem to prefer larger stores where thereis a greater variety, as well as a modest preference for shops located near gates.However, despite the roughly 40% of passengers who actively dislike shopping, moodand impulse buyers can be induced to make purchases by out of the ordinaryexperiences, unique environments, and products that give a flair to particular holidaytravelers or to particular geographic locations. While the Belgian experience also

20
suggested that the prevalence of multi-lingual shop communications and foreignexchange capabilities was important, those are much less likely to be factors in mostU.S. airports, including Atlanta (see p. 622).
IV. Non-aeronautical Airport Revenues: Additional Marketing Issues and Strategies
Overview
This section expands upon some of the themes identified in Section III regarding the behavior ofairport shoppers, but focuses more attention on specific marketing strategies, including adiscussion of the developer approach to airport concession contracts, whose proponents ofconcepts such as the AIRMALL brand of concessionaire structure have argued that this modelhas been capable of dramatically increasing per passenger airport spending. A related issue isthe development of the proper mix of nationally recognized brands versus more locally uniqueshops and product offerings. An expanded discussion of the implications of the dramaticincrease in mobile communications capabilities, as well as technological improvements that canaffect food and retail strategies is also provided.
The Developer Model and the Airport Mall
The developer model was introduced above in Table 4 (see also p. 5 and footnotes 2 and 3), butthis model of organizing airport concessions deserves additional discussion because of itsincreasing, although still limited prominence and the controversy that has erupted regarding itssuccess. The developer concessionaire makes big investments in infrastructure and then acts asa manager, leasing out all concession spaces to independent businesses. Developers do notdirectly operate any concession space.
This model of airport concession privatization has important implications for airports, which inthe United States are most typically public non-profit organizations, operated directly by localgovernments or authorities created by such governments. This is the case with AtlantaHartsfield-Jackson International Airport, which is owned and operated by the City of Atlanta(Department of Aviation). Therefore, local taxpayers have clear interests in how majorAmerican airports are operated, as do the private for-profit commercial airlines whoseoperations serve as the core activity of such facilities, and who clearly exert significant influenceover important airport decisions (especially if they have hub operations at any particularairport). But concession facility developer entrepreneurs, business owners hoping to landairport contracts, and workers employed by the airlines and by the food and beverage, retailand catering concession operators are also clear stakeholders, whose own interests may or maynot always coincide with those of the public entities and taxpayers owning the airports.
So it is no surprise that the two major protagonists regarding the airport concession developermodel are those with potentially conflicting interests in the success of that model. “UniteHere” claims to represent 30,000 food, beverage, retail and catering workers at North Americanairports, and that labor union clearly perceives a threat to its own interests from any shift to

21
greater privatization at such airports, including in the development and operation of non-aeronautical revenue sources linked to airport concessions. Its call for “labor harmony” (asstated in its policy pronouncements) can be interpreted both as a call for the effective deliveryof airport services that will directly benefit airports and the traveling public, but also as a self-interested effort to protect jobs, wage rates and fringe benefits. Therefore, while the AirportGroup (the research arm of Unite Here) findings that are discussed below is worthy ofevaluation on its merits, it is clearly a non-neutral source of such empirical evidence. Similarly,the primary innovator and promoter of the private developer model, BAA USA and itssubsidiaries, including “Airmall USA” is also non-neutral in its efforts to promote this approach.It is hardly surprising that it would perceive attacks upon it by the Airport Group to be“disingenuous and misleading” (see Lumley, 2011). Yet, a lot can be learned by reviewing theclaims made by both sides to this debate, especially when one focuses on which claims arerebutted as false in contrast to just being an incomplete part of the fuller story. And there islittle doubt that both organizations are in possession of critical data that must constitute anyserious effort to evaluate different airport concession models.
As described by the president of BAA USA, Mark R. Knight (the key pioneer for the developerapproach), that model includes the following features (see, Knight, 2009, p. 37):
A combination of national and international brands “that people recognize andtrust”
Regional/local brands that “inject local flavor” as well as providing businessopportunities to local entrepreneurs and “connect the airport to the localcommunity”
A core belief that more competition is good for both airport merchants andairline passengers
Prices that reflect local mall pricing rather than being perceived by airportvisitors as reflecting monopoly power linked to serving customers with fewalternatives while required to be in an airport. This is reflected in the slogan:“Regular Mall Prices… Guaranteed,” as reflected in the AIRMALL® concept firstintroduced at the Pittsburgh International Airport in 1992.
The specific AIRMALL registered concept as developed by BAA USA currently exists at only alimited number of American airports (in addition to Pittsburgh, those areBaltimore/Washington, Boston Logan, Terminals B and E, and Cleveland Hopkins). However,other airports considering concession redevelopment are potential candidates for thedeveloper approach, including Los Angeles, Chicago O’Hare, Fort Lauderdale, Seattle Tacoma,Minneapolis, and Detroit (see Lumley, 2011). As discussed in footnote 2 (and page 5), criticshave argued that the developer model generates especially bad results for workers employed inairport concessions, subjects airports to excessive risk linked to concessionaire turnover, andgenerates less rent per passenger to airports than other airport concession models.Meanwhile, proponents cite the ability of the developer model to generate significantly highersales per enplanement even in the face of lagging total enplanement, and that it has

22
revolutionized peoples’ perceptions of airport retail and dining. Because this debate hasrecently heated up considerably, it is worthy of additional documentation.
Tables 11, 12 and 13 replicate Tables 9-1, 9-2 and 9-3 from Knight (2009), in which thepresident of BAA USA attempts to document the ability of its more “pro-active, customer-driven and competitive concessions model” to turn around the concession business at modernairports (p. 39). Knight never clarifies the distinction between “sales” and “revenue,” a glaringomission that should never be allowed to appear in a published article. The word “net” isinserted before “revenue” inasmuch as the most likely distinction is that “costs of goods sold”(and possibly some other operating expenses) are subtracted from sales to generate thoserevenue figures. The later discussion surrounding Table 14 (below) focuses on actual rent perenplaned passenger, and rent as a percentage of sales actually paid to airports, measures notaddressed by Knight (2009).
Table 11Pittsburgh International Airport AIRMALL Data
Year 19__ or20__ /
Category
‘91 ‘93 ‘95 ‘97 ‘99 ‘01 ‘03 ‘05 ‘07 ‘08 %change91-08
Enplanement(millions ofpassengers)
8.3 9.2 10 10.4 9.4 10 7.1 5.2 4.9 4.4 - 47%
$ Sales /enplanement
2.69 5.77 6.58 7.38 9.02 9.03 10.3 12.48 13.55 13.6 406%
$ NetRevenue perenplanement
0.47 0.94 1.02 1.13 1.46 1.48 1.82 2.03 2.18 2.23 374%
Notes: 1991 was the final year under the previous master concessionaire contract; 2001 wasthe last year that U.S. Airways used Pittsburgh as a hub airport.
Table 12Boston Logan International Airport AIRMALL Data
Year /Category
1999 2002 2003 2004 2005 2006 2007 2008 % change99-08
Enplanement(millions ofpassengers)
7.4 7.4 7.5 8.9 8.3 7.2 7.6 6.58 - 11%
$ Sales /enplanement
4.87 5.94 6.3 7.03 8.13 9.19 9.85 12.17 150%
$ NetRevenue perenplanement
0.69 0.93 1.1 1.23 1.47 1.66 1.81 1.99 188%

23
Notes: 1999 was the final year under the previous master concessionaire contract.
Table 13Baltimore-Washington Thurgood Marshall Airport AIRMALL Data
Year / Category 2003 2004 2005 2006 2007 2008 % change 03-08
Enplanement(millions ofpassengers)
9.9 10.1 9.9 10.4 10.5 10.2 3.00%
$ Sales /enplanement
5.47 5.77 6.25 6.81 7.86 8.91 63%
$ Net Revenue perenplanement
0.65 1.08 1.12 1.16 1.33 1.46 125%
Notes: 2003 was the last full year of the master concessionaire model prior to BAA beginningits program. Through 2006, that program was only about 50% completed, and 2007 marks thepivotal year for the opening of many retail and restaurant units.
In response to published reports by the Airport Group (the policy and research arm of theairport concession workers union “Unite Here”) that claim the developer model is actuallyhaving negative effects on North American airports due to lower rents paid to airportscompared to peer airports using different concession management models (see below, thissection), Mr. Knight (on behalf of Airmall USA and BAA USA), further clarified and extended thedata reported in Tables 11, 12 and 13. As reported by Davitt (2011) of the Moodie Report,Knight made the following points:
After inheriting a master concessionaire’s model at Pittsburgh in 1992, 2010data reveal that sales per enplanement have risen from $2.69 to $13.45 (400%),net revenue per enplanement has risen from $0.47 to $2.15 (149%), and totalrent revenue generated by the property increased from $3.9 million to $8.8million (126%). Despite challenges to passenger traffic at that airport (perceivedby many to have been “dramatic”), the concession program at PittsburghInternational Airport remains “the gold standard for airport concessions since itsinception.”
Following the Airmall USA introduction of this model in terminals B and E atBoston Logan International Airport in 1999, 2010 data indicate an increase insales per passenger from $4.87 to $12.15 (149%), an increase in net revenue perenplanement from $0.69 to $2.15 (211%), and an increase in total rent revenueto airports from $5.1 million to $13.5 million (165%). Airmall USA alsocompleted a two-year $33 million concessions development project in 2008 thatturned part of the roof of a terminal into an addition of almost 20 new shopsand restaurants.
The experience at the company’s largest project, the Baltimore-WashingtonInternational Thurgood Marshall Airport, has also been very positive since itsinception in 2003 following the final year of the previous master concessionaire
24
contract. Based again on 2010 data, sales per enplanement increased from$5.47 to $8.81 (61%), net revenue per enplanement has risen from $0.65 to$1.41 (117%), and airport rent revenue has increased from $6.4 million to $15.5million (142%). Concession jobs have increased from 500 to almost 1,500.
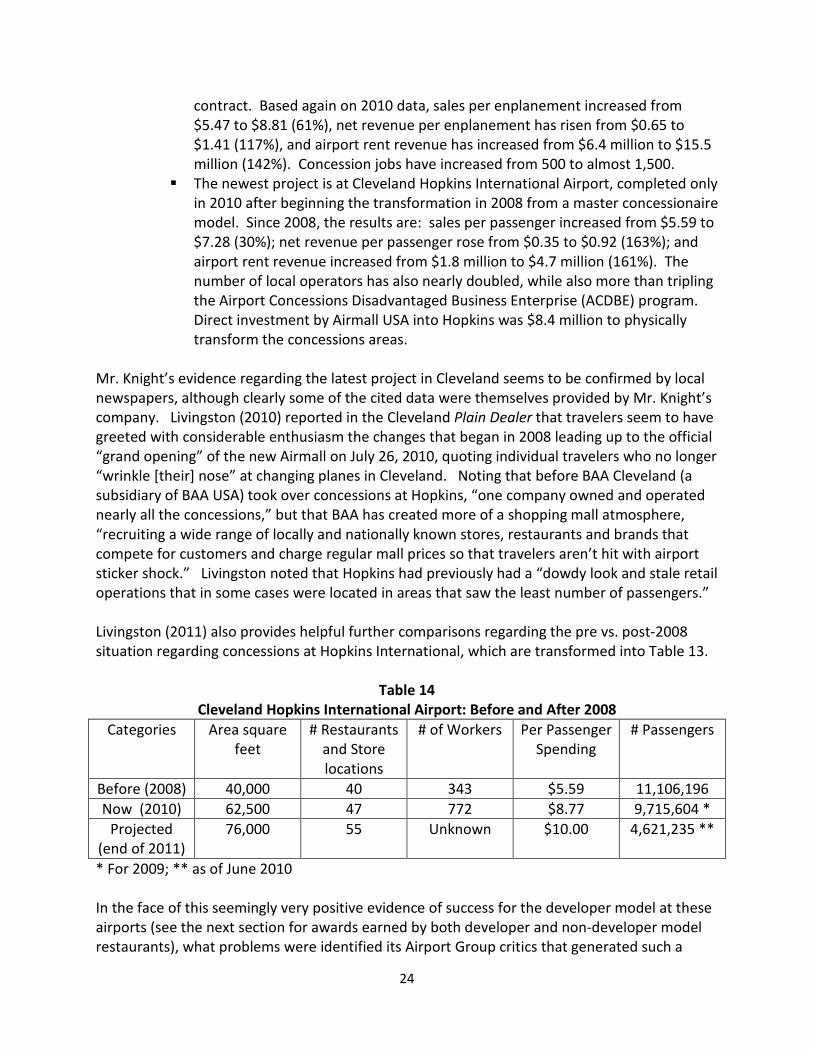
The newest project is at Cleveland Hopkins International Airport, completed onlyin 2010 after beginning the transformation in 2008 from a master concessionairemodel. Since 2008, the results are: sales per passenger increased from $5.59 to$7.28 (30%); net revenue per passenger rose from $0.35 to $0.92 (163%); andairport rent revenue increased from $1.8 million to $4.7 million (161%). Thenumber of local operators has also nearly doubled, while also more than triplingthe Airport Concessions Disadvantaged Business Enterprise (ACDBE) program.Direct investment by Airmall USA into Hopkins was $8.4 million to physicallytransform the concessions areas.
Mr. Knight’s evidence regarding the latest project in Cleveland seems to be confirmed by localnewspapers, although clearly some of the cited data were themselves provided by Mr. Knight’scompany. Livingston (2010) reported in the Cleveland Plain Dealer that travelers seem to havegreeted with considerable enthusiasm the changes that began in 2008 leading up to the official“grand opening” of the new Airmall on July 26, 2010, quoting individual travelers who no longer“wrinkle [their] nose” at changing planes in Cleveland. Noting that before BAA Cleveland (asubsidiary of BAA USA) took over concessions at Hopkins, “one company owned and operatednearly all the concessions,” but that BAA has created more of a shopping mall atmosphere,“recruiting a wide range of locally and nationally known stores, restaurants and brands thatcompete for customers and charge regular mall prices so that travelers aren’t hit with airportsticker shock.” Livingston noted that Hopkins had previously had a “dowdy look and stale retailoperations that in some cases were located in areas that saw the least number of passengers.”
Livingston (2011) also provides helpful further comparisons regarding the pre vs. post-2008situation regarding concessions at Hopkins International, which are transformed into Table 13.
Table 14Cleveland Hopkins International Airport: Before and After 2008
Categories Area squarefeet
# Restaurantsand Storelocations
# of Workers Per PassengerSpending
# Passengers
Before (2008) 40,000 40 343 $5.59 11,106,196
Now (2010) 62,500 47 772 $8.77 9,715,604 *
Projected(end of 2011)
76,000 55 Unknown $10.00 4,621,235 **
* For 2009; ** as of June 2010
In the face of this seemingly very positive evidence of success for the developer model at theseairports (see the next section for awards earned by both developer and non-developer modelrestaurants), what problems were identified its Airport Group critics that generated such a

25
vigorous defense by Mr. Knight and BAA USA? In addition to the argument that earnings andfringe benefits are lower for developer (BAA, USA) concession workers than for non-developermodel workers5, the evidence of importance for airports is that actual airport rent per enplanedpassenger paid at developer model airports lags behind the rent per enplaned passenger paidat major non-developer airports. This is essentially an argument that focuses on cross-sectiondata comparing concession developer and non-developer airports, in contrast to the BAA, USA(AirMall USA) evidence focused on time-series data showing improvements in sales and netrevenue after the developer model is substituted for the master concessionaire model. Table15 (derived but expanded upon from Tibrewal, 2011a; Airport Group) documents this evidence.
Table 15Cross-Section Evidence re: Rents paid to Airports
AirMall Developer1 vs. Non-Developer Airports (NDA)2
Developer ModelAirport (AirMall)
% Rent/Sales Rent/EnplanedPassenger
% Rent/Salescompared to15% averageat NDA
Rent per EnplanedPassengercompared to $1.33average at NDA
Baltimore-Washington 11.6%3 $1.00 - 3.4% - $ 0.33
Boston Logan 10.4% $1.27 - 4.6% - $ 0.06
Pittsburgh 10.1% $1.39 - 4.9% + $ 0.06
Cleveland 9.8% $0.57 -5.2% - $ 0.76
Overall Performance4 10.7% $1.04 - 4.3% - $ 0.29
Simple un-weightedAverage Performance
10.475% $1.0575 - 4.525% - $ 0.2725
Simple un-weightedAverage Performancew/o Cleveland
10.7% $1.22 - 4.3% - $ 0.11
Notes:1. Based on 2009 sales and rent data from individual airport authorities. Passenger data isderived from the Airport Revenue News Fact Book, 2010.2. Based on 25 U.S. major airports without a private developer which provided rent figures inthe Airport Revenue News Fact Book, 20103. Sales data from Airport Revenue News Fact Book, 2010; Rent data supplied by the MarylandAviation Administration.4. These AirMall results are derived by dividing total rents paid by total concession salesgenerated (raw data not reported by the Airport Group), and are not the simple average of thefour individual results. Those simple averages both with and without Cleveland are inserted in
5In 5 Things to Know About Developers (2008, p. 6), the Airport Group provides a table comparing “Union Prime”
and “BAA” concession worker wages and benefits, with average wages of $9.96 for Prime vs. $8.50 for BAA, annualwage income of $20,717 for Prime vs. $17,680 for BAA, and 100% of Prime workers being offered medical andretirement benefits vs. only 43% and 45% for BAA. Furthermore, it is claimed that Prime workers are only requiredto pay $29.80 per month in medical premiums, compared to $181.70 for BAA employees.

26
the two rows below. Because Cleveland is a very new AirMall facility (see above), it is useful toomit to see how sensitive those un-weighted results are to its omission.This argument that there was less rent generated to airports under the developer model thanat non-developer airports was supplemented in a second report in a series on this issue by theAirport Group. This second report “Sales Not Enough to Justify Lower AirMall Rents (Tibrewal,2011b) conceded that sales per enplaned passenger in 2009 were greater at Airmall airportsthan at non-developer airports, but by only 3.8%, which was inadequate to make up for thelower rental rates being paid by the concession developer to those AirMall airports.Furthermore, over the entire period 2003 to 2009, the increase in sales per enplanedpassengers was nearly identical at Airmall developer airports (41.9%) and at “peer” non-developer airports (42.4%). 6 Given the average 15% of sales paid in rents at the peer airportscompared to the 10.7% average for developer airports cited above in Table 15, the AirportGroup argues that developer airports would need to generate $140 million in concession salesfor every $100 million in non-developer concession sales in order for airports to receive thesame rents (a 40% difference, far In excess of the 3.8% difference experienced in 2009).
A particular more detailed comparison was provided for two airports with very similar enplanedpassengers in 2009: Baltimore-Washington with 10.5 million passengers and with its five yearold concessions program organized by AirMall, compared to Salt Lake City International Airportwith 10.2 million passengers and with its ten year old concessions program managed directly bythe City’s Department of Airports. Concession sales at Baltimore-Washington Internationalairport were indeed notably higher at $90.07 million, compared to the $72.48 million at theonly slightly less busy Salt Lake City International airport (with only 2.86% fewer passengers itgenerated about 20% less concession sales). However, the “portion of sales captured by theAirport” was only $10.45 million at Baltimore-Washington compared to $10.61 million at SLC (adifference of about 1.5%).
The AirMall rebuttal to these criticisms is instructive. Mr. Knight of AirMall USA seemingly doesnot challenge the Airport Group data, but apparently views them as simply providing anincomplete picture. In addition to a further elaboration of the success of AirMall concessionsover time at the AirMall airports since replacing the former master concessionaire programs(see Tables 11, 12 and 13, and the expanded bullet points above on pp 23-24), Mr. Knightresponded by stressing the inadequacy of measuring airport benefits solely by rents receivedfrom concession sales. He argues that expanding concession sales is only “part of the equationwhen studying what the airport authority receives in return for partnering with a developersuch as AirMall” (Lumley, 2011). His primary point is that AirMall has made major upfrontinvestments in the “permanent infrastructure” of those airports it serves (consistent with a keyelement of the developer model), and that such improvement in facility amenities saves theairport authorities from having to make those millions of dollars in investments themselves. In
6As with the data in Table 15, “peer airports” are defined as the 25 U.S. airports lacking a private developer on the
ARN (Airport Revenue News Fact Book 2010) top 50 performing North American airports list which provided rentfigures. By contrast, the AirMall developer airports for the 41.9% growth rate included Baltimore-Washington,Boston and Pittsburgh, but not Cleveland, which was not really operational until 2008. . However, the 3.8% figurefor 2009 does include the Cleveland airport in the AirMall sales figure.

27
summary, “quite simply, this cannot be overlooked when it comes to what a developer bringsto the table” (Lumley, 2011).
This exchange confirms that the data reported in the Tables above are not particularly indispute, but that a full picture of the relative benefits to major North American airports ofshifting to a developer concessions model cannot easily be obtained by examining one or twoeasily documented “metrics” (also see the next section). Furthermore, despite the modestlyincreasing developer presence at key American airports, the Airport Group observes that in factfew airports have chosen the developer model, identifying 31 specific instances in which thedeveloper model has been rejected between 2003 and 2008, including Atlanta Hartsfield-Jackson International Airport’s rejection of that model for food and beverage concessions forConcourse E in 2005, and it’s rejection of the developer model for all retail concessions in 2007(see Airport Group, 5 Things to Know…., 2008, p. 2).
Nevertheless, the Airport Group on behalf of the concession workers union Unite Herecontinues to monitor and express concern about the “risks” (arising from what it calls“workforce stresses”) from potential airport contract turnover, which it labels “majorconcession leasing transitions” (Harwell, 2009). The Harwell report distinguishes among ten“lower risk/regulation airports,” two “moderate risk/previously regulated,” and sixteen “higherrisk/unregulated” airports Atlanta Hartsfield-Jackson is one of the two “moderate risk”airports (along with Ft. Lauderdale), which is considered to have had protected “laborharmony” via its RFP from 2008, but which represents some risk via its food concessioncontracts pending in 2011 (see p. 7 above).7
The issue of national versus local brands
Regardless of the relative merits of the developer model regarding airport penetration,concessionaire sales growth, airport rents, infrastructure investments, labor harmony, andsmall business turnover, there is little doubt that the AirMall concept has been a highly visiblecomponent of the dramatic changes taking place at North American airports. Reporting on the2007 Airport Concessions Conference put on by Airports Council International - North AmericanChicago in November 2007, Stanley (2008) observes that the main theme was clear: “upgradethe customer experience” because those customers have increasingly high expectations, are“demanding variety, healthy options, and [have] an eye on environmental and ethicalconcerns”. She reports “the good news is, the current food and retail trends are conducive toairport concessions.” She quotes Shauna Forsythe, president of Alliance Airport Advertising,with what was the clear consensus opinion: “Our airports look nothing like they did ten yearsago,” and of course that trend toward change has only strengthened since that conference.
The following important observations were made by Stanley (2008) in summarizing theconcessions conference:
7In fact, the Atlanta airport announced “package structure strategy” for 2011 and 2012 includes 24 terminal food
and beverage concessionaire spaces, all retail locations (27) in the pending new Maynard H. Jackson InternationalTerminal (Concourses E and F), covering a total of 126,000 square feet of concessions space
28
As noted above, the average passenger is now spending twice as much time inairports as only a decade earlier.
The influx of immigrants and the expansion in international travel hassignificantly increased the demand for dining variety and different flavors of food.
The trend toward localization in airports is likely to continue since it not onlybrings local food flavors to passengers, but includes an advertising message aboutthe city and upgrades the traveler experience.
People increasingly want to feel good about their choices, “even righteous,” so itis important to give them “socially and ethically sound choices, as well as healthyoptions.” However, there is a limit to healthy eating at airports, since people arestill reluctant to sacrifice flavor for health, and organics, while increasinglypopular in the broader culture, have had a more difficult time succeeding atairports.
Making better use of time is key, so it is wise to experiment with offering unusualairport services like flu shots (introduced at O’Hare in 2007), one-minutemassages, ten-minute manicures.
The onset of automation and vending continues to grow, with one example being:the Apple and Motorola automated retail stores by Zoom systems, which tookfirst place for best new retail concept in North America at the conference.
In addition to making better use of space via automation and vending, recognizingthat children’s play areas need updating is important – increasingly tech savvykids may be happier with video games than larger play spaces., or no play spacesat all since they are more capable of entertaining themselves with their ownmobile devices.
One of the most important observations made by Stanley, and confirmed by many othercommentators, is that the trend toward more localization in retail shops and restaurants shouldnot obscure the ongoing importance of having the right national brands. Getting the right mix oflocal and national/international brands is clearly complex, and may well vary airport by airport(Airport Revenue News, 2006). One notable trend at Atlanta Hartsfield-Jackson, as reported byconcessions supervisor Bernard Latimore, has been an increase in the number of new businessowners, especially new international retail operators (Contino, 2011).
Stanley quotes Paul McGinn, president of MarketPlace Development, who identifies four criticalbenefits of having well-known national brands at airports: (1) instant recognition; (2) consumercomfort; (3) consistency; and (4) concession program credibility. McGinn makes the especiallyinteresting point that even if airports want national brands, not all national brands want tooperate in airports. He identifies the most common problems for national brands operating atairports: limited space size; the often difficult leasing and development process; and operatingcomplexities. By contrast, he identifies various strong points regarding national brand airportoperations: high traffic, exposure to core customers, high visibility, captive customers, andpredictable buying patterns.
Furthermore, the concessionaire model that works best with national brands may well vary withthe degree of enthusiasm those brands already have for operating in airports. For example,
29
McGinn believes that a direct leasing approach works best for national brands that already haveairports as part of their business strategy, since national brands want to work from good locationswith correctly sized spaces, possible co-tenancy and shared risk. By contrast, to attract nationalbrands who normally shun airports, he recommends a master concession operator approachwhereby the national brand can have a license agreement with the concession operator to helpmarket the brand into a particular airport, and operate it for them relying upon the existingexpertise of the concession operator.
What is actually known about the optimal mix of national versus local brands in airportconcessions? The San Francisco International Airport (SFO), with its domestic terminals nowoperating with direct concession leases, is known for having the highest per enplanement foodand beverage sales in the country, identified as $6.58 as of 2008, with Boston in fourth place at$5.77, Seattle in ninth place with $5.52 and Denver in tenth place with $5.50 (see Levine, 2009,also citing Wall Street Journal Magazine: Smart Money, November 2008). Levine (the ChiefOperations Officer for Tastes on the Fly) identifies “an extreme case of sense of place” as thereason for the SFO success, with the new International Terminal being launched with 100% localoperators, domestic terminals also renovated with a more local emphasis, and a concertedmarketing campaign to stress the “restaurants of SF” in contrast to food courts. Bruce Boudreau(Director, Jacobs Consultancy, who worked with the San Francisco Airport when it restructuredits domestic terminals to direct concession leases) observes that n the specialty retail category,national brands typically generated from 50% to 100% of airport concession revenues, but thatnational brands are much less important in the food and beverage category (Airport RevenueNews, 2006). He also cites the SFO as an example of the importance of local brands in food andbeverage concessions, claiming that 80% of such revenues are local and only 20% national. Herecognizes, however, that San Francisco is somewhat unique in being particularly “dense withmulticulturalism and many independent restaurants,” but that it has also been especially good atcultivating its Disadvantaged Business Enterprise (DBE) program and also in hiring professionalretailers.
But even Levine of Tastes on the Fly, while lauding the SFO for its success in exploitinglocalization in its airport restaurants, identifies a “sense of place” as only one of four overall keysto success in the food and beverage category at airports, with the others being “a restaurateurmentality,” “a desire to be innovative,” and “a balance of local and global brands.” AirportRevenue News (2006) reports that while some big name brands do not succeed at airports, othersdefinitely do, and that Concessions International (CI, which has always had a huge presence inAtlanta, see p. 5 above) has 13 national brands in airports, with $9 million annual sales fromWendy’s and $5 million from Houlihan’s in 2005.8 In fact, the CI experience seems to havebeen that “national brands greatly outperform non-brands” and that well-known brands arecapable of providing “predictability, quality and comfort” - factors that are also cited by anotherconcessionaire, HMSHost (Host) as being vital to success (Airport Revenue News, 2006). Butthe clear consensus is that national branded programs are not the best option for every airport,and may not be supported by sufficiently high enplanement levels which are required to support
8Airport Revenue News also quotes Concessions International president Anthony Joseph as explaining the
company’s partnerships with national companies as typically being franchise agreements with specializednegotiated provisions. But with newer “emerging brands” or those choosing not to develop a franchise system,the usual arrangement is a licensing contract “according to agreed specifications.”

30
such systems and the costs linked to having many national brands, and that even if enplanementsare high enough, an excessive focus on national brands undermines the important role thatairports play as “regional showcases” (Airport Revenue News, 2006, citing Lisa Strollo, SeniorVice President of Merchandising, Hudson).
While one would prefer to identify a magic formula for airport concessionaire success, BruceBoudreau of Jacobs Consultancy seems to sum up the consensus regarding the absence of adominant ratio of national to local brands, especially across both retail and food and beveragesegments, when he says:
“It’s all over the place. Some airports have no national brands. Some are heavilynationally branded. Depending on the age and the layout of the airport it can be tough toget national brands in parts where traffic is dispersed and there are multiple securitylocations. In larger markets you can say there are a lot of good local concepts, and thebigger the market, the more potential, but in other cases local may mean local ownershipso a national franchise works well for them. If they’re more concerned with localownership including DBE participation, getting a national brand with local ownership isbetter” (Airport Revenue News, 2006).
But experts seem to agree that there has been a slowdown in the national brands trend, especiallyin specialty retail, where buying products from the Gap or Brookstone just does not seem like acompelling activity away from home (see Contino, 2011, and Airport Revenue News, 2006). Ofcourse, “specialty retail” should not be assumed identical to some unique local business concept.For example, Rosetta Stone has an increasing presence at the Atlanta airport, where the keyinnovation is the attempt to sell up to 23 different foreign language software programs costing anaverage $295, hardly a typical spontaneous purchase while killing time waiting for a flight(Contino, 2011, pp. 5-6).
At least when it comes to food, it seems that localization is increasingly getting the upper hand,especially when it comes to visibility and publicity. For example, USA Today asked Frommer’sTravel Guides to identify the ten best restaurants at U.S. airports, and only one of the ten was anationally known brand (Legal Sea Foods, which has three restaurants in three differentterminals at Boston Logan, although only the one in Terminal C has the “traditional” version ofthat restaurant; see Stoller, 2011). For the record, Stoller (2011) identifies the ten inalphabetical order by airport as:
1) Atlanta: One Flew South (Terminal E)2) Baltimore: Obrycki’s (Gate B-11)3) Boston: Legal Sea Foods (operating as Legal Test Kitchen in Terminal A; Legal
C Bar in Terminal B, and Legal Sea Foods in Terminal C)4) Chicago O’Hare: Tortas Frontera (Terminal 1)5) New York JFK: Deep Blue Sushi (Terminal 5)6) New York LaGuardia: Custom Burgers by Pat LaFrieda (Delta Terminal)7) Los Angeles: Encounter at LAX (center of airport before security)8) Minneapolis: Ike’s Food and Cocktails (at the Mall near Concourse E)9) Raleigh: 42nd Street Oyster Bar (Terminal 2)

31
10) Seattle: Ivar’s (central terminal)
Two of those restaurants are linked to the AirMall concept discussed above (Obrycki’s atBaltimore-Washington, and Legal C Bar in Boston), and Airport World (2011) especially laudsObrycki’s Crab House (an 80 seat restaurant opened at the BWI in 2008) as a well-known andvery popular seafood proprietor in Baltimore with a reputation for high quality, that increasedsales at BWI in its first year of operation by $0.5 million compared to the previous tenant in thatspace. In fact, AirMall (AIRMALL ®) has also won other honors, with its Pittsburghconcessions winning first place among all U.S. airports in the food, shops, and amenitiescategory in Conde Nast Traveler’s 12th Annual Business Travel Awards, and Conde Nast hadconsistently given AIRMALL at PIT high marks (Allegheny County Airport Authority, 2009).AirMall USA has also been innovative with the introduction at BWI of “two new airsideconcepts,” Be Relax (a massage facility also offering beauty services), and Jamba Juice (Knevitt,Moodie Report, 2011).
Finally, what comparisons can be made regarding the concessions at the five busiest airports inthe United States (Atlanta ATL; Chicago O’Hare ORD; Los Angeles LAX; Dallas-Fort WorthDFW; and Denver DEN)? While none of these airports is operating under the developer model(and none are formally using the AirMall concept), all of them reflect in varying degrees thechanges that characterize contemporary airport concessions. Table 16 highlights importantfeatures of concessions at each airport.
Table 16Summary of Concessions at Top Five American Airports
Airport Model * Street Price Sales PerEnplanement
2007 *
Latest Sales /Enplanement
TotalLocations
Mix ofConcessions/Other
Information
ATL MPCI = prime
Yes;unclearenforcing**
$7.15 NA > 200;(153 1);
263(Airport
FactSheet)
46.4% of 153 companiesare restaurants, cafes orbars; 53.6% retail. 1 FromAirport Fact Sheet: 114F&B; 90 retail andconvenience; 3 duty free;56 service centersincluding banks; 230,000sq. ft.
ORD D+PHostMarriott =prime
Yes, at leastfor F&B #
$7.86 $9.63 (2010);$6.69 F&Bonly #
171# 118,465 sq. ft; 62%stores = F&B; 15.8% =specialty retail; 16.4% =news/gifts; 5.8% = dutyfree/services
LAX D+PHost Intl.Camacho
No *** $8.62 $8.983 1403 55% F&B; 45% Retailbased on LAXspreadsheet listing 2003-

32
Ventures;DelawareNorth =prime2
2008
DFW Direct Yes + 10% * $7.52 $7.77 (goal$10 withnewconcessions);Terminal A;$12 TerminalD (2010)4
136* 5.4% full serverestaurants; 30.6% quickserve restaurants; 6.3%bars; 20.7% news/gift;36.9% specialty gift.*Terminal A now has 13local brands and 20national brands; localbrands might fall to 5 (25proposals rejected) withnew Terminal A; newbrands = Qdoba,Mexican Grill, Salt LickBar-B-Que,Juicy Couture,Twisted Root (local) andCowboys StadiumLegends Club 4
DEN(DIA)
Direct Yes, + 10%##
$8.47 2010: $7.98Concourse A;$9.16;Concourse B;$7.17Concourse C;$1.44Terminal 5
>140** 167,457 sq. ft.; includesBrookstone, Radio Road,Rocky MountainChocolate, TimberlineSteakhouse, NewBelgium Hub **
Notes: Model terminology: MP = multiple prime concessionaire; D+P = Direct contract plusmultiple prime concessionaire; Direct = Direct or Standard Leasing; CI = ConcessionairesInternationalStreet pricing (called “Regular Mall Prices: Guaranteed” at AirMall airports, none of which are inTable 16) is the stated policy that airport concession prices will be no higher, or at least nomore than x% higher than for similar products outside the airport In the surrounding metroarea. It is unclear how effectively these policies are enforced, and they are sometimes activelyresisted by airport concessionaires (see, Berry, 2008; O’Malley, 2009).1 The Hartsfield-Jackson Concession Brochure (2011) claims more than 200 concessionlocations; a count of the listed “shops and restaurants” (excluding car rental offices) sums to153, but some have multiple locations, which accounts for the discrepancy.2 Based on the latest contracts just signed in June 2011; see Zahniser (2011).3Estimated from LAX spreadsheet reports on concession revenues 2003-2008.4 See Star-Telegram.com (May 2011)5 Denver International Airport (2011)

33
* Data from Jacobs Consultancy (2008), slide 3, 5, or 21Other sources: **Contino (2011); # Chicago Department of Aviation (2011); ##City and Countyof Denver, Department of Aviation (2007); ***Engle (2010)
North American airport concessions are changing rapidly, with every one of the major airportsin Table 16 in some stage of transition and re-evaluation of their concession programs. AtlantaHartsfield-Jackson is a key participant in this revolution, earning the prestige of being awardedin March 2011 the Airport Revenue News “Best Airport and Concessionaire Award for 2011.” Italso received the “Best Concessions Program Design Award” in the large airport category forthe second consecutive year, as well as the “Best Concessions Customer Service Award” for2011. Its press release announcing these awards cited in particular certain changes over thepast two years such as the introduction of national upscale retailers such as Sean Jean, Lacoste,Brooks Brothers, and Ermenegildo Zegna, and technology stores such as Techshowcase andBlackberry from Wireless Giant (the first at any airport). Local regionally identified brandingseems to have played little role in this recent success.
Major changes have clearly been needed in Atlanta, since as documented in Table 16 and abovein Figure 1 (Section 1), Hartsfield-Jackson has lagged its chief competitors in generatingconcession sales per passenger enplanement. It also seems to significantly lag other majorairports in the transparency of its concession data reporting. It is the only airport in Table 16for which no reasonably current data seem available on total sales per passenger enplanement,data that is customarily reported as part of concession brochure information or easilyaccessible spreadsheet records at other major airports. While it is true that one can diligentlysearch the City of Atlanta budget data to obtain to obtain the Department of Aviation AnnualReport, in which “Total Concessions” revenue are reported under “Non-Airline Revenues.” Butthose revenues are apparently only the rental payments received from concessionaires. Suchdata are very useful and they reveal a compound annual growth rate of 6.62% between 2001and 2010, and 6.04% from 2007 to 2010. But it is seemingly impossible to uncover the grosssales revenues being generated, and there is certainly no available data by Concourse (orindividual concessionaire), or broken down by category (retail vs. food and beverage, e.g.), incontrast to other airports for which at least some of those very detailed data are available.
The Denver International Airport reports the following data for both 2009 and2010 for each of its three concourses plus the terminal: total enplanements, andtotal sales, sales per enplanement, and sales per square foot of concession spacefor each of three separate categories (food and beverage, retail and services).
The Los Angeles International Airport made available in May of 2009 a detailedspreadsheet documenting gross concession receipts and square footage for eachconcession facility from 2003-through 2008 identified by company name,terminal location, and type (F&B vs. retail)
The Chicago Department of Aviation makes publicly available the followingcombined 2010 data for Terminals 1, 2 and 3 for each of five categories (F&B,News/Gifts, Specialty Retail; Duty Free, and Services): Number of stores; Area insquare feet; total dollar sales; sales per enplanement; and sales per square foot.

34
Dallas-Fort Worth hired the Jacobs Consultancy to generate a very detailedreport about its concession operations (as well as useful comparison data aboutother airports), and includes as part of its Concessionaire Forum (June 20, 2011)the following data: a concession sales growth update for May 2011 for each ofthe following food categories: pizza, sit down dining, coffee, ice-cream/yogurt;deli; fast-food; snacks, bar, and other quick serve; as wells as each of thefollowing retail categories: spa, duty free, convenience store, newsstand,specialty retail, and kiosks. It also provides aggregated data by concourse, andoverall F&B and retail, and also provides a day to day trend line for May 2011comparing Terminal A and Terminal C documenting the effects of flightmovements from Terminal A to Terminal C, and the effect of closures in TerminalA, as Terminal A is being renovated (see Table 16 above).
By contrast, Atlanta provides no such data in its own Concessionaire Brochures, or inpresentations to prospective concessionaires (such as the one held in early 2011), and the onlydata that could be found regarding current total gross concession sales was the claimed $336million in “annual revenue” obtained from “managing a 250 location concession program” thatwas part of the LinkedIn profile for Paul Brown, when serving as Director of Concessions atHartsfield-Jackson International Airport.
The effects of ongoing technological change
In addition to the trends identified above, this sub-section briefly highlights several points:
Ongoing technological improvements are allowing ever-expanding self-servicekiosks to sell specialty retail. ZoomSystems has been especially prominent, andAtlanta has exploited this trend, perhaps in part because SITA/Air TransportWorld self-service surveys have shown Atlanta airport travelers especiallysupportive of self-service technology compared to passengers in airports likeBeijing, Frankfurt, Moscow, Mumbai, Johannesburg and Sao Paolo. This alsoextends to on-line check in, with a frequency that has increased from 29% to72% from 2009 to 2010, and with 57% of those interviewed already using eitherkiosks or mobile devices to check-in (SITA and Air Transport World, 2010).
Mobile devices have created greatly expanded potential for two-way dialoguewith customers, and real –time advertising and information transmission linkedto the locations of passengers within airports and specific concession facilities,sometimes called “proximity marketing” (see e.g., Cook, 2008).
While much of the self-service trend is focused on specialty retailing, it can alsobe exploited to sell higher quality foods and beverages, even in the face of aparallel tend toward higher quality sit-down dining within airports.
Ongoing improvements in cooking facility technology is allowing for thepreparation of higher quality and more diversified food options within thenormally more constrained spaces available for airport concession dining.

35
V. Conclusions
The discussion above has documented the important issues and trends affecting airportconcessions, and we can expect to see the further development of wine bars, specialty retailand services from massages and spas to immunizations, banks and post offices. Some airportshave revolutionized their look and appeal with the AIRMALL concept (e.g., Pittsburgh,Baltimore-Washington, Boston, and Cleveland), some with a dramatic shift to localization (SanFrancisco), and others with an upgrading of national brands and innovative high tech retail(Denver in process, and Atlanta). According to Jacobs Consultancy, 10 of 23 surveyed airportsin 2008 claimed to have a policy of “street pricing plus 10%,” 9 claimed to enforce street pricingwith no markup (called Regular Mall Prices – Guaranteed” by AirMall USA), and only 4 claimedto have no explicit pricing policy. Yet, Jacobs Consultancy also observes that “we believeairport industry pricing policies are inconsistently enforced, particularly airports claiming ‘truestreet pricing’” (2008, slide 20).
As a result of enhanced security at worldwide airports, the average time spent by air travelerswithin the confines of airport terminals has more than doubled in ten years, and the averageairline traveler is highly educated and with relatively high income. The tolerance of airportvisitors for shoddy service, mediocre shopping options, and excessively high prices hasdramatically declined, and as airports face the vicissitudes of fluctuating airline fuel prices andmacroeconomic turmoil, the necessity of improving their non-aeronautical revenues hasbecome obvious. While the adoption of the developer model as the exclusive approach toconcession management has been slow and controversial (despite some high profile successes),no major airport today relies upon the “opposite approach” of a single master concessionaire.The most common approach is a combination of models, especially joining multiple primeconcessionaires with direct/standard leasing, with a common approach being one model in oneterminal or concourse, and another model elsewhere. A number of important airports usesome combination of all three: multiple concessionaires, direct leasing, and developers.
With the optimal mix of national and local brands varying with airport size and unique regionalcharacteristics, and with the necessity of injecting more competition and reasonable pricinginto airport concessions while still being able to attract ever higher quality operators in anenvironment of rapid technological change and labor relations challenges, no airport operatorcan afford to rely on some of the failed practices of the past. Airport concessions were oftenviewed at best as stable, but uninspiring revenue sources for airport expansion revenue bonds,and at worst as political plums to be allocated to cronies and political supporters. Stayingahead of the curve in airport concession management has become, by contrast, one of themost dynamic challenges facing managers in the early 21st century economy.
References
Airport Revenue News (2006). “Getting the mix right – airports and retailers ponder thenational vs. local question.” December 13, 2006.

36
Airport Group (2008). 5 Things to Know about Developers: How BAA and other DevelopersShortchange Workers and Airports, July athttp://www.airportgroup.info/Documents/AirportDevelopment7-08.pdf
Airport World (2011). “Airmall Restaurants win Frommer’s Travel Guide Awards,” March 4.
Allegheny County Airport Authority (2009). “Conde Nash Traveler Survey: Airmall at PittsburghInternational Airport Wins Top Ranking in Annual Conde Nash Travler Survey,”FlyPittsburgh.com, October 8 (at http://www.pitairport.com)
Ameche, Kathleen (2007). The Woman Road Warrior: An Expert’s Guide to Domestic andInternational Business Travel, 2nd Edition. Agate Publishing. On line- informationprovided on Major U.S. Airports, 2008.
Arbitron Inc. Custom Research Report (Bouvard, P, and Williams, D) (2004). The ArbitronAirport Advertising Study: Exploring an Undiscovered Upscale Medium.
Arbitron Inc. Custom Research Report (Williams, D.) (2007). The Arbitron Airport TelevisionStudy: Getting TV Commercials Out of the House and in Front of Affluent Consumers.
Arthur D. Little (Bamberger V., et al.) (2010). Mastering Airport Retail: Roadmap to NewIndustry Standards
Berry, Jahna (2007). “’Street pricing’ a tough sell for airport restaurants,” The Arizona Republic,April 20.
Boudreau, Bruce and Davies, Gary (2010/2011). “Consultant’s Corner” review of ResourceManual for In-Terminal Concessions (LeighFisher in cooperation with Exstare FederalServices Group, LLC, 2011), Airport Revenue News, December 2001/January 2011.
Chicago Department of Aviation (2011). “Food and Beverages at O’Hare.”http://flychicago.com/PassengerInformation/CustomerService/OHare
City of Atlanta, Georgia, 2010 Annual Report, “Total Annual Revenues, Expenses, and Changesin Net Assets; and “Principal Revenue Sources.” Department of Aviation, pp. 63 and65.
City and County of Denver, Department of Aviation (2007). DIA Concession Policy, July 18, 2007.
Contino, Kristin Larson (2011). “Specialty Retail Soars at Airports,” Specialty Retail Report,Winter 2011;http://www.specialtyretail.com/2011/winter/retailing_locations/specialty_retail_soars_at_airports

37
Cook, Robert (2008). “Increasing Airport Retail Spend: Winning through Customer Knowledge,”Blackstone Gates, presented at Passenger Terminal Expo, 2008. .
Davitt, Dermot (2011). “Airmall USA hits out at union study into airport concessions,” TheMoodie Report, June (at http://wwwmoodiereport.com)
Denver International Airport (2011). Concessions Program 2010 Results, March 15, 2011(presented by Bryan Touchstone); pdf file linked tohttp://business.flydenver.com/bizops/concessions.asp
DFW Concessionaire Forum, June 20, 2011
DFW Terminal Performance History, from the DFW website.
Engle, Jane (2010). “Airport food prices can eat up your budget,” Los Angeles Times, July 18.
eXpect delaYs Travel Delay Blog (a regularly updated compendium of information about all U.S.major airports, focused on facilities concessions, shopping, relaxation and all ways tospend time while at airports); http://www.expectdelays.com
Geuens, Maggie, Vantomme, Delphine, and Brengman, Maliaika (2004). “Developing a typologyof airport shoppers,” Tourism Management 25: 615-622.
Harwell, Blake (2009). Airport Ratings Advisory: Protecting Non-Aviation Revenues, athttp://www.airportgroup.info/AirportL+MHubsreport.pdf
Hartsfield Jackson Concessions Brochure, from the Atlanta Hartsfield Jackson InternationalAirport website (2011).
Jacobs Consultancy (2008). Food/Beverage and Retail Concession Performance Assessment:Dallas/Fort Worth International Airport, Final Presentation. Available as pdf file.
Knevitt, Genevieve (2011). “Airmall USA opens two new retail concepts at BaltimoreWashington,” The Moodie Report, July 12 (http://www.moodiereport.com)
Knight, Mark R. (2009). “Taking Flight: Airport Shopping and Dining: A Retail Evolution is TakingShape in the Nations’ Airports,” Research Review, 16(1): 37-40.
LAX Spreadsheet Revenue 2003-2008.http://www.lawa.org/uploadFiles/laxconcessions/LAXFSpreadsheetrev050709.pdf.
LAX Concessions Financial Status Report CY 2010.http://www.lawa.org/uploadedFiles/laxconcessions/ConcessionsFinancialStatusReportsCY2010

38
L.E.K. Consulting (Satchu, J. and Neopole, B) (2009). “U.S. Airports Increase Your Performancethrough a Radical Reconsideration of Your Non-Aeronautical Revenues,” ExecutiveInsights, XI (12).
Levine, Michael (2009). Presentation: Airport Restaurants: Dining Today and Tomorrow: AnIndustry Update, Tastes on the Fly.
Livingston, Sandra (2010). “New Airmall at Cleveland International Airport Gives Travelers Moreand Better Options,” July 26 (at http://blog.cleveland.com/metro)
Lumley, Bill (2011). “Airmall USA dispute enters second phase: Concessionare attacks AirportGroup report which criticizes airport concessions private developers,” DFNI Magazine,May 20 (at http://www.dfnionline.com).
O’Malley, Chris (2009). “Airport retailers want relief from street pricing policy,” IndianapolisBusiness Journal, November 21 (see http://www.ibj.com/airport-vendors-hungry-for-revenue/PARAMS/article/11343)
Port Authority of New and New Jersey (2008). 2008 Annual Airport Traffic Report.
Port Authority of New and New Jersey (2009). 2009 Annual Airport Traffic Report.
Sharrow, Ryan (2011). “AirMall defends BWI concessions model,” Baltimore Business Journal,February 28.
SITA and Air Transport World (2010). 2010 Passenger Self-Service Survey.
Stoller, Gary (2011). “Frommer’s picks top 10 airport restaurants,” USA Today, March 7
Stanley, Anna (2008). “Changing demands and expectations offer opportunity, and revenue, forairports,” Airport Business.com Magazine.
Star-Telegram.com (2011). “New concessions chosen for D/FW’s Terminal A,” May 4.
Sulzmaier, S. (2001), Consumer-oriented business designs: The case of airport management.Heidelberg, New York: Physica-Verlag.
Tibrewal, Bhav (2011a). “Less Rent Generated under the Developer Model,” Airport Group(first in the Airport Group series AIRMALLed: Failures of the Airport ConcessionsDeveloper Model), (www.airportgroup.info).
Tibrewal, Bhav (2011b). “Sales Not Enough to Justify Lower AIRMALL Rents,” Airport Group(second in the Airport Group series AIRMALLed: Failures of the Airport ConcessionsDeveloper Model), May (www.airportgroup.info).

39
Wall Street Journal Magazine (Smart Money) (2008). “Airport Epicure: Flight delays andheightened security have helped create a booming business for big name chefs like ToddEnglish and Wolfgang Puck,” November: 98-101.
Zahniser, David (2011). “LAX concession contracts OKd,” Los Angeles Times, June 22.


