Ref. : ASK/UD/2020-21/Q-3 IP January 28, 2021 The National Stock Exchange (India) Ltd., Exchange Plaza, Bandra-Kurla Complex, Bandra (East), Mumbai – 400 051. BSE Limited, Corporate Relationship Department, P. J. Towers, Dalal Street, Fort, Mumbai – 400 023. Code : PRSMJOHNSN Code : 500338 Dear Sir, Pursuant to Regulation 30 of the SEBI (Listing Obligations and Disclosure Requirements) Regulations, 2015, we submit herewith a copy of the Investor Presentation - January 2021. Thanking you, Yours faithfully, for PRISM JOHNSON LIMITED ANEETA S. KULKARNI COMPANY SECRETARY Encl. : As above
Transcript
Ref. : ASK/UD/2020-21/Q-3 IP January 28, 2021 The National Stock Exchange (India) Ltd., Exchange Plaza, Bandra-Kurla Complex, Bandra (East), Mumbai – 400 051.
BSE Limited, Corporate Relationship Department, P. J. Towers, Dalal Street, Fort, Mumbai – 400 023.
Code : PRSMJOHNSN Code : 500338 Dear Sir, Pursuant to Regulation 30 of the SEBI (Listing Obligations and Disclosure Requirements) Regulations, 2015, we submit herewith a copy of the Investor Presentation - January 2021. Thanking you,
Yours faithfully,
for PRISM JOHNSON LIMITED
ANEETA S. KULKARNI COMPANY SECRETARY Encl. : As above
www.prismjohnson.in
1
Investor PresentationFor The Quarter Ended December 2020
AMONGST INDIA’S LEADING INTEGRATED BUILDING MATERIALS COMPANY
January 28, 2021
www.prismjohnson.in 2
Executive Summary
47
30 29
Q3 FY20 Q2 FY21 Q3 FY21
Cash Conversion Cycle*
Executive Summary: Consolidated (Ex RQBE) Q3 FY21 Financial Performance Snapshot
www.prismjohnson.in 3
INR 14,539 mnQ3 FY21 Revenue
1.7% YoY Revenue Growth Led by Strong Revenue Growth in HRJ Division
540 bps YoY EBITDA Margin Expansion led by Cost
Rationalisation Initiatives across divisions & Volume
Pick-up in HRJ
14.9%Q3FY21 EBITDA Margin
Operating Cash Flow (pre-Capex) grew 61.3% YoY to
INR 1,766 million in Q3 FY21
INR 2,160 mnQ3 FY21 EBITDA
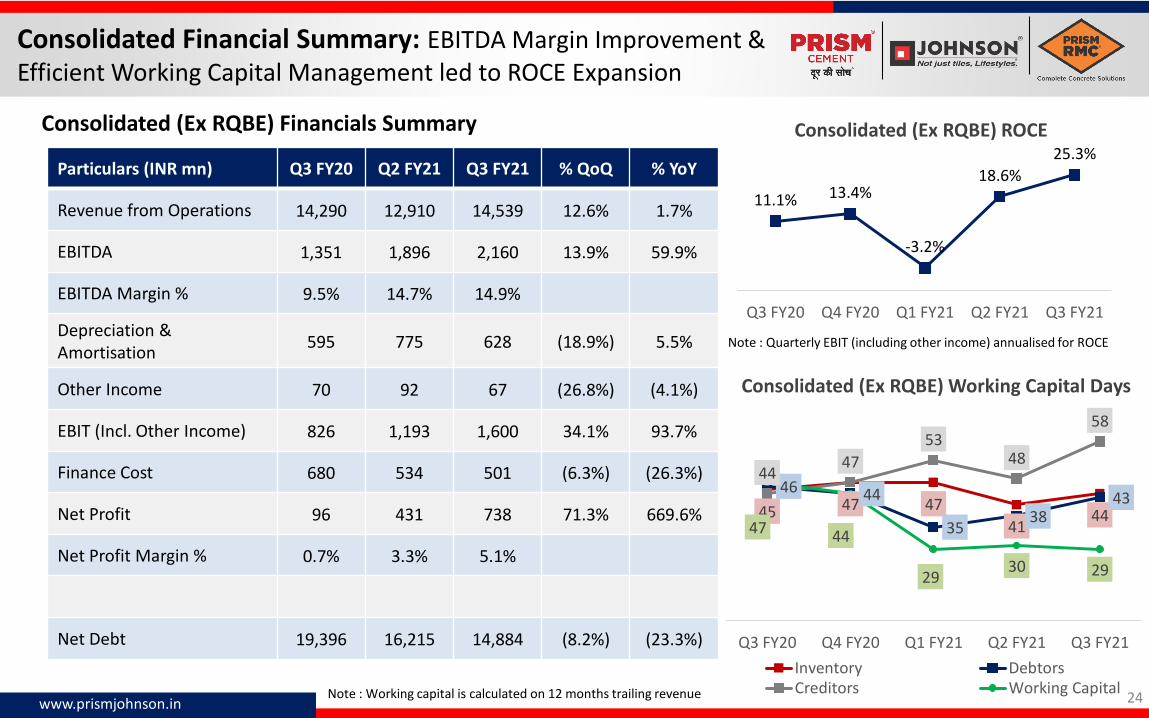
EBITDA Margin Expansion & Efficient Working Capital
Management led to ROCE#
Expansion from 11.1% in Q3FY20 to 25.3% now
59.9% YoY EBITDA growth led by strong growth across
all divisions; Cement EBITDA / ton improved by
21.9% YoY to INR 918
Efficient Working Capital Management
18,642
14,884
Mar-20 Dec-20
Strengthening Balance Sheet
Significant improvement in Net Debt levels
25.3%Q3 FY21 ROCE
Revenue Mix
* Cash Conversion Cycle = Inventory Days + Debtor Days – Creditor Days (based on trailing 12 month revenue)# Q3 FY21 EBIT (including Other Income) annualised for ROCE calculation
Cement43%
HRJ37%
RMC20%
INR 1,766 mnOperating Cash Flow
Executive Summary: Business Update / Key Initiatives
www.prismjohnson.in 4
Volume Recovery
• Cement: As economic activity continues to pick-up further, the company experienced demand recovery as cement volumes exceeded pre-COVID levels
• HRJ: Strong growth of 23.4% YoY in HRJ volumes led by a revival in real estate and construction sectors
• RMC: Revenues continued to show an improving trend on monthly basis as economic activity improves in tier 1 and metro cities
Cost Rationalization Initiatives Led to Strong
EBITDA performance across divisions
• Cement: Several cost reduction measures coupled with a marginal increase in realizations led to 21.9% YoY growth in EBITDA per ton (from INR 753 in Q3 FY20 to INR 918 in Q3 FY21)
• HRJ: Higher volumes and better product mix along with sustainable operating leverage led to 910 bps YoY improvement in EBITDA margin to 14.1% in Q3 FY21; HRJ reported highest ever quarterly EBITDA of INR 765 mn
• RMC: EBITDA grew 23.5% YoY with an increasing monthly sales trend; volumes yet to recover to pre-COVID levels
Continued Focus to Increase ROCE and
Reduce Debt
• Efficient working capital management and superior operational performance led to healthy operating cash flow generation of INR 1,766 mn in Q3 FY21 (Consolidated Ex RQBE) & jump in ROCE from 11.1% in Q3 FY20 to 25.3% in Q3 FY21 (Consolidated Ex RQBE)
• Strengthened balance sheet as Consolidated (ex RQBE) Net Debt reduced from INR 16,215 mn in Q2 FY21 to INR 14,884 mn in Q3 FY21; Net Cash balance stood at INR 3,067 mn as on December 31, 2020
ESG Initiatives
• Plan to commission remaining solar power capacity of 12.5 MW (out of the 25MW) by March 2021 on track
• Commissioned 10MW of WHRS during November 2020; Plan to commission balance 12.5 MW WHRS by March 2021 on track
• Cement & Clinker sales volume improved from 1.38 mn tons in Q3 FY20 to 1.42 mn tons in Q3 FY21
• Contribution of premium products continued to improve and constituted around 27.6% of total cement volume in Q3 FY21
• EBITDA per ton grew 21.9% YoY to INR 918 in Q3 FY21 driven by cost rationalization measures and marginal increase in realizations
H&R Johnson
• Strong sales volume at 14.4 MSM (+23.4% YoY) coupled with sustainable cost rationalization initiatives led to significant EBITDA growth (3.3x YoY); EBITDA margin expanded 910 bps YoY to 14.1% in Q3 FY21
• Fixed cost and working capital continues to remain under control
• Improvement in the product mix and expansion of distribution network continues to be the key focus area
RMC
• Revenue declined 15.2% YoY from INR 3,442 mn in Q3FY20 to INR 2,920 mn due to slower pick up in economic activity in metro and Tier-1 cities; Sales volume picking-up on monthly basis with revival of construction activity
• EBITDA increased from ₹ 75 mn in Q3FY20 to INR 92 mn in Q3 FY21 due to lower operating costs
• Focus continues on improving plant utilization levels, increase in value added products and enhance revenue from the Individual House Builder (IHB) segment
• 21.9% YoY growth in EBITDA per ton led by cost rationalization initiatives and higher volume of premium products
• Cement production normalised as COVID-19 led curbs eased
• 10 MW out of the planned 22.5MW commissioned in November 2020; Balance 12.5 MW likely to be commissioned by Q4 FY21
• Plan to commission remaining 12.5 MW (out of 25 MW) of solar power by Q4 FY21
• Prism Cement has started selling cement ex-depot basis wherein most of the customers bear the outward freight cost from the depot to their location. While this has no impact on the reported EBITDA per ton, this led to a decline of INR 109 per ton in both gross realization and outward freight cost in Q3 FY21.
Q3 FY20 Q3 FY21 % YoY
Power & Fuel 1,264 1,138 (10.0%)
Freight & Forwarding 1,021 885* (13.3%)
Raw Material 428 613 43.3%
Employee Cost 288 279 (2.9%)
Other Costs 703 532 (24.4%)
Total 3,704 3,447* (6.9%)
Prism Cement: Operational Parameters Exceed Pre COVID-19 Levels
www.prismjohnson.in 8
1.56
1.19
1.381.50
1.201.31
1.42
Q1 Q2 Q3 Q4
Cement & Clinker Sales Volume (mn tons)
FY20 FY21
19.2%
23.1% 23.7% 23.4%
26.2%27.5% 27.6%
Q1 Q2 Q3 Q4
Premium Products %
FY20 FY21
Eastern Uttar Pradesh
53%Madhya Pradesh
25%
Bihar22%
Regional Sales Breakup
Trade73%
Non Trade27%
Sales Volume - Trade vs. Non Trade
www.prismjohnson.in 9
H & R Johnson Division
HRJ (Consolidated): Better Operating PerformanceLed by Strong Volume Growth and Sustainable Cost Optimization
www.prismjohnson.in 10
4,675 4,633 4,6784,239
1,865
4,8955,423
Q1 Q2 Q3 Q4
Revenue (INR mn)
FY20 FY21
211 195 23352
-422
524
765
Q1 Q2 Q3 Q4
EBITDA (INR mn)
FY20 FY21
11.7
14.4
Q3 FY20 Q3 FY21
Tiles Sales Volume (msm) • EBITDA margin expanded 910 bps YoY to 14.1% due to higher volumes and reduction in cost
• Fixed cost and working capital continues to remain under control
• Improving product mix and expanding of distribution network continues to be focus area
• Revenue from sanitary ware & bath fittings and marble & quartz grew around 31% YoY
• Tile exports grew 87%YoY
Experience Center and Product Branding
www.prismjohnson.in
Pune Experience Centre Products Range under Germ-free Product Portfolio
•Revenue improvement quarter on quarter led by part recovery of construction activities in metro and tier 1 cities
• Cost rationalisation initiatives led to EBITDA growth despite decline in revenues
• Focus on improving plant utilization levels, increasing sales of value added products and IHB segment
www.prismjohnson.in 14
Insurance
www.prismjohnson.in
Products launched during Q3 FY21 include Industrial All Risks and Group Health Insurance. Further add-on covers werelaunched for two wheelers (all variants; annual, bundled and standalone own damage) and for private cars (goodscarrying, passenger carrying and miscellaneous vehicles)
Industrial All Risks product was filed with the regulator for an approval during Q3 FY21.
RQBE added 218 partners during Q3 FY21 taking the count of total partners to 1,249, including Agents, Brokers, POSP,IMF, MISP and Web Aggregators.
Financial Highlights:
Gross written premium - ₹945.7 mn, growth of 123.1% over Q3 FY20
Profit / (Loss) before tax - ₹ (266.7 mn) as compared to ₹ (78.9 mn) in Q3FY20
Combined Ratio stands to 139% from 134% in Q3 FY2020
Capital infusion of ₹ 1 bn in Jan’21 (including share premium)
Well capitalized with solvency ratio of 3.50 against regulatory minimum of 1.50
15
Raheja QBE General Insurance (RQBE)
www.prismjohnson.in 16
ESG Initiatives & Awards
www.prismjohnson.in17
Management Driving Several ESG & CSR Initiatives Continuous Efforts for Improved Sustainability
Energy Efficiency
• 10MW of WHRS commissioned; Plan to commission balance 12.5 MW by March 2021• Plan to commission remaining 12.5 MW (out of 25 MW) solar power by March 2021• Installed solar panels at school and administrative building at Satna, MP
Water Conservation
• Constructed perforated drum based water harvesting structures at Badhaura village in Oct 2020
Social Engagement
• Skill-development – Imparted vocational trainings such as stitching, beautician, agarbatti making, bag and cotton wick making
• Education – Renovation of Government Middle School at Chulhi; Installation of smart classes for class IX to XII at Government Higher Secondary School Bamhauri and Sajjanpur
• Infrastructure – Construction of Bus Shelters at Majhiyar and Chormari villages
Prism Johnson is committed towards achievement and maintenance of highest standards of Environment, Health and Safety issues at all its plants and offices.
18
Waste Heat Recovery System (WHRS) Site: Commissioned 10 MW During Q3 FY21
Phase I under Commissioning Trial AQC-1 Commissioned
Control Room Steam Turbine Generator
19
Solar Panels: 12.5 MW Commissioned in August 2020; 12.5 MW Planned for Q4 FY21 On Track
Module Mounting System and Solar Panels Roof Top Solar Panels at Administrative Building
Roof Top Solar Power at School Building Solar Lights at Hinauta Village
20
CSR Initiatives During Q3 FY21
Construction of Bus Shelters at Majhiyar Village Imparted Skill Development Trainings
Distribution of Thermal Wear to Senior CitizensSmart Class set up at Government Higher
Secondary School Bamhauri and Sajjanpur
www.prismjohnson.in21
Awards & Recognitions
Prism Cement (Satna Plant) Received “Apex India CSR Excellence Award ”for the Outstanding Achievement in Water Conservation / Watershed Development Category
Prism Cement (Satna Plant) Received “Apex India CSR Excellence Award ”for the Outstanding Achievement in Health Awareness/ Welfare Category
www.prismjohnson.in 22
Consolidated Financial Highlights
Consolidated Financials:EBITDA Growth Led by Sustainable Cost Rationalization Initiatives
Note : Quarterly EBIT (including other income) annualised for ROCE
10.7%14.7%
-0.9%
19.1%
24.7%
Q3FY20 Q4FY20 Q1FY21 Q2FY21 Q3FY21
ROCE
4,256 4,256
0
6,5625,391
1,171
OriginalRepaymentObligation
Repaid /Prepaid /
Refinanced
BalanceRepaymentObligation(31Dec20)
Repayment Obligations (INR mn)
FY21E FY22E* Net off Inter Segment Revenue
www.prismjohnson.in 28
Market Data
Market Information
www.prismjohnson.in 29
90.00
0
400
800
1,200
1,600
20
40
60
80
100
Ap
r20
May
20
Jun
20
Jul2
0
Au
g20
Sep
20
Oct
20
No
v20
Dec
20
Jan
21
Absolute Share Price Performance
Value Traded on NSE + BSE (INR mn) NSE Share Price (INR)
Note: 1 April 2020 prices rebased to 100
Particulars 27-Jan-2021
NSE Ticker PRSMJOHNSN Share Price (INR) 90.0
52 Week Low – High 25.7 – 95.0
Market Cap (INR mn) 45,302
Average 3-Month Value Traded (INR mn) 63.1
Promoter, 74.87%
DII, 7.61%
FPI, 4.02%
Others, 13.50%
Shareholding Pattern – Dec 31, 2020
315
168
Ap
r20
May
20
Jun
20
Jul2
0
Au
g20
Sep
20
Oct
20
No
v20
Dec
20
Jan
21
Share Price Performance vs. BSE Sensex
NSE Share Price BSE Sensex
About PRISM JOHNSON LIMITED
www.prismjohnson.in 30
PRISM JOHNSON LIMITED is one of India’s leading integrated Building Materials’ Company, with a wide range of products from cement, ready-mixed concrete, tiles and bathroom products.
Prism CementPrism Cement manufactures Cement with the brand name 'Champion' and premium quality grade of cement under ‘ChampionPlus’ and ‘DURATECH’ brand. It caters mainly to markets of Eastern UP, MP and Bihar, with an average lead distance of 376 kmsfor cement from its plant at Satna, MP. Wide marketing network with more than 4,000 dealers serviced from ~160 stockpoints.
H & R Johnson (India)Established in 1958, H & R Johnson (India) is the pioneer of ceramic tiles in India. HRJ offers end-to-end solutions of Tiles,Sanitaryware, Bath Fittings and Engineered Marble & Quartz. All the products are sold under 4 strong brands, viz. Johnson,Johnson Marbonite, Johnson Porselano and Johnson Endura. In ceramic / vitrified tiles, HRJ along with its Joint Ventures andsubsidiaries has a capacity of 60 million m2 per annum spread across 13 manufacturing plants across the country which is oneof the largest in India.
RMC (India)RMC (India) is one of India’s leading ready-mixed concrete manufacturers. RMC currently operates 96 ready-mixed concreteplants in 44 cities/towns across the country. RMC has ventured into the Aggregates business and operates large Quarries andCrushers. At present, RMC has 6 Quarries across the country. RMC has been at the forefront in setting high standards for plantand machinery, production, safety standards, quality systems and product services in the ready-mixed concrete industry.
About PRISM JOHNSON LIMITED
www.prismjohnson.in 31
PRISM JOHNSON LIMITED is committed to creating long-term sustainable shareholder value through successfulimplementation of its growth plans. The company’s investor relations mission is to maintain an ongoing awareness of itsperformance among shareholders and financial community.
Address:“Rahejas”, Main Avenue, V. P. Road,Santacruz (W), Mumbai—400 054
Safe HarborCertain statements in this release concerning our future growth prospects are forward-looking statements which involve a number of risks and uncertainties that could cause actual results to differ materially from those in such forward-looking statements. The company does not undertake to update any forward-looking statement that may be made from time to time by or on behalf of the company.