54
An Evaluation of the Maternal and Child Health Project of the Subsidy Reinvestment and Empowerment Programme (SUREP MCH) March – May 2015

An Evaluation of the
Maternal and Child Health Project of the Subsidy Reinvestment and Empowerment Programme
(SURE-‐P MCH)
March – May 2015

2
ACKNOWLEDGEMENT
For us to have successfully completed this assignment, the contributions of all our stakeholders, especially the Officers-in-Charge of our facilities, health workers (Midwives/CHEWs), personnel and officers of various State Ministries of Health and State Primary Healthcare Development Agencies (SPHDA), study participants and project beneficiaries, were quite insightful, and their valuable input has helped to shape the final outlook of this evaluation. To all of you, too numerous to mention here by name, we are grateful. When the story of SURE P MCH is fully told, you will all have been a part of its success.
It is also with pride that I acknowledge the input of several other stakeholders who contributed to the success of this enriching research. Within the PIU, the input and feedback that we got from various departments, from the conceptualization, planning, design and implementation of this study, has captured the true essence of the catch phrase; “Together Everybody Achieves More (TEAM)”.
Dr. Adetokundo Oshin, Deputy Project Director, Dr. Sidi Ali Mohammed, Unit Head, HR/Supply provided invaluable guidance and logistics support throughout the process. Externally, the representatives from the USAID (Deliver Project), World Bank, UNFPA, Pathfinder International and Save the Children were quite resourceful in the area of qualitative research methods and we are, as always, very grateful for the mutual partnership and support that the project has enjoyed in the past few years from these organizations. We also appreciate the EpiAFRIC team and our own Monitoring and Evaluation team for their competence and professionalism in the execution of this important assignment. I must thank the EpiAFRIC group for justifying the confidence reposed in them, and our M & E team for the joint collaboration and maintenance of standards throughout the process.
Finally, we are very grateful to the SURE-P Committee (MCH sub-group led by Barrister Halima Alfa – the Convener) for their support, and the Executive Director of NPHCDA, Dr. Ado J.G. Mohammad, for his leadership and provision of an enabling environment for the implementation of this noble project. Words are not enough to convey the depth of appreciation that the SURE-P MCH project management team owes all health care workers, beneficiaries, individuals and institutions. In spite of the challenges we faced at the onset, you helped make this project a reality. All we can say is that we are sincerely and forever grateful.
Dr. Ugo Okoli
Project Director,
SURE-P MCH Project.

3
AUTHORS
This project was carried out by a team from EpiAfric that included; Ifeanyi M. NSOFOR, Adaobi N. EZEOKOLI, Kachikwulu O. AKABIKE, Ike ANYA, and Chikwe IHEKWEAZU
EpiAfric is a health consultancy firm focused on creating, curating, and applying knowledge to solve some of the biggest health challenges on the African continent. Services are provided in an ecosystem of five complementary areas: consulting services, continuous professional development, communication, conferences and knowledge management for health.
Website: www.epiafric.com
Email: [email protected]

4
TABLE OF CONTENTS
ACKNOWLEDGEMENT .............................................................................................................................. 2
TABLE OF CONTENTS ................................................................................................................................ 4
EXECUTIVE SUMMARY ............................................................................................................................. 5
BACKGROUND ................................................................................................................................................... 5 METHODS ........................................................................................................................................................ 6 RESULTS ........................................................................................................................................................... 6
CONCLUSIONS AND RECOMMENDATIONS ............................................................................................... 7
1.0 BACKGROUND .................................................................................................................................... 9
1.1 MATERNAL AND CHILD HEALTH IN NIGERIA ....................................................................................................... 9 1.2 CAUSES OF MATERNAL AND CHILD DEATH IN NIGERIA ......................................................................................... 9 1.3 INTEGRATING MATERNAL, NEWBORN AND CHILD HEALTH INTERVENTIONS .............................................................. 10 1.4 DEMAND AND SUPPLY OF MATERNAL CARE ...................................................................................................... 10 1.5 IMPROVING DEMAND OF MATERNAL HEALTH CARE ............................................................................................ 11 1.6 CCT AS A MEANS OF IMPROVING MATERNAL HEALTH ......................................................................................... 11
2.0 OVERVIEW OF THE SUBSIDY REINVESTMENT PROGRAMME ............................................................. 12
2.1 INTRODUCTION TO SURE-‐P MCH .......................................................................................................... 13 2.2 DESIGN OF SURE-‐P MCH ........................................................................................................................ 13 2.3 OBJECTIVES OF SURE-‐P MCH ................................................................................................................. 14 2.4 OBJECTIVES OF THIS SURE-‐P MCH EVALUATION ................................................................................... 15
3.0 EVALUATION METHODOLOGY .......................................................................................................... 16
4.0 RESULTS ........................................................................................................................................... 17
4.1 RESULTS OF QUALITATIVE ANALYSIS .............................................................................................................. 17 4.2 THINGS WORKING WELL ............................................................................................................................... 25 4.3 THINGS NOT WORKING WELL ........................................................................................................................ 25 4.4 RESULTS OF QUANTITATIVE ANALYSIS ......................................................................................................... 29
5.0 CONCLUSIONS .................................................................................................................................. 51
6.0 RECOMMENDATIONS ....................................................................................................................... 53
REFERENCES .......................................................................................................................................... 54

5
EXECUTIVE SUMMARY
BACKGROUND
Nigeria’s primary health care system continues to pose a major challenge, resulting in poor maternal and child health outcomes. Access and utilization of quality health care services by women and children remains poor, primarily because of the weak primary health care system. Poorly funded and culturally inappropriate health and nutrition services, food insecurity and inaccurate feeding practices are direct causes of mortality in both children and mothers. The indirect causes -‐ female illiteracy, discrimination and poor access to health and nutrition services as a result of poverty, and marginalization of the rural poor -‐ are less obvious, but play an important role in mortality statistics. The lack of access to safe water and adequate sanitation combined with poor hygiene practices also has a negative impact on children’s health.
Successful health programmes must focus on both demand and supply side interventions. Nigeria’s last demographic and health survey showed that only a third of women give birth in medical facilities, contributing to the poor maternal and newborn health outcomes. Conditional cash transfers (CCT) have also been used to accelerate reduction in morbidity and mortality, on the 'demand side' by helping poorer families overcome the economic barriers to access and use of health services(1).
The Subsidy Reinvestment and Empowerment Programme (SURE-‐P) has two major thrusts: first, a social safety net programme to improve lives; and secondly, infrastructure and human resource empowerment projects to stimulate Nigeria’s economy and alleviate poverty. The Maternal and Child Health (MCH) component of the SURE-‐P aspires to contribute to the reduction of Nigeria’s maternal and newborn morbidity and mortality and place the country on track to achieve the 4th and 5th Millennium Development Goals (MDGs), building on best practices taken from Nigeria’s previous experience with the Midwives Service Scheme (MSS). The SURE-‐P MCH project provides a unique opportunity to focus on increasing access to maternal and child health services through a continuum of care for pregnant women and their new born babies.
There are two main components of the SURE-‐P MCH project. One component tackles the ‘supply’ of services, which involves increasing and improving both the infrastructure and human resources needed to improve health service delivery at the primary health care level. Specifically, this component was designed to restore the infrastructure in selected PHCs through the renovation of health care facilities; supply equipment and medicines, and increase the number of trained health workers able to provide care at the health facilities, including midwives, community health extension workers (CHEWs) and village health workers (VHWs). The ‘demand creation’ component of the project aims to increase the utilization of maternal and child health services in the primary health centres through the use of incentives, primarily “Conditional Cash Transfer (CCT)” based on the fulfillment of prescribed co-‐responsibilities by pregnant women.
In designating the 1000 health facilities across Nigeria as SURE-‐P MCH facilities, the project designers laid out the plan in two phases. Each SURE P MCH facility was meant to be renovated and supplied with equipment that would assist the supply side of the project. In the first phase, the first set of 500 health facilities were designated as SURE-‐P MCH health centres in October 2012, while in the second phase another 500 health facilities were designated as SURE-‐P MCH primary health centres in November 2013. The spread of clusters across the country were weighted according to the maternal and child mortality rates, with the North East having the highest rates while the South West had the lowest rates.
The aim of the evaluation is to assess the progress and achievements of the SURE-‐P MCH Programme project and provide recommendations to guide the remaining implementation period of the project and proffer recommendations for the post-‐2015 period.

6
METHODS
The Evaluation was carried out using both quantitative and qualitative methods. Quantitative aspects of the evaluation were carried on using monitored data submitted quarterly to the SURE-‐P MCH project team. A trend analysis was carried out for each facility in six states, evaluating for the impact of the SURE-‐P MCH intervention on relevant trends. Simple analytical tools and information sources allowed triangulation of information increasing the validity of findings.
Qualitative methods consisted of key informants’ interviews and focus groups discussions with various stakeholders at different levels of project implementation. Quantitative methods were used for the analysis of data from all SURE-‐P MCH supported facilities in the six states chosen for the evaluation; Niger, Kaduna, Bauchi, Ogun, Anambra and Bayelsa.
RESULTS
The post SURE-‐P period showed improvement in most of the variables of interest.
The results for five indicators show that;
1. There was a 36.3% increase in number of pregnant of women attending four or more antenatal care visits in the period following the introduction of SURE-‐P MCH.
2. There was a 32.1% increase in the number of pregnant women receiving birthing services from SBAs n the period following the introduction of SURE-‐P MCH.
3. There was a 23.8% increase in the number newborns provided with OPV at birth in the period following the introduction of SURE-‐P MCH.
4. There was a 9.8% increase in the number of newborns provided with HBV at birth in the period following the introduction of SURE-‐P MCH.
5. There was a 7.5% increase in the number of newborns provided with BCG at birth in the period following the introduction of SURE-‐P MCH.
The absence of denominator data made a comparison of rates not possible i.e. there was no data on the size of the population of women of child bearing age in these PHCs.
In the comparison between CCT and non-‐CCT, we found that CCT facilities only performed better with respect to two of the six variables evaluated. Considering the geographical distribution, CCT facilities performed better in three of the six states; i.e. Niger, Kaduna, Bayelsa, while no difference was found in the indicators in Ogun, Anambra and Bauchi.
The qualitative analysis showed that most people felt that SURE P MCH was a well-‐intentioned programme addressing an important health need in Nigeria. We did not find a single disapproving voice to the intentions of the programme. There was an improved perception of better quality of care in SURE-‐P MCH supported facilities. Renovated health facilities, provision of free drugs and new equipment for maternal care delivery was evident in the facilities visited.
A whole new cadre of highly motivated midwives and CHEWS has been deployed. Most of the midwives and CHEWS are young fresh graduates that joined the scheme with high enthusiasm. Also, a high level of community ownership of the project has been achieved. Central to the success of the project is the work of the village health workers. They are tasked with going into the community and encouraging women to come to the health facilities for care during pregnancy and after delivery. These village health workers are supported by ward development committees. The two community groups have mobilized community members to favor facility-‐based care. In some communities, village heads have supported midwives and CHEWS with accommodation.

7
Apart from a few exceptions, the state and local government partners of the SURE-‐P MCH programme did not seem to put their full weight behind the projects in their states and Local Governments Areas (LGAs). Funding from the states could have complemented the federal government’s SURE-‐P MCH interventions at state levels. State and local governments who were supposed to also pay health workers were defaulting on their responsibilities. Therefore, health workers are generally only receiving 50% of their promised salaries.
In discussions with stakeholders, there was a perception that not enough thought was given to sustainability of the SURE-‐P MCH programme especially in terms of financial management. There was a lack of confidence in activities involving the transfer of cash incentives.
Health workers complained that they had to go months sometimes without receiving salaries from the federal government and some respondents said that the supply of drugs to SURE-‐P MCH facilities was irregular and sometimes incomplete. The system of paying the Conditional Cash Transfers was perceived as bulky, inefficient and fraught with opportunities for fraud and embezzlement.
CONCLUSIONS AND RECOMMENDATIONS
This is a widely appreciated programme that was conceived to have a direct and immediate impact towards the reduction of maternal and new born morbidity and mortality in Nigeria. The programme was designed as a short-‐term intervention to run for four years, from 2012–2015. We found that the SURE-‐P MCH programme led to an improvement in the indicators measured after the introduction of the programme. However, there did not appear to be a significant difference between facilities in which CCT was implemented and those in which it was not.
The qualitative analysis demonstrated a strong perception that the programme had led to an improvement in the quality of care delivered to mothers and children in these facilities.
Its major challenge has been in achieving effective and efficient management under the operating environment. The data for monitoring and evaluation was of poor quality but improved over the duration of the project. The immediate 18-‐month period following the introduction of the intervention was particularly challenged with poor data issues. However, the project improved overtime in terms of data quality.
However, this is an extremely large public sector project including 1000 healthcare facilities across Nigeria, rolled out during a period of significant security challenges across large parts of the country, with significant political pressure to roll-‐out. The project would possibly have achieved greater success if it had been more independent and spared from innocuous reporting arrangements.
A strategic decision needs to be taken on whether a vertical intervention addressing a specific important indicator such as high maternal mortality is still appropriate or whether a broader strengthening of the primary health care system will be a better approach. This decision will guide other recommendations following this evaluation.
If a decision is taken to continue the SURE P MCH programme then we propose the following changes:
1. Secure independent-‐project management capacity with clearer reporting lines to manage the project with clearly articulated milestones, and deliverables based on measurable indicators.
2. An intense focus on performance management using data generated from the programme. 3. States could be given an up-‐front bulk amount to support the implementation of their responsibilities under
the MoU, but all future disbursements be based on their provision of counterpart funding. 4. The regularity of salaries and benefits to the midwives will have to be improved if the expected outcomes of
the programme are to be achieved.

8
5. Strengthen the involvement of the state, local governments and ward development committees in the supervision of contractors that provide services and commodities to health facilities.
6. Consider re-‐allocating funds meant for CCT to meet other needs of the project such as reaching more women by adding other facilities to the network of SURE-‐P MCH health facilities.
7. Consider expanding the Village Health Worker scheme as a key initiative to improve the demand for use of PHCs.
8. A maintenance unit may be required to ensure the constant functioning of infrastructure improvements especially bore-‐holes.
9. Further horizontal integration into the broader PHC ecosystem, especially given the strengthening of Primary Healthcare Development Boards.
10. Intensive associated public enlightenment on the benefits of the SURE-‐P MCH programme to the clients.

9
1.0 BACKGROUND
1.1 MATERNAL AND CHILD HEALTH IN NIGERIA
Nigeria loses about 2,300 under-‐five year olds and 145 women of childbearing age, every day and is the second largest contributor to the global under–five and maternal mortality rates (2). These statistics underscore the pain of human tragedy, for thousands of families who lose their mothers and children to causes that are largely preventable if needed interventions reach women and babies on time. There is also great variation around Nigeria; the 2013 Demographic and Health Survey showed while 90 percent of the women from the South-‐east zone receive antenatal are from a skilled health provider, this would be the case for only about 40 percent of women from the North-‐west.
In Nigeria, the maternal mortality rate is 576 deaths for every 100,000 live births (3). It is 10th in the world ranking of indicators of maternal mortality, far behind other neighbouring developing countries with smaller economies, such as Ghana and Benin who have maternal mortality rates of about 350 deaths per every 100,000 live births each. With only about two percent of the world's population, Nigeria contributes almost 10% of the world's maternal deaths (4). The maternal mortality rate is even higher in areas where women have many babies in short time periods while also facing malnutrition, poor hygienic conditions and poor access to medical treatment (5). In Nigeria, there is also a marked variation in maternal mortality ratio between the six geo-‐political zones and between the urban and rural areas(6). As with maternal mortality, the neonatal mortality rate in Nigeria shows wide geographic distinction, with the highest rates seen in the North-‐East and North-‐ West of the country, and the lowest rates recorded in the South-‐West and South-‐East (6).
1.2 CAUSES OF MATERNAL AND CHILD DEATH IN NIGERIA
Two-‐thirds of the under-‐five deaths can be avoided because effective interventions have been identified and can be easily implemented, even in settings where resources are constrained. However, Nigeria’s primary health care system continues to pose a major challenge, resulting in poor maternal and child health outcomes. Access and utilization of quality health care services by women and children remains poor, primarily because of the weak primary health care system (2). Poorly funded and culturally inappropriate health and nutrition services, food insecurity and inaccurate feeding practices are direct causes of mortality in both children and mothers. The indirect causes -‐ female illiteracy, discrimination and poor access to health and nutrition services as a result of poverty, and marginalization of the rural poor -‐ are less obvious, but play an important role in mortality statistics (7). The lack of access to safe water and adequate sanitation combined with poor hygiene practices also has a negative impact on children’s health. Diarrhoea accounts for many deaths of children under the age of five, and apart from the risk of not living beyond their fifth birthday, even when they survive serious illnesses, they often may not reach their full physical and intellectual potential due to the effects of poor health care and nutrition (8).
In the developing world, the most reported causes of maternal deaths are severe maternal bleeding, obstructed or prolonged labour, unsafe abortions and hypertensive pregnancy disorders especially eclampsia. HIV/AIDS is an additional concern for maternal/child health survival and Female Genital Mutilation (FGM) has been identified as an indirect cause of maternal mortality in Nigeria (9). Delays in referral to specialist services and the use of Pentecostal churches and healers for delivery (8) also contribute immensely to antenatal defaulting, negative perception towards medical care and ultimately poor maternal and child health outcomes. In a study in Cross River State, as an example, poverty was identified as a major social cause of maternal and child death-‐-‐most people are unable to afford the high fee for formal health services and resort to unqualified birth attendants (10). Others have cited the judgmental and rude attitudes of some health care providers, which frighten patients and serves as a disincentive to pregnant women seeking appropriate care (11). Nigeria comes third after India and China (who have exponentially larger populations) in the world list of undernourished children and is currently one of the two African countries listed

10
among the twenty responsible for the 80% of global malnutrition; this is a problem particularly in the Northern region of the country (9).
1.3 INTEGRATING MATERNAL, NEWBORN AND CHILD HEALTH INTERVENTIONS
Between 1998 and 2013, there has been a reduction in the national maternal mortality rate from 800/100,000 to 576/100,000. However, it is important to note that the largest drop occurred between 1998 and 2008, when the NDHS recorded it at 545/100,000(3).
One of the drivers of the drop in the maternal mortality rate may be the various maternal and child health intervention programmes introduced by various governments over this period. One of such intervention programmes is the Free Maternal and Child Health Care Programme (FMCHCP) offered in some states. One of the states implementing FMCHCP in secondary and tertiary public and private health facilities is Ebonyi State in South-‐eastern Nigeria. The services provided in the FMCHCP in Ebonyi State include free vesicovaginal fistula repairs, free post abortion care services, free antenatal care (card and antenatal drugs included), free vaginal and assisted vaginal delivery, free caesarean section, free management of ectopic pregnancy, and free laparotomy for obstetric complications(12).
The Nigerian Integrated Maternal, Newborn and Child Health (IMNCH) strategy, under the auspices of the Federal Ministry of Health, was designed to fast-‐track a programme to regenerate primary health care in every local government. The aim was to significantly extend national coverage of key maternal and child health interventions, and thus reduce maternal, newborn and under-‐five mortality in line with the 4th and 5th Millennium Development Goals targets. The strategy is being implemented in three phases of three years each, to benchmark progress towards the 2015 Millennium Development Goals deadline (13).
Another more recent programme is the Midwives Service Scheme (MSS), managed by the National Primary Healthcare Development Agency, and designed to mobilize midwives, including newly qualified, unemployed and retired midwives, for deployment to selected primary health care facilities in rural communities. The aim of the scheme was to facilitate an increase in the coverage of skilled birth attendance (SBA) to reduce maternal, newborn and child mortality. Midwives are posted for one year to selected PHCs in rural communities(9).
1.4 DEMAND AND SUPPLY OF MATERNAL CARE
Challenges around access to health services in most developing countries include – inconvenient opening hours of health facilities, inadequate resources and health workers and poor inadequate training(13). Maternal deaths and complications affect the health outcomes of children (14), and in the poorer countries of the world, a combination of high maternal mortality, low health facility utilization, poor quality of care and high numbers of neonatal deaths leads to a vicious cycle of harm. Sub-‐Saharan Africa, with the highest rates of maternal and neonatal deaths has shown the smallest amount of improvement for over two decades (15).
To improve maternal and child health, improving availability of medical services and access to them, while essential is not enough because, increasing the use of services and improving client satisfaction are equally important (16). Improving these outcomes require a focus on wider social factors such as poverty and gender inequality, which influence the demand for, use and supply of maternal healthcare services (17).
One of the most significant demand factors that affect the use of maternal health care services is cost (formal and informal fees, transport and opportunity costs). On the supply side, the location of facilities, the quality of care and adequate resources (basic supplies, medical equipment and well-‐trained, diligent and empathetic staff) influence the decision to seek care in a health facility. These demand and supply elements emphasize the three critical delays of
11
maternal mortality i.e., the failure to seek appropriate medical care in time; the delay in reaching an adequate healthcare facility; and the delay in receiving adequate health care at the facilities(14).
1.5 IMPROVING DEMAND OF MATERNAL HEALTH CARE
Successful health programmes must focus on both demand and supply side interventions(18). Nigeria’s last demographic and health survey showed that only a third of women give birth in medical facilities, contributing to the poor maternal and newborn health outcomes (3). Demand-‐side interventions have tried to improve education and information by using community educators-‐-‐women living in the intervention communities who are trained and can persuade families to seek maternal care and facilitate their use of facilities in an emergency. These have been implemented in Nigeria, Sierra Leone and Ghana and led to a significant growth in admission to hospital for normal and complicated deliveries (19).
Some interventions focus on reducing the delay in reaching a facility. For example, in northwest Nigeria, a project worked with transport unions to provide transport in a reliable and affordable manner. In Sierra Leone, another intervention project provided radios to summon vehicles to take women to hospital in obstetric emergencies. Other approaches include developing community loan funds to help with the cost of maternity care and transport to the facilities and establishing maternity waiting homes near district hospitals. Two such interventions in Zimbabwe and Ethiopia report high use of hospitals and low rates of complications for the subsequent delivery (1).
Conditional cash transfers (CCT) have also been used to accelerate reduction in morbidity and mortality on the 'demand side' by helping poorer families overcome the economic barriers to access and use of health services (1).
1.6 CCT AS A MEANS OF IMPROVING MATERNAL HEALTH
Conditional cash transfers are social programmes that involve regular cash payments to poor households, with certain conditions attached, to encourage the use of health services or school attendance. CCT programmes were first implemented in Latin America (Mexico, Brazil, Nicaragua, Honduras), but as a result of its success, now operates around the world. CCT programmes, particularly programmes that target specific outcomes relating to maternal health, sexual behaviours and/or vaccination practices are increasingly being adopted and scaled in developing countries. In sub-‐Saharan Africa in particular, where 18 countries are implementing conditional cash transfer programmes, these programmes are gaining popularity, especially the three which have MNH-‐related requirements (Eritrea, Mozambique, and Senegal) (20). CCT programmes have been used to improve maternal and newborn health through one-‐time payments conditional on a birth in a health facility, with payment levels set to cover the costs of accessing birth services in a health facility (20). Evidence suggests that social transfers in many developing countries have a positive impact on maternal and child health outcomes, by promoting improved health seeking practices, and subsequently producing a positive impact on maternal and child mortality(20).

12
2.0 OVERVIEW OF THE SUBSIDY REINVESTMENT PROGRAMME
The Subsidy Reinvestment and Empowerment Programme (SURE-‐P) has two major thrusts: first, a social safety net programme to improve lives; and secondly, infrastructure and human resource empowerment projects to stimulate Nigeria’s economy and alleviate poverty (21). SURE-‐P has various programmes that target key aspects of the Nigerian economy. The programmes of SURE-‐P are as shown on the chart below:

13
2.1 INTRODUCTION TO SURE-‐P MCH
The Maternal and Child Health (MCH) component of the Subsidy Reinvestment and Empowerment Programme (SURE-‐P) aspires to contribute to the reduction of Nigeria’s maternal and newborn morbidity and mortality and place the country on track to achieve the 4th and 5th Millennium Development Goals (MDGs), building on best practices taken from Nigeria’s previous experience with the Midwives Service Scheme (MSS). The SURE-‐P MCH project provides a unique opportunity to focus on increasing access to maternal and child health services through a continuum of care for pregnant women and their newborn babies.
2.2 DESIGN OF SURE-‐P MCH
There are two main components of the SURE-‐P MCH project. One component tackles the ‘supply’ of services, which involves increasing and improving both the infrastructure and human resources needed to improve health service delivery at the primary health care level. Specifically, this component was designed to restore the infrastructure in selected PHCs through the renovation of health care facilities; supply equipment and medicines, and increase the number of trained health workers able to provide care at the health facilities, including midwives, community health extension workers (CHEWs) and village health workers (VHWs). The choice of focusing on these three cadres of health workers was made to guarantee adequate antenatal attendance, skilled delivery at birth, routine immunization as well as postnatal care for women and their babies. In addition to recruiting new health workers, the MCH programme was designed to also train and retrain existing midwives and CHEWs in order to improve existing capacity. The MCH programme also created a referral system by putting health facilities into clusters, with four primary health centres, working with one general or referral hospital. The programme also provided 100 ambulances to the selected clusters, with each ambulance earmarked to be attached to the most rural health centre in the cluster.
The ‘demand creation’ component of the project aims to increase the utilization of maternal and child health services in the primary health centres through the use of incentives, primarily “Conditional Cash Transfer (CCT),” based on the fulfillment of prescribed co-‐responsibilities by pregnant women.
The SURE-‐P MCH project is nested under the National Primary Health Care Development Agency (NPHCDA) as the implementing partner, with state branches of the agency overseeing implementation of the programme in each state. The responsibility of funding the project was spread across the three tiers of Government. The federal

14
government had the responsibility of providing resources for the infrastructural improvements, providing antenatal drugs and consumables and recruiting the health workers. The federal government took on the responsibility of implementing the project with states as partners. The states signed a memorandum of understanding (MoU) to contribute to the salary of health care workers. In addition, the local governments were tasked with providing accommodation for the SURE-‐P MCH designated skilled health workers (the midwives and CHEWs) who were being posted to SURE-‐P MCH facilities around the country.
In the design of the SURE-‐P MCH intervention, every SURE-‐P MCH facility was entitled to receive antenatal and other drugs for the provision of services to pregnant women, nursing mothers, and children under five years of age. In addition to the free drugs programme, an incentives-‐based programme to boost the use of primary health centres was put in place in selected SURE-‐P MCH facilities. The incentives-‐based programme took the form of the Conditional Cash Transfer (CCT) component. This programme was piloted in one health facility per cluster, where one cluster is defined as four primary health centres attached to a referral hospital. The CCT pilot programme incentivized pregnant women to utilize the designated SURE-‐P MCH CCT facility by providing monetary rewards when they fulfill specified co-‐responsibilities. The total amount that a pregnant woman could receive is N5, 000.00 which was designed to be broken up into four payments as shown below.
In designating the 1,000 health facilities across Nigeria as SURE-‐P MCH facilities, the project designers laid out the plan in two phases. Each SURE-‐P MCH facility was meant to be renovated and supplied with equipment that would assist the supply side of the project. In the first phase, the first set of 500 health facilities were designated as SURE-‐P MCH health centres in October 2012, while in the second phase another 500 health facilities were designated as SURE-‐P MCH primary health centres in November 2013. The spread of clusters across the country were weighted according to the maternal and child mortality rates, with the northeast having the highest rates while the southwest had the lowest rates.
2.3 OBJECTIVES OF SURE-‐P MCH
The objectives of the SURE-‐P MCH programme are to:

15
• Increase the availability of skilled health workers to provide maternal and child health services at the primary health care (PHC) level;
• Provide visible infrastructural renovations at primary health care centres under the SURE-‐P MCH project; • Increase supply of essential service commodities at PHC facilities to improve service delivery; and • Increase the demand for MCH services in project communities through the use of conditional cash transfer (CCT)
and community engagement at the grassroots
2.4 OBJECTIVES OF THIS SURE-‐P MCH EVALUATION
The aim of the evaluation is to assess the progress and achievements of the SURE-‐P MCH project and provide recommendations to guide the remaining implementation period of the project and proffer recommendations for the post-‐2015 period.
The objectives are as follows:
1. To assess the impact of the SURE-‐P MCH project in terms of the progress against the outcomes and outputs outlined in the SURE-‐P MCH project plan;
1.1. To assess the number of key project performance indicators1 in SURE-‐P MCH supported health facilities at baseline and up to 18 months after initiation.
1.2. To assess the use of SURE-‐P MCH supported health facilities as measured by the number of deliveries carried out in the SURE-‐P MCH supported health facilities at baseline and up to 18 months after initiation.
1.3. To assess the difference in the above indicators between SURE-‐P MCH supported health facilities with conditional cash transfer (CCT) and those without.
2. Review the performance of the overall project management of the SURE-‐P MCH project; make recommendations to improve the management and effectiveness of the project in its second phase, and inform the design and management structures of future similar programmes.
3. Review the level of involvement of key stakeholders of the SURE-‐P MCH project and the benefits (if any) that they have brought to the programme.
3.1. To assess the engagement of state governments, the nature and extent of their support to the project
3.2. To assess the engagement of local governments, the nature and extent of their support to the project
3.3. To assess the engagement of host communities, the nature and extent of their support to the project
3.4. To assess the engagement of any other stakeholders (i.e. technical partners)
4. To assess the monitoring and evaluation systems in place and how these are being used to enhance the management of the project.
1 (1) Number of women attending focused ANC in SURE-P MCH supported facilities (2) Number of women receiving skilled birth deliveries in SURE-P facilities (3) Number of women bringing their newborn for post natal check (4) Number of newborns provided with immunization at birth.

16
5. To explore the experiences of various stakeholders involved in the conceptualization and implementation of the SURE-‐P MCH project; to assess their views on the sustainability of the SURE-‐P MCH project beyond 2015 and make appropriate recommendations
6. Identify possible challenges and risks faced by the project and suggest mitigating strategies to overcome them
3.0 EVALUATION METHODOLOGY
The Evaluation was carried out using both quantitative and qualitative methods.
Quantitative aspects of the evaluation were carried on using monitored data submitted quarterly to the SURE-‐P MCH project team. Ideally, we would have compared performance across facilities using rates and ratios. This approach was not possible because of the absence of a common denominator for the facilities. Comparing raw attendance data would be inappropriate. We have therefore carried out trend analysis for each facility in each state evaluating for the impact of the SURE-‐P MCH intervention on relevant trends. Simple analytical tools and information sources allowed triangulation of information increasing the validity of findings.
Our statistical method was a regression analysis on panel datasets. Our dependent variable was the natural logarithm of the outcome variables and the independent variable was the period (pre SURE-‐P introduction vs post SURE-‐P introduction). The transformation of the data to the natural logarithm was necessary for the analysis as a result of the wide differences between the corresponding means and medians for the variables.
Qualitative aspects of the midterm review was done using a participatory approach engaging all key stakeholders, including the SURE-‐P MCH project team who provided input and comments to the evaluation team at all stages of the evaluation.
Qualitative methods consisted of key informants’ interviews and focus groups discussions with various stakeholders at different levels of project implementation. Quantitative methods were used for the analysis of data from all SURE-‐P MCH supported facilities in the six states chosen for the evaluation: Niger, Kaduna, Bauchi, Ogun, Anambra and Bayelsa. Stakeholders interviewed included women who have given birth or registered to give birth at SURE-‐P MCH facilities, husbands/male relations of such women, chairmen of ward development committees, village health workers, CHEWS, midwives and administrators of the 12 SURE-‐P MCH supported facilities visited in the six states.
The evaluation team consisted of EpiAfric consultants and accompanying SURE-‐P MCH staff. EpiAfric was responsible for the collation, analysis and interpretation of the results, while the SURE-‐P MCH staff were responsible for arranging logistics.

17
4.0 RESULTS
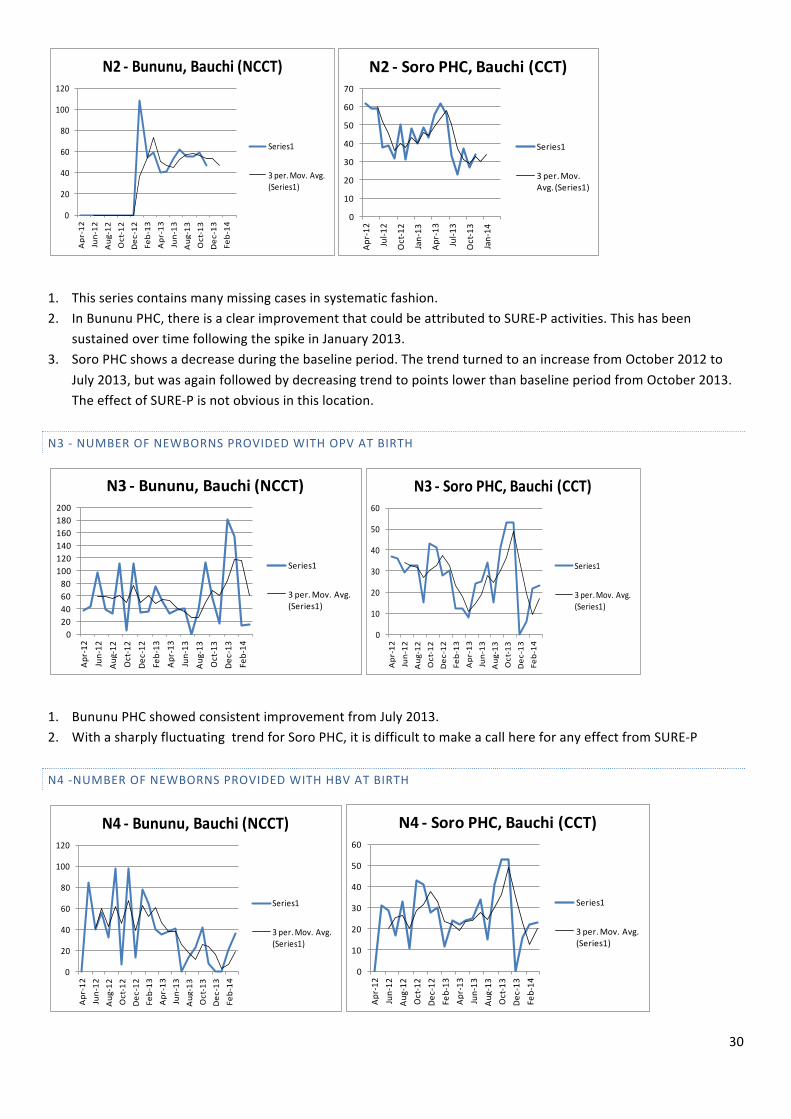
Six states, one in each geopolitical zone in Nigeria, were selected by the SURE-‐P MCH programme implementation unit for the evaluation. In each state, the evaluation team visited one facility where conditional cash transfer (CCT) had been implemented and one non-‐CCT facility. As shown on the map below, the evaluation took place in Niger, Kaduna, Bauchi, Ogun, Anambra and Bayelsa States, in that order.
4.1 RESULTS OF QUALITATIVE ANALYSIS
Following the qualitative research consisting of Focus Group Discussions (FGDs) and Key Informant Interviews (KIIs) with a targeted pool of stakeholders in the six states several key themes emerged, and five of the most recurrent are highlighted below:
A PERCEPTION OF A REDUCTION IN MATERNAL MORTALITY
The objectives of the SURE-‐P MCH programme included improvement in human resources for health, improvement in infrastructure, increase in supply of commodities and increase in the demand for maternal and child health services across project facilities and communities.
One of the themes that emerged prominently during FGDs and KIIs was the opinion that several key objectives of the SURE-‐P MCH programme were being achieved. The first of these was a perception of “reduction in maternal deaths”. A midwife in Niger State said:
“This programme has reduced deaths among our women giving birth. In the past a lot of women died from bleeding after birth at home, but since SURE-‐P started this programme there is a good turn up of women at the health centre for delivery and this has reduced maternal mortality.”

18
She and other informants revealed that in many of the communities surrounding the target PHCs, women were previously more likely to go to traditional birth attendants for prenatal and delivery services rather than to the health centres, or to local chemists or pharmacies for drugs during pregnancy. This resulted in lack of awareness and knowledge of pregnancy danger signs, and an absence of skilled health workers during delivery, which led to higher mortality rates. In addition, when traditional birth attendants faced complications that they could not handle during delivery, they were unable to refer to other providers and this also resulted in maternal deaths. A midwife in Niger State said that the SURE-‐P MCH programme has been able to reduce maternal mortality by posting skilled health workers at the primary health centres, as prior to their arrival, most health centres were under-‐staffed and lacked midwives.
“The SURE-‐P programme is beneficial because it has actually helped to reduce maternal mortality. Before we came there were no midwives, only community health workers. Now because of SURE-‐P, there are midwives and now we can also easily refer patients to General Hospitals.”
In addition, a nursing mother who attended ANC and delivered in one of the SURE-‐P MCH facilities in Bayelsa State corroborated the testimonies above saying:
“Before, when there was no SURE-‐P and women were going to native people (TBAs) to deliver, the rate of death of children and mothers was very rampant. But with this SURE-‐P, I have not heard of death of mother or a child”
A PERCEPTION OF INCREASED ANC ATTENDANCE AND COMMUNITY ACCEPTANCE
Another strong theme was a perception of increased ANC attendance and community acceptance. The attendance at antenatal clinics at the facility level seems to have improved across the board, based on interviews conducted. A representative of the State Primary Health Development Agency (SPHCDA) in Niger State said that,
“In the area of ANC, SURE-‐P has worked very well, because women are coming out to attend ANC programs in our health facilities, so maybe health workers have sensitized the women and that is why they are coming out to attend”.

19
A Community Health Extension Worker (CHEW) in Anambra State agreed.
“There have been lots of changes in the facility and in the community. Delivery has been increased and the immunization schedule and ANC have also increased. We see over 200 women every month in antenatal, and we have about 30 deliveries.”
A midwife in Niger State said the increase in attendance was also recorded at her facility.
There are a lot of changes since SURE-‐P came,” she said. “SURE-‐P provides MAMA kits that we give to our clients. That has attracted a lot of people to come and deliver at the facility. In a week, let me say there are more than 50 women who come for antenatal in a week. There is improvement from what it used to be, and the patients have increased over time because of the support that we have gotten from SURE-‐P MCH.”
Respondents said that part of the reason for the increase in antenatal clinic attendance and the community’s acceptance of the programme is the fact that SURE-‐P provides additional support to the facilities where the antenatal clinics are held. A CHEW in Anambra State said that since SURE-‐P came to her facility;
“The outlook of the facility has changed. There has been a lot of renovation and equipment, as well as supply of drugs. SURE-‐P did the renovation, as well as supplied us with water. The borehole uses a generator, which they also provided.”
The SPHCDA representative in Niger State said,
“In the state we have some dilapidated structures, and anytime SURE-‐P comes in, it renovates the facilities.”

20
The provision of these free drugs, antenatal care, and upgrading of the facilities, have boosted the desire of women in many of the target communities to patronize the primary health centres in preference to traditional birth attendants where they would have to pay for their care and delivery.
One major push factor behind the increased ANC attendance and community acceptance of the SURE-‐P MCH programme is what we have termed ‘The VHW Effect.’ Village health workers (VHWs) are female community members deployed to SURE-‐P facilities. They are tasked with going into the community and encouraging women to come to the health facilities for care during pregnancy and after delivery. Interviews suggest that the effect of having this cadre of workers as part of the SURE-‐P MCH programme has been critical to the programme. An Officer-‐In-‐Charge in Bayelsa admitted that women in the community previously refused to attend the primary health centre for delivery and antenatal services, even after being aware that they were paying more (15,000 naira) at the traditional birth attendants that they routinely patronized.
“We did sensitization but they still refused to come. They would register for antenatal but when it was time to deliver they go to TBAs, until SURE-‐P brought the village health workers. They came in September 2014. Why? They come from this community, so they know the women and they encourage them to come to the facility. They will drag them if they have to. One of them is a TBA herself, so now she refers her clients to the health facility when she has cases that are more than she can handle.”
One village health worker in Anambra State said she and her colleagues use drama to educate the women in the community about the importance of going to the health facility for care during pregnancy as well as awareness about other family related issues.
We do drama sketches to show them the consequences of having too many children without family planning,” she said, adding, “We show the difference between those who go to antenatal and those who don’t. The one who goes knows how to take care of herself, what to eat, when to take her drugs. We lecture them on the different methods for family planning and which one to take and which one not to take.”
Another VHW said that for her, getting every pregnant woman to the health facility is not just a job, but a passion.
“We are fighting to get them, even in the market, even in the church, anywhere we see a pregnant woman, we tell them to come and do registration at the SURE-‐P hospital,” she said. “Each week I talk to about 30 women. And in antenatal each week they have between 70 and 75 women.”
A VHW in Bayelsa State said that she used to be a farmer, but applied for the job of village health worker because she was learning how to help other women as well as how to take care of herself. The community health extension workers were given training that helped them train the village health workers in their roles.

21
A PERCEPTION OF A CHALLENGES IN PARTNERSHIPS AND COORDINATION
The discussion summarised in this theme focuses on how various cadres of partnership under the SURE-‐P MCH programme worked in tandem to establish and sustain the programme. SURE-‐P MCH’s partners included international development partners such as The World Bank and Pathfinders International as well as Save the Children and John Snow International. The federal, state and local governments and the National Primary Health Care Development Agency (NPHCDA) are also partners in executing the SURE-‐P MCH programme.
A representative of the State Primary Health Care Development Agency (SPHCDA) in Niger State explained the role of the agency in the programme’s coordination.
“The agency oversees the affairs of the Sure-‐P MCH programme,” she said. “The state is the one that coordinates their activities with the local government areas. It is the partner that signed on behalf of the Niger State government. They work parallel to each other actually. The functions of the agency are what SURE-‐P MCH is following. Sure-‐P MCH is assisting in the area of mother and child health, and that is what the agency is expected to do. SURE-‐P is doing the work that the agency is supposed to do. Due to inadequate manpower, since SURE-‐P came in, it has greatly assisted in the area of manpower.”
The midwives and CHEWs that were posted to SURE-‐P facilities were meant to be supported by the federal, state and local governments as part of the partnership coordination. Interviews with health workers however, revealed that there were challenges with the partnership model. One respondent in Niger State pointed out that;
“Since SURE-‐ P came on board, it is the federal government that has been paying the midwives, that of the state has not yet started. The states agreed to pay them N20,000 every month, both SURE-‐P and MSS. We are waiting to hear the response so they can start enjoying their allowances from the state. Some LGAs have not been able to pay them. They are supposed to get N10,000 and their accommodation from the local government. I was in Rafi LGA last Thursday and they were complaining that they have not been paid in 15 months.”
Besides the federal, state and local government partnerships, the SURE-‐P MCH programme included international development partners, many of whom said they were involved primarily during the conceptualization of the project.

22
A number of stakeholders at the state, local government and community level, though appreciative of the programme, admitted that they did not feel included in the decision making process from the initial stages through to the implementation stage of the programme. Another major partner in the private sector was the National Union of Road Transport Workers (NURTW). In a few of the selected communities, respondents pointed out that there was an agreement with the transport workers to bring pregnant women to the health center or take them to the hospital on referral. However in other places this partnership was not evident and transportation to and from referral hospitals was often a difficulty.
PERCEPTIONS OF MIXED IMPACT OF CONDITIONAL CASH TRANSFER (CCT)
On the demand generation side of the SURE-‐P MCH, the conditional cash transfer (CCT) system was piloted in order to incentivise women to come to the health centre to receive their antenatal services, deliver at the facility and come for postnatal care. The CCT programme was not implemented in all SURE-‐P facilities; rather a selection of facilities to benefit from CCT was made based on certain criteria defined by the programme. CCT facilities also received all the other inputs that SURE-‐P made into the primary health centers in which it intervened. The pilot was meant to assess whether the added incentive would have a significant impact on the numbers of women attending the facilities for antenatal care and delivery services.
To assess the value added by the CCT programme, our evaluation was conducted comparing a CCT facility and a non-‐CCT facility in each of the selected states, in order to assess the impact of the implementation of CCT on the benefitting communities. In stakeholder interviews, questions relating to the importance of CCT and the impact it has made on antenatal clinic attendance were discussed. One respondent at the state level felt that having CCT as a component of the SURE-‐P MCH programme had been an important and influential part of the programme. She said that if more women were aware and would follow through, they would enjoy the full benefits of the programme.
“It is very important. CCT has helped in motivating caregivers to attend health facilities. In these LGAs that SURE-‐P CCT is working, it is active, you can see the numbers of women coming to the facilities, they have increased greatly. The few challenges we have gotten to know about the CCT programme, is that the women are not fully aware of what they are gaining. If they are fully sensitized, they will be able to complete the full programme. Some women tend to default after ANC and delivery, but if they are fully sensitized, I know they will follow up to completely.”
There are no mandates as to what the woman can spend the money on. The reality of the CCT payments however, appear to be more complex in implementation than in its design. Discussions with women who had benefitted from the programme indicated that the payment schedule for the CCT programme was not as timely as proposed. Women were not being paid as soon as they registered, and in some communities, the CCT payments had only been made twice since the inception of the programme in 2013. According to stakeholders (during focus group discussions), there was a perception of ‘some people from Abuja’ who would come to distribute the CCT payments on a certain day, and prior to coming they would send a list of names of those who were being owed CCT funds. The health centre would post the names on their wall, and send information to the community via the village health workers, to let the women know what day they would come for their payment. Discussions revealed that there was a perception that this process was rife with conflict and potential fraud. Beneficiaries said that sometimes names of women who had given birth and fulfilled their responsibilities would not be on the CCT payment list. Sometimes they were not paid the full amount they were being owed, such as was reported in one community where several beneficiaries were said to have been paid N100 short of their allotted allowance. Several supposed beneficiaries that were interviewed were yet to receive any of their N5,000 incentive even though they had fulfilled their co-‐responsibilities.

23
With tears in her eyes, one of the nursing mothers that participated in a focus group discussion in Bauchi State narrated her experience of being underpaid the CCT although she was qualified to receive the total amount of five thousand naira;
“I attended all my ANC visits, gave birth and brought my baby for postnatal in this hospital. By the second time the Abuja people came to pay the money, they gave me just one thousand naira. About 10 of us who met all the requirements were paid one thousand naira each. It was raining heavily on that day and they did not give any reason for underpaying us. I started crying and told them it was not fair. Because I was crying, the man making the payment then gave me an additional one thousand naira.”
In discussions with beneficiaries, the question was raised as to whether pregnant women would stop coming to the primary health facilities without the availability of the CCT component. Most respondents pointed out that the extra funds were attractive but noted that if the other SURE-‐P MCH services were to continue in the facilities, they would still attend, even without the CCT component. Nursing mothers interviewed in Anambra State were of the opinion that if CCT payment is stopped, women would still come to the health facilities for care and delivery. They were of the opinion that quality of maternal care provided by midwives, their high level of professionalism, free drugs and free “mama kits” given are overriding reasons for accessing care in SURE-‐P MCH facilities.
“Even if they stop paying us the money, women will still come to the health centre when they are pregnant.”
To improve the CCT component of the programme, the idea of using Mobile Money to pay beneficiaries surfaced, and SURE-‐P MCH partnered with development organizations to develop a mobile money component to the CCT payment system. The mobile money payment was intended to allow women to receive alerts directly to their phone when they had been paid their CCT money, and then have the option of going to a mobile money agent to cash in their e-‐wallets, or pay for goods and services directly from their wallet. The mobile money system is pervasive in Kenya and was modeled as a way to make the payment disbursement easier. However, from stakeholder interviews it is clear that implementing this system in Nigeria faced several challenges, including the lack of mobile money agents in extremely rural settings, as well as other design challenges. One of SURE-‐P’s partners working on developing the mobile money platform for the project said:
“The money is cashed through mobile money. It’s a code that you receive, a text message, to show that you’ve received so and so amount. There are supposed to be agent networks where you go and cash. The agent is usually a “mallam” that is selling “Indomie” or something. Or there is a wallet. You can save the money in the wallet and you can use it to do whatever you want to do. The mobile money system is still at infancy especially in Nigeria. In Kenya in the last 3 years, our organisation has moved $8 million through MPESA but in Nigeria, we are still struggling.”
SURE-‐P MCH confirmed that payments to beneficiaries are not regular as it depends on when funds are made available by the federal government. SURE-‐P also indicated that some beneficiaries are also not always aware of the amount they are entitled to and how this is determined. SURE-‐P MCH reported that to date all beneficiaries in the states involved in this study have been paid their entitlements. The programme has also explored having MoUs with banks to pay beneficiaries directly but had challenges with high bank charges for each transaction.

24
PERCEPTIONS ON THE SUSTAINABILITY OF SURE-‐P MCH
The sustainability of the SURE-‐P MCH programme was a much discussed topic at the FGDs and KIIs. A number of the health workers who participated in the qualitative research expressed concerns that the SURE-‐P MCH programme would soon come to an end, while maintaining the position that the programme should be sustained.
In addressing the issue of sustainability, a number of external factors come into play that impact on whether the programme can be sustained and many stakeholders including beneficiaries were well aware of these. The first was the fall in the price of crude oil. There was a general impression that this would adversely affect the sustainability of SURE-‐P MCH because the funds being used for the programme are culled from government savings from the partial removal of the subsidy on petroleum products, and the fall in crude oil price therefore means less savings. In addition, the recent 79% reduction in the budgetary allocation to SURE-‐P by the National Assembly will affect the programme’s ability to sustain itself. According to a recent article in the Nigerian press2:
“The law makers also approved the reduction of the total expenditure for SURE-‐P from N102.50bn to N21.03bn due to the fall in oil price, even as some senators called for the total cancelation of allocations to the sector.”3
One participant said she felt that the reduction in budgetary allocation to SURE-‐P would affect the MCH programme adversely.
“It will affect it…….Already there is an issue with sustainability, and with the lateness of CCT payments, now that the budget has been slashed it will draw us backward. We are praying that it will improve. We are praying that it will be increased so that it can continue. The state can advocate both to the state house of assembly and to the executive.”
Some other participants at the state and local government level maintained that even if the federal government decides not to continue the SURE-‐P MCH programme, they would not let it go, because they have seen the impact it has made in their communities and have enjoyed its benefits. A respondent in Bauchi put it this way,
“Even if government oil well dries up anyhow, our own will not.” Another topic addressed in terms of sustainability was the development of community health insurance. A respondent noted that if she was given access to the N5,000 (five thousand naira) per pregnant woman that the government is giving for CCT, she would pool those resources and create a community health insurance plan for the community, which she said would give them access to affordable quality health care.
2 2015 budget: Senate kicks against service-‐wide votes. Available from http://nationalmirroronline.net/new/2015-‐budget-‐senate-‐kicks-‐against-‐service-‐wide-‐votes/ [February 26 2015]

25
4.2 THINGS WORKING WELL
A GENERAL PERCEPTION OF A WELL INTENTIONED PROGRAMME
Everyone interviewed, across board felt that SURE-‐P MCH was a well-‐intentioned programme addressing an important health need in Nigeria. We did not find a single disapproving voice to the intentions of the programme.
EXPECTATIONS ON THE QUALITY OF ANTENATAL CARE HAS BEEN INCREASED
Deploying midwives, CHEWS and village health workers to all SURE-‐P MCH supported facilities across the country improved the quality of antenatal care services provided. This perceived improvement in the quality of care in turn increased attendance and demand for services by women of child-‐bearing age. In all facilities visited, women associated SURE-‐P MCH staff with compassion and care. They readily reminded us of how poor and dismal services were before SURE-‐P MCH took over the facilities.
THE PHYSICAL ENVIRONMENT AND COMMODITIES FOR ANTENATAL SERVICES HAVE IMPROVED
Renovated health facilities, provision of free drugs and new equipment for maternal care delivery was evident in the facilities we visited. Most of the facilities wore fresh looks and the health workers confirmed that their work is made easier by a combination of these factors. Women accessing care were also proud of how decent the physical appearance of these facilities were and were quick to describe how unfit they were before renovations.
A WHOLE NEW CADRE OF HIGHLY MOTIVATED MIDWIVES AND CHEWS HAVE BEEN DEPLOYED
Most of the midwives and CHEWS are young fresh graduates that joined the scheme with high enthusiasm. They are usually posted to communities distant from where their families reside.
A HIGH LEVEL OF COMMUNITY OWNERSHIP OF THE PROJECT HAS BEEN ACHIEVED
Central to the success of the project is the work of the village health workers. We refer to this as the “VHW effect”. They are tasked with going into the community and encouraging women to come to the health facilities for care during pregnancy and after delivery. These village health workers are supported by ward development committees. The two community groups have mobilized community members to favor facility-‐based care. In some communities, village heads have supported midwives and CHEWS with accommodation.
TRAINING AND RE-‐TRAINING OF MIDWIVES AND CHEWS IMPROVE THEIR CAPACITY TO PROVIDE CARE
Most midwives and CHEWS we interviewed have attended continuous professional development courses organised by SURE-‐P MCH. They confirmed that the training opportunities that they attended have helped them improve on the quality of care they provide in the facilities. These courses include lifesaving skills (LSS), healthcare logistics, and use of the non-‐pneumatic anti-‐shock garment for the management of post-‐partum haemorrhage amongst others.
4.3 THINGS NOT WORKING WELL

26
Below are things these stakeholders consider as not working well.
POOR PARTNERSHIP COORDINATION AND POOR STATE AND LGA SUPPORT:
The state and local government partners of the SURE-‐P MCH programme did not seem to put their full weight behind the projects in their states and local governments. The pervasive view of those working in the states and LGAs was that they were not “carried along” on the project. This perhaps may have accounted for most of the states and local governments not being responsive to their own part of the MOU that they signed. Memoranda of understanding do not have the commitment of contracts and most states did not adhere to it, after they signed. It was suggested that a few states may have used their own portions of SURE-‐P funds to tackle other health issues (or other issues) in their states. Funding from the states could have complemented the federal government’s SURE-‐P MCH interventions at state levels.
LACK OF IN-‐BUILT SUSTAINABILITY PLAN:
In discussions with stakeholders, there was a perception that not enough thought was given to sustainability of the SURE-‐P MCH programme especially in terms of financial management. There was a lack of confidence in activities involving a transfer of cash incentives.
PERCEPTION OF INADEQUATE REMUNERATION OF HEALTH WORKERS:
Health workers who were sampled unanimously complained that the payment they received for their skilled work was not enough to cater for their needs. In addition, the state and local governments who were supposed to also pay health workers were defaulting on their responsibilities, so health workers are generally only receiving 50% of their promised salaries. From the interviews conducted, it was pointed out that the midwives were earning N40,000 (forty thousand naira) a month from the federal government arm of SURE-‐P MCH, while CHEWs were being paid N25,000 and village health workers N15,000. One health worker said:
“In terms of our salary we are not happy, they will still pay it but they will delay it. We also think there should be increment in our salary because they have not increased our salary since 2012. The state and the local government have not given us anything.”
INSTANCES OF POOR RENOVATION OF HEALTH CENTERS:
In some of the health centers visited during this evaluation, it was apparent that the renovation work done on the facility was shabby, sometimes incomplete, even though there was a perception at the facility that funds had been disbursed to do the job.
POOR REFERRAL TRANSPORTATION SYSTEM:

27
While the programme announced that it had purchased 100 ambulances to cater to the referral system it had set up4, and while in some areas there was an agreement with the NURTW concerning transportation of pregnant women, by far the most common reported and observed situation in the field was that patients and sometimes community elders paid and made arrangements themselves for their transportation to and from the health centre. In one of the states visited, two of the ambulances were seen parked within the premises of the State Ministry of Health (image below). SURE-‐P MCH confirmed that the ambulances were recently deployed to states in April 2015 for use at the facility level. The plan is to have some of the ambulances managed by ward development committees.
NONPAYMENT OF REFERRAL HOSPITALS:
There were cases where health workers mentioned that they were asked to stop referring patients to a particular hospital because referral centres had not been paid by SURE-‐P MCH for services rendered. Patients now have to pay out-‐of-‐pocket for services at these referral centres. This defeats the free maternal health ethos of SURE-‐P MCH. It could also have fatal consequences for women who are too poor to pay for services at the referral centres.
IRREGULAR PAYMENT OF HEALTH WORKER SALARIES:
Health workers complained that they had to go months sometimes without receiving salaries from the federal government.
IRREGULAR AND INCOMPLETE SUPPLY OF DRUGS AND EQUIPMENT TO PRIMARY HEALTH CENTERS:
Respondents said that the supply of drugs to SURE-‐P MCH facilities was irregular and sometimes incomplete. One health worker from Anambra State said,
4FG Launches N1.1bn National Ambulance Service. Available at http://www.thisdaylive.com/articles/fg-launches-n1-1bn-national-ambulance-service/201746/ [accessed on May 08, 2015]

28
“Sometimes they ask us to write what we need, but then they won’t supply it. They will supply what they normally do, like all the routine drugs. Their drugs are mostly tablets, but we sometimes need drugs in injections. They supply syrups for children, but it may not be enough.”
INEFFICIENT PAYMENT SYSTEM FOR CONDITIONAL CASH TRANSFERS:
The system of paying the conditional cash transfers was perceived as bulky, inefficient and fraught with opportunities for fraud and embezzlement.

29
4.4 RESULTS OF QUANTITATIVE ANALYSIS
The results below represent a trend analysis of the data received from each facility in each of the state that the evaluation team visited as part of the evaluation project. The trend analysis should be interpreted considering that SURE-‐P MCH facilities became active in October 2012. Specific comments relating to individual facilities and states are described under the relevant charts.
BAUCHI STATE
The evaluation took place in Bununu and Soro PHCs in Bauchi State.
N1 -‐ NUMBER OF PREGNANT WOMEN ATTENDING FOUR OR MORE ANC VISITS COMPARING CCT VS NON-‐CCT PHC
1. The trend is similar for both SURE-‐P MCH facilities-‐-‐ both show improvement over time 2. In Bununu PHC, we found a sustained increase over time. The increase shown between August 2012 and
September 2012 is not due the SURE-‐P MCH intervention. Whatever factor(s) that are responsible for the increase are not as strong as the influence of SURE-‐P, as subsequent increases correlating in time with the introduction of SURE-‐P MCH are higher than those before its introduction. The dip towards the end, though worrying, is still higher than the baseline period, before the SURE-‐P intervention.
3. Soro PHC is flat until June 2013. This is likely to be due to missing data. This is likely to be as a result of a poor reporting and documentation culture at this facility or/and periods of health workers strike. The increase in attendance is sustained with steep dip to zero around November 2013 (also likely to be a problem with data collection). The important finding is that trend line (in black, and a function of moving averages) is consistently elevated over time.
N2 -‐ NUMBER OF PREGNANT WOMEN RECEIVING BIRTHING SERVICES FROM SBAS
0
5
10
15
20
25
30
35
Apr-‐12
Jun-‐12
Aug-‐12
Oct-‐12
Dec-‐12
Feb-‐13
Apr-‐13
Jun-‐13
Aug-‐13
Oct-‐13
Dec-‐13
Feb-‐14
N1 -‐ Bununu, Bauchi (NCCT)
Series1
3 per. Mov. Avg. (Series1)
0
5
10
15
20
25
30
35
Apr-‐12
Jun-‐12
Aug-‐12
Oct-‐12
Dec-‐12
Feb-‐13
Apr-‐13
Jun-‐13
Aug-‐13
Oct-‐13
Dec-‐13
Feb-‐14
N1 -‐ Soro PHC, Bauchi (CCT)
Series1
3 per. Mov. Avg. (Series1)
30
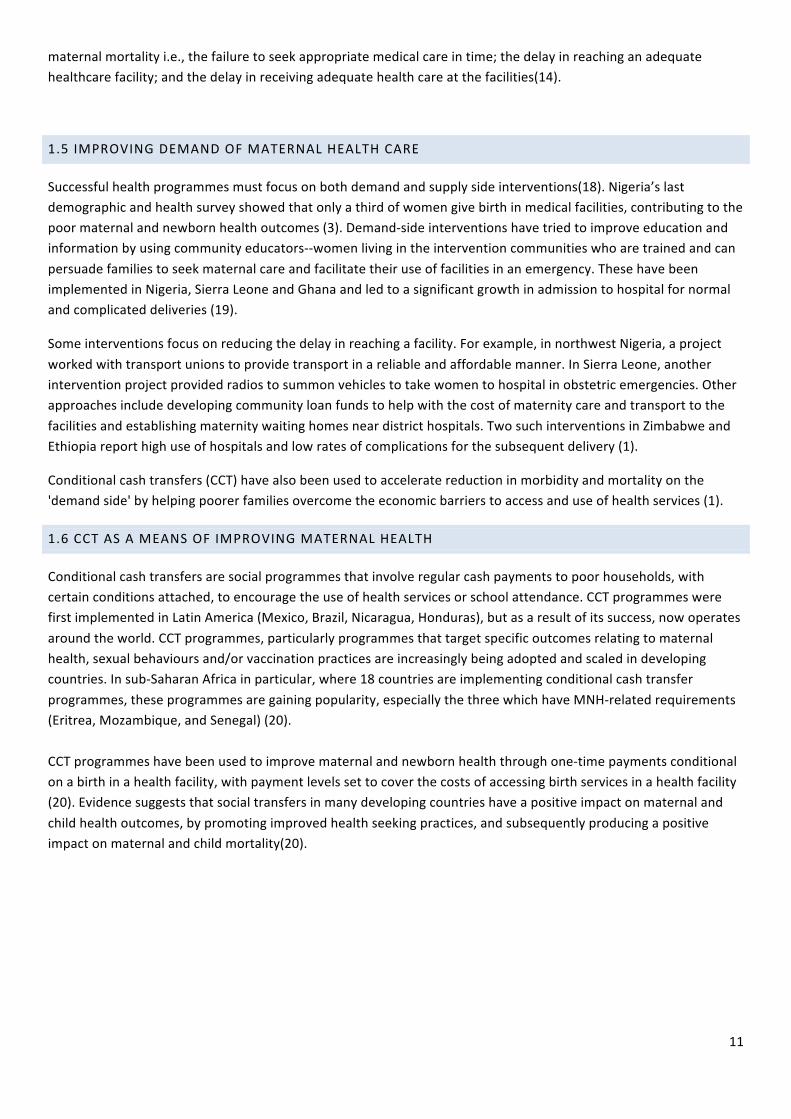
1. This series contains many missing cases in systematic fashion. 2. In Bununu PHC, there is a clear improvement that could be attributed to SURE-‐P activities. This has been
sustained over time following the spike in January 2013. 3. Soro PHC shows a decrease during the baseline period. The trend turned to an increase from October 2012 to
July 2013, but was again followed by decreasing trend to points lower than baseline period from October 2013. The effect of SURE-‐P is not obvious in this location.
N3 -‐ NUMBER OF NEWBORNS PROVIDED WITH OPV AT BIRTH
1. Bununu PHC showed consistent improvement from July 2013. 2. With a sharply fluctuating trend for Soro PHC, it is difficult to make a call here for any effect from SURE-‐P
N4 -‐NUMBER OF NEWBORNS PROVIDED WITH HBV AT BIRTH
0
20
40
60
80
100
120Apr-‐12
Jun-‐12
Aug-‐12
Oct-‐12
Dec-‐12
Feb-‐13
Apr-‐13
Jun-‐13
Aug-‐13
Oct-‐13
Dec-‐13
Feb-‐14
N2 -‐ Bununu, Bauchi (NCCT)
Series1
3 per. Mov. Avg. (Series1)
0
10
20
30
40
50
60
70
Apr-‐12
Jul-‐1
2
Oct-‐12
Jan-‐13
Apr-‐13
Jul-‐1
3
Oct-‐13
Jan-‐14
N2 -‐ Soro PHC, Bauchi (CCT)
Series1
3 per. Mov. Avg. (Series1)
020406080100120140160180200
Apr-‐12
Jun-‐12
Aug-‐12
Oct-‐12
Dec-‐12
Feb-‐13
Apr-‐13
Jun-‐13
Aug-‐13
Oct-‐13
Dec-‐13
Feb-‐14
N3 -‐ Bununu, Bauchi (NCCT)
Series1
3 per. Mov. Avg. (Series1)
0
10
20
30
40
50
60
Apr-‐12
Jun-‐12
Aug-‐12
Oct-‐12
Dec-‐12
Feb-‐13
Apr-‐13
Jun-‐13
Aug-‐13
Oct-‐13
Dec-‐13
Feb-‐14
N3 -‐ Soro PHC, Bauchi (CCT)
Series1
3 per. Mov. Avg. (Series1)
0
20
40
60
80
100
120
Apr-‐12
Jun-‐12
Aug-‐12
Oct-‐12
Dec-‐12
Feb-‐13
Apr-‐13
Jun-‐13
Aug-‐13
Oct-‐13
Dec-‐13
Feb-‐14
N4 -‐ Bununu, Bauchi (NCCT)
Series1
3 per. Mov. Avg. (Series1)
0
10
20
30
40
50
60
Apr-‐12
Jun-‐12
Aug-‐12
Oct-‐12
Dec-‐12
Feb-‐13
Apr-‐13
Jun-‐13
Aug-‐13
Oct-‐13
Dec-‐13
Feb-‐14
N4 -‐ Soro PHC, Bauchi (CCT)
Series1
3 per. Mov. Avg. (Series1)

31
1. Bununu PHC showed a steady decrease after January 2013, with a non-‐significant increase in November 2012. 2. Soro PHC showed an initial improvement from May 2013. The increase in October is not likely to be due to the
SURE-‐P MCH intervention. The sharp dip in February 2014 is a source of concern and should be investigated locally. Potential causes of such sharp declines are staff attrition.
N5 -‐ NUMBER OF NEWBORN PROVIDED WITH BCG AT BIRTH
1. Consistent decrease for Bununu PHC from January 2013 2. No clear, sustained trend for Soro PHC
N6 – NUMBER OF WOMEN BRINGING THEIR NEWBORNS FOR POST-‐NATAL CHECK
1. Bununu PHC showed an initial increase from October 2012 to February 2013 and has been declining from then to a level lower than the baseline from August 2013.
0
20
40
60
80
100
120
Apr-‐12
Jun-‐12
Aug-‐12
Oct-‐12
Dec-‐12
Feb-‐13
Apr-‐13
Jun-‐13
Aug-‐13
Oct-‐13
Dec-‐13
Feb-‐14
N5 -‐ Bununu, Bauchi (NCCT)
Series1
3 per. Mov. Avg. (Series1)
0
10
20
30
40
50
60
Apr-‐12
Jun-‐12
Aug-‐12
Oct-‐12
Dec-‐12
Feb-‐13
Apr-‐13
Jun-‐13
Aug-‐13
Oct-‐13
Dec-‐13
Feb-‐14
N5 -‐ Soro PHC, Bauchi (CCT)
Series1
3 per. Mov. Avg. (Series1)
0
10
20
30
40
50
60
Apr-‐12
Jun-‐12
Aug-‐12
Oct-‐12
Dec-‐12
Feb-‐13
Apr-‐13
Jun-‐13
Aug-‐13
Oct-‐13
Dec-‐13
Feb-‐14
N6 -‐ Bununu, Bauchi (NCCT)
Series1
3 per. Mov. Avg. (Series1)
0
5
10
15
20
25
30
Apr-‐12
Jul-‐1
2
Oct-‐12
Jan-‐13
Apr-‐13
Jul-‐1
3
Oct-‐13
Jan-‐14
N6 -‐ Soro PHC, Bauchi (CCT)
Series1
3 per. Mov. Avg. (Series1)

32
2. Soro PHC shows consistent increase after the introduction of SURE-‐P MCH. The sharp dip to zero in August 2013 should be investigated further.
BAUCHI STATE SUMMARY
Indicator Non CCT Facility Bununu PHC
CCT Facility Soro PHC
N1 Pregnant women attending four or more ANC visits N2 Pregnant women receiving birthing services from SBAs N3 Newborns provided with OPV at birth N4 Newborns provided with HBV at birth N5 Newborn provided with BCG at birth N6 Women bringing their newborns for post-‐natal check Key = Improvement = No change = Worsening
BAYELSA STATE
The evaluation in Bayelsa took place in Ekeremor and Tombia PHC
N1 -‐ NUMBER OF PREGNANT WOMEN ATTENDING 4 OR MORE ANTENATAL CARE VISITS
1. For Ekeremor PHC, there has been an increase in numbers from January 2013. This follows an initial decrease up to that point. The reason for the dip in July 2013 is unclear and the evaluation team could not visit this location because of security problems. Overall there appears to have been a slow increase in numbers over time.
2. For Tombia PHC, the number of women attending 4 antenatal visits was zero until January 2013. This could be due to data issues (perhaps they started collecting data late and this needs investigating). From that point we have an apparent moderate to high rate of increase over time.
N2 -‐ NUMBER OF PREGNANT WOMEN RECEIVING BIRTHING SERVICES FROM SBAS
0
5
10
15
20
25
30
35
Apr-‐12
Jun-‐12
Aug-‐12
Oct-‐12
Dec-‐12
Feb-‐13
Apr-‐13
Jun-‐13
Aug-‐13
Oct-‐13
Dec-‐13
Feb-‐14
N1 -‐ Ekeremor CHC, Bayelsa (NCCT)
Series1
3 per. Mov. Avg. (Series1)
05
101520253035404550
Apr-‐12
Jun-‐12
Aug-‐12
Oct-‐12
Dec-‐12
Feb-‐13
Apr-‐13
Jun-‐13
Aug-‐13
Oct-‐13
Dec-‐13
Feb-‐14
N1 -‐ Tombia PHC, Bayelsa (CCT)
Series1
3 per. Mov. Avg. (Series1)

33
1. With the exception of the brief period of increase between January 2013 and March 2013, the trend decreased consistently in Ekeremor PHC. This may be due to reported security issues in this area but requires further investigation.
2. There was a remarkable increase in Tombia PHC, associated with the introduction of SURE-‐P MCH
N3 -‐ NUMBER OF NEWBORNS PROVIDED WITH OPV AT BIRTH
1. In Ekeremor PHC, there appears to have been a consistent and low rate of increase in numbers with an unexplained spike in January 2013.
2. In Tombia PHC, there was an initial rapid increase after SURE-‐P MCH introduction. This increase has largely been sustained over time.
N4-‐ NUMBER OF NEWBORNS PROVIDED WITH HBV AT BIRTH
02468
1012141618
Apr-‐12
Jun-‐12
Aug-‐12
Oct-‐12
Dec-‐12
Feb-‐13
Apr-‐13
Jun-‐13
Aug-‐13
Oct-‐13
Dec-‐13
Feb-‐14
N2 -‐ Ekeremor CHC, Bayelsa (NCCT)
Series1
3 per. Mov. Avg. (Series1)
0
2
4
6
8
10
12
Apr-‐12
Jun-‐12
Aug-‐12
Oct-‐12
Dec-‐12
Feb-‐13
Apr-‐13
Jun-‐13
Aug-‐13
Oct-‐13
Dec-‐13
Feb-‐14
N2 -‐ Tombia PHC, Bayelsa (CCT)
Series1
3 per. Mov. Avg. (Series1)
0102030405060708090
Apr-‐12
Jun-‐12
Aug-‐12
Oct-‐12
Dec-‐12
Feb-‐13
Apr-‐13
Jun-‐13
Aug-‐13
Oct-‐13
Dec-‐13
Feb-‐14
N3 -‐ Ekeremor CHC, Bayelsa (NCCT)
Series1
3 per. Mov. Avg. (Series1)
0
5
10
15
20
25
Apr-‐12
Jun-‐12
Aug-‐12
Oct-‐12
Dec-‐12
Feb-‐13
Apr-‐13
Jun-‐13
Aug-‐13
Oct-‐13
Dec-‐13
Feb-‐14
N3 -‐ Tombia PHC, Bayelsa (CCT)
Series1
3 per. Mov. Avg. (Series1)

34
1. No significant increase in Ekeremor PHC until the spike in December 2013. Interpretation not possible. 2. Tombia PHC shows increase over time from SURE-‐P MCH introduction in October 2012. The increase is largely
sustained over the period of evaluation
N5 -‐ NUMBER OF NEWBORN PROVIDED WITH BCG AT BIRTH
1. Ekeremor PHC did not show any remarkable increase until June 2013. However, the sharp dip to zero in November 2013 affected the growth part of the trend curve drastically. There may be local factor(s) at play
2. Tombia PHC shows increase in numbers and a high rate of increase over time from November 2012 (post SURE-‐P MCH). The increase is sustained.
N6 -‐ NUMBER OF WOMEN BRINGING THEIR NEWBORNS FOR POSTNATAL CHECK
1. For Ekeremor PHC, the trend curve has little meaning with all the dips and trail on zero.
0
50
100
150
200
250Apr-‐12
Jun-‐12
Aug-‐12
Oct-‐12
Dec-‐12
Feb-‐13
Apr-‐13
Jun-‐13
Aug-‐13
Oct-‐13
Dec-‐13
Feb-‐14
N4 -‐ Ekeremor CHC, Bayelsa (NCCT)
Series1
3 per. Mov. Avg. (Series1)
0
5
10
15
20
25
Apr-‐12
Jun-‐12
Aug-‐12
Oct-‐12
Dec-‐12
Feb-‐13
Apr-‐13
Jun-‐13
Aug-‐13
Oct-‐13
Dec-‐13
Feb-‐14
N4 -‐ Tombia PHC, Bayelsa (CCT)
Series1
3 per. Mov. Avg. (Series1)
020406080
100120140160180200
Apr-‐12
Jun-‐12
Aug-‐12
Oct-‐12
Dec-‐12
Feb-‐13
Apr-‐13
Jun-‐13
Aug-‐13
Oct-‐13
Dec-‐13
Feb-‐14
N5 -‐ Ekeremor CHC, Bayelsa (NCCT)
Series1
3 per. Mov. Avg. (Series1)
0
5
10
15
20
25
Apr-‐12
Jun-‐12
Aug-‐12
Oct-‐12
Dec-‐12
Feb-‐13
Apr-‐13
Jun-‐13
Aug-‐13
Oct-‐13
Dec-‐13
Feb-‐14
N5 -‐ Tombia PHC, Bayelsa (CCT)
Series1
3 per. Mov. Avg. (Series1)
0
1
2
3
4
5
6
Apr-‐12
Jun-‐12
Aug-‐12
Oct-‐12
Dec-‐12
Feb-‐13
Apr-‐13
Jun-‐13
Aug-‐13
Oct-‐13
Dec-‐13
Feb-‐14
N6 -‐ Ekeremor CHC, Bayelsa (NCCT)
Series1
3 per. Mov. Avg. (Series1)
0
2
4
6
8
10
12
14
16
Apr-‐12
Jun-‐12
Aug-‐12
Oct-‐12
Dec-‐12
Feb-‐13
Apr-‐13
Jun-‐13
Aug-‐13
Oct-‐13
Dec-‐13
Feb-‐14
N6 -‐ Tombia PHC, Bayelsa (CCT)
Series1
3 per. Mov. Avg. (Series1)

35
2. Tombia PHC shows sustained increase over time from February 2013. Before, it was all zeros (probably due to data recording issues).
BAYELSA STATE SUMMARY
Indicator Non CCT Facility Ekeremor PHC
CCT Facility Tombia PHC
N1 Pregnant women attending four or more ANC visits N2 Pregnant women receiving birthing services from SBAs N3 Newborns provided with OPV at birth N4 Newborns provided with HBV at birth N5 Newborn provided with BCG at birth N6 Women bringing their newborns for post-‐natal check Key = Improvement = No change = Worsening
ANAMBRA
In Anambra State, the evaluation took place in Ebenesi and Nkwelle Ezunaka PHCs
General Comments 1. In Ebenesi there are no observable data issues. It showed more improvement in immunization than other
areas. It will be interesting to look at other facilities in the state. 2. It seems that Nkwelle Ezunaka (NCCT) did not collect or lost the immunization data collected between April
2012 and February 2013
N1 -‐ NUMBER OF PREGNANT WOMEN ATTENDING 4 OR MORE ANTENATAL CARE VISITS
0102030405060708090
100
Apr-‐12
Jun-‐12
Aug-‐12
Oct-‐12
Dec-‐12
Feb-‐13
Apr-‐13
Jun-‐13
Aug-‐13
Oct-‐13
Dec-‐13
Feb-‐14
N1 -‐ PHC Nkwelle Ezunaka, Anambra (NCCT)
Series1
3 per. Mov. Avg. (Series1)
0102030405060708090
Apr-‐12
Jun-‐12
Aug-‐12
Oct-‐12
Dec-‐12
Feb-‐13
Apr-‐13
Jun-‐13
Aug-‐13
Oct-‐13
Dec-‐13
Feb-‐14
N1 -‐ PHC Ebenesi, Anambra (CCT)
Series1
3 per. Mov. Avg. (Series1)

36
1. Nkwelle Ezunaka showed an improvement from June 2012. The rate of increase is higher from November 2012 and the increase sustained from that point. The steep drop in March 2014 needs investigation.
2. The trend lie for Ebenesi showed a very slight increase after the introduction of SURE-‐P MCH. There is a slight drop between July 2013 and September 2013.
N2 -‐ NUMBER OF PREGNANT WOMEN RECEIVING BIRTHING SERVICES FROM SBAS
1. Nkwelle Ezunaka did not show a good trend line because of many zeros in their data. We cannot make suggestions based on this trend line
2. Ebenesi showed a moderate increase and increasing rate of increase following the introduction of SURE-‐P MCH. This precedes a gradual decrease to baseline level around October 2013.
N3 -‐ NUMBER OF NEWBORNS PROVIDED WITH OPV AT BIRTH
1. There are several zeros in the data from Nkwelle Ezunaka from April 2012 to January 2013 (likely due to data
collection problems). It shows a steady increase from February 2013. The rate of increase is highest between
0
5
10
15
20
25
30
35
Apr-‐12
Jun-‐12
Aug-‐12
Oct-‐12
Dec-‐12
Feb-‐13
Apr-‐13
Jun-‐13
Aug-‐13
Oct-‐13
Dec-‐13
Feb-‐14
N2 -‐ PHC Nkwelle Ezunaka, Anambra (NCCT)
Series1
3 per. Mov. Avg. (Series1)
0
10
20
30
40
50
60
Apr-‐12
Jun-‐12
Aug-‐12
Oct-‐12
Dec-‐12
Feb-‐13
Apr-‐13
Jun-‐13
Aug-‐13
Oct-‐13
Dec-‐13
Feb-‐14
N2 -‐ PHC Ebenesi, Anambra (CCT)
Series1
3 per. Mov. Avg. (Series1)
0
50
100
150
200
250
300
350
Apr-‐12
Jun-‐12
Aug-‐12
Oct-‐12
Dec-‐12
Feb-‐13
Apr-‐13
Jun-‐13
Aug-‐13
Oct-‐13
Dec-‐13
Feb-‐14
N3 -‐ PHC Nkwelle Ezunaka, Anambra (NCCT)
Series1
3 per. Mov. Avg. (Series1)
0102030405060708090
100
Apr-‐12
Jun-‐12
Aug-‐12
Oct-‐12
Dec-‐12
Feb-‐13
Apr-‐13
Jun-‐13
Aug-‐13
Oct-‐13
Dec-‐13
Feb-‐14
N3 -‐ PHC Ebenesi, Anambra (CCT)
Series1
3 per. Mov. Avg. (Series1)

37
July 2013 and September 2013. This is followed by a period of decrease (November 2013 and December 2013) and gradual rise from January 2014. The number of what we can consider valid data points limits the value of the trend line here.
2. The trend line for Ebenesi shows areas of decrease and increase over the period of interest. These variations are all below the baseline levels, but not by much.
N4 -‐NUMBER OF NEWBORNS PROVIDED WITH HBV AT BIRTH
1. The trend line for Nkwelle Ezunaka showed an increase over time from February 2013. Before then, it was
zeros all through. We have records of zeroes in April 2013, July 2013 and September 2013. These points negatively affects the usefulness of the trend line and deserves further probe.
2. Ebenesi (CCT) showed a gradual decline from October 2012 and continues on that course to the end (March 2014) and to about slightly above the April 2012 point. This decline is preceded by an increase from April 2012 to September 2012.
N5 -‐ NUMBER OF NEWBORN PROVIDED WITH BCG AT BIRTH
0
5
10
15
20
25
30
35
Apr-‐12
Jun-‐12
Aug-‐12
Oct-‐12
Dec-‐12
Feb-‐13
Apr-‐13
Jun-‐13
Aug-‐13
Oct-‐13
Dec-‐13
Feb-‐14
N4 -‐ PHC Nkwelle Ezunaka, Anambra (NCCT)
Series1
3 per. Mov. Avg. (Series1)
0
20
40
60
80
100
120
Apr-‐12
Jun-‐12
Aug-‐12
Oct-‐12
Dec-‐12
Feb-‐13
Apr-‐13
Jun-‐13
Aug-‐13
Oct-‐13
Dec-‐13
Feb-‐14
N4 -‐ HC Ebenesi, Anambra (CCT)
Series1
3 per. Mov. Avg. (Series1)

38
1. Nkwelle Ezunaka showed a clear pattern of increase and a high rate of increase after February 2013. It is all
zeroes before the period of increase from February 2013. 2. Ebenesi showed a spike in November 2013. The spike is not likely due to SURE-‐P MCH activities because the
overall trend shows a gradual decrease from January 2013 to the end.
N6 -‐ NUMBER OF WOMEN BRINGING THEIR NEWBORNS FOR POST-‐NATAL CHECK
1. Nkwelle Ezunaka showed an increase after the introduction of SURE-‐P MCH in October 2012. The pattern of
increase is sustained until a sudden drop to zero in July 2013. It remains zero to the end (we suspect problems with data collection during this period)
2. Ebenesi showed a consistent increase after the introduction of SURE-‐P MCH and a sharp rate of decline between November and December 2013. The the trend line stays about the baseline all through the period.
ANAMBRA STATE SUMMARY
Indicator Non CCT Facility Nkwelle Ezunaka PHC
CCT Facility Ebenesi PHC
N1 Pregnant women attending four or more ANC visits N2 Pregnant women receiving birthing services from SBAs N3 Newborns provided with OPV at birth N4 Newborns provided with HBV at birth N5 Newborn provided with BCG at birth N6 Women bringing their newborns for post-‐natal check
0
10
20
30
40
50
60
Apr-‐12
Jun-‐12
Aug-‐12
Oct-‐12
Dec-‐12
Feb-‐13
Apr-‐13
Jun-‐13
Aug-‐13
Oct-‐13
Dec-‐13
Feb-‐14
N5 -‐ PHC Nkwelle Ezunaka, Anambra (NCCT)
Series1
3 per. Mov. Avg. (Series1)
0
20
40
60
80
100
120
Apr-‐12
Jun-‐12
Aug-‐12
Oct-‐12
Dec-‐12
Feb-‐13
Apr-‐13
Jun-‐13
Aug-‐13
Oct-‐13
Dec-‐13
Feb-‐14
N5 -‐ PHC Ebenesi, Anambra (CCT)
Series1
3 per. Mov. Avg. (Series1)
0
2
4
6
8
10
12
14
Apr-‐12
Jun-‐12
Aug-‐12
Oct-‐12
Dec-‐12
Feb-‐13
Apr-‐13
Jun-‐13
Aug-‐13
Oct-‐13
Dec-‐13
Feb-‐14
N6 -‐ PHC Nkwelle Ezunaka, Anambra (NCCT)
Series1
3 per. Mov. Avg. (Series1)
0
10
20
30
40
50
60
Apr-‐12
Jun-‐12
Aug-‐12
Oct-‐12
Dec-‐12
Feb-‐13
Apr-‐13
Jun-‐13
Aug-‐13
Oct-‐13
Dec-‐13
Feb-‐14
N6 -‐ PHC Ebenesi, Anambra (CCT)
Series1
3 per. Mov. Avg. (Series1)

39
Key = Improvement = No change = Worsening
KADUNA
The evaluation in Kaduna was conducted in Kamantan and Soba PHCs
General Comments 1. We have reasonable reservations about the data collected on immunizations (N2 to N5) and on postnatal checks
for children (N6) from Kaduna State.
N1 -‐NUMBER OF PREGNANT WOMEN ATTENDING 4 OR MORE ANTENATAL CARE VISITS
1. With Soba, there was a steep rate of decrease from September 2012 to December 2012. This is followed by
an increase up to February 2013. The trend was reversed to a decrease from this point to October 2013. The facility recorded a sharp increase from October 2013 to March 2014. The effect of SURE-‐P activities here, if any, is not clear.
2. For Kamantan, the trend showed a steady increase from December 2012 to a peak around July 2013. The trend then decreased sharply after July 2013. The decrease could be due to seasonal variations. Data from after March 2014 (not accommodated in our chart) may or may not support this assumption.
N2 -‐ NUMBER OF PREGNANT WOMEN RECEIVING BIRTHING SERVICES FROM SBAS
0
50
100
150
200
250
Apr-‐12
Jun-‐12
Aug-‐12
Oct-‐12
Dec-‐12
Feb-‐13
Apr-‐13
Jun-‐13
Aug-‐13
Oct-‐13
Dec-‐13
Feb-‐14
N1 -‐ PHC Soba, Kaduna (NCCT)
Series1
3 per. Mov. Avg. (Series1)
0
20
40
60
80
100
120
Apr-‐12
Jul-‐1
2
Oct-‐12
Jan-‐13
Apr-‐13
Jul-‐1
3
Oct-‐13
Jan-‐14
N1 -‐ PHC Kamantan, Kaduna (CCT)
Series1
3 per. Mov. Avg. (Series1)
0
2
4
6
8
10
12
Apr-‐12
Jun-‐12
Aug-‐12
Oct-‐12
Dec-‐12
Feb-‐13
Apr-‐13
Jun-‐13
Aug-‐13
Oct-‐13
Dec-‐13
Feb-‐14
N2 -‐ PHC Soba, Kaduna (NCCT)
Series1
3 per. Mov. Avg. (Series1)
0
5
10
15
20
25
30
35
Apr-‐12
Jun-‐12
Aug-‐12
Oct-‐12
Dec-‐12
Feb-‐13
Apr-‐13
Jun-‐13
Aug-‐13
Oct-‐13
Dec-‐13
Feb-‐14
N2 -‐ PHC Kamantan, Kaduna (CCT)
Series1
3 per. Mov. Avg. (Series1)

40
1. Soba showed an increase initially following the introduction of SURE-‐P MCH. This is followed by a slight decrease and a comparatively lower rate of decrease. The level remains above the baseline level until a sudden drop in July 2013 to zero (this is likely a data collection problem).
2. Kamantan showed a clear improvement over time with a high rate of increase between January 2013 and June 2013.
N3 -‐ NUMBER OF NEWBORNS PROVIDED WITH OPV AT BIRTH
1. Both facilities show a consistent increase over time following the introduction of SURE-‐P MCH in October
2012. This is shown by the trend line (black line) 2. Soba likely has data issues from April 2012 to February 2013 (all zeros) 3. There is a sudden drop in March 2014 for both facilities. This deserves a close examination.
N4 -‐ NUMBER OF NEWBORNS PROVIDED WITH HBV AT BIRTH
1. The data for Soba had all zeros from April 2012 to February 2013 (indicative of serious data quality
issues). After that, the trend line shows an increase over time. The dip to zero around July and August 2013 needs to be explained
2. There were a lot of zeros in the data for Kamantan. These deserve closer examination. From our field observations, the availability of vaccines could be the problem here. Otherwise, the trend line shows a steady increase over time after the drop between September 2012 and January 2013.
0
5
10
15
20
25
30
35
40
Apr-‐12
Jun-‐12
Aug-‐12
Oct-‐12
Dec-‐12
Feb-‐13
Apr-‐13
Jun-‐13
Aug-‐13
Oct-‐13
Dec-‐13
Feb-‐14
N3 -‐ PHC Soba, Kaduna (NCCT)
Series1
3 per. Mov. Avg. (Series1)
0
10
20
30
40
50
60
Apr-‐12
Jun-‐12
Aug-‐12
Oct-‐12
Dec-‐12
Feb-‐13
Apr-‐13
Jun-‐13
Aug-‐13
Oct-‐13
Dec-‐13
Feb-‐14
N3 -‐ PHC Kamantan, Kaduna (CCT)
Series1
3 per. Mov. Avg. (Series1)
051015202530354045
Apr-‐12
Jun-‐12
Aug-‐12
Oct-‐12
Dec-‐12
Feb-‐13
Apr-‐13
Jun-‐13
Aug-‐13
Oct-‐13
Dec-‐13
Feb-‐14
N4 -‐ PHC Soba, Kaduna (NCCT)
Series1
3 per. Mov. Avg. (Series1)
0
5
10
15
20
25
30
35
40
Apr-‐12
Jun-‐12
Aug-‐12
Oct-‐12
Dec-‐12
Feb-‐13
Apr-‐13
Jun-‐13
Aug-‐13
Oct-‐13
Dec-‐13
Feb-‐14
N4 -‐ PHC Kamantan, Kaduna (CCT)
Series1
3 per. Mov. Avg. (Series1)

41
N5 -‐ NUMBER OF NEWBORN PROVIDED WITH BCG AT BIRTH
1. The data from Soba had many zeros most likely due to data problems. This diminishes the importance of the trend line, which shows increases over two periods (February 2013 to August 2013 and from December 2013).
2. The CCT facility (Kamantan) shows a gradual rate of decrease from June 2013 after the initial steady increase from October 2012. The decrease hits levels below the baseline by November 2013.
N6 -‐ NUMBER OF WOMEN BRINGING THEIR NEWBORNS FOR POSTNATAL CHECK
1. It is all zeros for Soba from April 2012 to November 2013. The remaining data points are not enough to describe a trend.
2. Kamantan shows no distinct trend over time. The drop to zero in December 2013 and January 2014 negatively affected the trend line and deserves an examination for data problems.
0
10
20
30
40
50
60
70
80
Apr-‐12
Jun-‐12
Aug-‐12
Oct-‐12
Dec-‐12
Feb-‐13
Apr-‐13
Jun-‐13
Aug-‐13
Oct-‐13
Dec-‐13
Feb-‐14
N5 -‐ PHC Soba, Kaduna (NCCT)
Series1
3 per. Mov. Avg. (Series1)
0102030405060708090100
Apr-‐12
Jun-‐12
Aug-‐12
Oct-‐12
Dec-‐12
Feb-‐13
Apr-‐13
Jun-‐13
Aug-‐13
Oct-‐13
Dec-‐13
Feb-‐14
N5 -‐ PHC Kamantan, Kaduna (CCT)
Series1
3 per. Mov. Avg. (Series1)
05101520253035404550
Apr-‐12
Jun-‐12
Aug-‐12
Oct-‐12
Dec-‐12
Feb-‐13
Apr-‐13
Jun-‐13
Aug-‐13
Oct-‐13
Dec-‐13
Feb-‐14
N6 -‐ PHC Soba, Kaduna (NCCT)
Series1
3 per. Mov. Avg. (Series1)
0102030405060708090100
Apr-‐12
Jun-‐12
Aug-‐12
Oct-‐12
Dec-‐12
Feb-‐13
Apr-‐13
Jun-‐13
Aug-‐13
Oct-‐13
Dec-‐13
Feb-‐14
N6 -‐ PHC Kamantan, Kaduna (CCT)
Series1
3 per. Mov. Avg. (Series1)

42
KADUNA STATE SUMMARY
Indicator Non CCT Facility Soba PHC
CCT Facility Kamanan PHC
N1 Pregnant women attending four or more ANC visits N2 Pregnant women receiving birthing services from SBAs N3 Newborns provided with OPV at birth N4 Newborns provided with HBV at birth N5 Newborn provided with BCG at birth N6 Women bringing their newborns for post-‐natal check Key = Improvement = No change = Worsening
NIGER
In Niger state, Maje and Dabban PHCs were studied.
N1 – NUMBER OF PREGNANT WOMEN ATTENDING 4 OR MORE ANTENATAL CARE VISITS
1. With Maje an initial increase between October 2012 and February 2013 gave way to a steady decline to
points below the baseline level by July 2013. This is followed by a rise from November 2013 to the end. 2. The trend line for Dabban shows a high rate of increase in March 2013 after a period of very little change
from October 2012 to March 2013 (with small dip in February 2013). The trend shows a steep rate of decline from July 2013 to September 2013 and to just above the baseline level by November 2013. This is followed by a high rate of increase to the end.
N2 -‐ NUMBER OF PREGNANT WOMEN RECEIVING BIRTHING SERVICES FROM SBAS
0
20
40
60
80
100
120
Apr-‐12
Jun-‐12
Aug-‐12
Oct-‐12
Dec-‐12
Feb-‐13
Apr-‐13
Jun-‐13
Aug-‐13
Oct-‐13
Dec-‐13
Feb-‐14
N1 -‐ CHC Maje, Niger (NCCT)
Series1
3 per. Mov. Avg. (Series1)
0
2
4
6
8
10
12Ap
r-‐12
Jun-‐12
Aug-‐12
Oct-‐12
Dec-‐12
Feb-‐13
Apr-‐13
Jun-‐13
Aug-‐13
Oct-‐13
Dec-‐13
Feb-‐14
N1 -‐ CHC Dabban, Niger (CCT)
Series1
3 per. Mov. Avg. (Series1)

43
1. In both facilities there were a lot of zeros from April 2012 to February 2013. This was a clear case of poor
record keeping. 2. Both facilities showed a steady increase from February 2013 to the end. Maje had a higher rate and level
of increase than Dabban.
N3 -‐ NUMBER OF NEWBORNS PROVIDED WITH OPV AT BIRTH
1. In Maje (NCCT), the trend line shows initial increase before SURE-‐P MCH and which peaked in October 2012. The increase cannot be due to SURE-‐P MCH (program was initiated in October 2012). The increase was sustained briefly before a steady decrease to points below the baseline.
2. The observed increase and rate of increase in Dabban is sustained all through.
N4 -‐ NUMBER OF NEWBORNS PROVIDED WITH HBV AT BIRTH
0
5
10
15
20
25
30
Apr-‐12
Jun-‐12
Aug-‐12
Oct-‐12
Dec-‐12
Feb-‐13
Apr-‐13
Jun-‐13
Aug-‐13
Oct-‐13
Dec-‐13
Feb-‐14
N2 -‐ CHC Maje, Niger (NCCT)
Series1
3 per. Mov. Avg. (Series1)
0
5
10
15
20
25
30
Apr-‐12
Jun-‐12
Aug-‐12
Oct-‐12
Dec-‐12
Feb-‐13
Apr-‐13
Jun-‐13
Aug-‐13
Oct-‐13
Dec-‐13
Feb-‐14
N2 -‐ CHC Dabban, Niger (CCT)
Series1
3 per. Mov. Avg. (Series1)
0
20
40
60
80
100
120
140
Apr-‐12
Jun-‐12
Aug-‐12
Oct-‐12
Dec-‐12
Feb-‐13
Apr-‐13
Jun-‐13
Aug-‐13
Oct-‐13
Dec-‐13
Feb-‐14
N3 -‐ CHC Maje, Niger (NCCT)
Series1
3 per. Mov. Avg. (Series1)
0
5
10
15
20
25
Apr-‐12
Jun-‐12
Aug-‐12
Oct-‐12
Dec-‐12
Feb-‐13
Apr-‐13
Jun-‐13
Aug-‐13
Oct-‐13
Dec-‐13
Feb-‐14
N3 -‐ CHC Dabban, Niger (CCT)
Series1
3 per. Mov. Avg. (Series1)

44
1. The trend line for Maje shows an increase from November 2012. This increase was sustained till a
gradual decline from April 2013. The reasons for the decrease need further investigation. 2. Dabban showed a period of sharp increase from February 2013 and a slow rate of decrease over June
2013 to October 2013.
N5 -‐ NUMBER OF NEWBORN PROVIDED WITH BCG AT BIRTH
1. The trend line for Maje showed a decrease to levels below the baseline to the end. There were
occasional increases over the period after October 2012, but none was up to the baseline level. 2. Dabban showed a sustained increase through the period under examination. The only problem is the
zero value recorded in February 2013.
N6 -‐ NUMBER OF WOMEN BRINGING THEIR NEWBORNS FOR POSTNATAL CHECK
0102030405060708090
Apr-‐12
Jun-‐12
Aug-‐12
Oct-‐12
Dec-‐12
Feb-‐13
Apr-‐13
Jun-‐13
Aug-‐13
Oct-‐13
Dec-‐13
Feb-‐14
N4 -‐ CHC Maje, Niger (NCCT)
Series1
3 per. Mov. Avg. (Series1)
0
5
10
15
20
25
30
35
40
Apr-‐12
Jun-‐12
Aug-‐12
Oct-‐12
Dec-‐12
Feb-‐13
Apr-‐13
Jun-‐13
Aug-‐13
Oct-‐13
Dec-‐13
Feb-‐14
N4 -‐ CHC Dabban, Niger (CCT)
Series1
3 per. Mov. Avg. (Series1)
0
20
40
60
80
100
120
Apr-‐12
Jun-‐12
Aug-‐12
Oct-‐12
Dec-‐12
Feb-‐13
Apr-‐13
Jun-‐13
Aug-‐13
Oct-‐13
Dec-‐13
Feb-‐14
N5 -‐ CHC Maje, Niger (NCCT)
Series1
3 per. Mov. Avg. (Series1)
0
5
10
15
20
25
30
35
Apr-‐12
Jun-‐12
Aug-‐12
Oct-‐12
Dec-‐12
Feb-‐13
Apr-‐13
Jun-‐13
Aug-‐13
Oct-‐13
Dec-‐13
Feb-‐14
N5 -‐ CHC Dabban, Niger (CCT)
Series1
3 per. Mov. Avg. (Series1)

45
1. There were data problems in Maje; all values are zero. 2. Data from Dabban showed a sustained increase over time and increasing rate of increase at
different times.
NIGER STATE SUMMARY
Indicator Non CCT Facility Maje PHC
CCT Facility Dabban PHC
N1 Pregnant women attending four or more ANC visits N2 Pregnant women receiving birthing services from SBAs N3 Newborns provided with OPV at birth N4 Newborns provided with HBV at birth N5 Newborn provided with BCG at birth N6 Women bringing their newborns for post-‐natal check Key = Improvement = No change = Worsening
OGUN
In Ogun State, we evaluated Ajuwon and Sango PHCs
General Comments 1. The trends and actual numbers for N3, N4 and N5 are similar for the NCCT (Sango). This is one time we are
confident that good immunization records were kept 2. The trends and actual numbers for N3, N4 and N5 are similar for the CCT (Ajuwon). This is another time we
are confident that good immunization records were kept 3. We have reservations about N3, N4, N5 and N6 for many of the facilities.
N1 -‐ NUMBER OF PREGNANT WOMEN ATTENDING 4 OR MORE ANTENATAL CARE VISITS
0
0.2
0.4
0.6
0.8
1
Apr-‐12
Jun-‐12
Aug-‐12
Oct-‐12
Dec-‐12
Feb-‐13
Apr-‐13
Jun-‐13
Aug-‐13
Oct-‐13
Dec-‐13
Feb-‐14
N6 -‐ CHC Maje, Niger (NCCT) -‐all zeros
Series1
0
5
10
15
20
25
30
35
Apr-‐12
Jun-‐12
Aug-‐12
Oct-‐12
Dec-‐12
Feb-‐13
Apr-‐13
Jun-‐13
Aug-‐13
Oct-‐13
Dec-‐13
Feb-‐14
N6 -‐ CHC Dabban, Niger (CCT)
Series1
3 per. Mov. Avg. (Series1)

46
1. For Sango, we observed a steep rate of increase between March 2013 and April 2013. This is followed by
an equally steep rate of decrease from April to July 2013, to a level below the baseline. The period of the changes is relatively short and situated months after the introduction of SURE-‐P MCH activities. It will be interesting to see whether the upswing in March 2014 is sustained when more data become available.
2. The trend line for Ajuwon shows a steady and sustained increase with occasional dips. We are not worried about these dips. They are likely cyclical.
N2 -‐ NUMBER OF PREGNANT WOMEN RECEIVING BIRTHING SERVICES FROM SBAS
1. The increase observed in Sango is from January 2013 and has stayed largely below the baseline level. 2. Data from Ajuwon showed a clear and sustained increase from April 2013. The levels have stayed above
the baseline since the increase.
050100150200250300350400450500
Apr-‐12
Jun-‐12
Aug-‐12
Oct-‐12
Dec-‐12
Feb-‐13
Apr-‐13
Jun-‐13
Aug-‐13
Oct-‐13
Dec-‐13
Feb-‐14
N1 -‐ Sango PHC, Ogun (NCCT)
Series1
3 per. Mov. Avg. (Series1)
020406080100120140160180200
Apr-‐12
Jul-‐1
2
Oct-‐12
Jan-‐13
Apr-‐13
Jul-‐1
3
Oct-‐13
Jan-‐14
N1 -‐ Ajuwon PHC, Ogun (CCT)
Series1
3 per. Mov. Avg. (Series1)
0
10
20
30
40
50
60
Apr-‐12
Jun-‐12
Aug-‐12
Oct-‐12
Dec-‐12
Feb-‐13
Apr-‐13
Jun-‐13
Aug-‐13
Oct-‐13
Dec-‐13
Feb-‐14
N2 -‐ Sango PHC, Ogun (NCCT)
Series1
3 per. Mov. Avg. (Series1)
0
5
10
15
20
25
30
Apr-‐12
Jun-‐12
Aug-‐12
Oct-‐12
Dec-‐12
Feb-‐13
Apr-‐13
Jun-‐13
Aug-‐13
Oct-‐13
Dec-‐13
Feb-‐14
N2 -‐ Ajuwon PHC, Ogun (CCT)
Series1
3 per. Mov. Avg. (Series1)

47
N3 -‐ NUMBER OF NEWBORNS PROVIDED WITH OPV AT BIRTH
1. We suggest here that SURE-‐P MCH had no effect on immunization levels 2. The pattern here is likely the normal cyclical pattern for the facilities.
N4 -‐ NUMBER OF NEWBORNS PROVIDED WITH HBV AT BIRTH
1. The pattern here is likely the normal cyclical pattern for the facilities. As noted in the general section, we are
confident that good records were kept 2. We suggest here that SURE-‐P MCH has no effect on immunization levels
050100150200250300350400450500
Apr-‐12
Jun-‐12
Aug-‐12
Oct-‐12
Dec-‐12
Feb-‐13
Apr-‐13
Jun-‐13
Aug-‐13
Oct-‐13
Dec-‐13
Feb-‐14
N3 -‐ Sango PHC, Ogun (NCCT)
Series1
3 per. Mov. Avg. (Series1)
020406080100120140160180200
Apr-‐12
Jun-‐12
Aug-‐12
Oct-‐12
Dec-‐12
Feb-‐13
Apr-‐13
Jun-‐13
Aug-‐13
Oct-‐13
Dec-‐13
Feb-‐14
N3 -‐ Ajuwon PHC, Ogun (CCT)
Series1
3 per. Mov. Avg. (Series1)
0
100
200
300
400
500
600
Apr-‐12
Jun-‐12
Aug-‐12
Oct-‐12
Dec-‐12
Feb-‐13
Apr-‐13
Jun-‐13
Aug-‐13
Oct-‐13
Dec-‐13
Feb-‐14
N4 -‐ Sango PHC, Ogun (NCCT)
Series1
3 per. Mov. Avg. (Series1)
020406080100120140160180200
Apr-‐12
Jun-‐12
Aug-‐12
Oct-‐12
Dec-‐12
Feb-‐13
Apr-‐13
Jun-‐13
Aug-‐13
Oct-‐13
Dec-‐13
Feb-‐14
N4 -‐ Ajuwon PHC, Ogun (CCT)
Series1
3 per. Mov. Avg. (Series1)
48
N5 -‐ NUMBER OF NEWBORN PROVIDED WITH BCG AT BIRTH
1. We suggest here that SURE-‐P MCH has no effect on immunization levels in Sango 2. The pattern here is likely the normal cyclical pattern for the facilities. This includes the increase between July
2013 and October 2013 (for Ajuwon, a CCT facility).
N6 – NUMBER OF WOMEN BRINGING THEIR NEWBORNS FOR POSTNATAL CHECK
1. We found some indications of data issues in Sango. The trend line shows an increase from January 2013. The increase peaked in April 2013. This is followed by a decline to below baseline levels by July 2013.
2. For Ajuwon, there is an increase from March 2013 to December. This is followed by a decrease from January 2013 to May 2013 level by March 2014. The zeros from April 2012 to January 2013 are likely due to record keeping problems.
OGUN STATE SUMMARY
Indicator Non CCT Facility Sango PHC
CCT Facility Ajuwon PHC
N1 Pregnant women attending four or more ANC visits N2 Pregnant women receiving birthing services from SBAs N3 Newborns provided with OPV at birth N4 Newborns provided with HBV at birth
0
100
200
300
400
500
600
700
Apr-‐12
Jun-‐12
Aug-‐12
Oct-‐12
Dec-‐12
Feb-‐13
Apr-‐13
Jun-‐13
Aug-‐13
Oct-‐13
Dec-‐13
Feb-‐14
N5 -‐ Sango HC, Ogun (NCCT)
Series1
3 per. Mov. Avg. (Series1)
0
50
100
150
200
250
Apr-‐12
Jun-‐12
Aug-‐12
Oct-‐12
Dec-‐12
Feb-‐13
Apr-‐13
Jun-‐13
Aug-‐13
Oct-‐13
Dec-‐13
Feb-‐14
N5 -‐ Ajuwon PHC, Ogun (CCT)
Series1
3 per. Mov. Avg. (Series1)
0
50
100
150
200
250
300
Apr-‐12
Jun-‐12
Aug-‐12
Oct-‐12
Dec-‐12
Feb-‐13
Apr-‐13
Jun-‐13
Aug-‐13
Oct-‐13
Dec-‐13
Feb-‐14
N6 -‐ Sango PHC, Ogun (NCCT)
Series1
3 per. Mov. Avg. (Series1)
0
50
100
150
200
250
Apr-‐12
Jun-‐12
Aug-‐12
Oct-‐12
Dec-‐12
Feb-‐13
Apr-‐13
Jun-‐13
Aug-‐13
Oct-‐13
Dec-‐13
Feb-‐14
N6 -‐ Ajuwon PHC, Ogun (CCT)
Series1
3 per. Mov. Avg. (Series1)

49
N5 Newborn provided with BCG at birth N6 Women bringing their newborns for post-‐natal check Key = Improvement = No change = Worsening
SUMMARY OF QUANTITATIVE RESULTS
Differences in Means (Pre and Post SURE-‐P MCH)
N1 N2 N3 N4 N5 N6
Post SURE-‐P (Mean) 25.8 16.6 29.1 26.5 38.7 97.1
Pre SURE-‐P (Mean) 21.2 10.6 25.7 24.4 34.2 6.4
Difference in mean 4.6 6.0 3.3 2.0 4.5 90.6
With reference to the difference of means for each of the variables between the pre, and post-‐ SURE-‐P MCH implementation periods, as illustrated in the table above, the post SURE-‐P period shows improvement in all the variables of interest. However, we had to drop N6 because the 95% confidence interval for mean (post SURE-‐P period) could not be calculated with confidence as a result of data quality issues leading to very wide difference between the means of the pre-‐ and post-‐SURE-‐P periods, which is likely to be a surveillance artifact.
The results for the other five indicators show that;
1. There was a 36.3% increase in number of pregnant of women attending 4 or more antenatal care visits in the period following the introduction of SURE-‐P MCH.
2. There was a 32.1% increase in the number of pregnant women receiving birthing services from SBAs in the period following the introduction of SURE-‐P MCH.
3. There was a 23.8% increase in the number newborns provided with OPV at birth in the period following the introduction of SURE-‐P MCH.
4. There was a 9.8% increase in the number of newborns provided with HBV at birth in the period following the introduction of SURE-‐P MCH.
5. There was a 7.5% increase in the number of newborns provided with BCG at birth in the period following the introduction of SURE-‐P MCH.
SUMMARY ANALYSIS OF CCT VS NON-‐CCT FACILITIES
N6 N5 N4 N3 N2 N1
NCCT (Mean) 84.6 35.8 24.8 28.1 14.3 25.6
CCT (Mean) 12.9 40.2 28.1 27.2 13.1 20.8
Difference in mean 71.7 -‐4.4 -‐3.2 0.9 1.3 4.7 It was not possible to calculate ratios or rates because of the way the data was collected, and so we looked at absolute differences in means instead. In calculating the difference in means, data from all facilities in the six states visited were used. We discounted the analysis for N6 as a result of data quality challenges. CCT facilities appeared to

50
perform better than NCCT facilities only on parameters N4 and N5 i.e. number of newborns provided with HPV at birth and the number of newborns provided with BCG at birth. Looking at the geographical distribution, CCT facilities performed better in three of the six states; i.e. Niger, Kaduna, Bayelsa, while no difference was found in the indicators in Ogun, Anambra and Bauchi.
DATA AUDIT
In order to ascertain the quality of the data collected through the SURE-‐P MCH processes, an audit of the data at the facility level was carried out at all the facilities that were evaluated. Below is a summary of the findings of this audit.
1. Some discrepancies were found between the SURE-‐P data and the facility data collected during the field visits. However, there was no consistency in trends in terms of which of the data sources had more numbers. On some occasions the SURE-‐P records had more, while on others the facility records had more. The differences were generally not large.
2. While data collection was generally poor, data on deliveries specifically was generally better than the data on immunizations.
3. The total number of deliveries was found to be lower in SURE-‐P data because of the entry of births at home in the facility delivery register.
4. Some facilities have recently transitioned to FMoH/NHMIS registers and forms. Others still use other registers from NPCHDA, NPI and local governments registers to plain notebooks.
5. While some facilities record immunizations under the month of birth, others do so under the month of first immunization. The latter seems to be a carry-‐over from the old practice.

51
5.0 CONCLUSIONS
This is a widely appreciated programme that was conceived to have a direct and immediate impact towards the reduction of maternal and newborn morbidity and mortality in Nigeria. Nigeria has had a very poor record regarding maternal and child health outcomes. An estimated 53,000 women and 250,000 newborn die annually, mostly as a result of preventable causes. The maternal mortality ratio (MMR) in Nigeria is 545/100,000 live births, only one in three births in Nigeria is attended by skilled personnel, and 36% of pregnant women do not receive antenatal care (ANC).The SURE-‐P MCH programme was designed as a short-‐term intervention to run for four years, from 2012–2015 to support the alleviation some of these challenges and improve health of mothers and children.
We found that the SURE-‐P MCH programme led to a significant improvement in most of the indicators measured after the introduction of the programme. Since a lot of the indicators are mutually reinforcing, the expectation is that these will continue to improve over time if the investments can be sustained. However, there did not appear to be a significant difference between facilities in which CCT was implemented and those in which it was not.
The qualitative analysis demonstrated a strong perception among stakeholders and beneficiaries of t the programme that it had led to an improvement in the quality of care delivered to mothers and children in these facilities. This especially relates to the attitudes of health workers, the environment in which care is provided and the expectation of positive outcomes.
A whole new cadre of highly motivated midwives and CHEWS were deployed. Most of the midwives and CHEWS were young fresh graduates that joined the scheme with high enthusiasm. Also, a high level of community ownership of the project has been achieved. Central to the success of the project was the work of the village health workers. They work in the community and encourage women to come to the health facilities for care during pregnancy and after delivery. These village health workers are supported by ward development committees. In some communities, village heads have supported midwives and CHEWS with accommodation.
The state and local government partners of the SURE-‐P MCH programme did not seem to put their full weight behind the projects in their states and local governments. The pervasive view of those working in the states and LGAs was that they were not “carried along” on the project. Funding from the states could have complemented the federal government’s SURE-‐P MCH interventions at state levels. State and local governments who were supposed to also pay health workers were defaulting on their responsibilities. So, health workers are generally only receiving 50% of their promised salaries. Whatever the cause for this, the consequence was that many of the health workers did not receive their allowances in full as promised.
Another major challenge of the SURE-‐P MCH programme itself has been in achieving effective and efficient management under the operating environment. The data for monitoring and evaluation was of poor quality and not analysed and fed back with sufficient frequency to drive an improvement in data flow. If this had been the case, it would have served as added motivation for continuous improvement by the SURE-‐P MCH facilities.
However, it must be stated that the context in which this programme was carried out was quite challenging. This was an extremely large public sector project including 1000 healthcare facilities across Nigeria, rolled out during a period of significant security challenges across large parts of the country, with significant political pressure to roll-‐out.
In discussions with stakeholders, there was a perception that not enough thought was given to sustainability of the SURE-‐P MCH programme especially in terms of financial management. There was a lack of confidence in activities involving the transfer of cash incentives.

52
The project would possibly have achieved greater success if it had been more independent and spared from innocuous reporting arrangements. The results above demonstrate its success both in achieving its objectives and increasing the expectation of quality care in maternal services in Nigeria.

53
6.0 RECOMMENDATIONS
A strategic decision needs to be taken on whether a vertical intervention addressing a specific important indicator such as high maternal mortality is still appropriate or whether a broader strengthening of the primary health care system will be a better approach. This decision will guide other recommendations following this evaluation.
The recent signing of the National Health Act 2014 by President Goodluck Jonathan provides an opportunity for broad-‐based improvement in PHC. The Act establishes for the first time, the Basic Health Care Provision Fund – a federal government annual grant of not less than one percent of consolidated revenue fund plus foreign grants and funds from other sources. Fifty percent of the fund is to be used for basic minimum package of health in eligible primary and secondary centres via the National Health Insurance Scheme (NHIS). NHIS established under Act 35 of 1999 has the responsibility of providing easy access to healthcare for all Nigerians at an affordable cost through various prepayment systems5. Perhaps, it is time to review how effective NHIS has been and explore means of supporting the agency to provide universal health coverage through models of community based health insurance schemes to as many Nigerians as possible.
If a decision is taken to continue the SURE-‐P MCH programme then we propose the following changes:
1. Secure independent project management capacity with clearer reporting lines to manage the project with clearly articulated milestones and deliverables based on measurable indicators.
2. An intense focus on performance management using data generated from the programme. 3. States could be given an up-‐front bulk amount to support the implementation of their responsibilities under
the MoU, but all future disbursements be based on their provision of counterpart funding. 4. The regularity of salaries and benefits to the midwives will have to be improved if the expected outcomes of
the programme are to be achieved. 5. Strengthen the involvement of the state, local governments and ward development committees in the
supervision of contractors that provide services and commodities to health facilities. 6. Consider re-‐allocating funds meant for CCT to meet other needs of the project such as reaching more
women by adding other facilities to the network of SURE-‐P MCH health facilities. 7. Consider expanding the Village Health Worker scheme as a key initiative to improve the demand for use of
PHCs. 8. A maintenance unit may be required to ensure the constant functioning of infrastructure improvements
especially boreholes. 9. Further horizontal integration into the broader PHC ecosystem, especially given the strengthening of Primary
Healthcare Development Boards. 10. Intensive associated public enlightenment on the benefits of the SURE-‐P MCH programme to the clients.
5 Welcome to NHIS Website. Available from http://www.nhis.gov.ng/ [accessed on May 06, 2015]

54
REFERENCES
1. Robertson L, Mushati P, Eaton JW, Dumba L, Mavise G, Makoni J, et al. Effects of unconditional and conditional cash transfers on child health and development in Zimbabwe: a cluster-‐randomised trial. Lancet. 2013 Apr 13;381(9874):1283-‐92.
2. UNICEF. Maternal and child health2015.
3. National Population Commission. NIGERIA DEMOGRAPHIC AND HEALTH SURVEY. Abuja2013.
4. Babalola S, Fatusi A. Determinants of use of maternal health services in Nigeria-‐-‐looking beyond individual and household factors. BMC Pregnancy Childbirth. 2009;9:43.
5. Maternal Health: Indicators & Statistics. MATERNAL HEALTH IN NIGERIA2015.
6. Harrison KA. Maternal mortality in Nigeria: the real issues. Afr J Reprod Health. 1997 Mar;1(1):7-‐13.
7. Chigozie JU, Ndukwe CD, Abel AE, Urochukwu HC, Ezeonu. Improving maternal and child healthcare programme using community-‐participatory interventions in Ebonyi State Nigeria.. . Int J Health Policy Manag. 2014;3(5):283–7.
8. Ordinioha B, Seiyefa B. Improving skilled attendants at birth: Experience in a primary health care facility in Rivers State, South-‐South Nigeria. . JOURNAL OF COMMUNITY MEDICINE AND PRIMARY HEALTH CARE. 2013; 25(2):59-‐66.
9. Abimbola S, Okoli U, Olubajo O, Abdullahi MJ, Pate MA. The midwives service scheme in Nigeria. PLoS Med. 2012;9(5):e1001211.
10. Harrison KA. The struggle to reduce high maternal mortality in Nigeria. Afr J Reprod Health. 2009 Sep;13(3):9-‐20.
11. Archibong EI, Agan TU. Review of Policies and Programs for Reducing Maternal Mortality and Promoting Maternal Health in Cross River State, Nigeria. . Afri J Reprod Health. 2010;14(3):37.
12. UNFPA. Ebonyi State Mother and Child Care Initiative (MCCI) Nigeria2010.
13. Uzo C, Nnebue C, Ebenebe E, Adogu P, Adinma ED, Ifeadike CO, et al. Adequacy of resources for provision of maternal health services at the primary health care level in Nnewi, Nigeria. Niger Med J. 2014;55 (3):235–41.
14. Lawn JE, Cousens S, Zupan J. 4 million neonatal deaths: when? Where? Why? Lancet. 2005 Mar 5-‐11;365(9462):891-‐900.
15. You D, Jones G, Hill K, Wardlaw T, Chopra M. Levels and trends in child mortality, 1990-‐2009. Lancet. 2010 Sep 18;376(9745):931-‐3.
16. Souza JP, Gulmezoglu AM, Vogel J, Carroli G, Lumbiganon P, Qureshi Z, et al. Moving beyond essential interventions for reduction of maternal mortality (the WHO Multicountry Survey on Maternal and Newborn Health): a cross-‐sectional study. Lancet. 2013 May 18;381(9879):1747-‐55.
17. SILVIA P, REKHA M, ASLIHAN K, CHARLES A. Targeting Poverty and Gender Inequality to Improve Maternal Health. . Womendeliver 2015.
18. Mwaikambo L, Speizer IS, Schurmann A, Morgan G, Fikree F. What works in family planning interventions: a systematic review. Stud Fam Plann. 2011 Jun;42(2):67-‐82.
19. Ensor T, Cooper S. Overcoming barriers to health service access: influencing the demand side. Health Policy Plan. 2004 Mar;19(2):69-‐79.
20. Glassman A, Duran D, Fleisher L, Singer D, Sturke R, Angeles G, et al. Impact of conditional cash transfers on maternal and newborn health. J Health Popul Nutr. 2013 Dec;31(4 Suppl 2):48-‐66.
21. About SURE-‐P Available from: http://surepmch.org/sp_about.php


