DCU Fouling of a Double Pipe Heat Exchanger By Antonio Llinares Fontdevila Thesis presented at Dublin City University in fulfilment of the requirements for the Degree of Master of Engineering Under the Supervision of Dr. Brian G. Corcoran School of Mechanical and Manufacturing Engineering Dublin City University Ireland August 2004
Transcript
DCUFouling of a Double Pipe Heat
Exchanger
By
Antonio Llinares Fontdevila
Thesis presented at Dublin City University in fulfilment of the requirements for the
Degree of Master of Engineering
Under the Supervision of Dr. Brian G. Corcoran
School of Mechanical and ManufacturingEngineering
Dublin City University Ireland
August 2004
Declaration
I hereby certify that the material, which I now subm it for assessm ent on
the program m e o f study leading to the award o f Degree o f M aster o f
Engineering, is entirely my own work and has not been taken from the
work o f others save and to the extent that such work has been cited and
acknowledged within the text o f my work.
Signed:
ID No: z u m z o
Date:
I
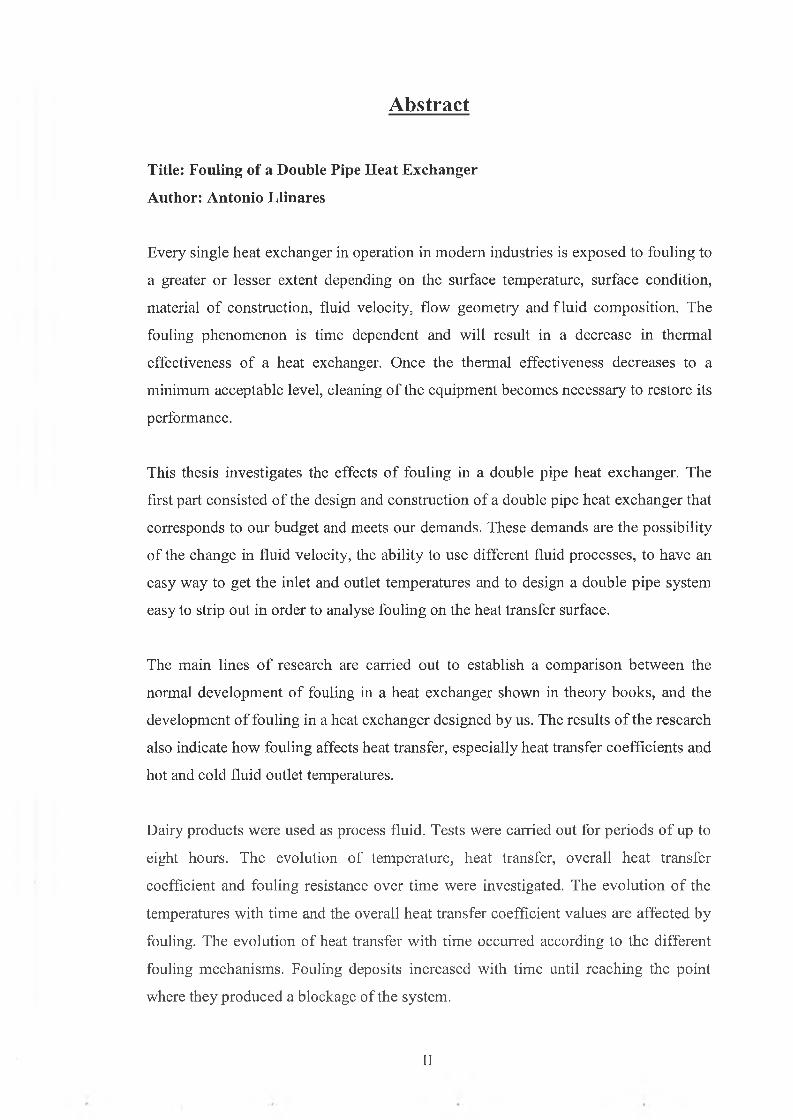
A bstract
Title: Fouling of a Double Pipe Heat Exchanger
Author: Antonio Llinares
E very single heat exchanger in operation in m odern industries is exposed to fouling to
a greater o r lesser ex ten t depending on the su rface tem perature, surface condition,
m aterial o f construction , flu id velocity , flow geom etry and f lu id com position . T he
fouling phenom enon is tim e dependent and w ill result in a decrease in therm al
effectiveness o f a heat exchanger. O nce the therm al effectiveness decreases to a
m inim um acceptab le level, cleaning o f the equipm ent becom es necessary to resto re its
perform ance.
This thesis investigates the effects o f fouling in a double pipe heat exchanger. The
first part consisted o f the design and construction o f a double p ipe heat exchanger that
corresponds to o u r budget and m eets ou r dem ands. T hese dem ands are the possib ility
o f the change in flu id velocity , the ab ility to use different fluid processes, to have an
easy w ay to get the inlet and outlet tem pera tu res and to design a double p ipe system
easy to strip out in order to analyse fou ling on the heat transfer surface.
The m ain lines o f research are carried out to establish a com parison betw een the
norm al developm ent o f fouling in a heat exchanger show n in theo ry books, and the
developm ent o f fou ling in a heat exchanger designed by us. T he resu lts o f the research
also indicate how fouling affects heat transfer, especially heat transfer coeffic ien ts and
hot and cold flu id outle t tem peratures.
D airy products w ere used as process fluid. T ests w ere carried out for periods o f up to
eight hours. T he evolution o f tem perature, heat transfer, overall h ea t transfer
coefficient and fou ling resistance over tim e w ere investigated. The evo lu tion o f the
tem peratures w ith tim e and the overall hea t transfer coefficient values are affected by
fouling. T he evolu tion o f heat transfer w ith tim e occurred according to the d ifferen t
fouling m echanism s. Fouling deposits increased w ith tim e until reach ing the point
Antonio Llinares Fontdevila. Fouling o f a double pipe heat exchanger for Dublin City
University 7Ih Annual Sir Bernard Crossland symposium and Postgraduate research
workshop. March 30 & 31, 2004 at Dublin City University.
IV
Table of ContentsTable o f Contents....................................................................................................................... 1
Table o f Figures, Tables and Photos.......................................................................................4
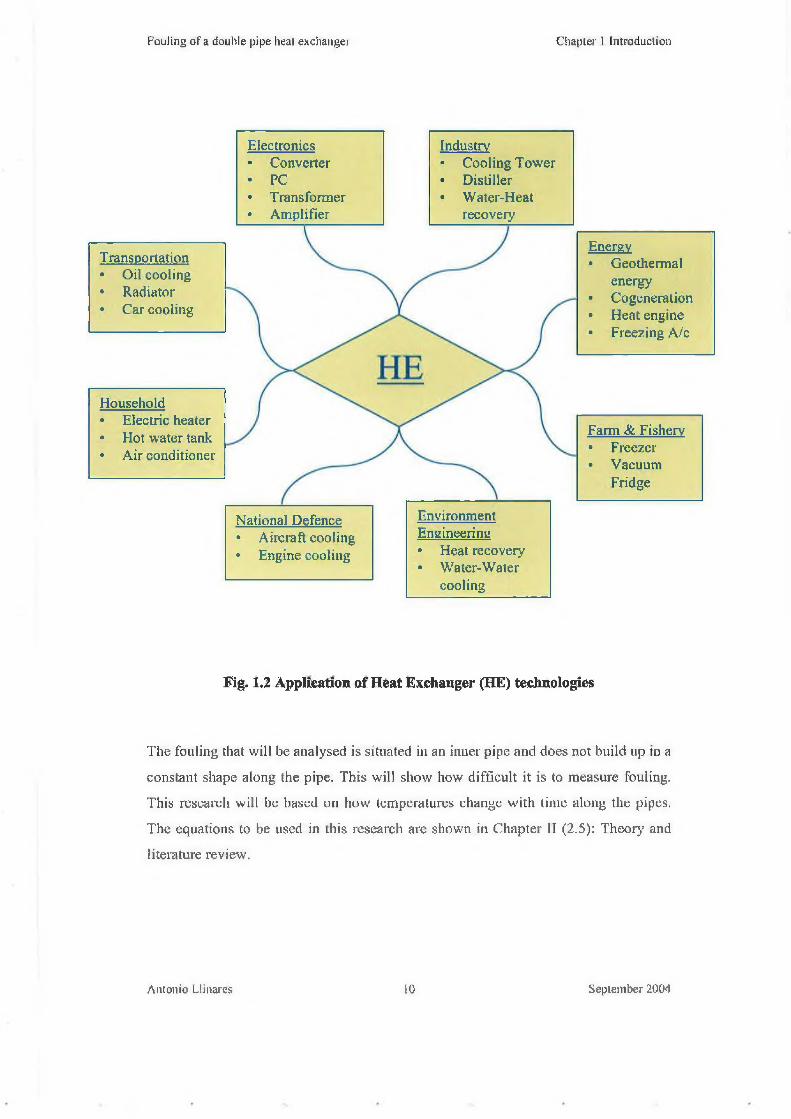
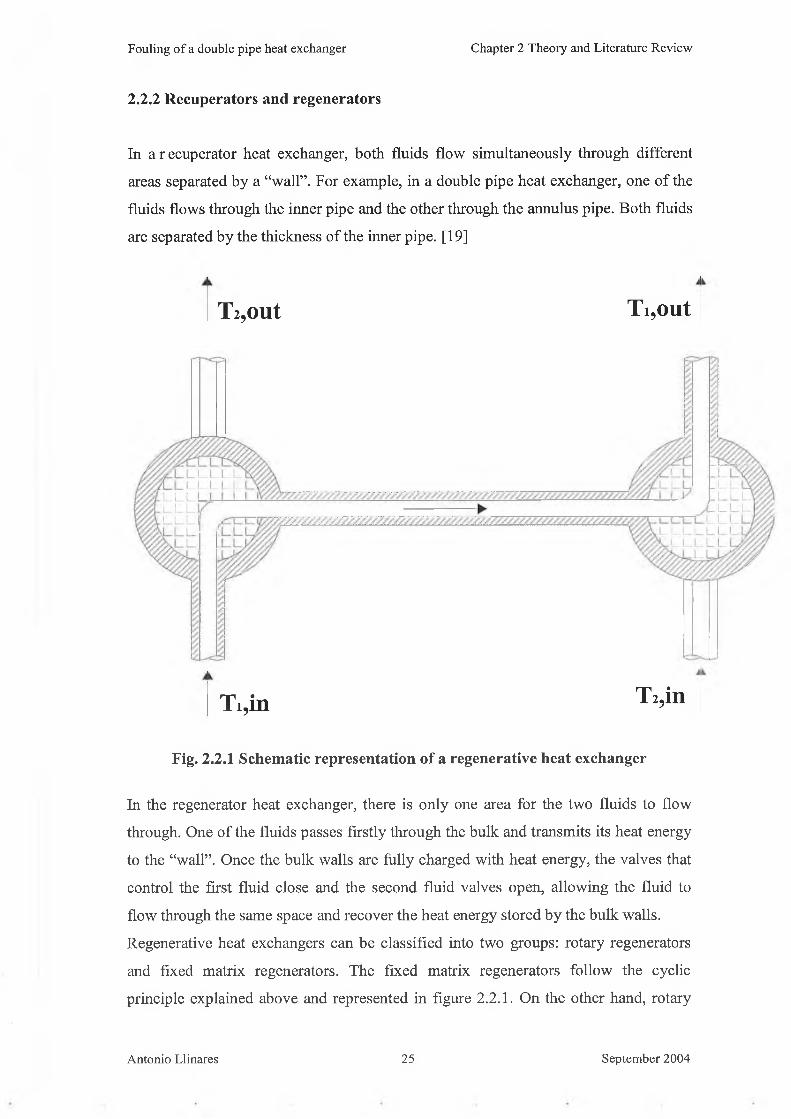
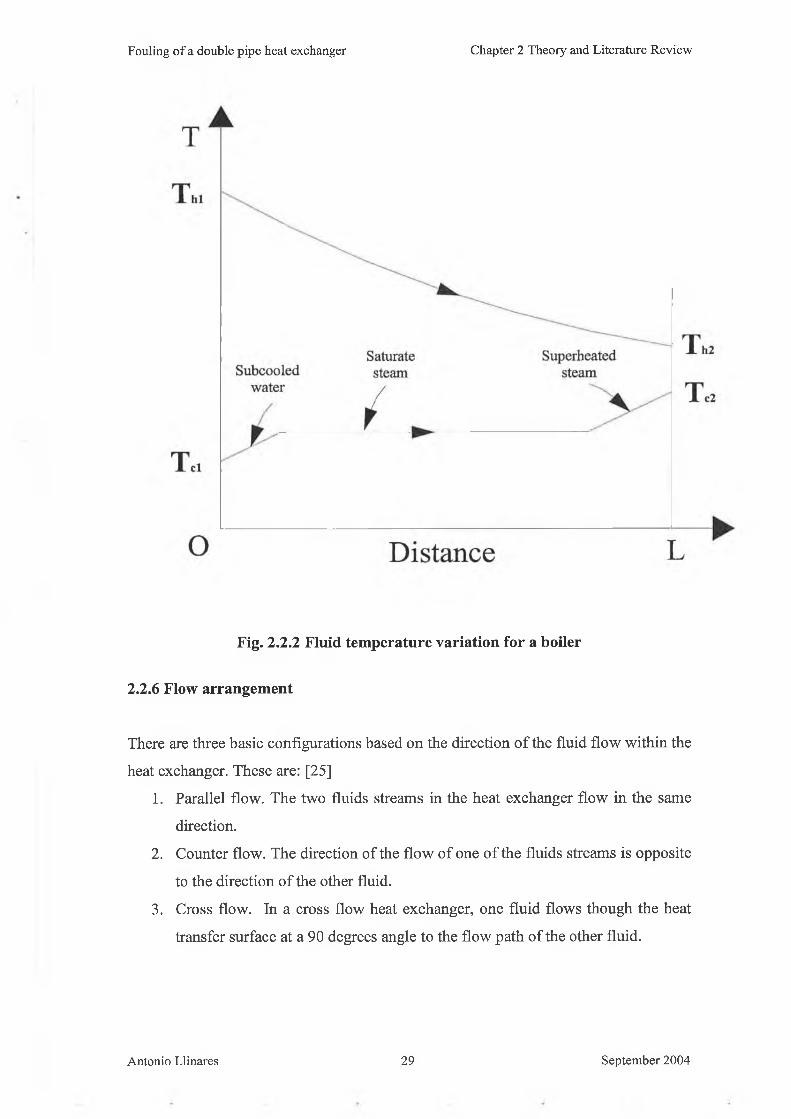
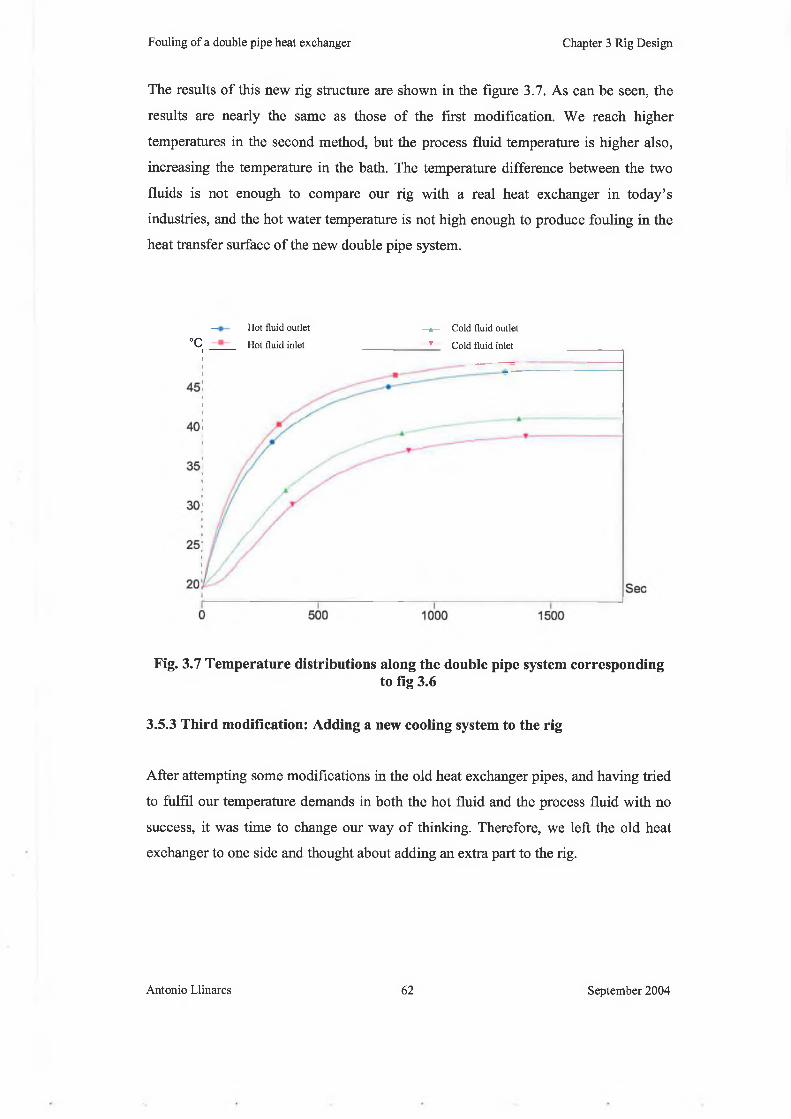
The most common arrangements for a heat exchanger are parallel flow and counter
flow. See figure 2.1.2. The main difference between the flow arrangements is the
temperature distribution along the pipes of the heat exchanger, and therefore the heat
transfer. If we compare heat transfer and the overall effectiveness in a counter flow
and parallel flow heat exchanger under given temperatures, the result shows that the
counter flow configuration is better. This is because the more uniform temperature
difference between the two fluids produces a more uniform rate of heat transfer
through the heat exchanger. The outlet temperature of the cold fluid in a counter flow
arrangement can approach the highest temperature of the hot fluid (the inlet
temperature).
Antonio Llinares 30 September 2004
Fouling o f a double pipe heat exchanger Chapter 2 Theory and Literature Review
2.3 Fouling of H eat Exchangers
2.3.1 Introduction
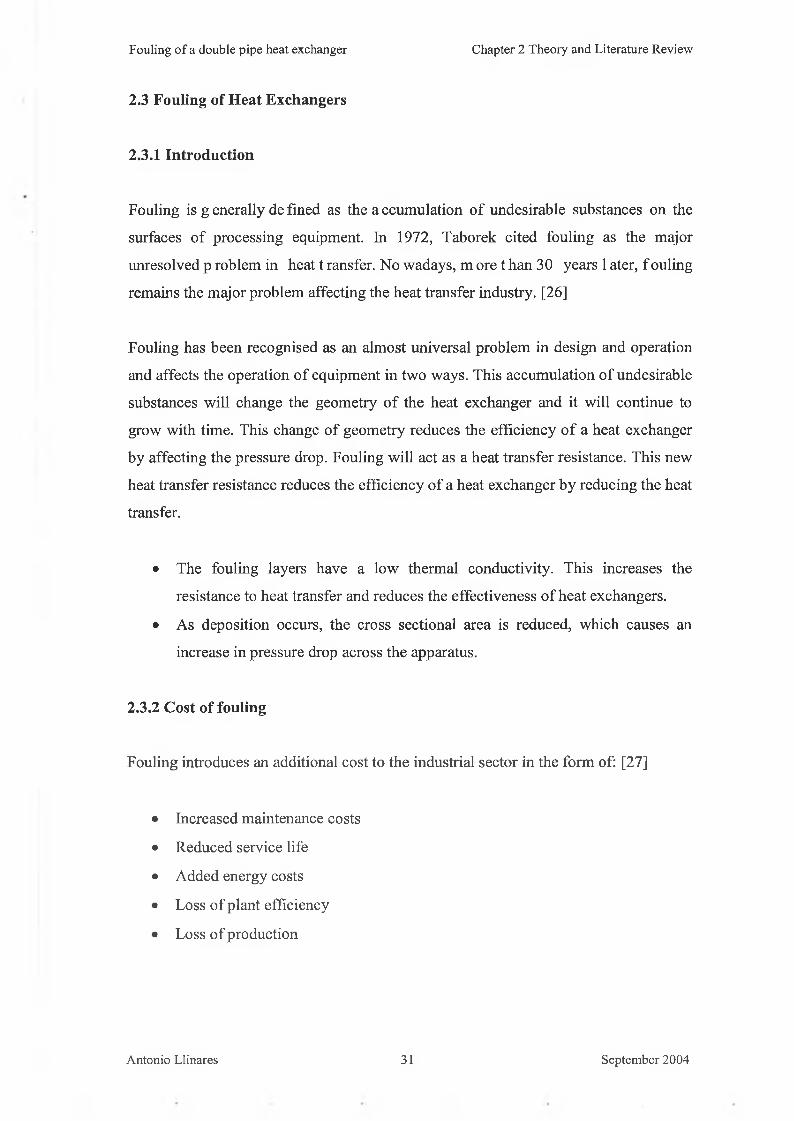
Fouling is g enerally de fined as the a ccumulation o f undesirable substances on the
surfaces o f processing equipment. In 1972, Taborek cited fouling as the major
unresolved p roblem in heat t ransfer. No wadays, m ore t han 30 years 1 ater, f ouling
remains the major problem affecting the heat transfer industry. [26]
Fouling has been recognised as an almost universal problem in design and operation
and affects the operation o f equipment in two ways. This accumulation o f undesirable
substances will change the geometry o f the heat exchanger and it will continue to
grow with time. This change o f geometry reduces the efficiency o f a heat exchanger
by affecting the pressure drop. Fouling will act as a heat transfer resistance. This new
heat transfer resistance reduces the efficiency o f a heat exchanger by reducing the heat
transfer.
• The fouling layers have a low thermal conductivity. This increases the
resistance to heat transfer and reduces the effectiveness o f heat exchangers.
• As deposition occurs, the cross sectional area is reduced, which causes an
increase in pressure drop across the apparatus.
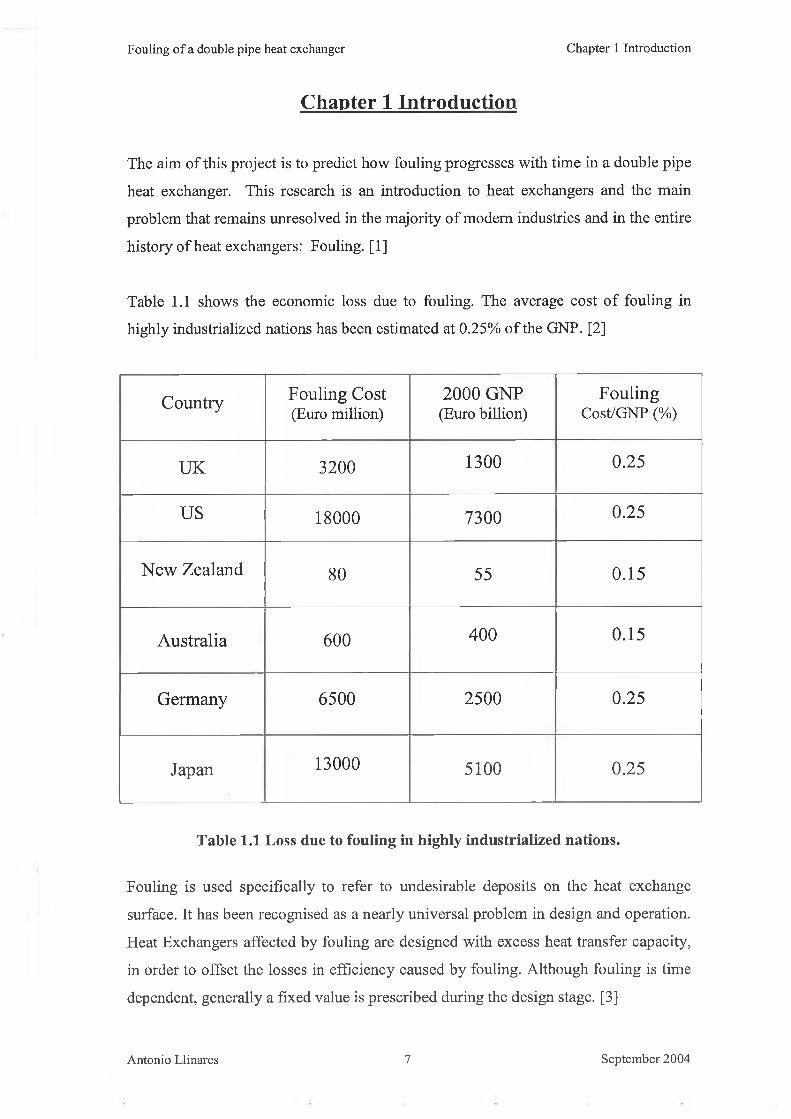
2.3.2 Cost of fouling
Fouling introduces an additional cost to the industrial sector in the form of: [27]
• Increased maintenance costs
• Reduced service life
• Added energy costs
• Loss o f plant efficiency
• Loss o f production
Antonio Llinares 31 September 2004
Fouling of a double pipe heat exchanger Chapter 2 Theory and Literature Review
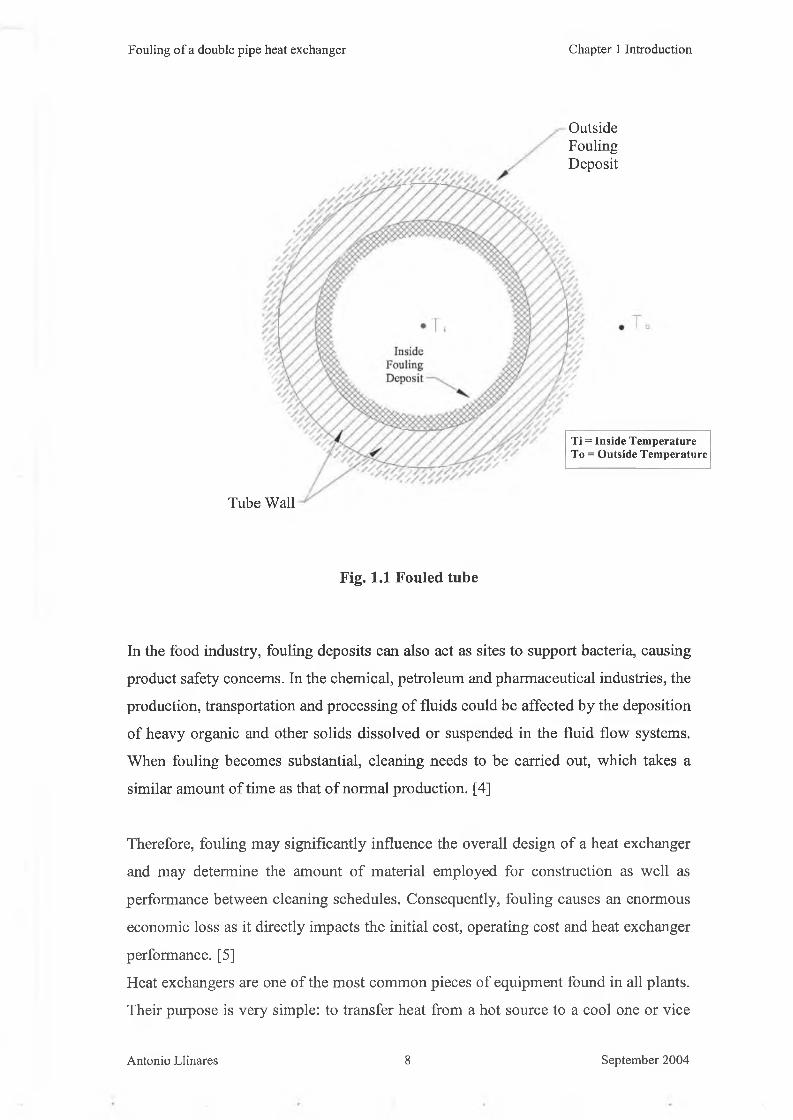
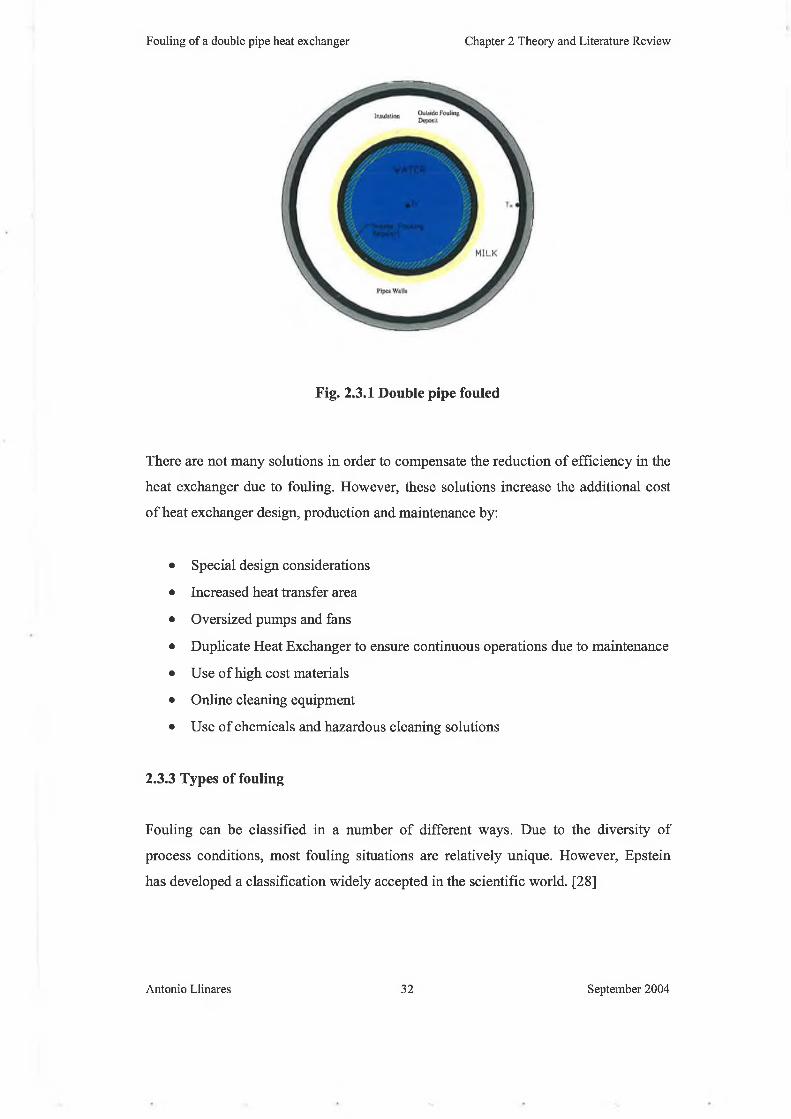
Fig. 2.3.1 Double pipe fouled
There are not many solutions in order to compensate the reduction of efficiency in the
heat exchanger due to fouling. However, these solutions increase the additional cost
of heat exchanger design, production and maintenance by:
• Special design considerations
• Increased heat transfer area
• Oversized pumps and fans
• Duplicate Heat Exchanger to ensure continuous operations due to maintenance
• Use of high cost materials
• Online cleaning equipment
• Use of chemicals and hazardous cleaning solutions
2.3.3 Types of fouling
Fouling can be classified in a number of different ways. Due to the diversity of
process conditions, most fouling situations are relatively unique. However, Epstein
has developed a classification widely accepted in the scientific world. [28]
Antonio Llinares 32 September 2004
According to Epstein, fouling can be classified as:
Fouling o f a double pipe heat exchanger Chapter 2 Theory and Literature Review
• Particulate fouling (sedimentation): is the result o f the accumulation of solid
particles suspended in the process fluid. Sand, chip, and insoluble corrosion
products and many others can be part o f these suspended solids.
• Crystallization fouling (precipitation): is the result o f the accumulation of
dissolved inorganic salts in the fluid streams, producing super saturation when
the fluid is heating. These are inverse solubility salts that precipitate in the
cooling process.
• Corrosion fouling: is caused by surface reaction with fluids to form corrosion
products, which attach to the heat transfer surface to form nucleation sites.
• Biological fouling: the deposition and growth of material o f biological origin.
• Chemical reaction fouling: due to chemical reaction within the process stream.
Chemical reaction fouling is very common in petroleum refining and polymer
production.
• Solidification fouling: due to the formation o f ice or wax.
In most fouling situations there is not just one kind o f fouling, several different types
may be involved. Some o f the fouling processes can complement each other.
2.3.4 F u n d am en ta l processes o f fou ling
Fouling is an extremely complex phenomenon, due to the large number o f variables
that affect it. Again, Epstein gives a sequence o f events referred to as the fouling
mechanisms. These fouling mechanisms are: [29]
1. Initiation or induction. It is the most critical period. The surface material,
temperature, a nd r oughness a nd t he c oncentration a nd v elocity o f t he fluid
stream ha ve a s trong influence in t he init ial de lay, indue tion o r inc ubation
period.
2. Transport. It is the most studied period. This period involves the transport of
fouling substances from the fluid stream to the heat transfer surface. The
Antonio LI i nares 33 September 2004
Fouling o f a double pipe heat exchanger Chapter 2 Theory and Literature Review
transport o f substances can be carried out by a number o f different phenomena
such as diffusion, sedimentation and thermophoseris.
3. Attachment: when the formation o f the deposit begins.
4. Transformation: when physical or chemical changes can increase deposit
accumulation.
5. Removal: depending on the deposit strength, the velocity gradient and the
viscosity o f the fluid and the roughness surface, some fouling materials can be
removed from the surface.
2.3.5 Factors influencing fouling
Fouling can grow in different ways for the same fluids in the same heat exchanger, by
changing some o f the parameters or properties that can be applied in the same heat
exchanger. Some o f the factors that influence the conditions o f fouling are: [30]
1. Operating parameters. If fluids stream velocity, surface temperature and bulk
fluid temperature are changed.
2. Heat Exchanger parameters. If heat exchanger configuration, the surface
material and the surface structure are changed.
3. Fluid parameters. If the viscosity, density and concentration o f the fluid stream
is changed.
2.3.6 Techniques to control fouling
There are various techniques to control and prevent fouling in a heat exchanger. All
fouling control techniques can be divided into two kinds: [31]
1. On line or continuous cleaning. Fouling is removed without the interruption o f
product flow with the use and control o f appropriate additives.
2. Off line or periodic cleaning. Fouling is removed by the disassembly o f the
heat exchanger and by manual cleaning.
Antonio Llinares 34 September 2004
Fouling o f a double pipe heat exchanger C hapter 2 Theory and Literature Review
ON LINE TECHNIQUES OFF LINE TECHNIQUESInhibitors, Antiscalants
Dispursants Liquid jet
Acids, Sponge balls Steam
Brushes,Sonic horns Air jet
Soot blowers Drills
Chains and scrapers Scrapers
Thermal shock Chemical cleaning
Air bumping
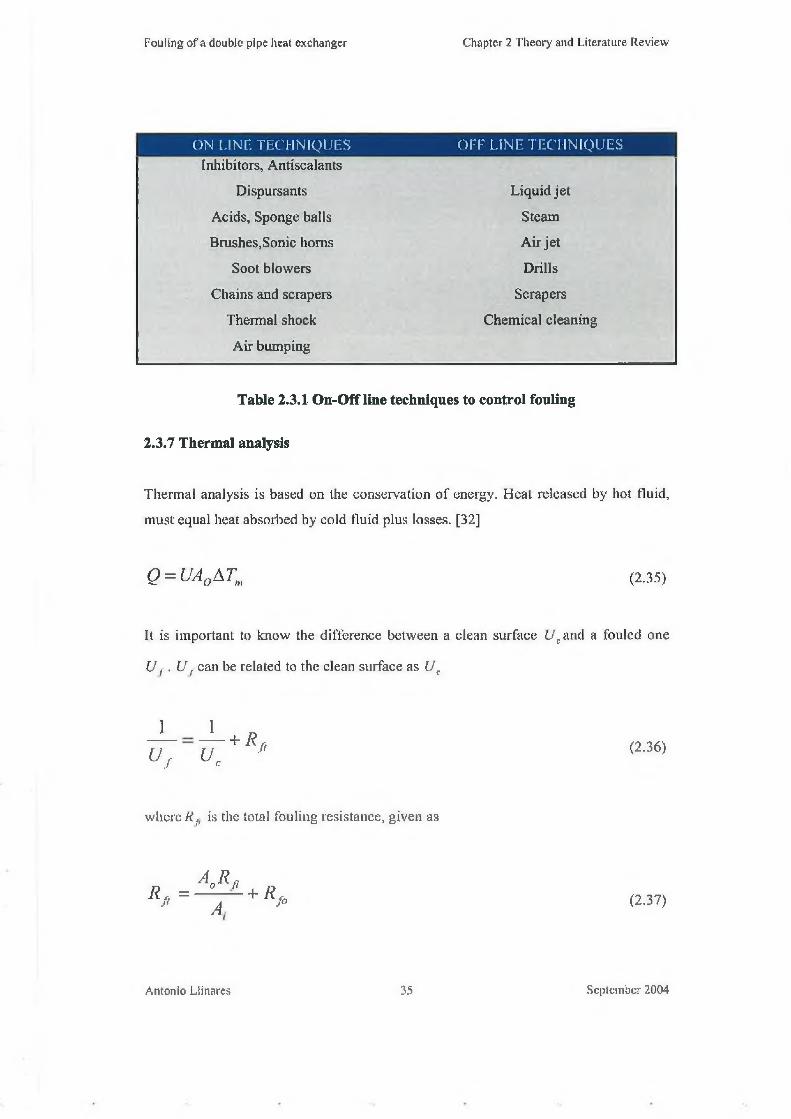
Table 2.3.1 On-Offline techniques to control fouling
2.3.7 Thermal analysis
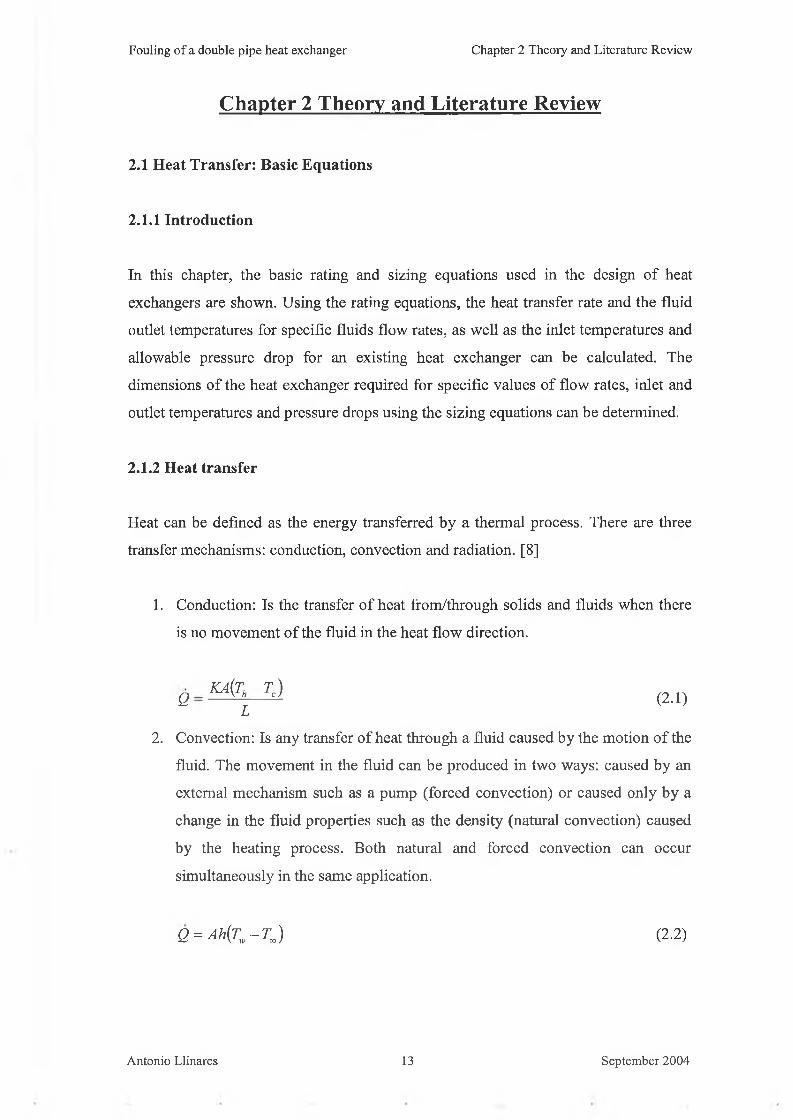
Thermal analysis is based on the conservation o f energy. Heat released by hot fluid,
must equal heat absorbed by cold fluid plus losses. [32]
Q = UA0ATm (2.35)
It is important to know the difference between a clean surface U c and a fouled one
U f . U f can be related to the clean surface as U c
' ' + A .uf uc ft (236)
where R tl is the total fouling resistance, given as
^oR fí nR fl = A + R f0 (2.37)
A ntonio Llinares 35 Septem ber 2004
Fouling o f a double pipe heat exchanger Chapter 2 Theory and Literature Review
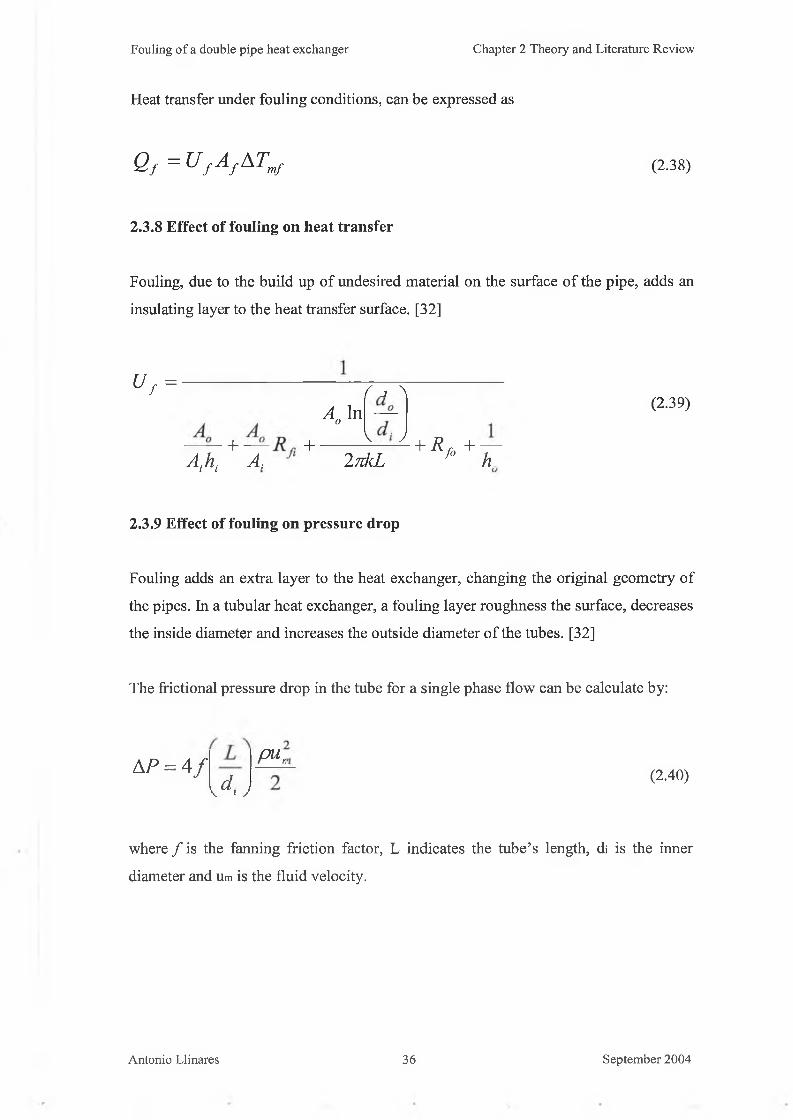
Heat transfer under fouling conditions, can be expressed as
Qf = U f Af \T mf (2.38)
2.3.8 E ffect o f fouling on h ea t tra n s fe r
Fouling, due to the build up o f undesired material on the surface o f the pipe, adds an
insulating layer to the heat transfer surface. [32]
uf =
A,h,
A J n
+ +
f J \
V j
(2.39)
A, InkL + R / ° + t
2.3.9 E ffect o f fouling on p ressu re d rop
Fouling adds an extra layer to the heat exchanger, changing the original geometry of
the pipes. In a tubular heat exchanger, a fouling layer roughness the surface, decreases
the inside diameter and increases the outside diameter o f the tubes. [32]
The frictional pressure drop in the tube for a single phase flow can be calculate by:
AP = 4 fyd, y
pu,(2.40)
where / is the fanning friction factor, L indicates the tube’s length, di is the inner
diameter and u m is the fluid velocity.
Antonio Llinares 36 September 2004
Fouling o f a double pipe heat exchanger Chapter 2 Theory and Literature Review
2.4 Pressure Drop
2.4.1 Introduction
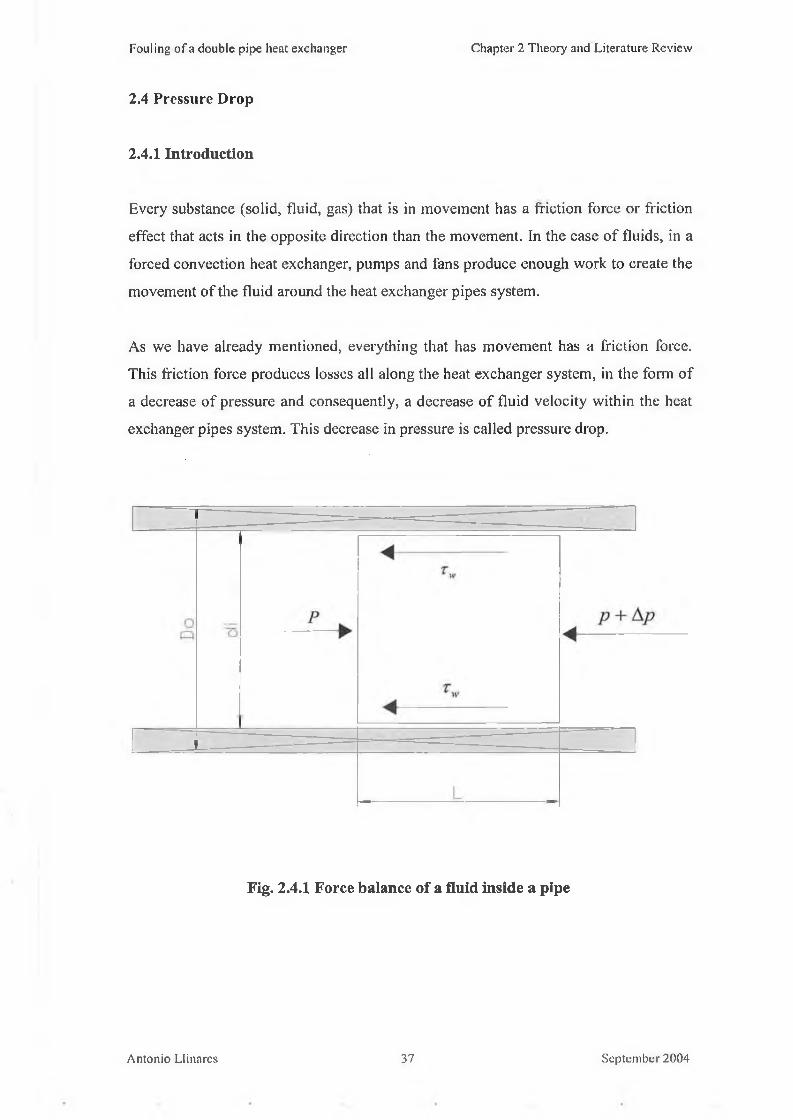
Every substance (solid, fluid, gas) that is in movement has a friction force or friction
effect that acts in the opposite direction than the movement. In the case o f fluids, in a
forced convection heat exchanger, pumps and fans produce enough work to create the
movement o f the fluid around the heat exchanger pipes system.
As we have already mentioned, everything that has movement has a friction force.
This friction force produces losses all along the heat exchanger system, in the form o f
a decrease o f pressure and consequently, a decrease o f fluid velocity within the heat
exchanger pipes system. This decrease in pressure is called pressure drop.
Fig. 2.4.1 Force balance of a fluid inside a pipe
A n ton io L linares 37 S ep tem b er 2004
Fouling o f a double pipe heat exchanger Chapter 2 Theory and Literature Review
To counter the pressure drop, the pumping power or fan work has to be increased, to
maintain a c onstant flow a long t he h eat e xchanger. T herefore, p ressure dr op adds
capital costs and is a major part o f the operating cost o f the heat exchanger. [33]
2.4.2 Circular cross sectional tubes pressure drop
In a fully developed flow in a tube, for either laminar or turbulent flow, the following
functional relationship can be written for the frictional pressure drop. [34]
where e is a statistical measure o f the surface roughness o f the tube and has the
dimension o f length.
It is assumed that Ap is proportional to the length L o f the tube.
where the dimensionless numerical constants 4 and 2 are added for convenience. The
above dimensionless group involving Ap has been defined as the fanning friction
fac to r,/
(2.41)
(2.42)
/ =Ap
(2.43)
therefore
(2.44)
Antonio Llinares 38 September 2004
Fouling o f a double pipe heat exchanger Chapter 2 Theory and Literature Review
The fanning friction factor for a fluid in a laminar flow, circulating within circular
tubes, independent o f the surface roughness, can be simply defined as
2.4.3 Other situations of pressure drop
Pressure drop is a very important factor in the heat exchanger industry and can have a
huge impact on a heat exchanger design. However, in this research, the pressure drop
is not important, it takes second place. This is because the calculations o f Rf
(fouling) are based on the temperatures along the heat transfer surface o f the heat
exchanger. Rf is calculated from three basic equations: The value o f heat transfer, Q,
the overall heat transfer coefficient, U, and the log mean temperature difference, ATm .
In these three equations, the pressure drop does not affect the outcome.
I have explained pressure drop in a circular cross sectional duct in a previous point in
this chapter, because the main geometries o f my heat exchanger are circular pipes. I
have shown the basic equations and correlations. However, we are not going to use
any of these equations in the calculation o f R f . Although studying pressure drop in
relation to fouling could be o f major interest in our project, the materials used in the
heat exchanger fittings make it very complicated. Instead o f using straight hard pipes,
such as copper or aluminium pipes, we are using pieces o f hose to connect all the rig
parts. Hoses can take any particular shape and change shape with temperature. This
makes the calculation o f the pressure drop in our rig very complicated.
Therefore, I will explain some cases where pressure drop can appear but I will not
include any equations or correlations to calculate any other kind of pressure drop. It is
obvious that there will be a pressure drop in non-circular sectional tubes (not
geometrically similar to a circular duct).
Antonio Llinares 39 September 2004
Fouling o f a double pipe heat exchanger Chapter 2 Theory and Literature Review
The fluid friction effect is very common in circular tube bundles (one o f the most
common heat transfer surfaces) especially in shell and tube heat exchangers.
Pressure dr op a Iso t akes p lace in he lical a nd s piral c oils. T hese a re curved p ipes,
which are used as curved tube heat exchangers in various applications, such as dairy
and food processing, refrigeration and air conditioning industries. Experimental and
theoretical studies show that coiled tube friction factors are higher than those in a
straight tube. [35]
One more example o f friction within a heat exchanger is the pressure drop in bends
and fittings. Bends are used in heat exchanger piping circuits and in turbulent heat
exchangers. Fittings are components used in a heat exchanger system that connect two
or more pieces o f pipe together. The main uses o f fittings are to control the flow in
angle valves, gate valves or check valves fittings.
The last example o f pressure drop in heat exchangers appears when fluids can
experience a sudden contraction followed by a sudden enlargement, when flowing in
and out o f a heat exchanger core. Therefore, pressure drop takes place when abrupt
contraction, expansion and momentum changes appear across a heat exchanger pipes
system.
2.4.4 Pumping power relationship
The fluid pumping power is proportional to the pressure drop in the fluid across a heat
exchanger. In the design o f heat exchangers involving high-density fluids, the
pumping power requirement is quite small in relation to the heat transfer, and, thus,
the pressure drop has hardly any influence on the design. However, for gases and low-
density fluids and very high viscosity fluids, pressure drops are always o f equal
importance to the heat transfer rate and have a strong influence on the design o f heat
exchangers. [36]
Antonio Llinares 40 September 2004
Fouling of a double pipe heat exchanger Chapter 2 Theory and Literature Review
2.5 Double Pipe H eat Exchanger
2.5.1 Introduction
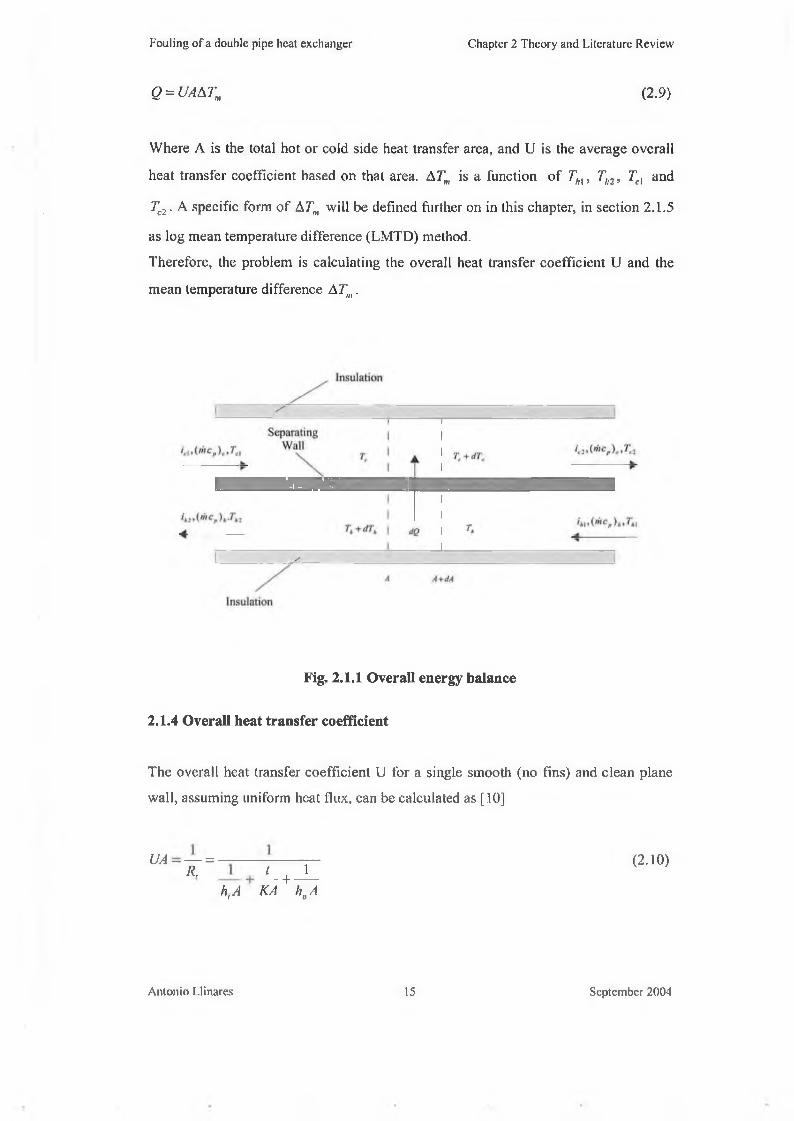
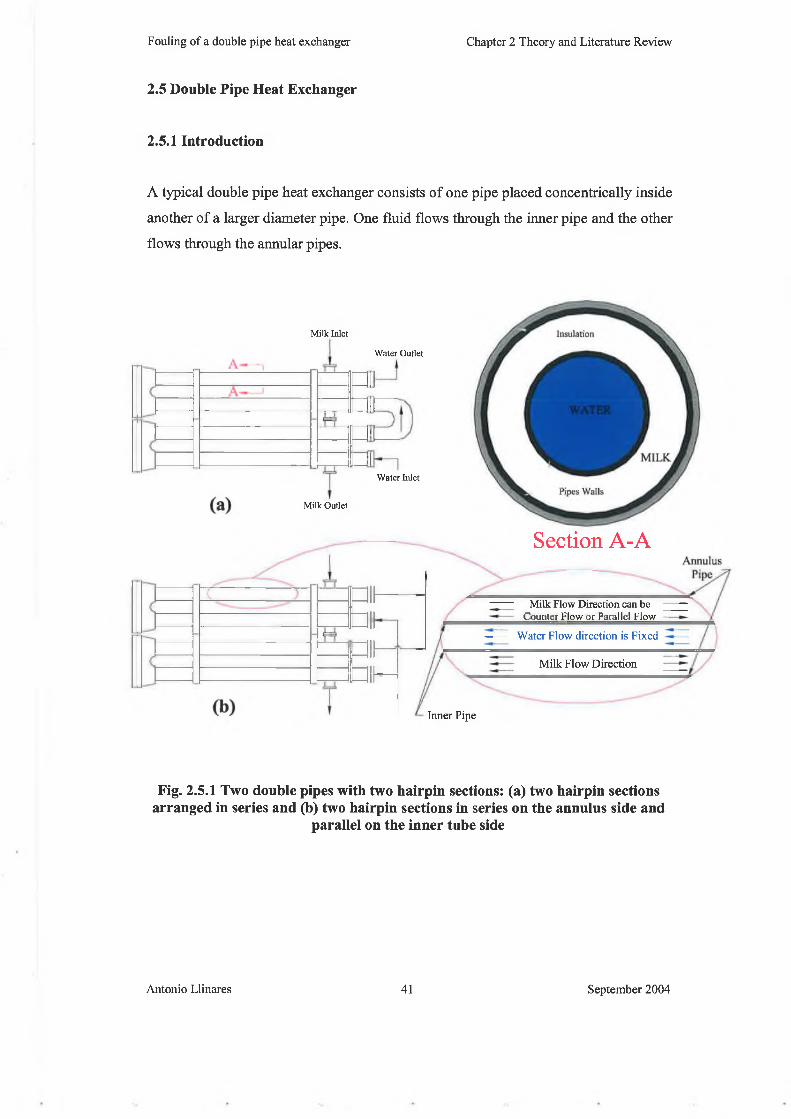
A typical double pipe heat exchanger consists of one pipe placed concentrically inside
another of a larger diameter pipe. One fluid flows through the inner pipe and the other
flows through the annular pipes.
Section A -A
M ilk Flow D irection can be Counter Flow or Parallel Flow
Water Flow direction is Fixed
Milk Flow Direction
M ilk Inlet
W ater Outlet
W ater Inlet
M ilk Outlet
Inner Pipe
Fig. 2.5.1 Two double pipes with two hairpin sections: (a) two hairpin sections arranged in series and (b) two hairpin sections in series on the annulus side and
parallel on the inner tube side
Antonio Llinares 41 September 2004
Fouling o f a double pipe heat exchanger Chapter 2 Theory and Literature Review
D ouble pipe heat exchangers are also called hairpin heat exchangers. The inner pipes
are connected by U-shaped return bends and the annulus pipes are connected by
special fittings as figure 2.5.1 shows. Different hairpin arrangements (in series and
parallel) can be used to increase the heat transfer along the heat exchanger by
increasing the heat transfer area.
The major use o f double pipe heat exchangers is for sensible heating or cooling o f
fluids where small heat transfer areas are required. The major drawback is that they
are volum inous and expensive per unit o f heat transfer surface area. This second
drawback is due to the U-shaped return bends, where there is no heat transfer area
between fluids. The pressure drops and the friction o f the fluids increases
considerably.
Double pipe heat exchangers can be used as counter flow or parallel flow
arrangements. H owever it is demonstrated in several theory books that the largest heat
transfer between fluids occurs in the counter flow arrangements. [37]
2.5.2 Thermal analysis
The thermal design in a double pipe heat exchanger has to be divided into two
different parts: [38]
1. The first one w ill be the thermal and hydraulic analysis o f the inner pipe.
2. The second w ill be the thermal and hydraulic analysis o f the annulus pipe.
Som e correlations used in the thermal and hydraulic analysis o f the inner and annulus
pipe w ill be shown. The main function o f these correlations is to calculate the heat
transfer coefficients.
The thermal and hydraulic analysis shown in the fo llow ing points, w ill give the
correlations and equations used to calculate the main values (heat transfer, overall
heat transfer coefficient and so on) that this thesis requires.
Antonio Llinares 42 September 2004
Fouling of a double pipe heat exchanger Chapter 2 Theory and Literature Review
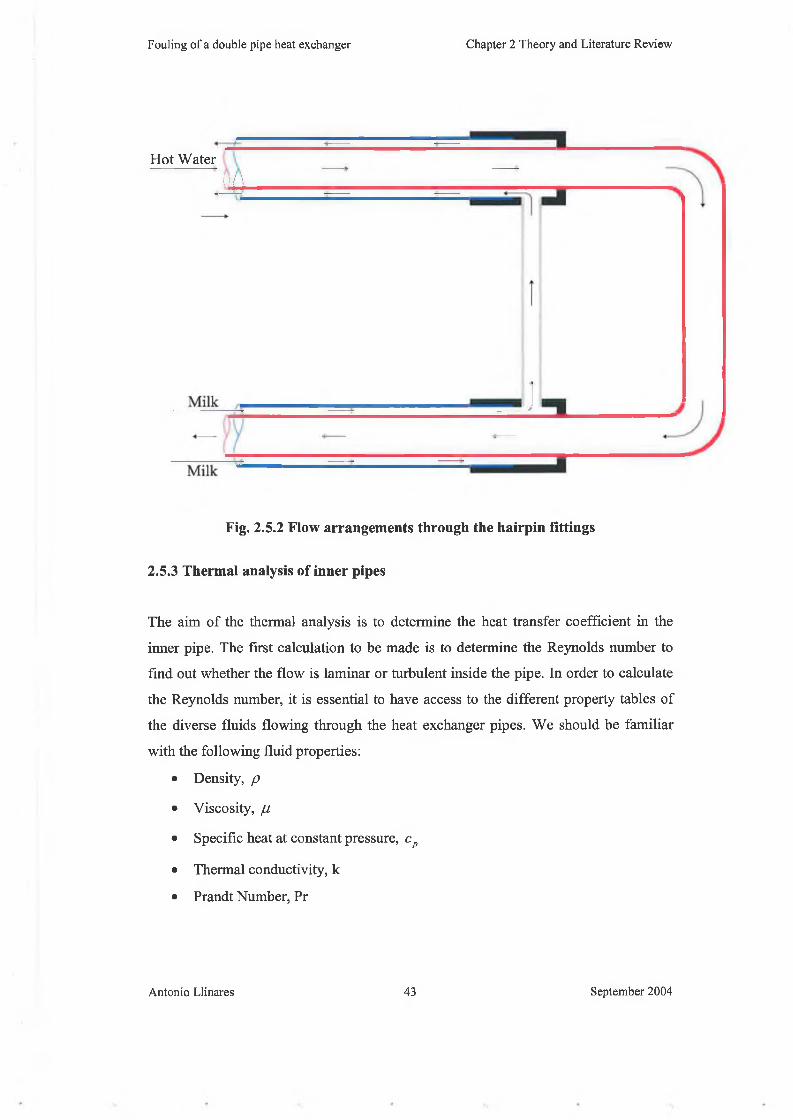
Hot WaterMY
Fig. 2.5.2 Flow arrangements through the hairpin fittings
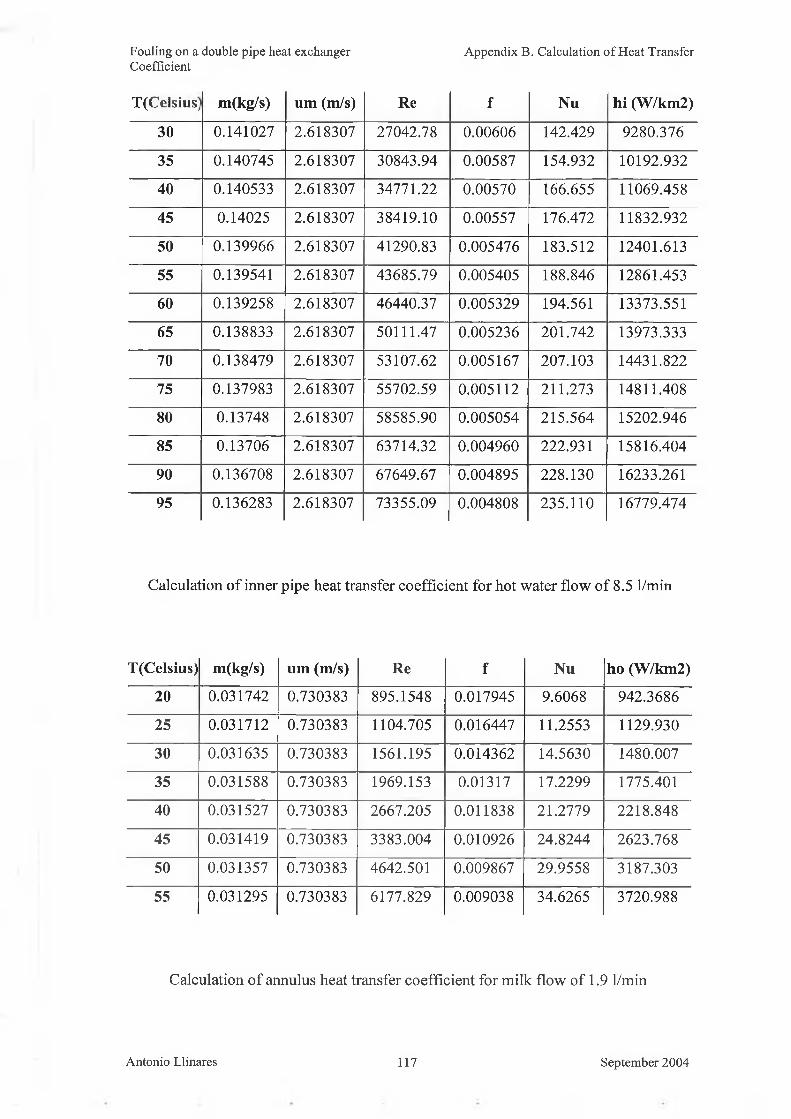
2.5.3 Thermal analysis of inner pipes
The aim o f the thermal analysis is to determine the heat transfer coefficient in the
inner pipe. The first calculation to be made is to determine the Reynolds number to
find out whether the flow is laminar or turbulent inside the pipe. In order to calculate
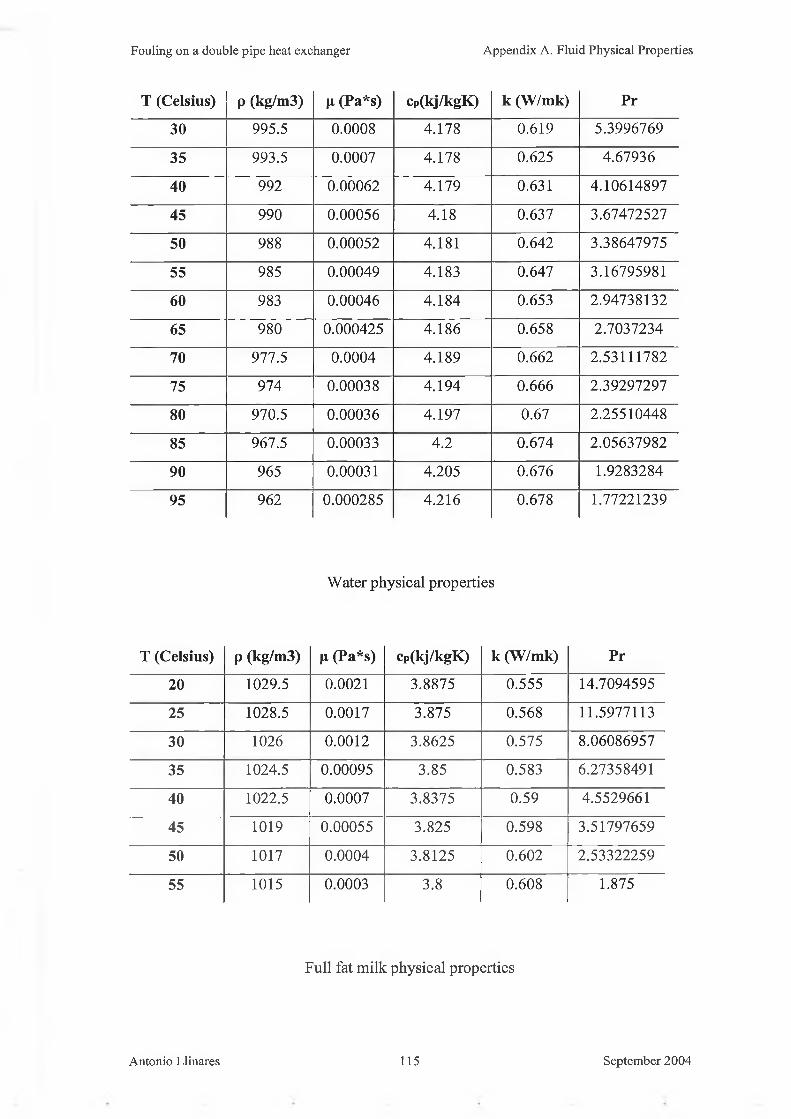
the Reynolds number, it is essential to have access to the different property tables o f
the diverse fluids flowing through the heat exchanger pipes. We should be familiar
with the following fluid properties:
• Density, p
• Viscosity, fl
• Specific heat at constant pressure, c p
• Thermal conductivity, k
• Prandt Number, Pr
Antonio Llinares 43 September 2004
Fouling o f a double pipe heat exchanger Chapter 2 Theory and Literature Review
T he next step is to calculate the fluid m ass flow rate. T o do that, we use equations
(2.7) and (2.8) from C hapter 2.1:
O nce w e discover the fluid m ass flow rate, w e m ust calcu late the fluid velocity. The
next fluid velocity equation is only applicable for flu ids flow ing through straight
pipes.
T herefore, the Reynolds num ber can be calcu lated from equation 2.27 fo r fluids
flow ing through straight pipes as
n npdi
The follow ing equation is taken from correlations show n in references. It is used if the
flow is lam inar. [39]
(2.46)
(2.47)
range o f v a lid ity is Pebd /L > 102 (2.50)
Nu„ = 4.36 range o f v a lid ity is Pebd /L > 1 0 (2.51)
T he range o f validity is 0.5 < Pr6 < 500 and Pehd¡L > 103 w here
Pe„ = (R eP r), (2.52)
Antonio Llinares 44 September 2004
Fouling o f a double pipe heat exchanger Chapter 2 Theory and Literature Review
If, on the other hand, the fluid is turbulent, a correlation selected from the references
w ill be used. In this case [40]
Where the fanning friction factor based on correlations from the references is [4]
Therefore
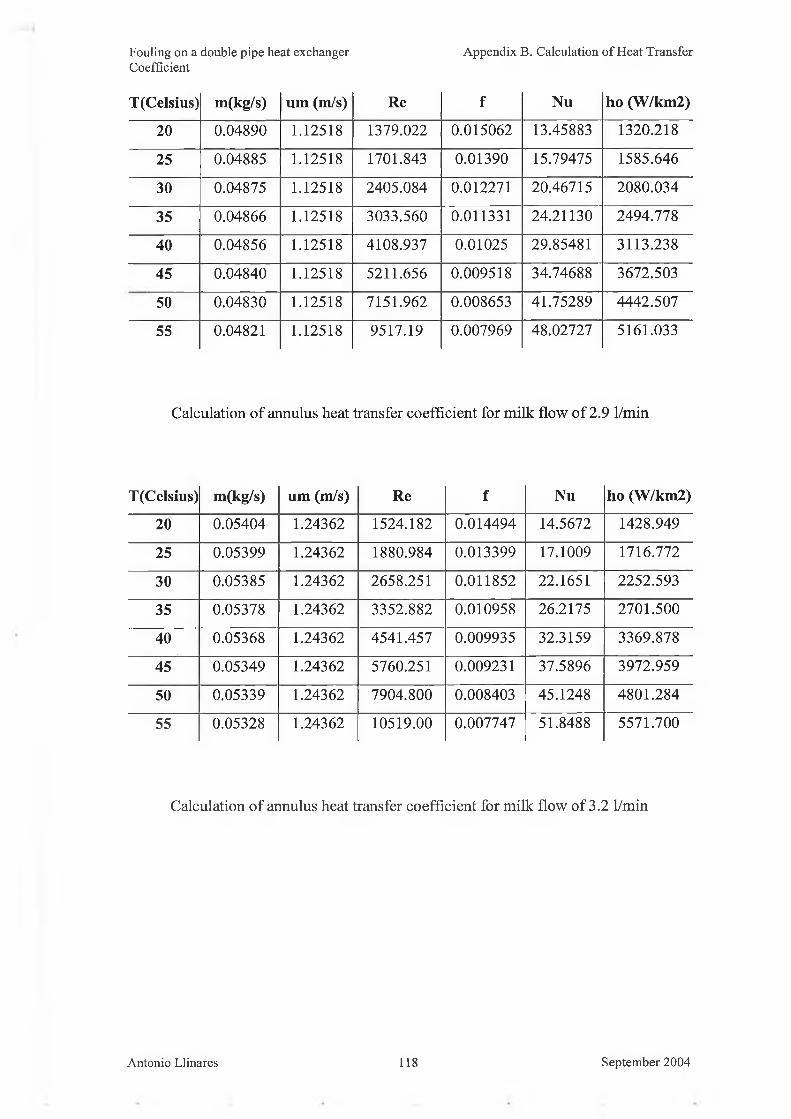
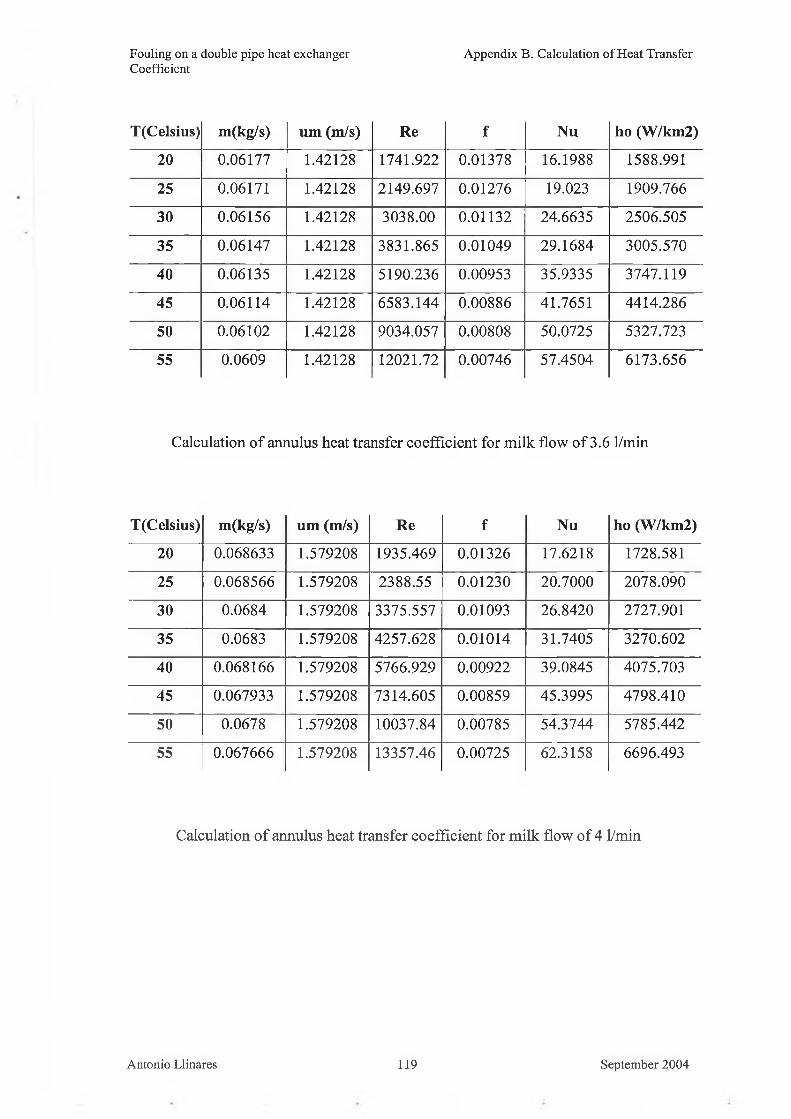
2.5.4 Thermal analysis of annulus pipes
The path to fo llow in the calculations o f the thermal analysis o f annulus pipes is the
same one used in the thermal analysis o f inner pipes. The on ly changes are the
equations taken from previous chapters and the correlations taken from the references.
Once again w e need the fo llow ing property values o f the fluids: density, p , v iscosity,
H , specific heat at constant pressure, c p , thermal conductivity, k and Prandt number,
Pr. The same equations as point 2.5.3 are used to calculate the heat transfer, Q, and
the fluid m ass flow rate m h c .
H owever, everything else changes. The equations associated with the Reynolds
number, the fanning friction factor and the heat transfer coefficient are different.
N u (2.53)
/ = ( l.5 8 1 n R e -3 .2 8 )-2 (2.54)
Antonio Llinares 45 September 2004
Fouling o f a double pipe heat exchanger Chapter 2 Theory and Literature Review
Firstly, the R eynolds num ber has to be determ ined, ju s t as for the therm al analysis o f
inner pipes w as done.
ni„Um =
Pl,Ac(2.56)
4 AD h = ——̂ = D, - d n* p I a
(2.57)
w here Dh represents the hydraulic d iam eter and P w is the w etter perim eter.
Re - P“- 0 - (2.58)
T he follow ing equations based on correla tions from references are used i f the flow is
lam inar [41]
N ut = Num +i d Ì -X '
1 + 0.14 a o
D\ i >
0.191 PebD,/ L,0.8
) .1 1 7 ^1 + 0.1171 PehD,'/ L0.467 (2.59)
W here
Nu„ = 3 .6 6 + 1.2 (2.60)
I f the flow is tu rbu len t, a corre la tion selected from references fo r the N u sse lt num ber
and for the fann ing fric tion factor w ill be used . In th is case the equations to use are
[40]
/ = (3.641gl0(Re„)-3.28)-! (2.61)
Antonio Llinares 46 September 2004
Fouling o f a double pipe heal exchanger Chapter 2 Theory and Literature Review
N u k =
1 + 8.7
(2.62)
T he equivalent d iam eter fo r h ea t tran sfe r is
D f - d 20D . = (2.63)
Therefore
N uhk
k ‘ ~ 5 ~(2.64)
2.5.5 Calculation of heat transfer rate in a double pipe heat exchanger
Basic equations from Chapter 2.1 will be used to calculate the heat transfer together
with the heat transfer coefficient calculated in points 2.5.3 and 2.5.4. These equations
are:
Q - UAATm
6 Q = - ( m c „ ) hdTh = ± { m c p ) c dTe
(2.65)
(2.66)
AT, - AT: L M T D = A T . = 1 2
,m ( A T ^In
A7\
\A T 2 j
(2.67)
2.5.6 Calculation of fouling rate in a double pipe heat exchanger
Basic equations from Chapter 2.1 w ill be used to calculate the fouling together with
the heat transfer coefficient calculated in points 2.5.3 and 2 .5 .4 and the overall heat
Antonio LI ¡nares 47 September 2004
Fouling o f a double pipe heat exchanger Chapter 2 Theory and Literature Review
transfer coefficient, U , calculated in point 2.5.5 with the equation (2.64). The equation
2.5.7 Remarks
The equations shown in this chapter are the ones I am going to use in the calculations
o f the results for this thesis. The double pipe Heat Exchanger situated in the thermo
fluids lab w ill give the hot and cold fluid temperatures along the heat transfer surface.
There are plenty o f references, w hich show the properties values o f the fluids used in
the double pipe heat exchanger for this thesis. H owever, I have given several
references about specific books and I w ill attach graphs and tables relevant to this
consider negligible the value o f fouling due to water, R f i . Therefore, the fouling rate
equation w ill be:
1 l 1 1 r. R , 1R , = (2 .68)
research.
A s regards the calculation o f fouling rates in a double pipe heat exchanger, I w ill
1 = da | d j n j d j d , )(2.69)
U dfr 2k
Antonio Llinares 48 September 2004
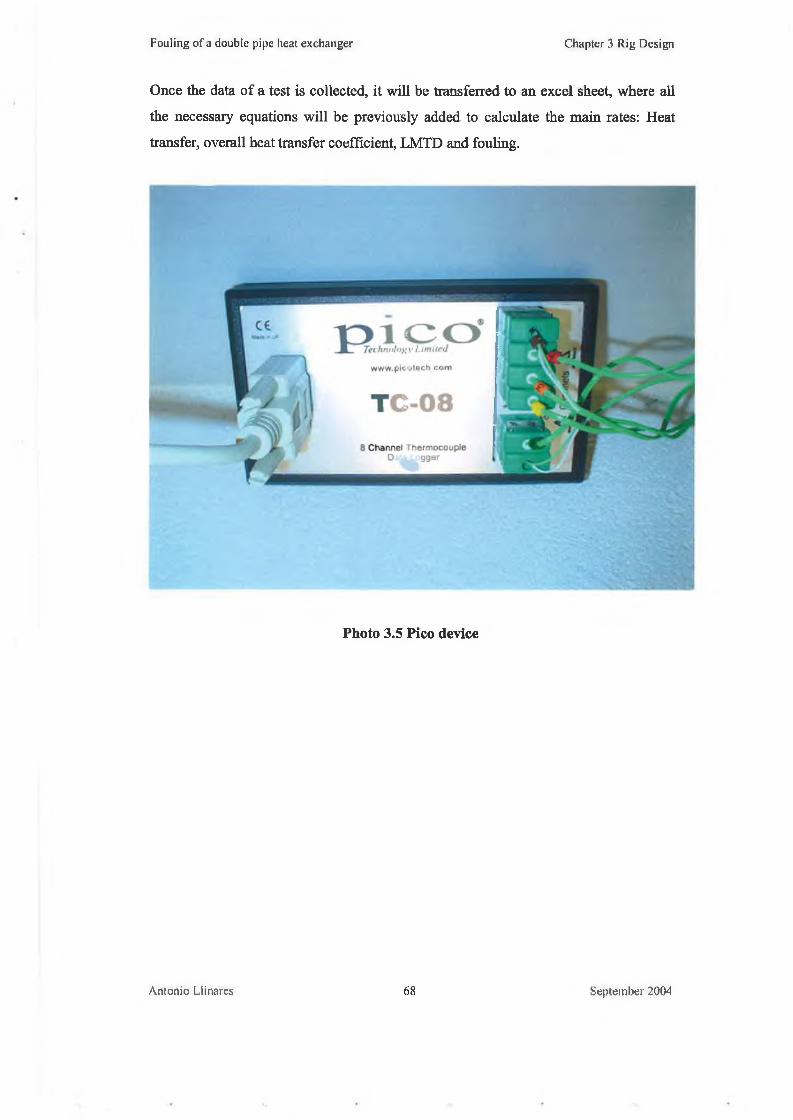
Fouling o f a double pipe heat exchanger Chapter 3 Rig Design
Chapter 3 Rig Design
3.1 Introduction
In order to analyse fouling on the surface o f a double pipe heat exchanger, a special
rig was designed. The design is based on som e preliminary characteristics:
• Easy to access, manage and control.
• Easy to dismantle for cleaning and maintenance purposes.
• Pipe system easily exchangeable to analyse fouling on the heat transfer surface
area.
• Sim plification o f the design as m uch as possib le, due to econom ical
restrictions.
The new rig consists o f a hot water system, a new double pipe system, a process fluid
system, a cooling system and the adequate measurement instrumentation.
3.2 Hot water system
A s m entioned above, one o f the main problems in this rig design is cost. Firstly, w e
have to analyse the devices, instrumentation and facilities that the thermo fluids lab
already possesses. One o f these devices is an old water-water turbulent flow double
pipe Heat Exchanger part o f an undergraduate laboratory. There is one part o f this
heat exchanger that can be taken advantage of: The Hot Water System. [42]
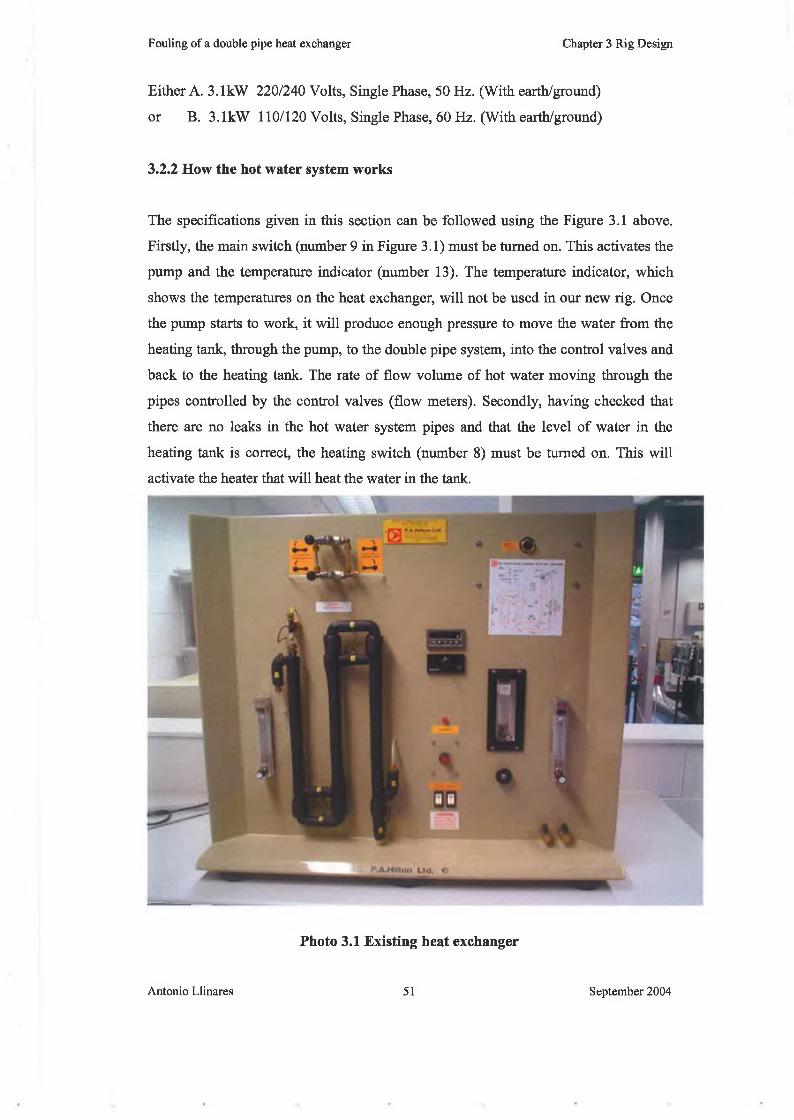
3.2.1 Hot water system specifications
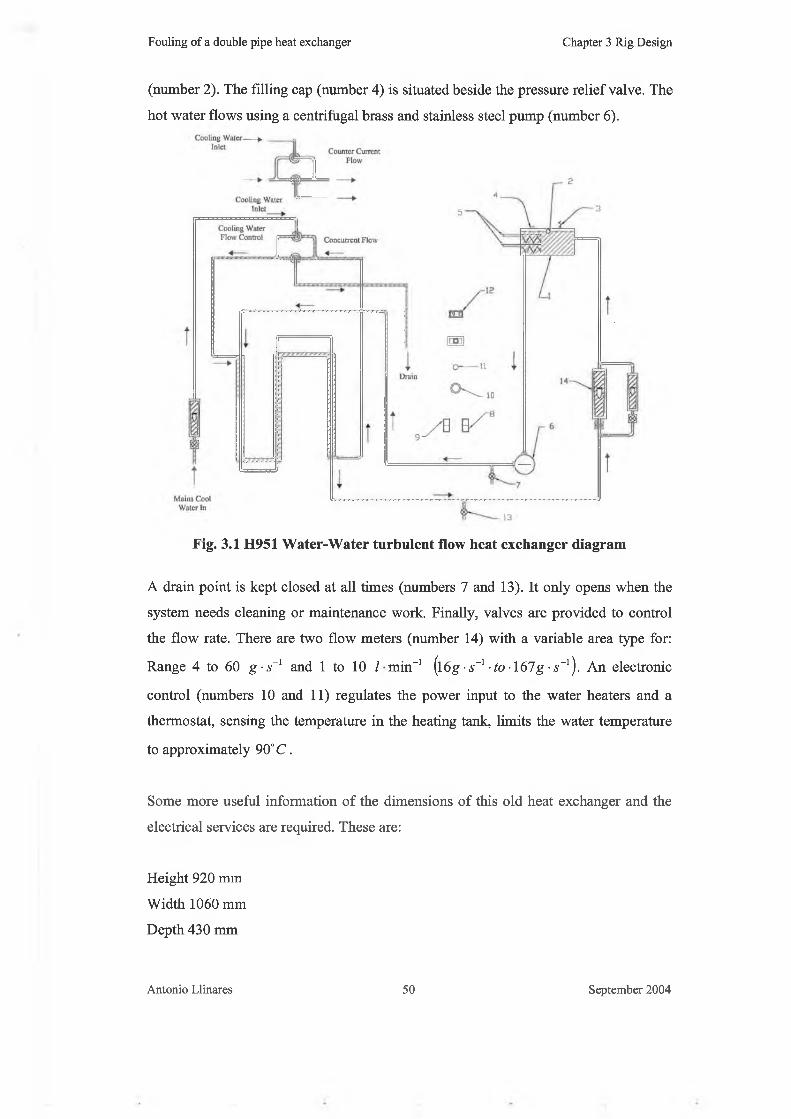
Figure 3.1 illustrates the diagram o f the existing heat exchanger and show s its
workings and structure. Everything starts in the water-heating tank (number 1 in
Figure 3.1). It is a closed stainless steel tank fitted with 2x1.5 K W imm ersion heaters
(number 5) with individual internal high temperature cut offs. The tank is fitted with
an external thermostat, a pressure relief valve (number 3) and a water level sight glass
Antonio Llinares 49 September 2004
Fouling of a double pipe heat exchanger Chapter 3 Rig Design
(number 2). The filling cap (number 4) is situated beside the pressure relief valve. The
hot water flows using a centrifugal brass and stainless steel pump (number 6).
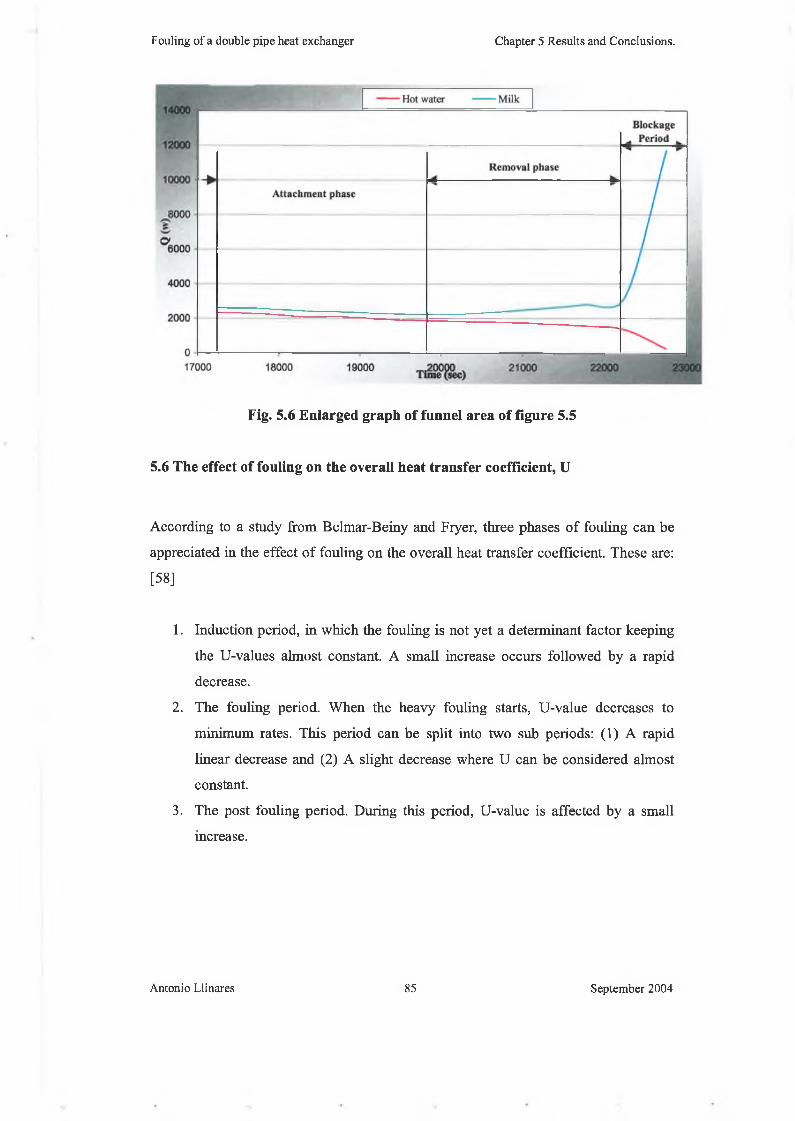
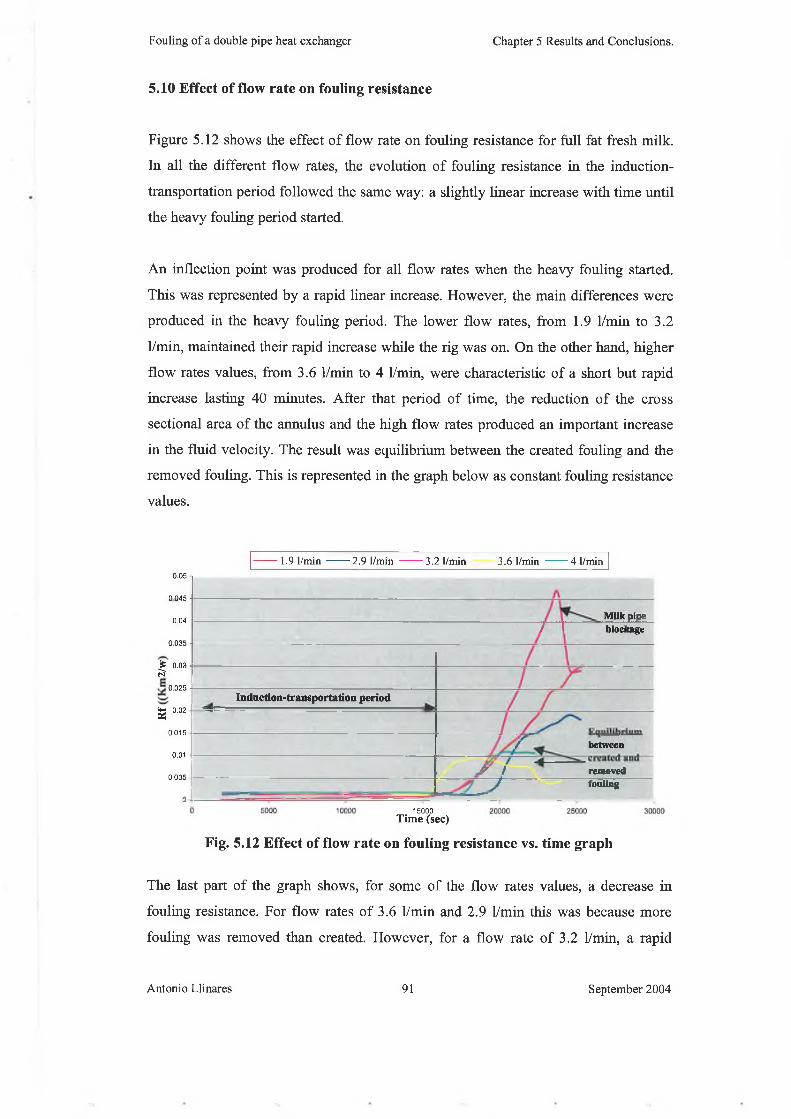
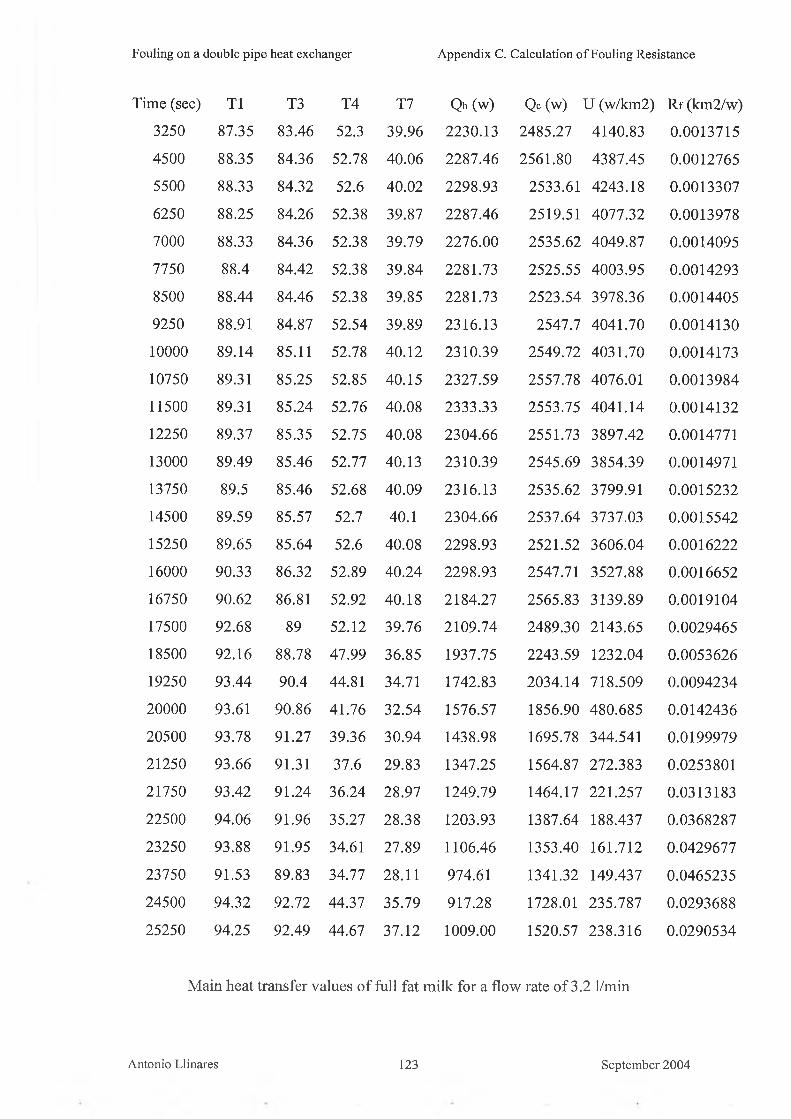
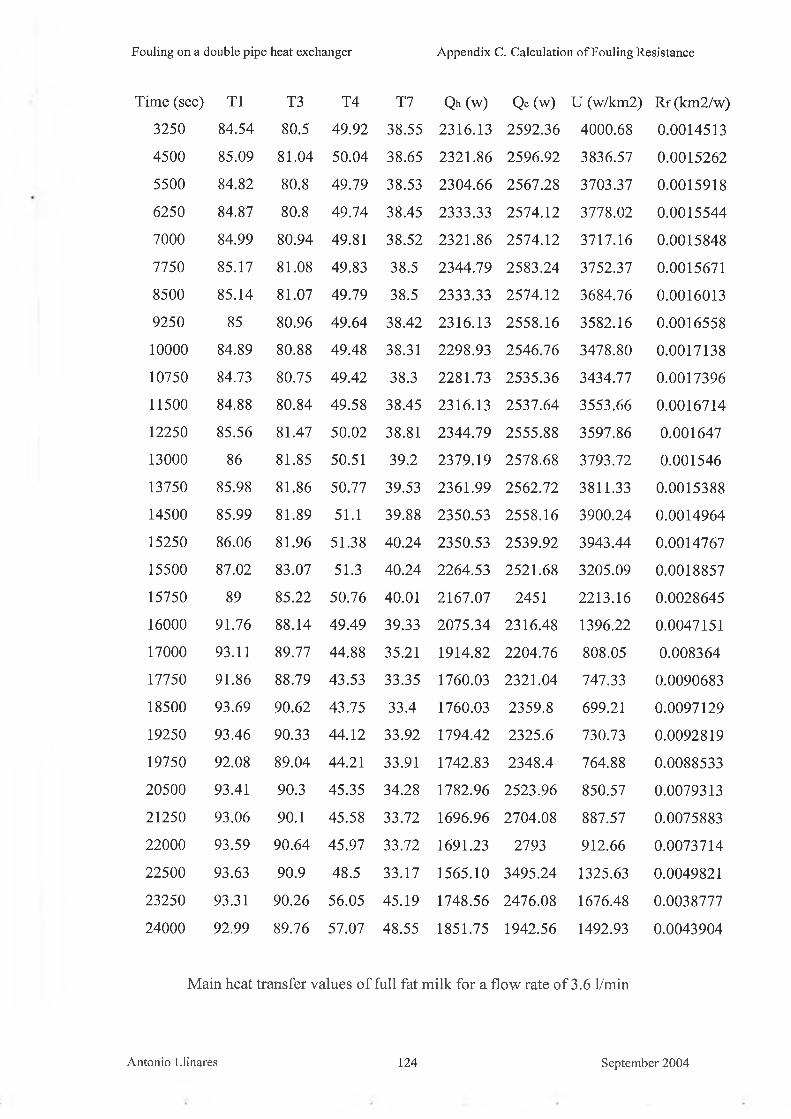
Fig. 5.12 Effect of flow rate on fouling resistance vs. time graph
The last part o f the graph shows, for some o f the flow rates values, a decrease in
fouling resistance. For flow rates o f 3.6 1/min and 2.9 1/min this was because more
fouling was removed than created. However, for a flow rate o f 3.2 1/min, a rapid
Antonio Llinares 91 September 2004
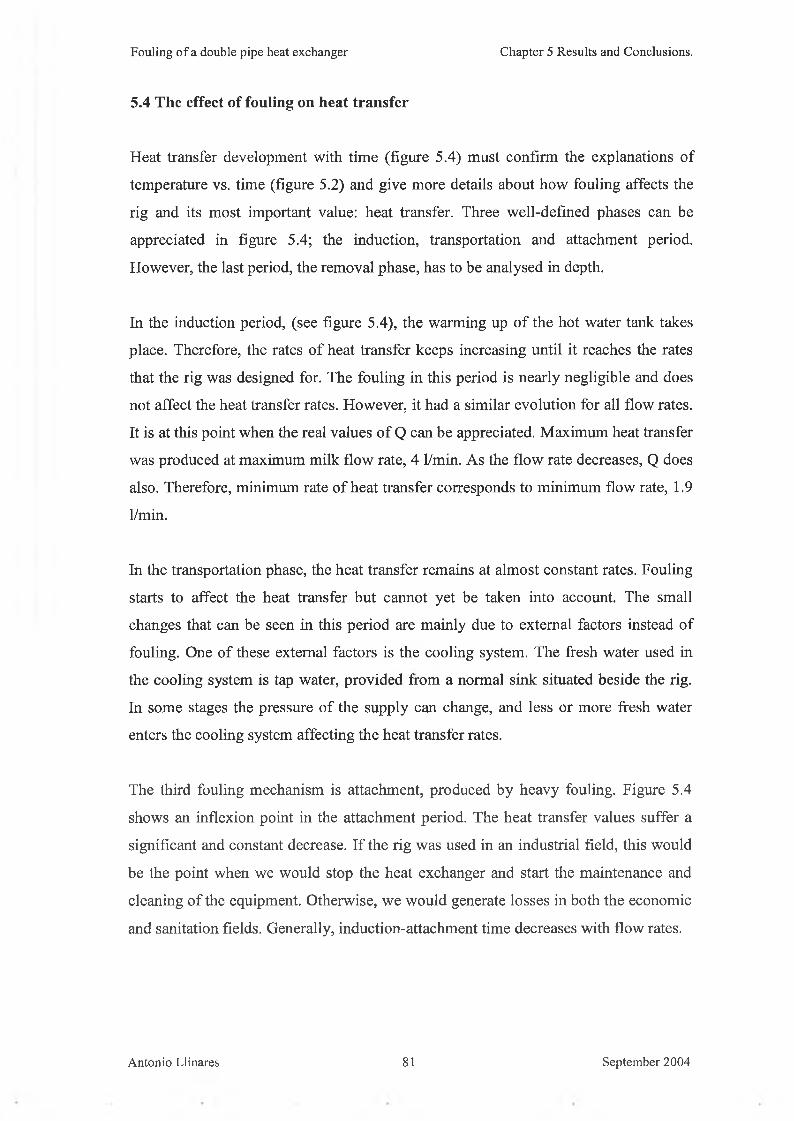
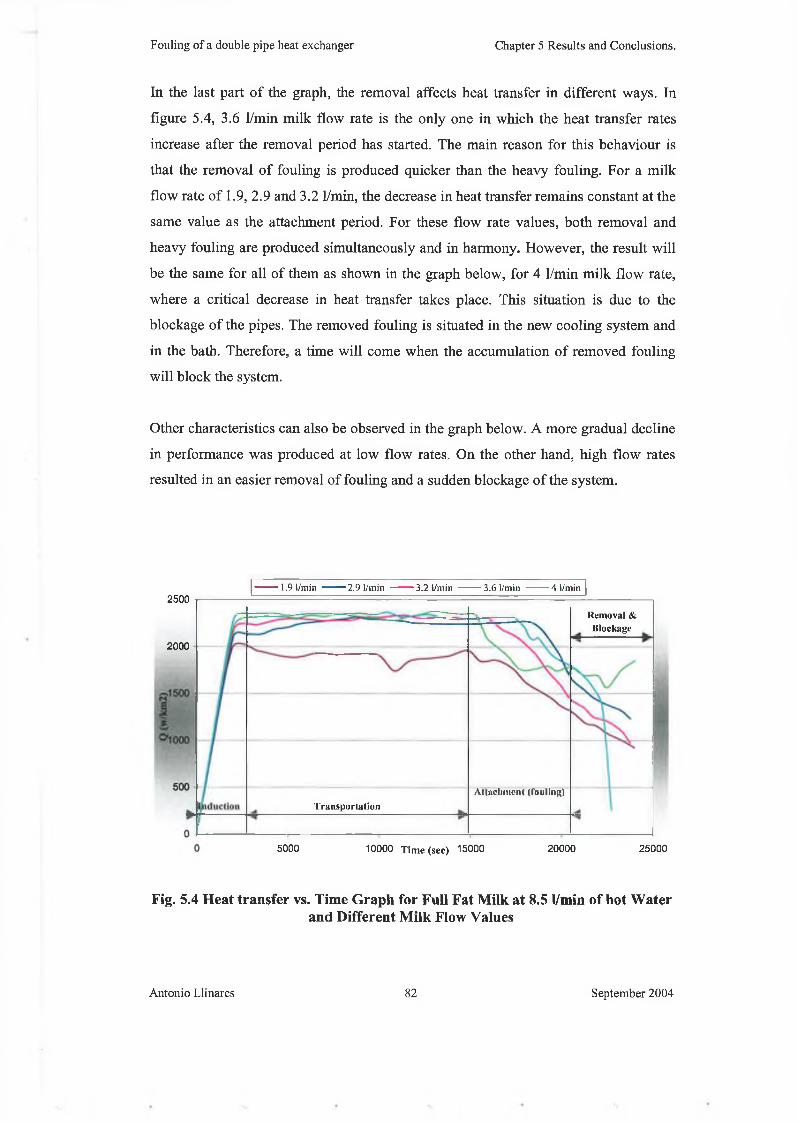
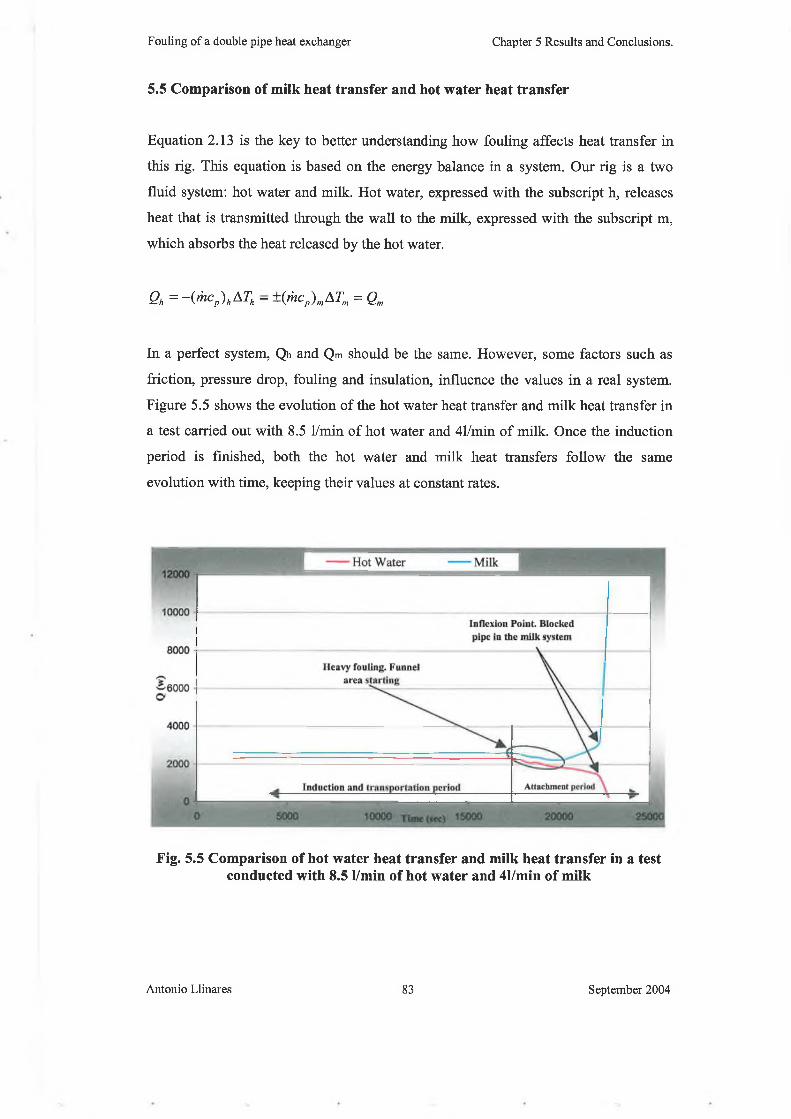
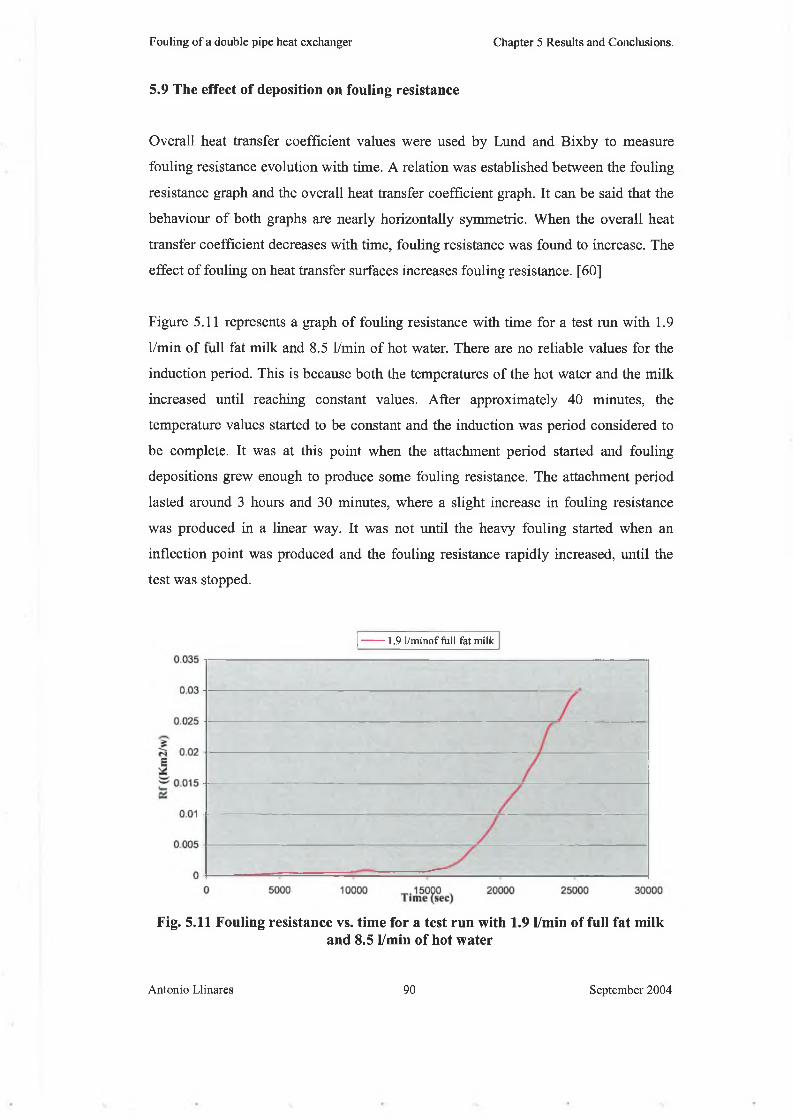
Fouling of a double pipe heat exchanger Chapter 5 Results and Conclusions.
decrease was produced. The main reason for this behaviour was the blockage o f the
milk pipes due to fouling which produced quick and erroneous changes on the fluids’
temperatures.
5.11 Evolution of fouling on the heat transfer surface
Fouling in a heat exchanger surface follows the mechanisms or phases explained in
Chapter 2.3: Induction, transport, attachment, transformation and removal. However,
external factors can appear that affect the way fouling grows on the heat exchanger
surface. In our rig, this external factor includes air bubbles.
Induction Period Fouling
Fouling
Bubbles
Removed
(b) (c)
Fig. 5.13 Growth of fouling in the double pipe cross sectional area
Antonio Llinares 92 September 2004
Fouling of a double pipe heat exchanger Chapter 5 Results and Conclusions.
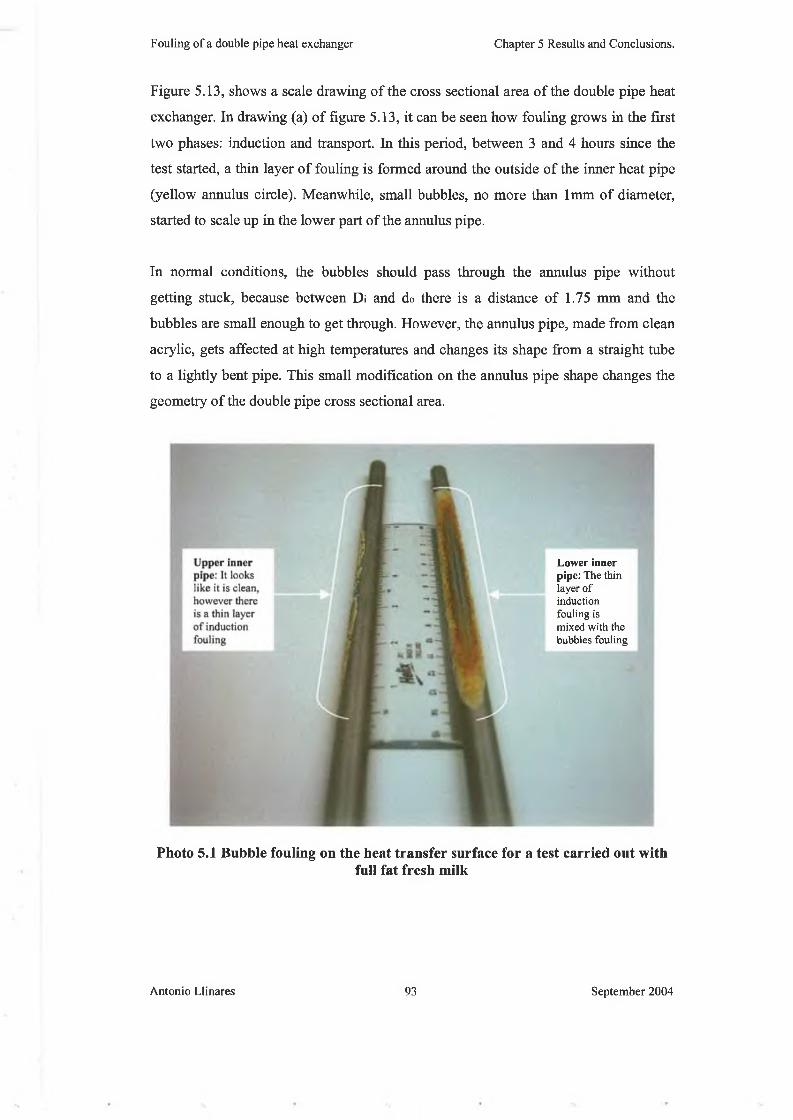
Figure 5.13, shows a scale drawing o f the cross sectional area o f the double pipe heat
exchanger. In drawing (a) o f figure 5.13, it can be seen how fouling grows in the first
two phases: induction and transport. In this period, between 3 and 4 hours since the
test started, a thin layer o f fouling is formed around the outside o f the inner heat pipe
(yellow annulus circle). Meanwhile, small bubbles, no more than 1mm o f diameter,
started to scale up in the lower part o f the annulus pipe.
In normal conditions, the bubbles should pass through the annulus pipe without
getting stuck, because between Di and do there is a distance o f 1.75 mm and the
bubbles are small enough to get through. However, the annulus pipe, made from clean
acrylic, gets affected at high temperatures and changes its shape from a straight tube
to a lightly bent pipe. This small modification on the annulus pipe shape changes the
geometry o f the double pipe cross sectional area.
Photo 5.1 Bubble fouling on the heat transfer surface for a test carried out withfull fat fresh milk
Lower inner pipe: The thin layer of induction fouling is mixed with the bubbles fouling
Antonio Llinares 93 September 2004
Fouling of a double pipe heat exchanger Chapter 5 Results and Conclusions.
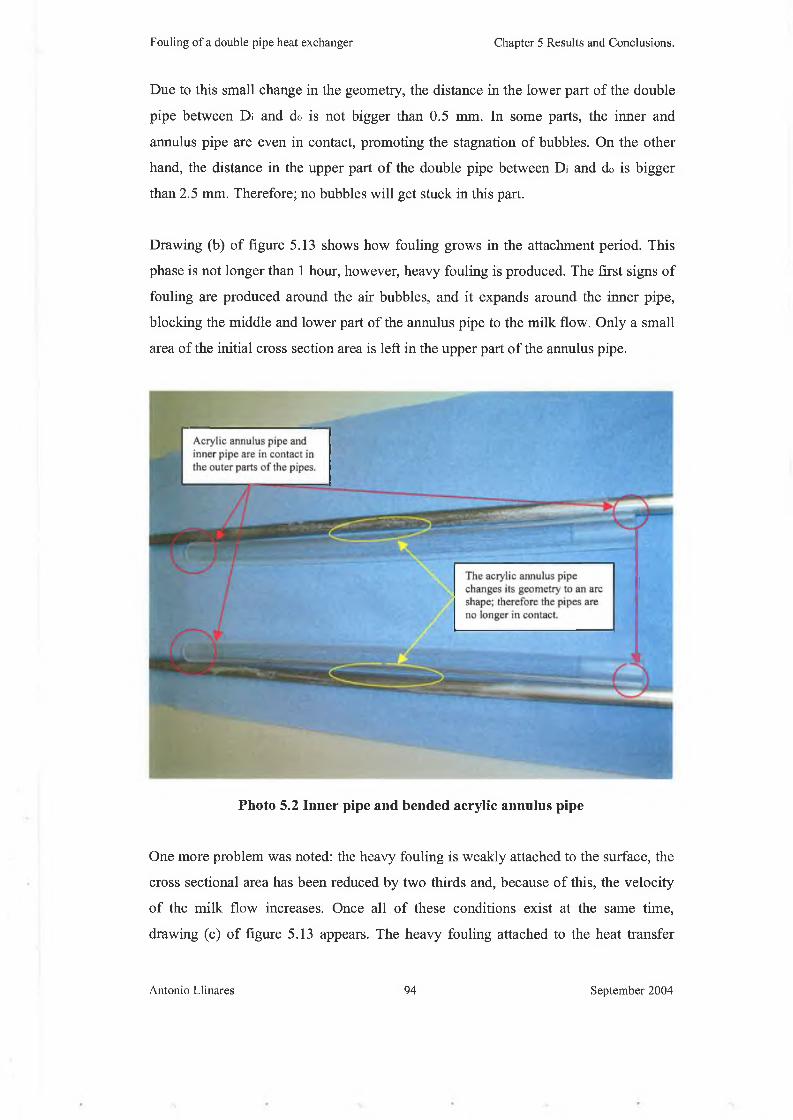
Due to this small change in the geometry, the distance in the lower part o f the double
pipe between Di and do is not bigger than 0.5 mm. In some parts, the inner and
annulus pipe are even in contact, promoting the stagnation o f bubbles. On the other
hand, the distance in the upper part o f the double pipe between Di and do is bigger
than 2.5 mm. Therefore; no bubbles will get stuck in this part.
Drawing (b) o f figure 5.13 shows how fouling grows in the attachment period. This
phase is not longer than 1 hour, however, heavy fouling is produced. The first signs o f
fouling are produced around the air bubbles, and it expands around the inner pipe,
blocking the middle and lower part o f the annulus pipe to the milk flow. Only a small
area o f the initial cross section area is left in the upper part o f the annulus pipe.
Photo 5.2 Inner pipe and bended acrylic annulus pipe
One more problem was noted: the heavy fouling is weakly attached to the surface, the
cross sectional area has been reduced by two thirds and, because o f this, the velocity
o f the milk flow increases. Once all o f these conditions exist at the same time,
drawing (c) o f figure 5.13 appears. The heavy fouling attached to the heat transfer
Antonio Llinares 94 September 2004
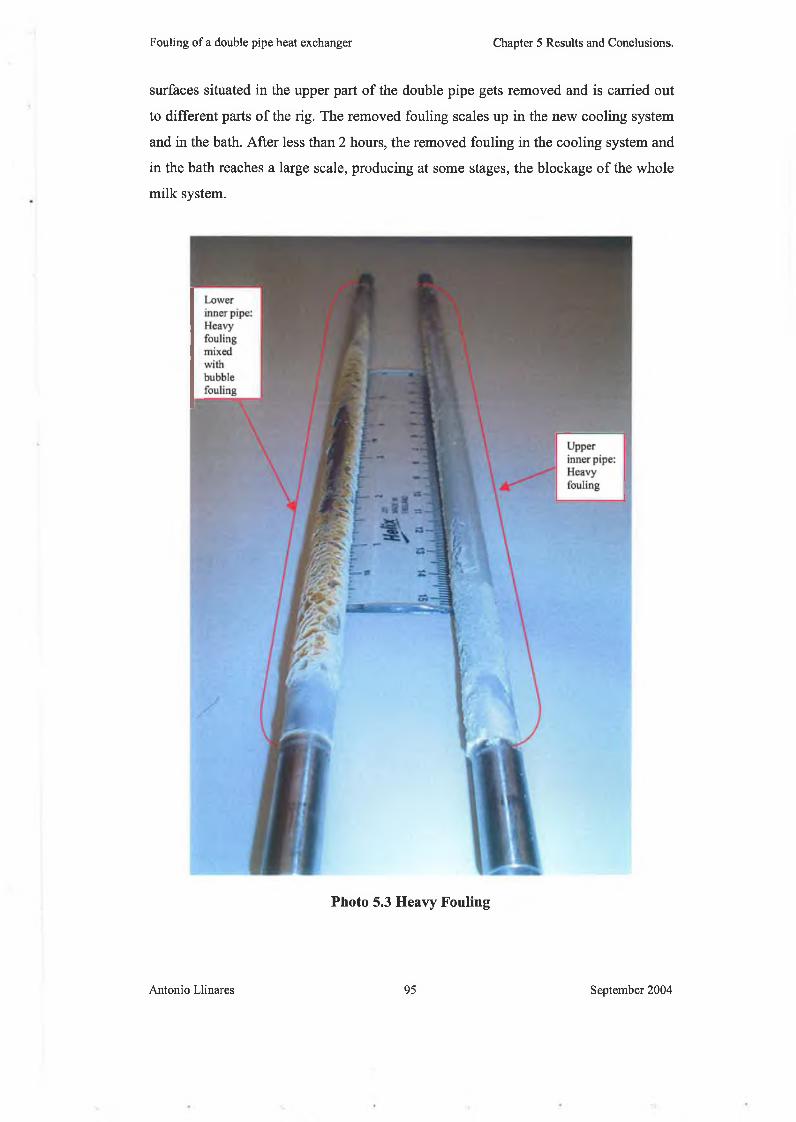
Fouling of a double pipe heat exchanger Chapter 5 Results and Conclusions.
surfaces situated in the upper part o f the double pipe gets removed and is carried out
to different parts o f the rig. The removed fouling scales up in the new cooling system
and in the bath. After less than 2 hours, the removed fouling in the cooling system and
in the bath reaches a large scale, producing at some stages, the blockage o f the whole
milk system.
Photo 5.3 Heavy Fouling
Antonio Llinares 95 September 2004
Fouling of a double pipe heat exchanger Chapter 5 Results and Conclusions.
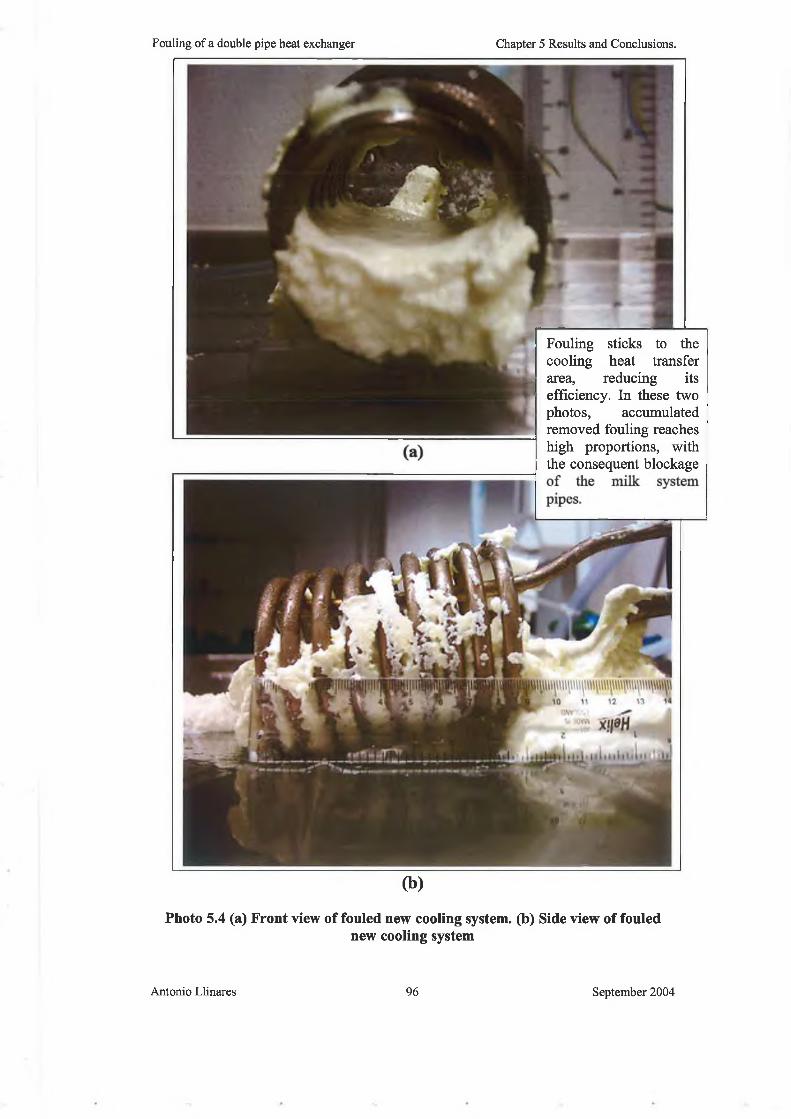
Fouling sticks to the cooling heat transfer area, reducing its efficiency. In these two photos, accumulated removed fouling reaches high proportions, with the consequent blockage
(b)
Photo 5.4 (a) Front view of fouled new cooling system, (b) Side view of foulednew cooling system
Antonio Llinares 96 September 2004
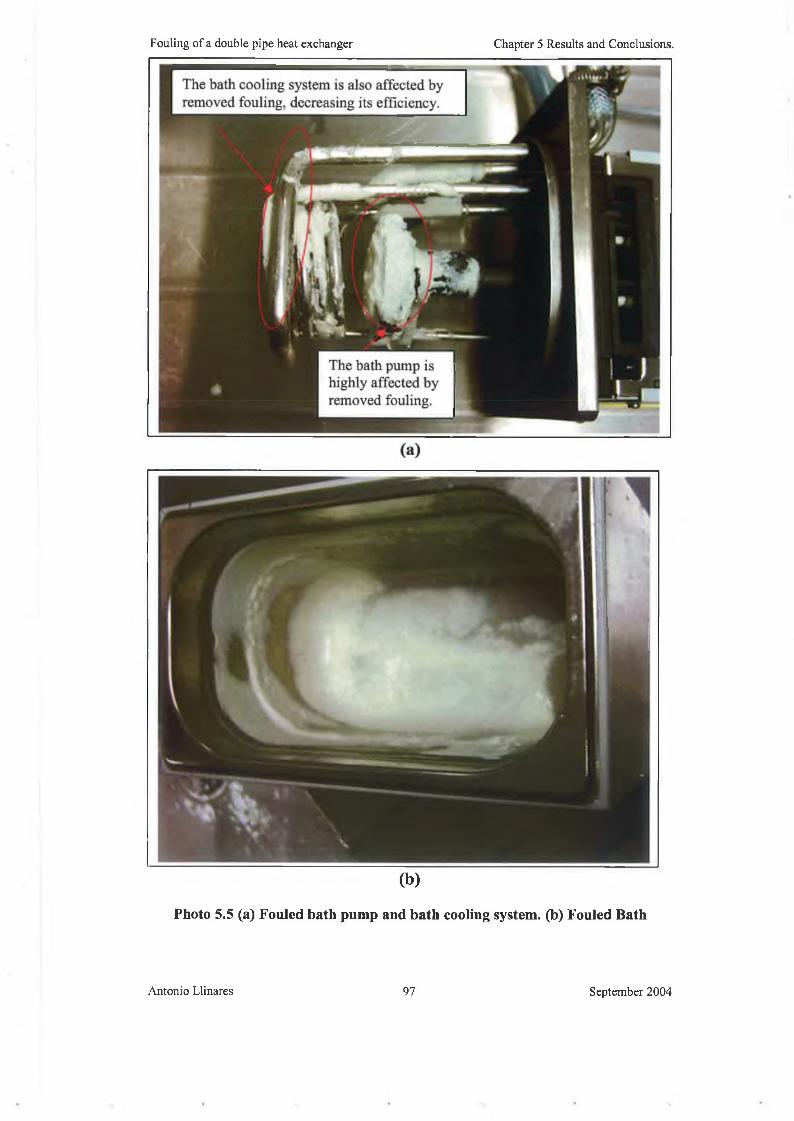
Fouling of a double pipe heat exchanger Chapter 5 Results and Conclusions.
Fouling of a double pipe heat exchanger Chapter 5 Results and Conclusions.
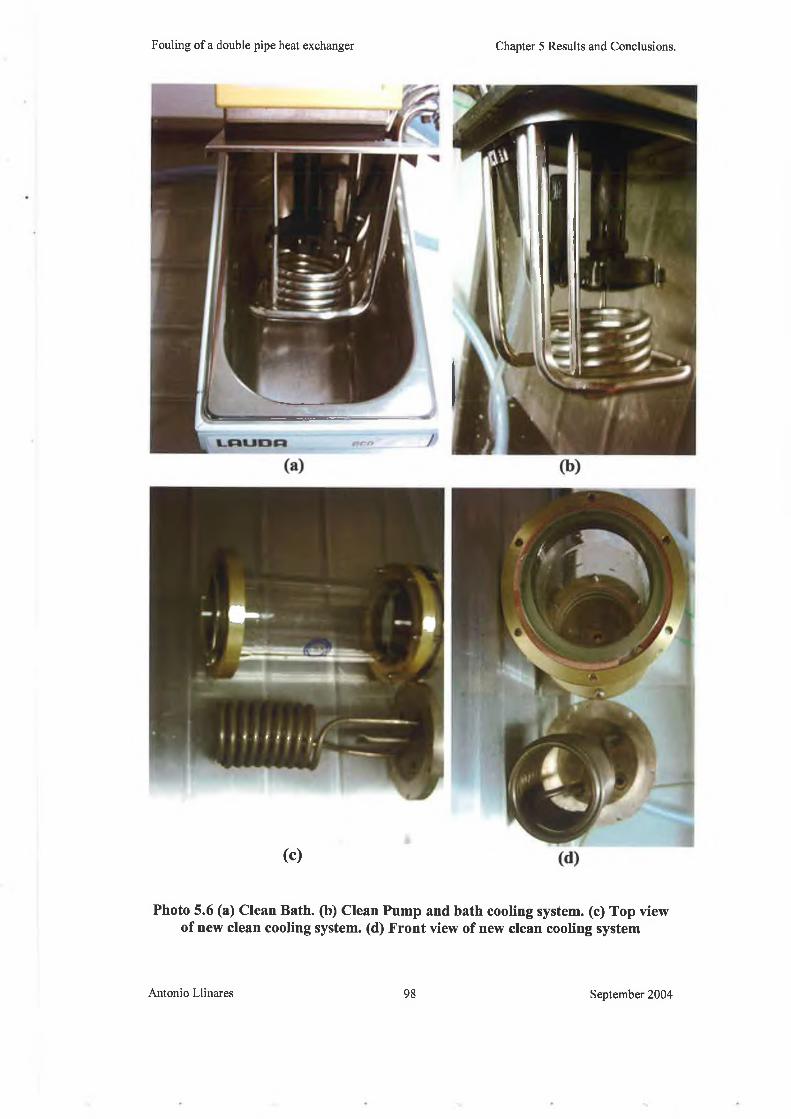
(C)
Photo 5.6 (a) Clean Bath, (b) Clean Pump and bath cooling system, (c) Top view of new clean cooling system, (d) Front view of new clean cooling system
Antonio Llinares 98 September 2004
Fouling of a double pipe heat exchanger Chapter 5 Results and Conclusions.
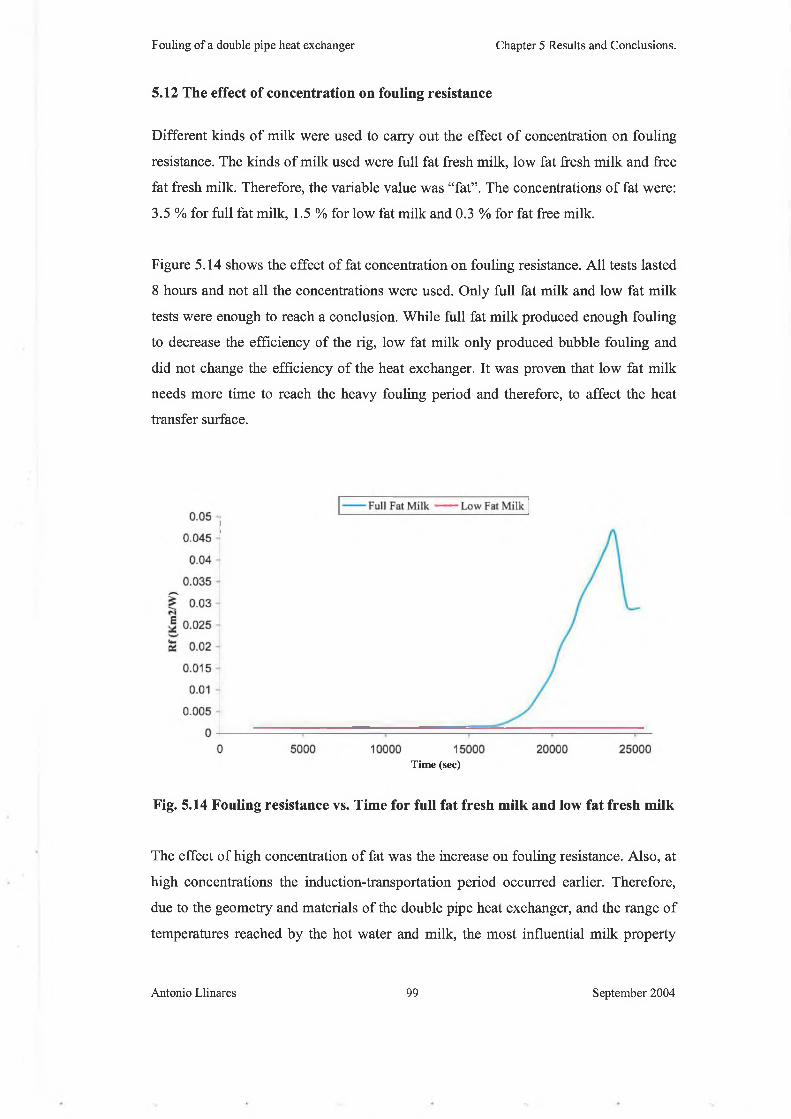
5.12 The effect of concentration on fouling resistance
Different kinds o f milk were used to carry out the effect o f concentration on fouling
resistance. The kinds o f milk used were full fat fresh milk, low fat fresh milk and free
fat fresh milk. Therefore, the variable value was “fat”. The concentrations o f fat were:
3.5 % for full fat milk, 1.5 % for low fat milk and 0.3 % for fat free milk.
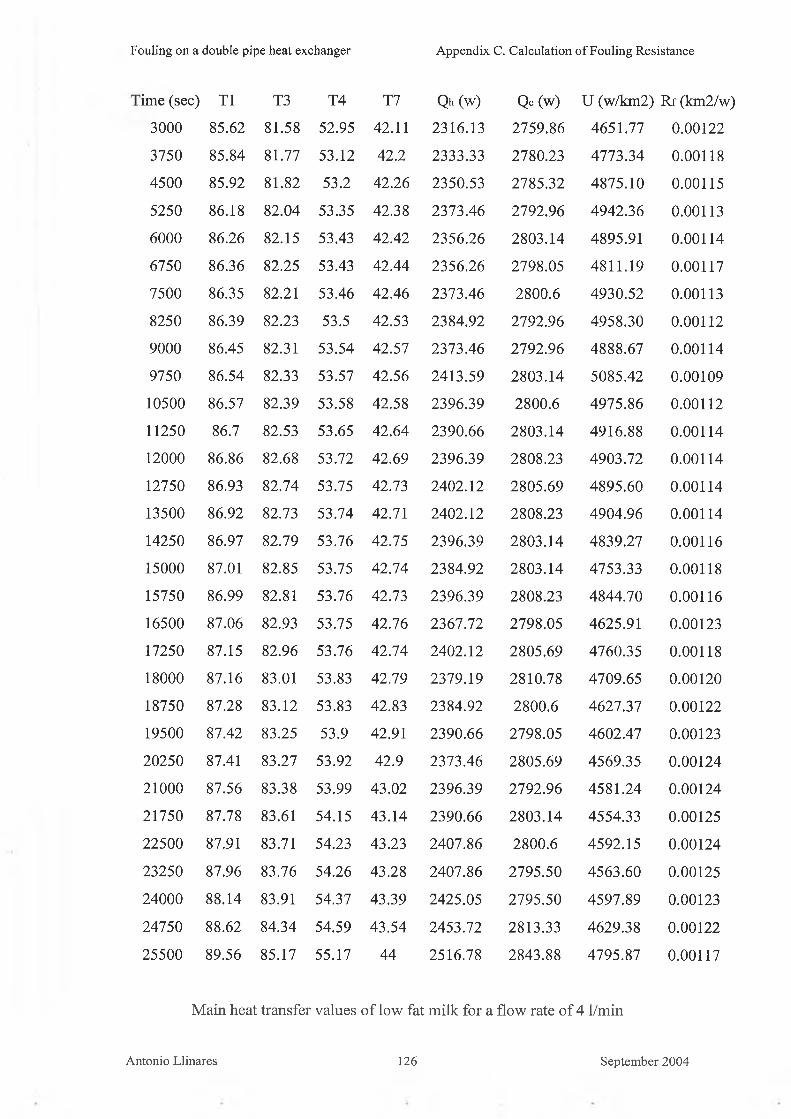
Figure 5.14 shows the effect o f fat concentration on fouling resistance. All tests lasted
8 hours and not all the concentrations were used. Only full fat milk and low fat milk
tests were enough to reach a conclusion. While full fat milk produced enough fouling
to decrease the efficiency o f the rig, low fat milk only produced bubble fouling and
did not change the efficiency o f the heat exchanger. It was proven that low fat milk
needs more time to reach the heavy fouling period and therefore, to affect the heat
transfer surface.
Time (sec)
Fig. 5.14 Fouling resistance vs. Time for full fat fresh milk and low fat fresh milk
The effect o f high concentration o f fat was the increase on fouling resistance. Also, at
high concentrations the induction-transportation period occurred earlier. Therefore,
due to the geometry and materials o f the double pipe heat exchanger, and the range o f
temperatures reached by the hot water and milk, the most influential milk property
Antonio Llinares 99 September 2004
Fouling of a double pipe heat exchanger Chapter 5 Results and Conclusions.
was fat. Due to this reason, a free fat milk test was not carried out and considered
useless to provide important results.
5.13 Evaporated milk and powder milk
All the results from point 5.2 to point 5.12 were carried out with pasteurised milk. The
main results were carried out with full fat milk, and some comparisons were made
between full fat, low fat and free fat milk in point 5.12. However, some more tests
were conducted with different dairy products: evaporated milk and powder milk.
It was assumed that the results, as dairy products, were going to be similar to those o f
fresh milk. Therefore, the aim was to try to make an evaluation on the effect o f
fouling on the induction period and the effect o f fouling on heat transfer.
Hot water Evaporate m ilk2900
2500
£ 2X0MsIn
H 2100es v X
1900
1700
15002500 7500 12500 17500 22500
T im e (sec)
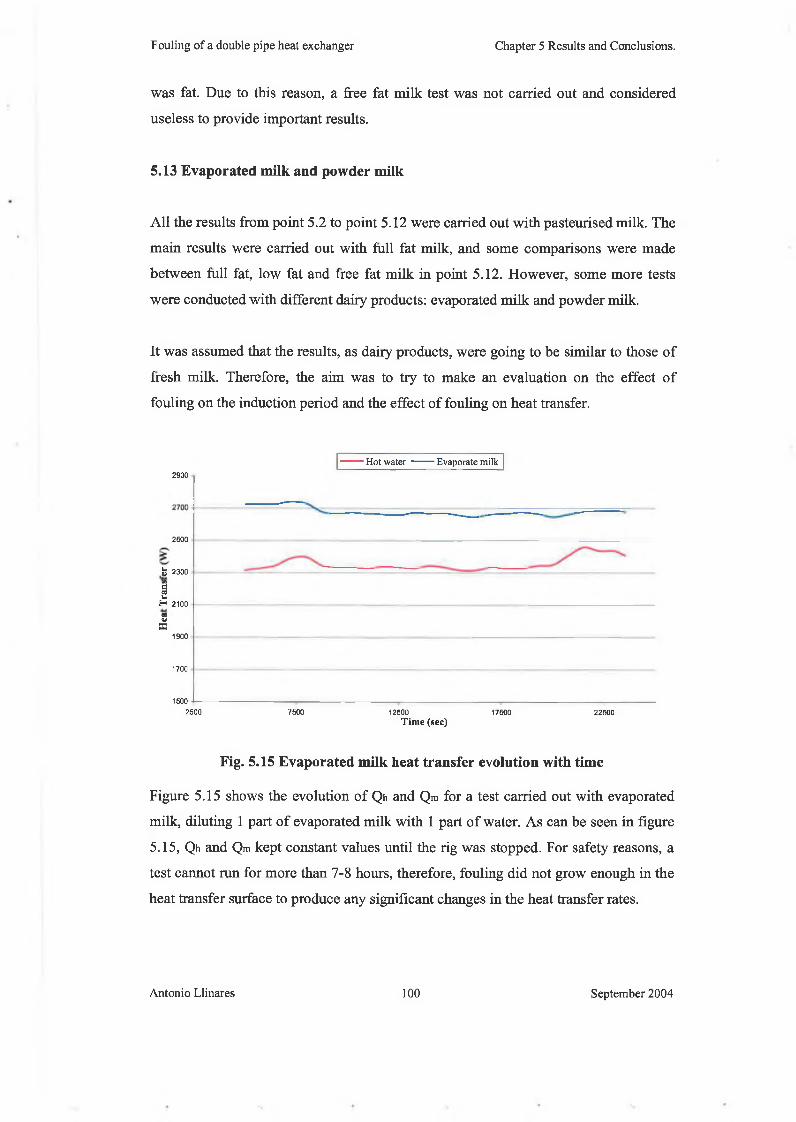
Fig. 5.15 Evaporated milk heat transfer evolution with time
Figure 5.15 shows the evolution of Qh and Qm for a test carried out with evaporated
milk, diluting 1 part o f evaporated milk with 1 part o f water. As can be seen in figure
5.15, Qh and Qm kept constant values until the rig was stopped. For safety reasons, a
test cannot run for more than 7-8 hours, therefore, fouling did not grow enough in the
heat transfer surface to produce any significant changes in the heat transfer rates.
Antonio Llinares 100 September 2004
Fouling of a double pipe heat exchanger Chapter 5 Results and Conclusions.
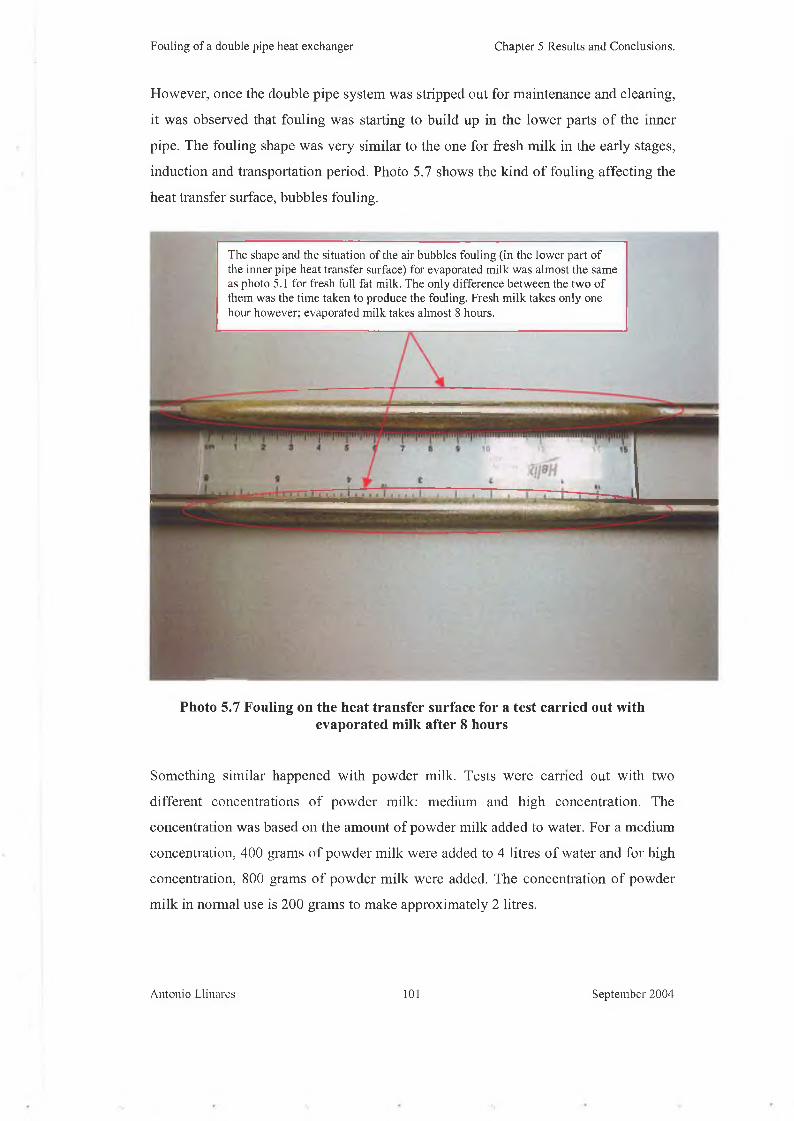
However, once the double pipe system was stripped out for maintenance and cleaning,
it was observed that fouling was starting to build up in the lower parts o f the inner
pipe. The fouling shape was very similar to the one for fresh milk in the early stages,
induction and transportation period. Photo 5.7 shows the kind o f fouling affecting the
heat transfer surface, bubbles fouling.
The shape and the situation o f the air bubbles fouling (in the lower part o f the inner pipe heat transfer surface) for evaporated m ilk w as alm ost the same as photo 5.1 for fresh full fat milk. The only difference betw een the tw o o f them was the tim e taken to produce the fouling. Fresh m ilk takes only one hour however; evaporated m ilk takes alm ost 8 hours.
Photo 5.7 Fouling on the heat transfer surface for a test carried out with evaporated milk after 8 hours
Something similar happened with powder milk. Tests were earned out with two
different concentrations o f powder milk: medium and high concentration. The
concentration was based on the amount of powder milk added to water. For a medium
concentration, 400 grams o f powder milk were added to 4 litres o f water and for high
concentration, 800 grams o f powder milk were added. The concentration o f powder
milk in normal use is 200 grams to make approximately 2 litres.
Antonio Llinares 101 September 2004
Fouling of a double pipe heat exchanger Chapter 5 Results and Conclusions.
The results for a medium concentration were very similar to evaporated milk, where
the values o f Q remained constant and no decrease was observed after 8 hours. Once
the inner pipe was removed for cleaning, the same bubble fouling as shown in photo
5.1 for fresh milk and in photo 5.7 for evaporated milk was present.
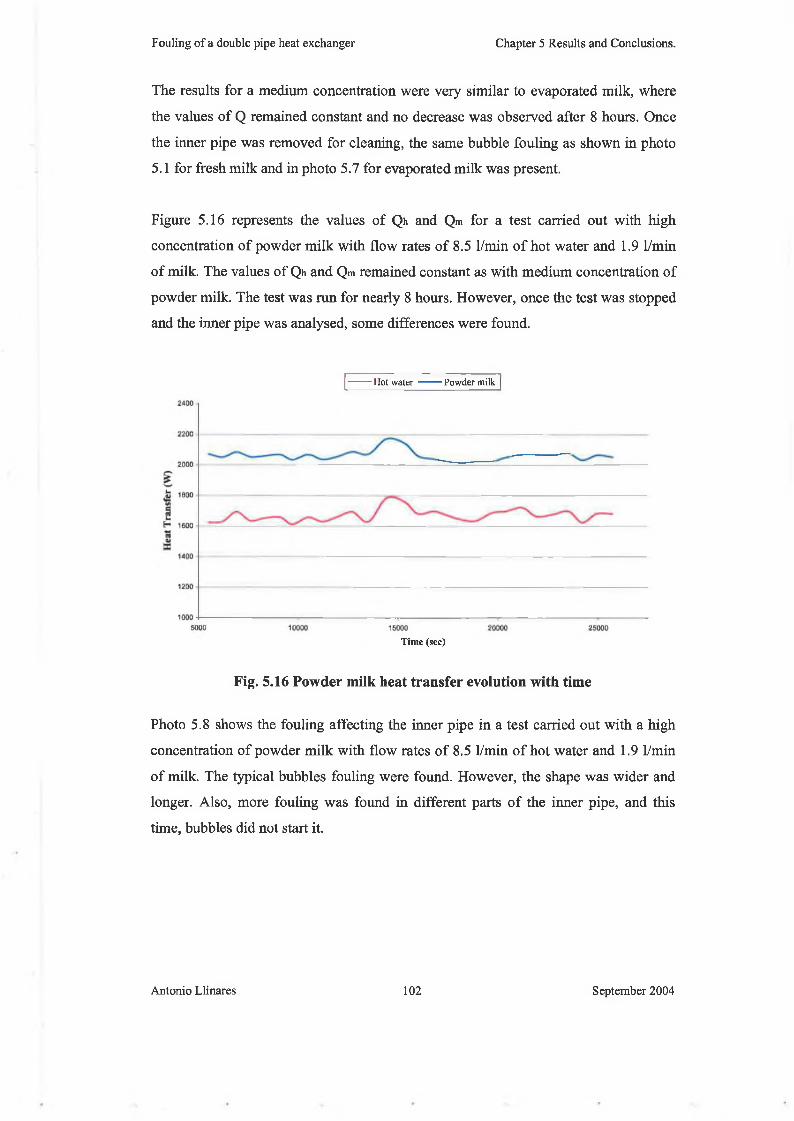
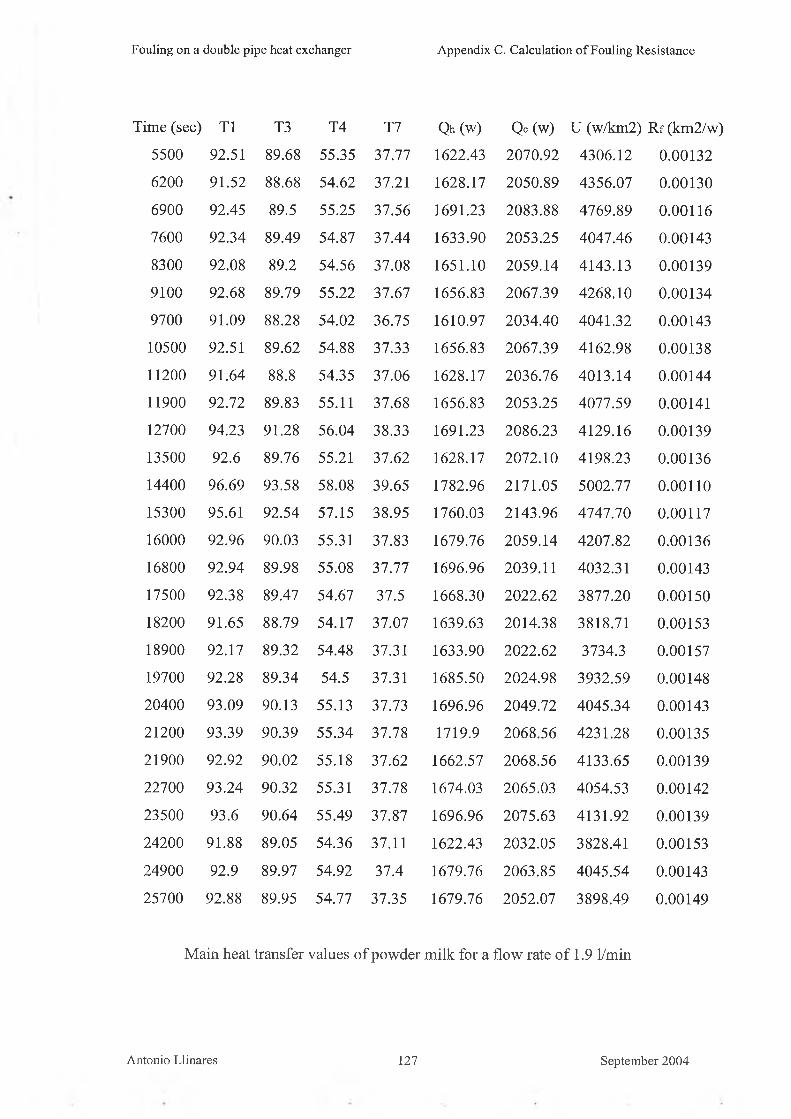
Figure 5.16 represents the values o f Qh and Qm for a test carried out with high
concentration o f powder milk with flow rates o f 8.5 1/min o f hot water and 1.9 1/min
o f milk. The values o f Qh and Qm remained constant as with medium concentration o f
powder milk. The test was run for nearly 8 hours. However, once the test was stopped
and the inner pipe was analysed, some differences were found.
Hot w a te r Powder m ilk
T im e (sec)
Fig. 5.16 Powder milk heat transfer evolution with time
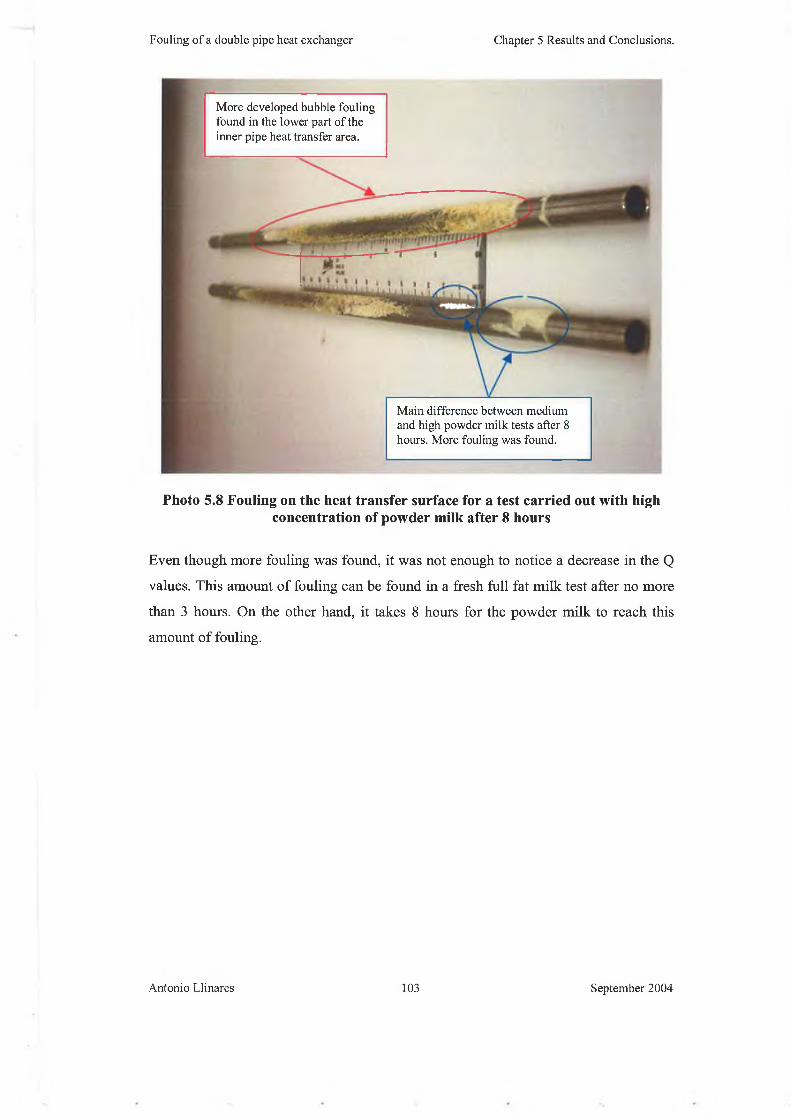
Photo 5.8 shows the fouling affecting the inner pipe in a test carried out with a high
concentration o f powder milk with flow rates o f 8.5 1/min o f hot water and 1.9 1/min
o f milk. The typical bubbles fouling were found. However, the shape was wider and
longer. Also, more fouling was found in different parts o f the inner pipe, and this
time, bubbles did not start it.
Antonio Llinares 102 September 2004
Fouling of a double pipe heat exchanger Chapter 5 Results and Conclusions.
More developed bubble fouling found in the lower part of the inner pipe heat transfer area.
Main difference between medium and high powder milk tests after 8 hours. More fouling was found.
Photo 5.8 Fouling on the heat transfer surface for a test carried out with high concentration of powder milk after 8 hours
Even though more fouling was found, it was not enough to notice a decrease in the Q
values. This amount o f fouling can be found in a fresh full fat milk test after no more
than 3 hours. On the other hand, it takes 8 hours for the powder milk to reach this
amount o f fouling.
Antonio Llinares 103 September 2004
Fouling o f a double pipe heat exchanger Chapter 6 Conclusions
Chapter 6 Conclusions
The following conclusions can be drawn from this work:
• Successful construction o f a double pipe heat exchanger.
• Formation o f fouling on the heat transfer surface even though the milk did not
reach high temperatures (between 20 and 55 Celsius degrees).
• The evolution o f the temperatures with time was consistent with the
information found in the references.
• The evolution o f heat transfer with time occurred symmetrically to the
different fouling mechanisms.
• The overall heat transfer coefficient values are affected by fouling as
references indicate.
• Milk fluid velocity had relevant importance on the heat transfer values.
Reynolds numbers for the 5 different set points o f the milk pump indicate that
the milk fluid was laminar at some stages.
• Fouling deposits increased with time until reaching the point where they
produced a blockage o f the system.
However, the effect o f concentration on fouling resistance could not be properly
analysed. In Chapter 6, Future work, some recommendations were included to obtain
better results regarding the effect o f concentration on fouling resistance.
Antonio Llinares 104 September 2004
Fouling o f a double pipe heat exchanger Chapter 7 Future W ork
Chapter 7 Future Work
A double pipe heat exchanger was built and successful tests were carried out during
the time dedicated to this Masters. However, some changes can be made with the aim
o f increasing the efficiency o f the heat exchanger, to improve the accuracy o f the
results and to reduce heat loss from the system.
The main modifications, in m y opinion, are the design and construction o f a new hot
water tank instead o f using the old heat exchanger hot water tank. The reasons for
these modifications are:
• The possibility o f using a different fluid instead o f water with the aim o f
increasing the inlet temperature by a few degrees. Therefore, results can be
obtained in a shorter period o f time. Dairy products with a low concentration
o f proteins will produce significant amounts o f fouling in the time dedicated to
the test.
• To analyse the evolution of fouling with different hot fluid flows.
• To compare the heat exchanger efficiency using different process hot fluids.
Another very interesting modification is to improve the fittings and insulation o f the
heat exchanger. Currently, the fittings are pieces o f hose o f different lengths and
diameters producing a huge pressure drop. There is no insulation at all; therefore big
heat losses are produced. W ith these modifications a new path in the double pipe heat
exchange is opened: the study o f pressure drop in relation to fouling.
In order to study pressure drop, the hose pieces have to be replaced by hard pipes,
such as copper or aluminium. Many references can be found for the calculation o f
pressure drop due to fittings, bends, sudden contractions and sudden expansions.
Parallel to pressure drop due to fouling, the pumping power relationship can also be
analysed. CIP (Cleaning in Place) o f a double pipe heat exchanger before blockage o f
the tubes takes place is another interesting point for future investigation.
Antonio Llinares 105 September 2004
Fouling o f a double pipe heat exchanger Nomenclature
Nomenclature
Symbol Physical Quantity SI Units
A total heat transfer area,
Ac net free-flow cross-sectional area,
C flow stream heat capacity rate, rhcp ,
cp specific heat at constant pressure,
di tube inside diameter,
d 0 tube outside diameter,
De equivalent diameter,
Dh hydraulic diameter for pressure drop,
e tube surface roughness,
e emissivity, Eq. 2.3
f fanning friction factor,
h heat transfer coefficient,
H energy radiated per second,
i specific enthalpy,
k thermal conductivity,
L characteristic length,
m exponent
m fluid mass flow rate,
n exponent
Nu Nusselt number,
P pressure,
P wetter perimeter, Eq. 2.57
Pe Peclet number,
Pr Prandtl number,
Q heat transfer rate,
R thermal resistance,
Antonio Llinares
W /K
J /K g - K
m
m
m
4 A /P w,m
m
(0-1)
/I 2Tw/ 2 P11™
W /m 2 -K
W
J /K g
W /m -K
m
kg /s
h d /k
Pa
m
RePr
Cpfjd/A: = o /a
W
m 2 ■K /W
106 September 2004
Fouling o f a double pipe heat exchanger Nomenclature
r tube radius, m
R r fouling factor, m 2 ■K /W
Re Reynolds number, pumd /p ,p i imDh/ n
T temperature, °C ,K
A 7’ local temperature difference between two fluids, °C, K
A Tlm log-mean temperature difference, °C, K
A Tm true mean temperature difference, °C ,K
U overall heat transfer coefficient, W /m 2 K
u fluid velocity component in axial direction, m /s
u,„ fluid mean velocity in axial direction, m /s
X Cartesian coordinate, axial distance, m
Greek Symbols
a thermal diffusivity o f fluid, m 2/s
A difference
8 differential form,
e heat exchanger effectiveness
dynamic viscosity, P a s
v kinematic viscosity, m 2/s
P fluid density, K g /m '
G Stefan-Boltzmann constant, 5.67 -I0~s j / s m 2k A
Tm shear stress at the wall, Pa
0 parameter, function o f
Antonio LI i nares 107 September 2004
Fouling o f a double pipe heat exchanger Nomenclature
Subscripts
b bulk
c cold fluid
c clean, Eq. 2.36
cp constant-property solution
f fouling condition
h hot fluid
h hot water, Chapter 5
i inlet condition, inner or inside
m mean
m milk, Chapter 5
o outlet condition, outer or outside
t total
w wall condition or wetter
x local value at distance x
00 fully developed condition
1 inlet
2 outlet
Antonio Llinares 108 September 2004
Fouling o f a double pipe heat exchanger References
References
1. Taborek, J., Akoi, T. Ritter, R. B., & Palen, J. W. Fouling: the major
unresolved problem in heat transfer, chem. Eng. Prog. Vol. 68, 1972.
2. Garrett-Price, B A., Smith, S. A., Watts, R. L., Knudsen, J. G., Marner, W. J.,
& Suitor, J. W ., Fouling o f Heat Exchangers: Characteristics, Costs,
Prevention, Control, and Removal, Noyes, Park Ridge, 1985.
3. Collier, J. G. Heat exchangers fouling and corrosion, in Heat Exchangers:
Thermal-Hydraulic Fundamentals and Design, Kakaç, S., Bergles, A. E., &