24
ANGLICAN EYE CLINIC – JACHIE HALF YEAR REPORT - 2017

ANGLICAN EYE CLINIC – JACHIE
HALF YEAR REPORT - 2017

INTRODUCTION
The report summarizes the activities and services rendered by the Anglican Eye Clinic within the first half of the
year (January- June) 2017. This report seeks to provide adequate information to partners, friends and indeed all
stakeholders on the performance of the Clinic during the period under review.The main priorities for the year,
achievements and challenges faced by the clinic are also outlined.
Clinic’s Vision
The Clinic’s Vision, in line with the broad vision of Christian Health Association of Ghana and the Anglican Church,
is ‘To give first class treatment of eye conditions to all clients regardless of color or creed.
Clinic’s Mission Statement
1. To provide quality eye care in a pleasant environment with the highest quality sterilization procedures in place.
2. To provide outreach programs at the neighboring schools and communities and to implement preventive eye care.
3. To provide an opportunity for mission-minded eye professionals to volunteer their services.
Main Priorities for 2017(Half Year)
The Anglican Eye Clinic’s main priorities for the period under review are detailed as:
To source for funds for the construction of an Eye Hospital at Akwaduo in the Ashanti Region of Ghana.
Working with NHIA Authorities to install back into the scheme.
Plans to extend the records and optical department. Present records room is clearly fast running out of space.
To purchase software and other logistics to ensure early submission of reports.
Refurbish a treatment room and optical showroom with increased patient privacy.
To refurbish outpatient department for patient comfort and to reduce dust.
To improve the main entrance for easy access.
Conduct staff and client satisfaction surveys.

ACTIVITIES/ACHIEVEMENTS
During the period under review the clinic made the following achievements:
The extension of Records and Optical Department was accomplished.
A treatment room and Optical show-room was refurbished which has increased patient privacy.
The OPD department and the main entrance of the clinic were improved to ensure easy access and
patient comfort.
TREATMENT AND OPTICAL SHOW ROOM
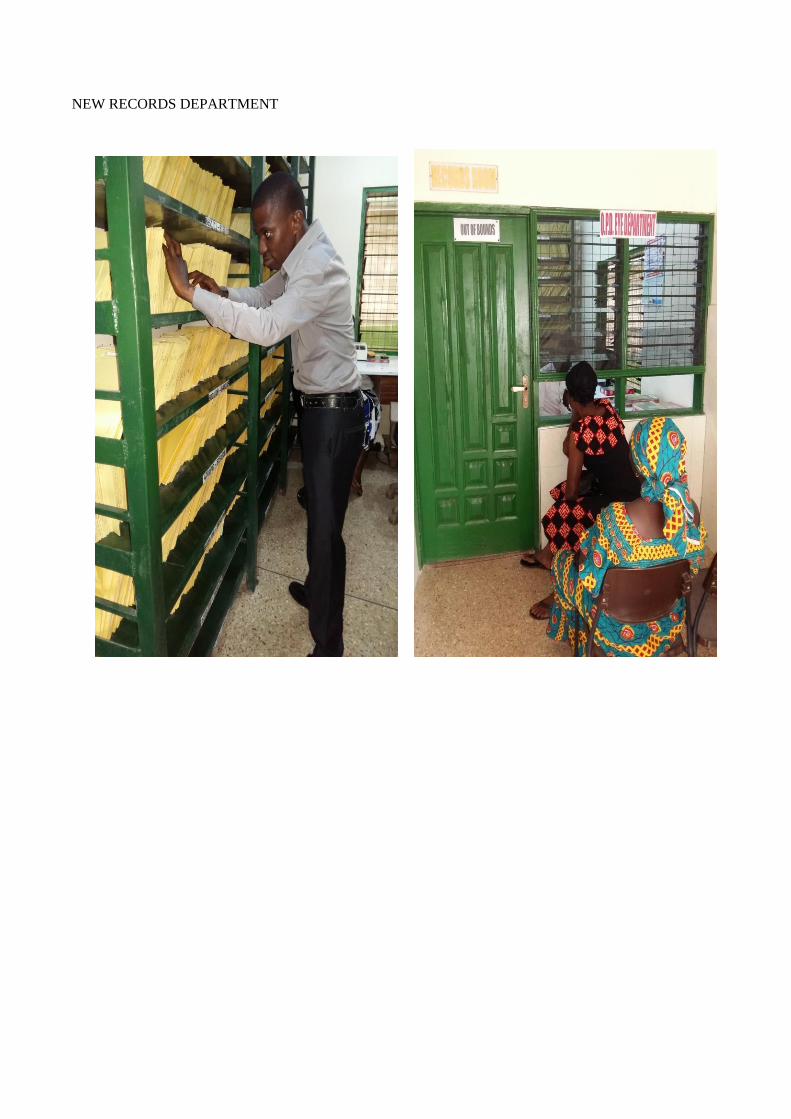
NEW RECORDS DEPARTMENT

SIDE VIEW OF NEW RECORDS AND OPTICAL BUILDING
OVERVIEW OF ANGLICAN EYE CLINIC

MORNING DEVOTION WITH OUR CLIENTS

CLIENTS BEEN ATTENDED TO AT THE OPD DEPARTMENT

From the graph it can be seen that the month of March recorded the highest OPD attendance which is 919.This is an
appreciation of 190 from February figure of 729. April recorded the lowest attendance of696. The increased in
attendance in the month of March can be attributed to many outreach programs attended within the period.
Below is a table showing the attendance trend of half year of 2016 and 2017 for the purpose of comparison.
MONTH 2016 2017 PERCENTAGE
CHANGE
REMARKS
JANUARY 1158 775 33.07% Decrease
FEBRUARY 1155 729 36.88% Decrease
MARCH 1097 919 16.23% Decrease
APRIL 1011 676 33.14% Decrease
MAY 1025 793 22.63% Decrease
JUNE 966 789 18.32% Decrease
TOTAL 6412 4681 26.99% Decrease
775729
919
676
793 789
0
100
200
300
400
500
600
700
800
900
1000
JANUARY FEBRUARY MARCH APRIL MAY JUNE
NU
MB
ER
MONTH
OPD ATTENDANCE TREND

INSURED AND NON-INSURED CLIENTS
Non-insured clients make the greater percentage of the total number of clients treated at the clinic. This was not the
case in the first half of 2016. In the first half of 2016, insured clients made up the greater percentage of the total
number of clients treated.
Below is a table showing the figures for both 2016 and 2017.
YEAR MONTH INSURED
CLIENTS
NON-
INSURED
CLIENTS
YEAR INSURED
CLIENTS
NON-
INSURED
CLIENTS
2016
JANUARY 1088 70
2017
39 736
FEBRUARY 1036 119 33 696
MARCH 934 163 26 893
APRIL
886 110 20 656
MAY
844 181 31 762
JUNE
847 119 26 763
TOTAL 5635 762 175 4506
0
100
200
300
400
500
600
700
800
900
1000
JANUARY FEBRUARY MARCH APRIL MAY JUNE
Insured
Non-Insured

In the first half of 2017, the number of old clients was3451 as against1230 clients which were new clients.
Below is a table showing the breakdown
YEAR MONTH OLD
CLIENTS
NEW
CLIENTS
YEAR OLD
CLIENTS
NEW
CLIENTS
2016
JANUARY 854 304
2017
596 179
FEBRUARY 880 275 526 203
MARCH 910 187 671 248
APRIL
789 222 516 160
MAY
765 255 578 215
JUNE
740 226 564 225
TOTAL 4938 1469 3451 1230
596526
671
516578 564
179 203248
160215 225
0
100
200
300
400
500
600
700
800
JANUARY FEBRUARY MARCH APRIL MAY JUNE
Numberof
Clients
Period
OLD/NEW CLIENTS
Old Clients
New Clients
Column1

Within the period considered, the number of male clients was1009 representing 21.56% of the total attendance,
2877female clients representing 61.46% and 795 were children representing 16.98%. For the purpose of analysis,
children are considered to be clients between 0-15 years.
Below is the breakdown of the figures for first half of 2016 and 2017 for the purpose of comparison.
YEAR MONTH MALE FEMALE CHIL
DREN
YEAR MALE FEMALE CHIL
DREN
2016
JANUARY 286 660 212
2017
180 477 118
FEBRUARY 257 697 201 155 453 121
MARCH 228 709 160 189 550 180
APRIL
227 633 151 139 418 119
MAY
223 638 164 180 467 146
JUNE
223 618 125 166 512 111
TOTAL 1444 3955 1013 1009 2877 795
1009
2877
795
MALE, FEMALE AND CHILDREN DISTRIBUTION OF ATTENDANCE
Male
Female
CHILDREN

From the chart, it can be established that All Conjunctivitis is the leading cause of attendance whilst Major injuries is
the least cause of attendance within the first half of 2017.
The table below shows the figures.
CONDITIONS JANUARY FEBRUARY MARCH APRIL MAY JUNE TOTAL
All conjunctivitis 183 213 257 185 220 220 1278
Blind Cataract 128 129 151 156 151 196 911
Glaucoma 109 81 100 97 105 108 600
Refractive Error 88 67 103 78 76 106 518
Uveitis 29 33 37 29 43 44 215
Ocular Tumors 20 13 18 24 23 24 122
Xerotic Cornea
Ulcer
13 2 0 5 11 8 39
Non-Xerotic
Cornea Ulcer
11 9 9 1 1 3 34
Cornea Opacity 3 1 3 6 5 6 24
Major injuries 7 1 7 2 2 3 22
1278
911
600 518
215 122 39 34 24 220
200
400
600
800
1000
1200
1400
Chart Of Top 10 Causes of Attendance
Top Causes of OPD

VISUAL ACUITY ROOM
CONSULTING ROOM

CLIENT BEEN GIVEN MEDICATION AT THE DISPENSARY
Optical Laboratory
The department provided services to 306 clients. Breakdown of the number of spectacles dispensed are as follows:
MONTH NUMBER
January 44
February 37
March 56
April 45
May 58
June 66
TOTAL 306

NEW OPTICAL LAB

REFERRAL CASES
Cases beyond the capabilities of the clinic are referred to the following Hospitals.
St. Michael’s Hospital (Pramso), St. Dominic Hospital (Akwatia), Kumasi South Hospital (Kumasi), and Komfo
Anokye Teaching Hospital (KATH).
The table below gives a summary of the referred cases within first half of 2017
NAME OF HOSPITAL NUMBER OF REFERRED CASES
St. Michael’s Hospital (Pramso) 27
St. Dominic Hospital (Akwatia) 1
Kumasi South Hospital -
Komfo Anokye Hospital (KATH) 4
HEALTH EDUCATION
Clients are educated on daily basis to address the issues of compliance with ocular drugs prescribed at the clinic,
proper use of the health service system and other matters of concern.
IN-SERVICE TRAINING
The Clinic within the period organized about three in-service training for the staff to ensure that each and everyone is
abreast with the proper and prescribed way of Eye care delivery. The training was very useful as it gave us the
opportunity to learn more about the importance of Visual Acuity, Ocular Emergency and customer care.
OUTREACH SERVICES
In order to provide first class Eye Treatment to all manner of persons regardless of color, creed or location, outreach
services is part of the clinic`s main activities. This is to enable us provide Eye Care Treatment to people at their door-
step.
Below is a table showing the number of outreach programs attended within the first half of 2017.

DATE VENUE NO. OF CLIENTS
SCREENED
NO. OF REFERRED CASES
21/01/17
DARBAA
64
11
18/02/17 BOURKROM
70
36
20/02/17 ANGLICAN JHS (JACHIE)
252
64
21/02/17 ANGLICAN PRIMARY
(JACHIE)
253
36
22/02/17 MAMPONG CATHEDRAL
AND BABIES HOME
94
25
23/02/17 LAKE VIEW SCHOOL
(JACHIE)
412
47
24/02/17 ANGLICAN PRIMARY
(APINKRA)
218
38
24/02/17 NNUASO ANGLICAN
PRIMARY
227
45
25/02/17 ATIEKU COMMUNITY
114
56
27/02/17 St. ANDREWS K.G (JACHIE)
213
39
28/02/17 JACHIE D/A 2 SCHOOL
523
135
01/03/17 HYBRID MONTESSORI
SCHOOL (APUTUOGYA)
100
16
07/03/17 St. MONICA’S J.H.S
( MAMPONG)
184 85
08/03/17 St. MONICA’S J.H.S
( MAMPONG)
445 96
14/03/17 St. MONICA’S S.H.S
(MAMPONG) DAY 1
314 90
15/03/17 St. MONICA’S S.H.S
(MAMPONG) DAY 2
570
209
24/03/17 MANSO ESSIENKYEM
COMMUNITY
173 26
23/05/17 JACHIE PRAMSO SENIOR
HIGH SCHOOL
494 122
24/0517 JACHIE PRAMSO SENIOR
HIGH SCHOOL
485 156
25/05/17 JACHIE PRAMSO SENIOR
HIGH SCHOOL
73 31
12/06/17 ST.ANNE’S ANGLICAN
CHURCH
36 16
12/06/17 ST. ANNE’S ANGLICAN
PRIMARY SCHOOL(DAY 1)
68 5

13/06/17 ST. ANNE’S ANGLICAN
PRIMARY SCHOOL(DAY 2)
325 63
13/06/17 ST. ANNE’S ANGLICAN
J.H.S
160 17
14/06/17 ST. ANNE’S
INTERNATIONAL SCHOOL
(PRIMARY) DAY 1
669 34
15/06/17 ST. ANNE’S
INTERNATIONAL SCHOOL
(PRIMARY) DAY 2
72 3
15/06/17 ST. ANNE’S
INTERNATIONAL SCHOOL
(J.H.S)
168 22
TOTAL 6776 1523
EYE SCREENING AT THE OUTREACH PROGRAM

FREE EYE SCREENING FOR STUDENTS
ADMINISTRATION, FINANCE AND SUPPORT SERVICES
Governance
The Anglican Eye Clinic has at its apex, the Board of Trustees which oversees the management of the Clinic at the
Diocesan level. Internally, the Management Team is in charge of the daily running of the Clinic. They are supported
by a number of Committees which include Unit Heads, Procurement Committee, Quality Assurance and Clinical
Team.
Finance
The clinic is run with internally generated fund and proceeds from the NHIS. It is however worth noting that most of
these funds are from the NHIS and as a matter of fact delays in payment causes the clinic to delay lots of its planned
activities. The last payment received from the National Health Insurance Authority was for the month of May 2016.
The Clinic also benefits from donations both in cash and in kind in the form of equipment from Benefactors from
around the World.

ADMINISTRATION AND ACCOUNTS DEPARTMENT
REVENUE SECTION

Receipts
INDICATORS January February March April May June Total
Drugs 19,268.00 19,750.00 26,551.00 19,411.00 23,087.00 24,674.00 132,741.00
Non – drugs 9,879.00 9,471.00 12,155.00 9,371.00 10,851.00 11,259.00 62,986.00
Refraction / Lenses
and frames
10,047.00 8,548.00 10,957.00 12,065.00 9,147.00 13,282.00 64,046.00
Salary ( G.O.G ) 22,788.35 22,788.35 20,895.95 21,008.99 21,911.75 21,452.70 130,846.09
NHIS Claims 370.71 317.79 267.66 222.84 214.83 180.18 1,574.01
Others _ _ 350.00 _ _ 100.00 450.00
Total 62,353.06 60,875.14 71,176.61 62,078.83 65,211.58 70,947.88 392,643.10
Expenditure
Expenditure incurred during the period under review is tabulate below:
INDICATORS January February March April May June Total
Personal
emoluments
(GoG)
22,788.35 22,788.35 20,895.95 21,008.99 21,911.75 21,452.70 130,846.09
Personal
emoluments
(IGF)
13,819.59 13,869.59 13,753.99 13,843.59 13,849.59 13,689.59 82,825.94
General and
Administrative
expenses
33,376.12 27,048.28 13,282.63 20,151.03 27,247.72 3,286.00 124,391.78
Investment
expenses
_ _ _ _ _ _ _
Refraction
expenses
18,975.24 5,510.71 13,852.75 8,043.60 10,013.27 4,276.00 60,671.57
Total 88,959.30 69,216.93 61,785.32 63,047.21 73,022.33 42,704.29 398,815. 38

Personal Emoluments paid consists of staff salaries paid by the Government of Ghana and Internally Generated
Funds from the Clinic. General and Administrative expenses cover all supplies and service charges, whilst
investment expenses have to do with capital costs related to infrastructure.
QUALITY ASSURANCE
Management put in place a systematic and planned approach to assessing, monitoring, and improving the quality of
health service on a continuous basis so that the care provided was effective and safe. This included:
Adherence to standard safety practices. The various protocols in administering clinical care were
strictly adhered to. The use of these standard precautionary measures included:
Decontamination, washing, air drying and sterilization of instruments.
Aseptic technique in performing all procedures
Proper hand washing technique.
Daily dusting and disinfection of all contact surfaces.
Wearing of protective clothing in performing all procedures.
Improving relationship with clients.
Frequent organization of meetings.
Fastidious and religious administration of drugs.
Proper disposal of sharps
Proper documentation and administration of prescribed drugs

SUPPLY OFFICER AT THE STORE
CHALLENGES AND CONSTRAINTS
One of the major challenges the eye clinic encountered was the erratic flow of NHIA
disbursement. As a result, the clinic was indebted to most of its suppliers.
The clinic has a sizeable portion of its staff being paid from the Internally Generated Funds.
The clinic uses its meager resources to pay them at the expense of essential services.
Irregular and unstable power supply affected the performance and the durability of
equipment.
Non-availability of internet services for research purposes.
Pressure on existing infrastructure and other resources because of increase in patient
numbers.
Delays in payroll mechanization of professional staff.
Conclusion
In conclusion, we have prioritized below our strategies/way forward to enhance the efficiency and capacity
of the Anglican Eye Clinic, Jachie.
Lobby MOH/CHAG for professional staff to be mechanized.
Intensify in-service training for staff
Continue harmonizing relationship with NHIS to ensure prompt payment of submitted claims.
Seek support from donors and sponsors for provision of essential equipment and to purchase some through
IGF.


