ANHYDROUS AMMONIA FR.OM THE U.S.S.R. Report to the President on Investigation No. TA-406-6, Under Section 406 of the Trade Act of 1974 USITC PUBLICATION 1051 APRIL 1980. United States International Trade Commission I Washington, D.C. 20436
Transcript
ANHYDROUS AMMONIA FR.OM THE U.S.S.R.
Report to the President on Investigation No. TA-406-6, Under Section 406 of the Trade Act of 1974
USITC PUBLICATION 1051
APRIL 1980.
United States International Trade Commission I Washington, D.C. 20436
UNITED STATES INTERNATIONAL TRADE ·COMMISSION
COMMISSIONERS
Catherine Bedell, Chairman
·Bill Alberger, Vice .Chairman George M. Moore Paula Stern Michael J. Calhoun
Kenneth R. Mason, Secretary . to the Commission·
This report.was prepared by
Abigail Eltzroth
Tedford Briggs
· William Gearhart
Roger Pomeroy
Lynn Featherstone, Supervisory Investigator
Address all communications to Office of the· Secretary
United States International Trade Commission
Washington, D.C. 20436 ·
C 0 N T E N T S
Report to the President-------------------------------------------------Statemen t of reasons of Commissioner Paula Stern and Vice-Chairman
Bill Alberger---------------------------------------------------------Opinion of Commissioner Michael Calhoun--------------------------------S tatemen t of reasons for the affirmative determination of Chairman
Catherine Bedell and Commissioner George M. Moore---------------------Summary-----------------------------------------------------------------Information obtained in the investigation:
Introduction-------------------------------------------------------Description and uses------------·-----------------------------------Produc tion process-~----------------------------------------------The petitione~s-------------~--------------------------------------The domestic industry and the U.S. market---------------------------U.S. tariff treatment-----------------------------------------------The ammonia industry of the U.S.S.R.-------------------------------
The Occidental-U.S.S.R. agreements-----------------------------The Eximbank' s market analysis--------------------------·----;..--
The grain embargo---------------------------------------------------The phosphate embargo----------------------------------------------The ILA boycott-----------------------------------------------------
. World capacity and consumption-------------------------------------The question of rapidly increasing imports-------------------------
Nitrogen trade balance----------------------------------------~ U.S. importers---------------------------------------~----------
The question of material injury or threat thereof: U.S. capacity, production, and consumption-------------------;.. __ Swaps--------------------------------------- -------------------U.S. plant expansions and closings------------------------------Inventories----------------------------------------------------Employment------~-----------------------------------------------Capi tal expenditures------------------------------------------·---Profit and loss------------------------------------------------Return on investment··-- ---------------:---·---------------.,.--------
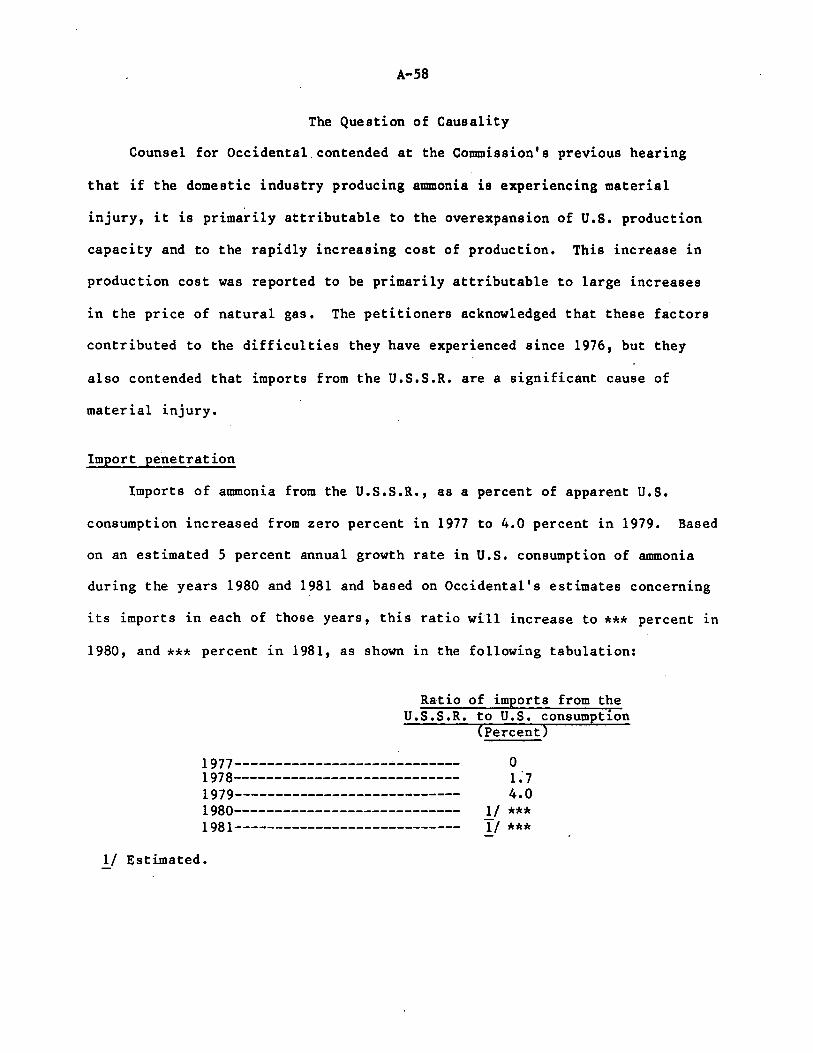
The question of causality-------~-----------------------------------Imp ort penetration-·--------------------------------------------Overe xpans ion of the U.S. industry------------------------------Co st of product ion-------··-·----------------------------.,.--------Pr ices---------------------------------------------------------Lost sales-----------------------·---·--------------------------
Appendix A, The President's letter-----------------------;..-------------Append ix B. The Commission's notice of investigation and hearing-------Appendix C. The Commission's previous ammonia determination------------Appendix D. The President's ·December 11, 1979, and January 18, 1980,
ammonia determinations----------------~~-----------:-------------------;.. Appendix E. Ammonia production process-------------·--·------------------· Appendix F. U.S. production facilities-~-------------------------------Appendix G. Anaylsis of the Occidental-U.S.S.R. agreements by the
General Counsel's office-----~----------------------------------------
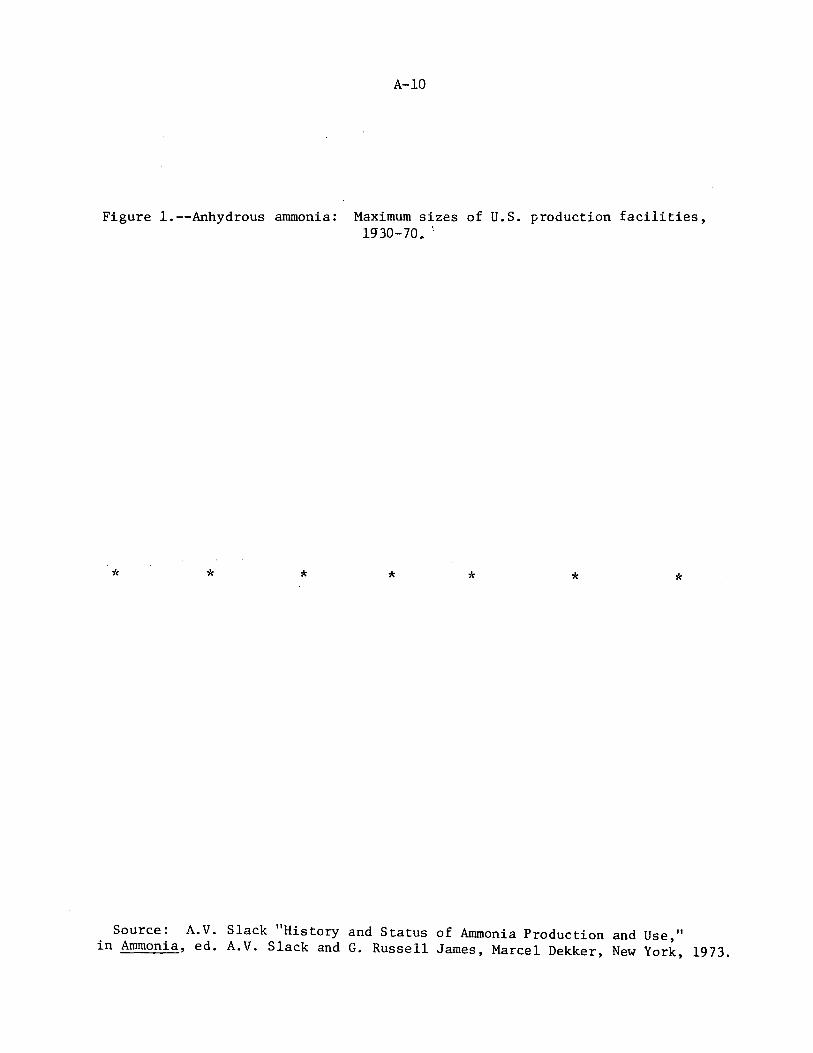
1. Anhydroµs--allDDonia: . Maximum sizes· of U:.·~· 'pr:oduction facilities, . 1930-70---------------~~..;._.:..~~:.:.. _ _.~--------------------------------- A-10
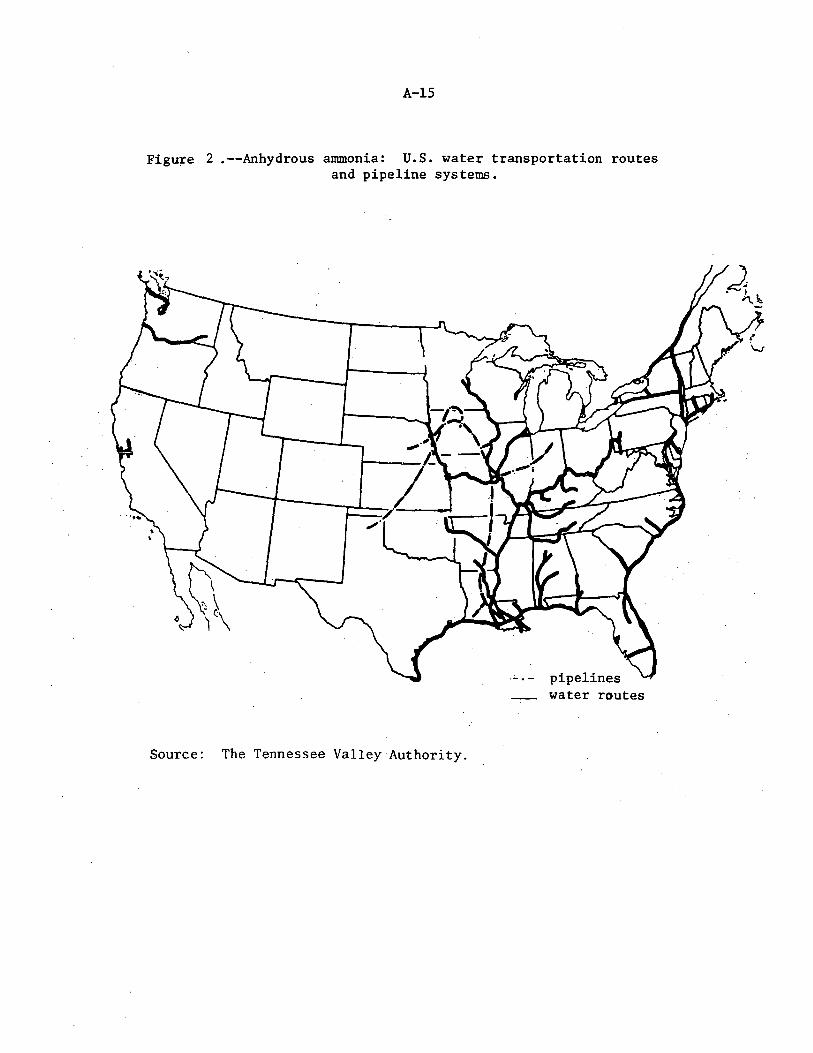
2. Anhydrous alJDDonia: U.S. wat·er transportation routes and pipe-line systems--~--------------~-..:..--:-----~-----""'.-------------------- A-15
3. Location of facilities in the U.S."$.R. associated. with the O.cc identa 1-U • S. S .R. dea 1-------.:..---------:--:--..,---------------------- A-23
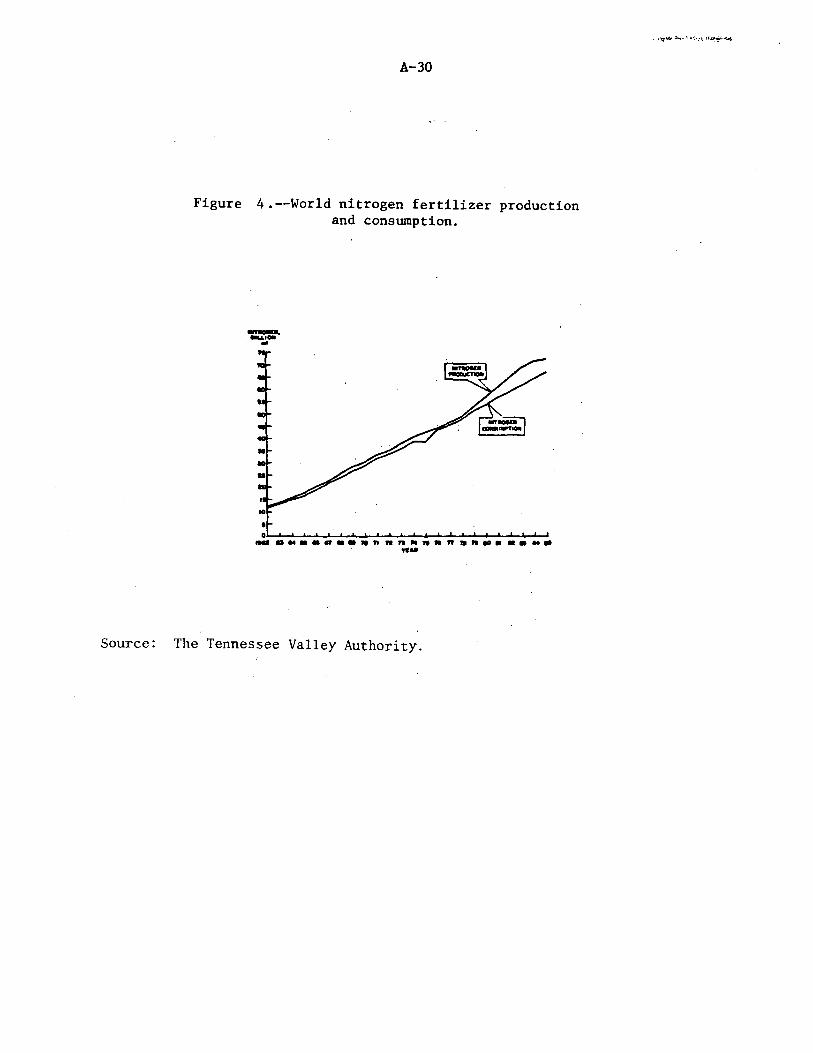
4. World nitrogen fertilizer production and consumption---------------- A-30 5. Anhydrous SllDDonia: U.S. production capacity and production,
(>. ·,u.s. fertilizer manufacturers' ·inventories of nitrogenous fertilizers, 197 4- 79- · -------------------- ----:----.------------------ A- SO
J. Anhydrous ·ammonia: U~S. pr9dhcers .. '. average unit value of their · shipments, average cost of production, an~ average ·price ne'eded
.... , for a-20-percent return on. 'invesbnen.t,_ 1973-78-----------.:.. _____ ..:, ___ A-57 8-. Anhydrous -allDDonia: U .s. producers' average unit val~e of their ;
shipments,- average cost of pro~uction, and average cost of · . , na tu ra 1 -gas , ·197 3- 7 8--~:-- ---;--:::--------,-- --------·· ------------------ A-60
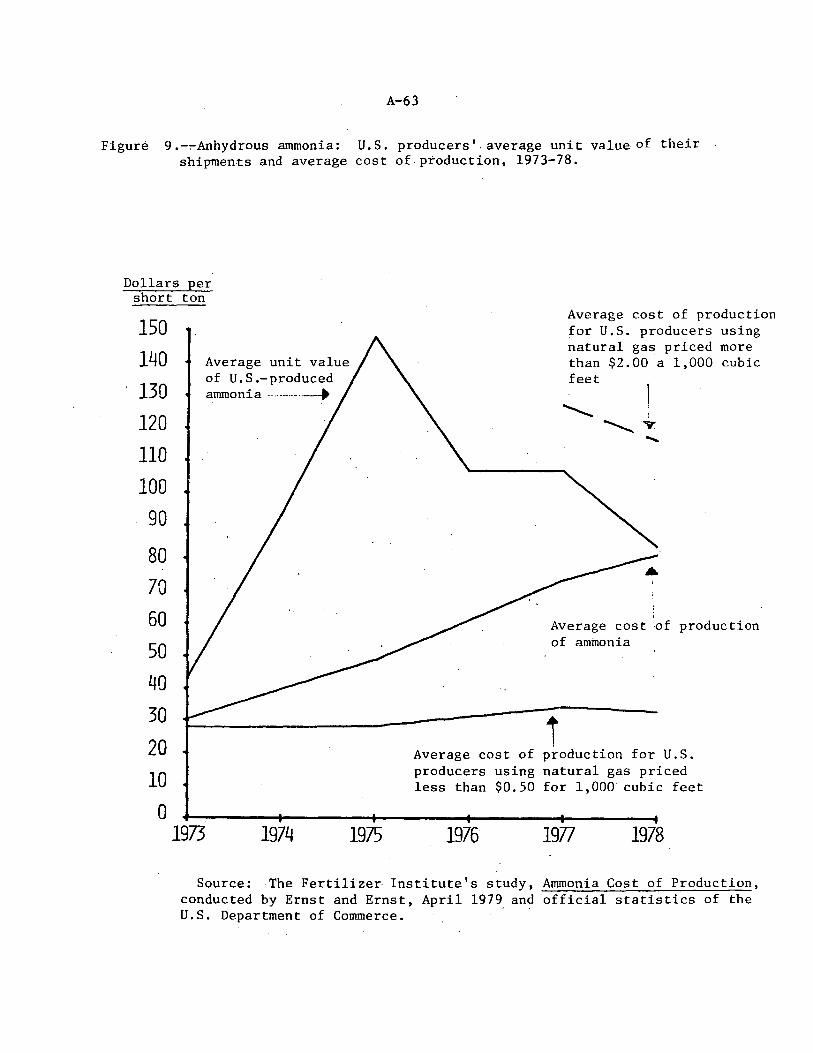
9o<' Anhydrous SllDDonia: U~S. produc~rs' average unit value of their· . shipments· artd average cost of production, .1·973-78------------------ A-63
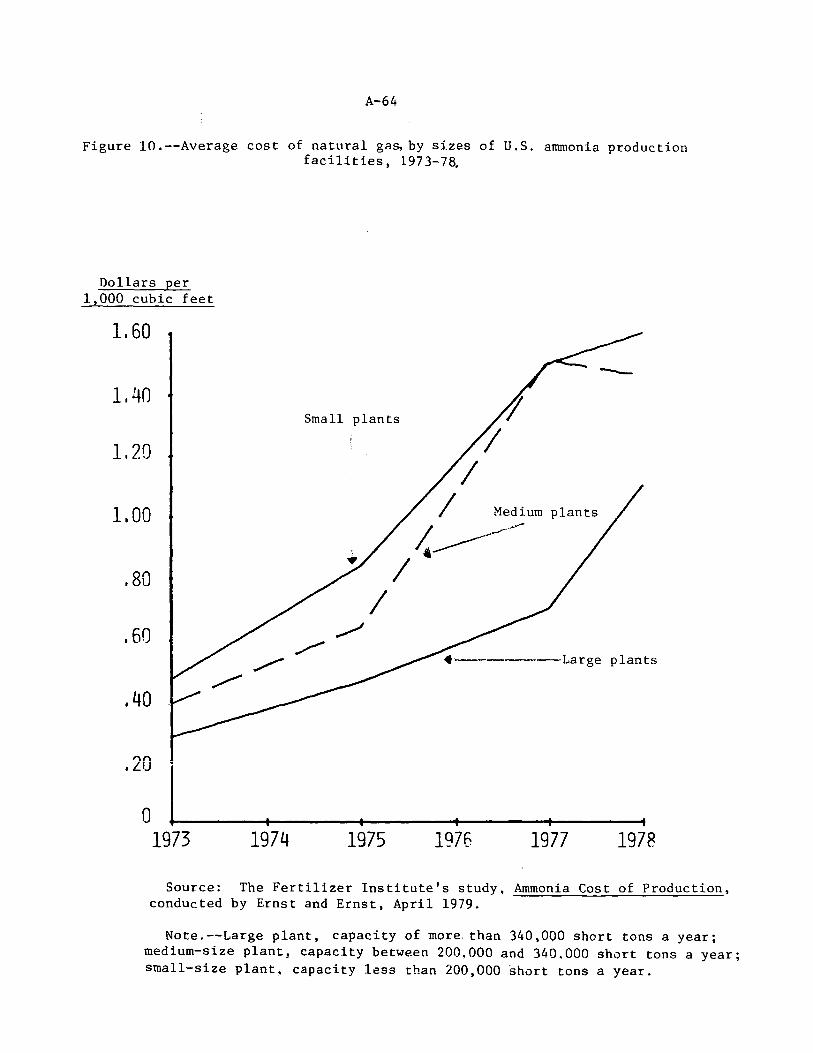
10 .• Average .. co·s"t of natural gas, by s.izes of U.S. a1JDD0nia production facilities, 197 3:.:.. 78------:--::_: __ -=.::·_..:. _____________ .._ ___________ :.. _______ A-64
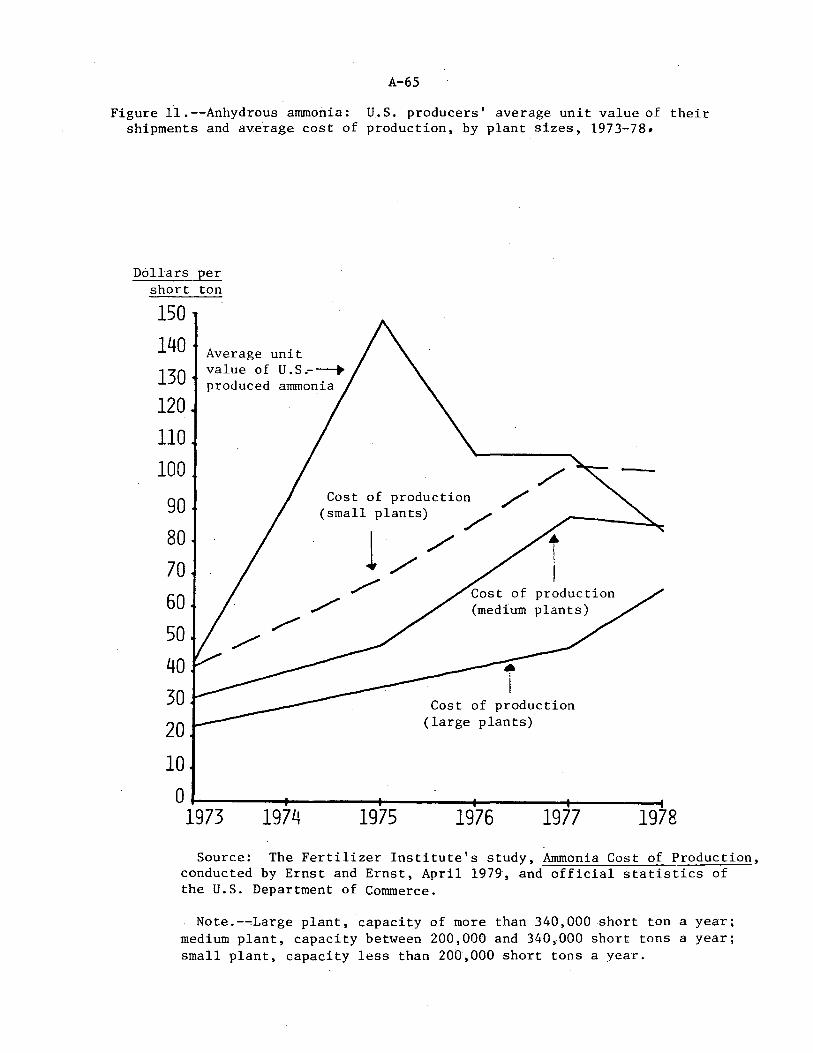
11.-.. Anhydrous ammonia: tJ~s. proqucers '··average unit ·value of their · shipments ·and average cost of prqduction, by plant sizes' 1973-78--------------------~-------------------------~----------- A-65
. ,. . '
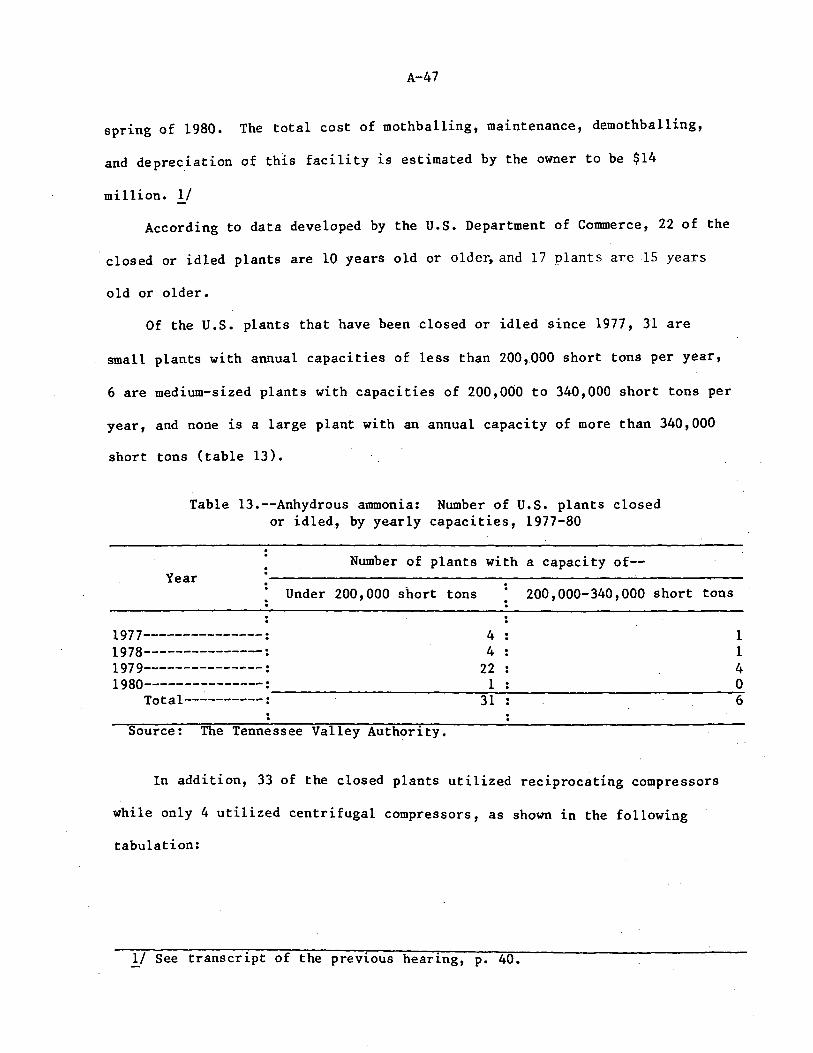
12. Anhydrous·aimnania:'" ti.s. producers' wholesale p·rice index, by .·months, January 1974:-February 1980--"'.":-'--:-------------------------- A-69
2 •. Vertical _integt;ation of U.s.· anhy'drous .. atmnonia firms,: 1975-"77------- A-13 3. Anhyqrous. ammonia-: .. Acttial·and predicted world production capacity,. .
by regions, 1967, 1970, and 1973-82----:------.-------- ---:--:-------- ·A-29 4. Anhyd_rou~ __ ammonia: U.S. imports for consumption, by principal
. · sour~es ,_ .1.97 4- 79------ ---------:.:..-------·--·--"'."---- ----,-----c---~---:....:.._ A-32 5. 1'nhydroµ_.i; .ammonia: Ratio of U; S. imports from all sources and
· · from the U. S .S .R. to apparent' U .-s. consumption, .1974-79-----------'- A-33
iii
CONTENTS
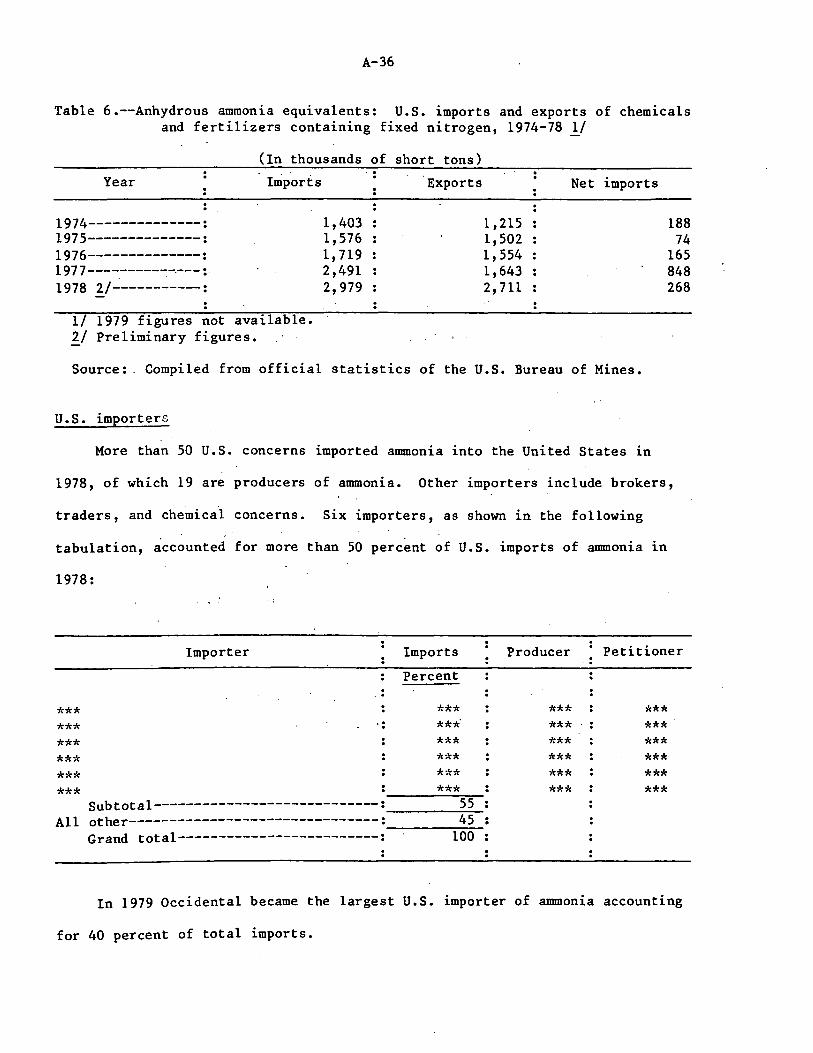
6. Anhydrous ammonia equivalents: U.S. imports and exports of chemicals and fertilizers containing fixed nitrogen, 1974-78------ A-36
7. Anhydrous ammonia: U.S. production capacity, production, and capacity utilization, 1973-80------------------------------------- A-37
8. Anhydrous ammonia: U.S. producers' domestic shipments and intracompany transfers, imports, and apparent consumption 1974-80------ A-40
9. Anhydrous ammonia: U.S. producers' beginning inventories, production, imports, consumption, exports, and producers' ending inventories, fertilizer years 1978/79 and 1979/80--------- A-41
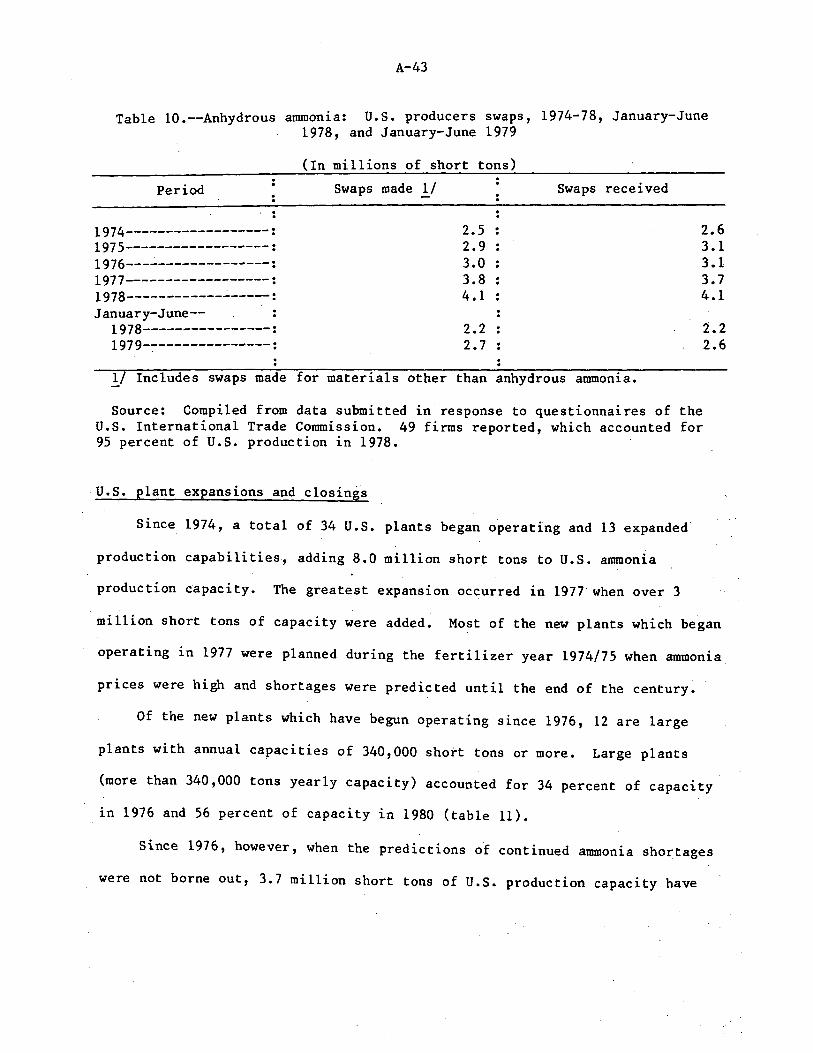
10. Anhydrous .ammonia: U.S. producers' swaps, 1974-78, January-June 1978, and January-June 1979--------------------------------- A-43
11. Anhydrous ammonia: U.S. production capacity, by plant sizes, 197 4-80------·-- ------------------------------ ---- ----------------- A-45
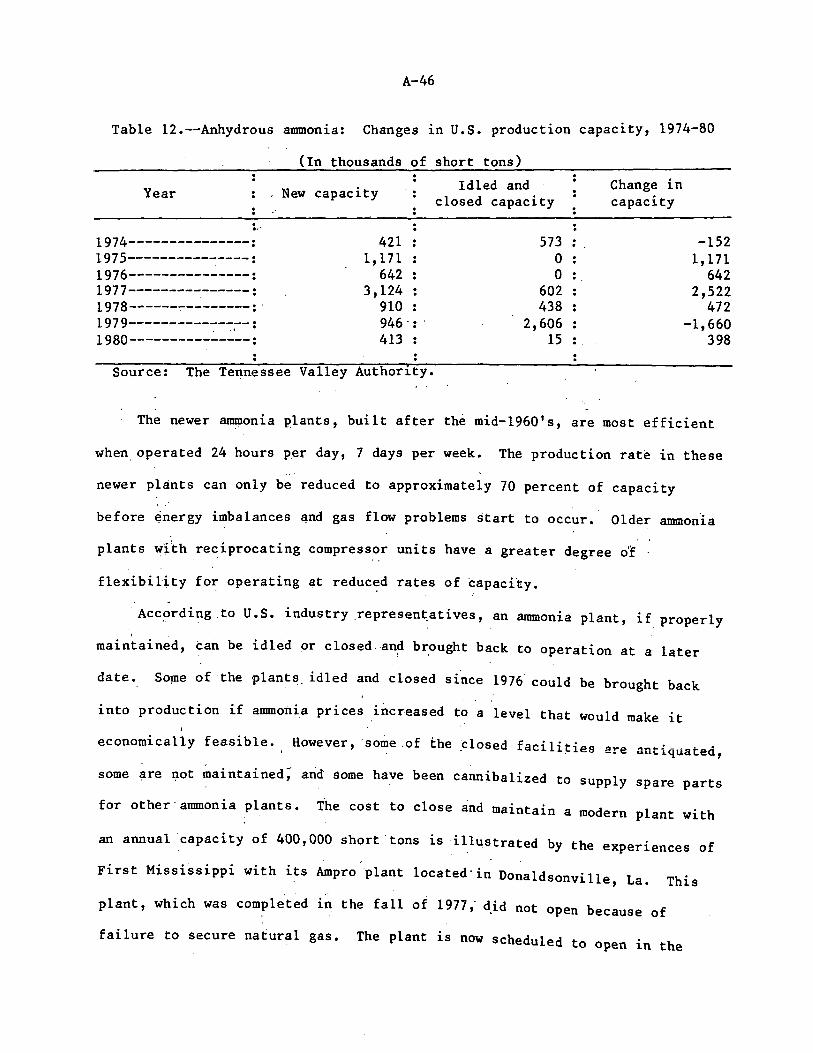
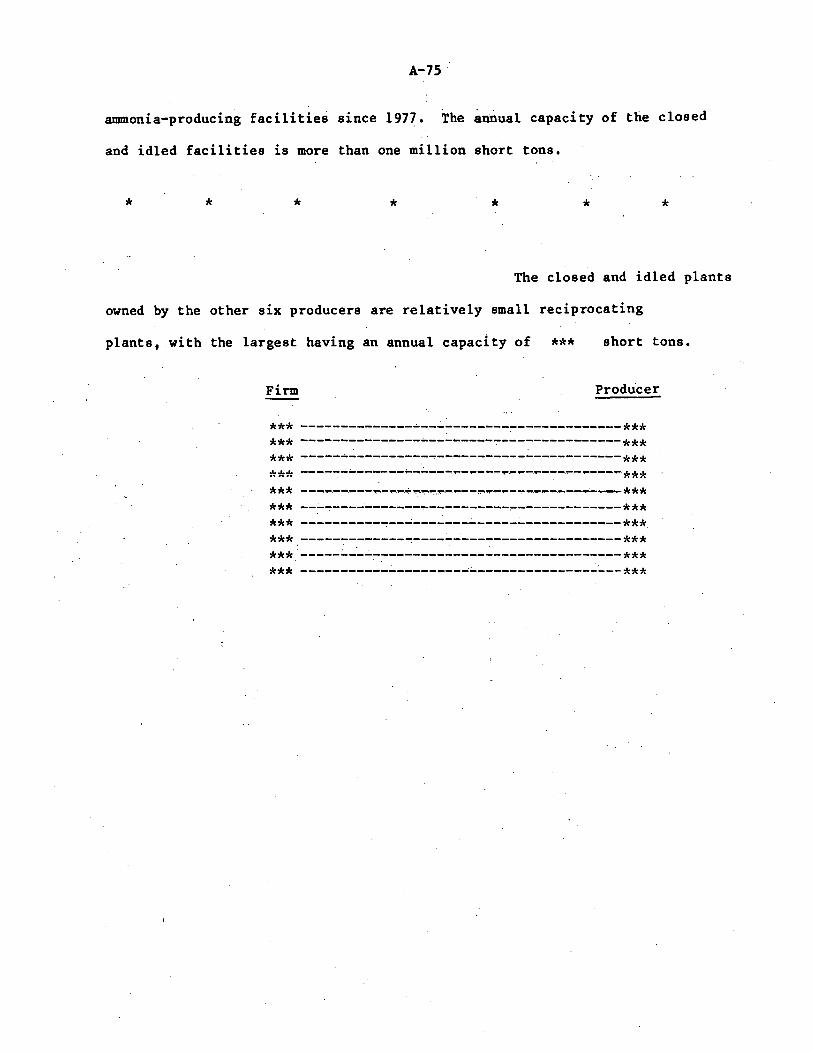
12. Anhydrous ammonia: Changes in U.S. production capacity, 1974-80---- A-46 13. Anhydrous ammonia: Number of U.S. plants closed or idled, by .
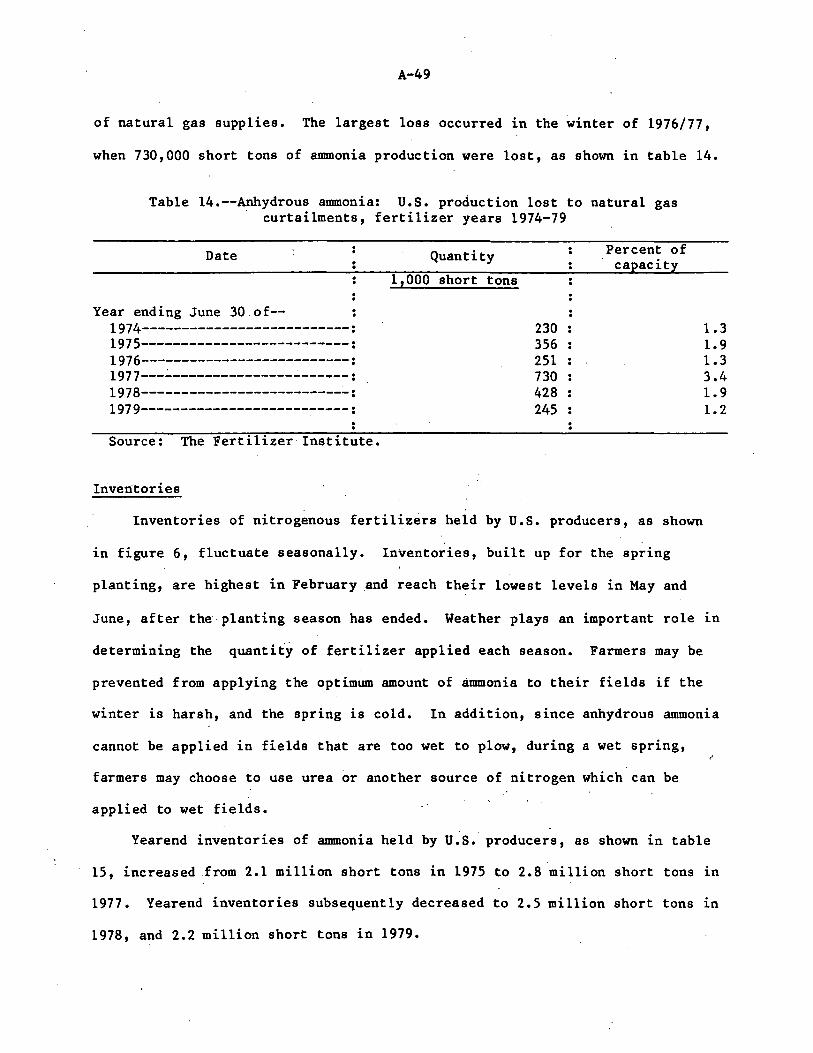
yearly capacities, 1977-80---------------------------------------- A-47 14. Anhydrous ammonia: U.S. production lost to natural gas
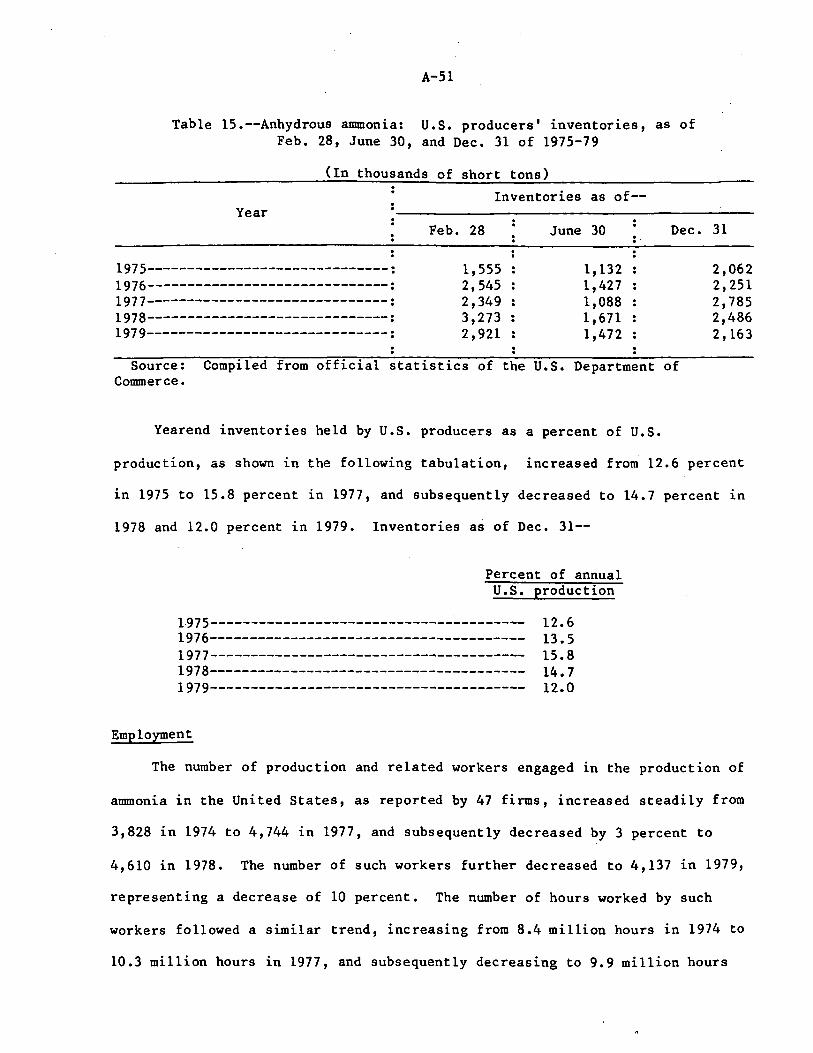
curtailments, fertilizer years 1974-79---------------------------- A-48 15. Anhydrous ammonia: U.S. producers' inventories, as of Feb. 28,
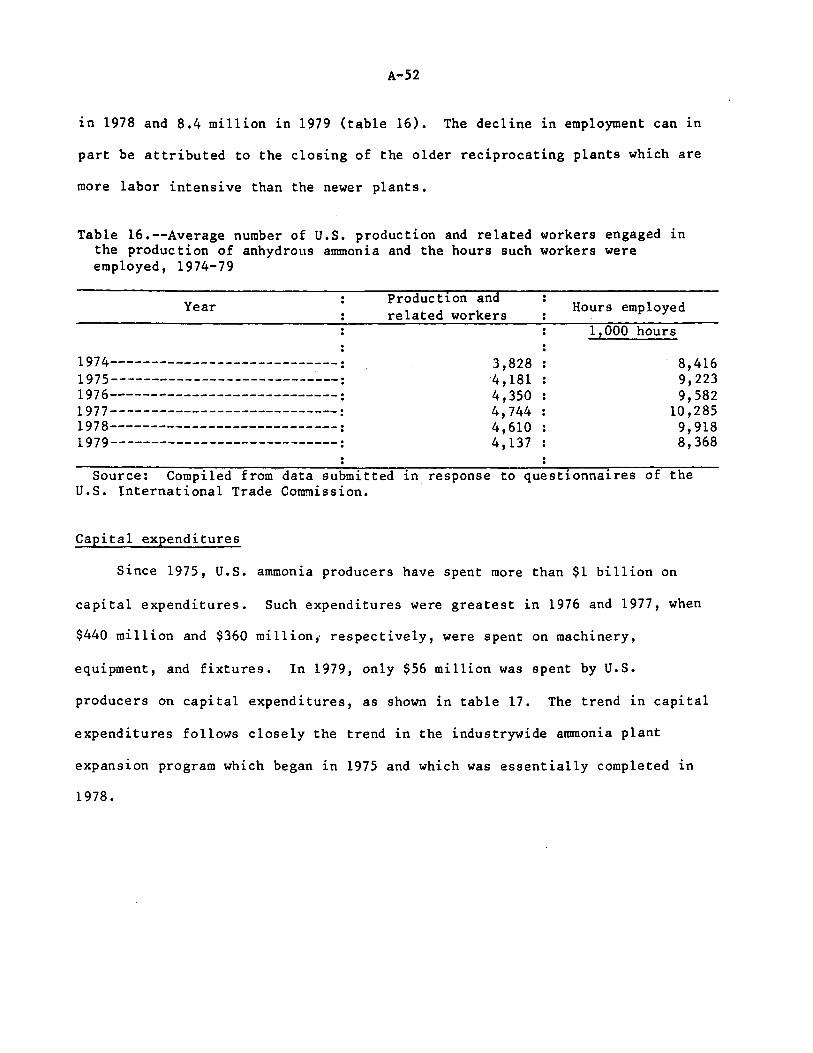
June 30, and Dec. 31 of 1975-79----------------------------------- A-51 16. Average number of U.S. production and related workers engaged
in the production of anhydrous ammonia and the hours such workers were employed, 1974-79-- ------·---------- ----------------------- A-52
17. Anhydrous ammonia: U.S. producers' capital expenditures, 1975-79----~------------------·-~----~--------------------------- A-53
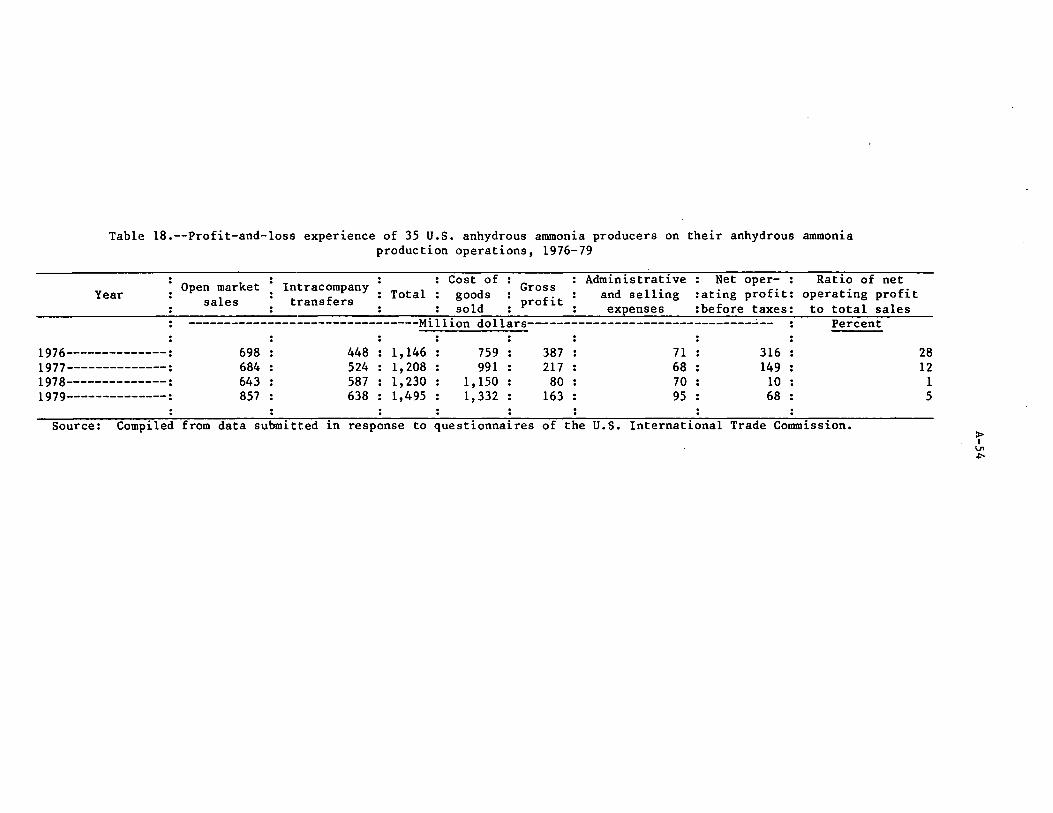
18. Profit-and-loss experience of 35 U.S. anhydrous ammonia producers on their anhydrous ammonia production operations, 1976-79--------- A-54
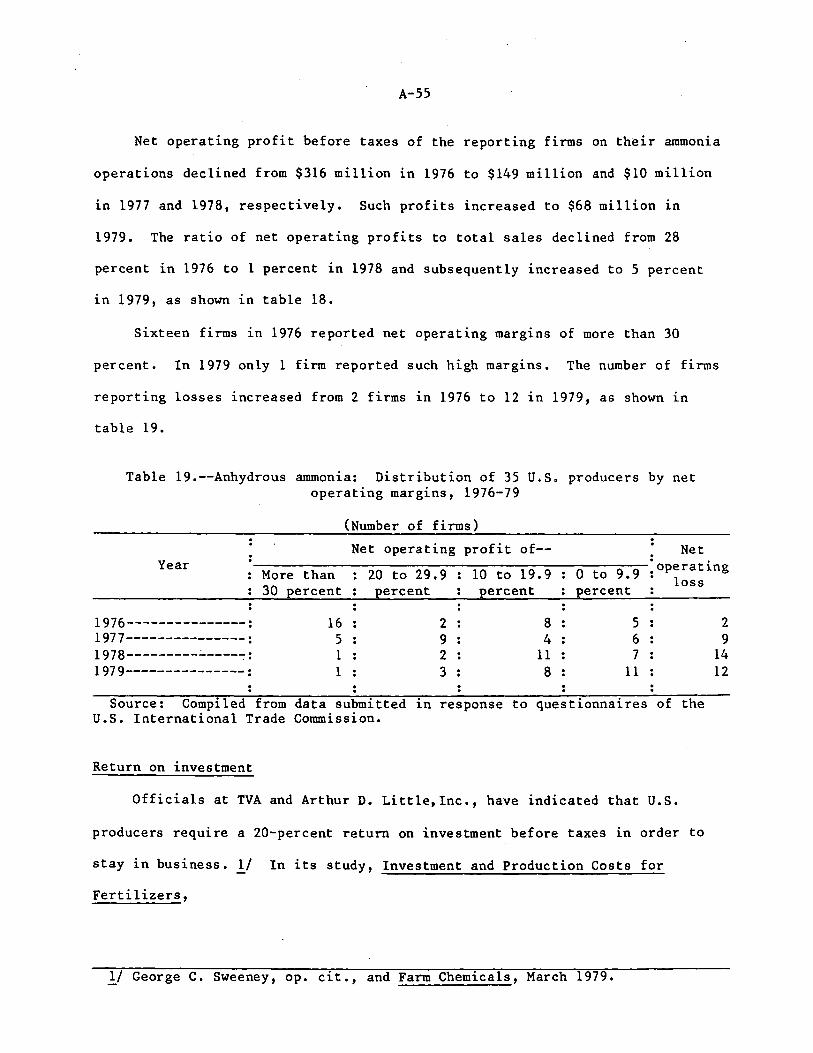
19. Anhydrous ammonia: Distribution of 35 U.S. producers by net operating margins, 1976-79---------------------------------------- A-55
20. Anhydrous ammonia: U.S. plant capital costs and cost per ton of annual installed capacities, 1974-77---------·------------------ A-56
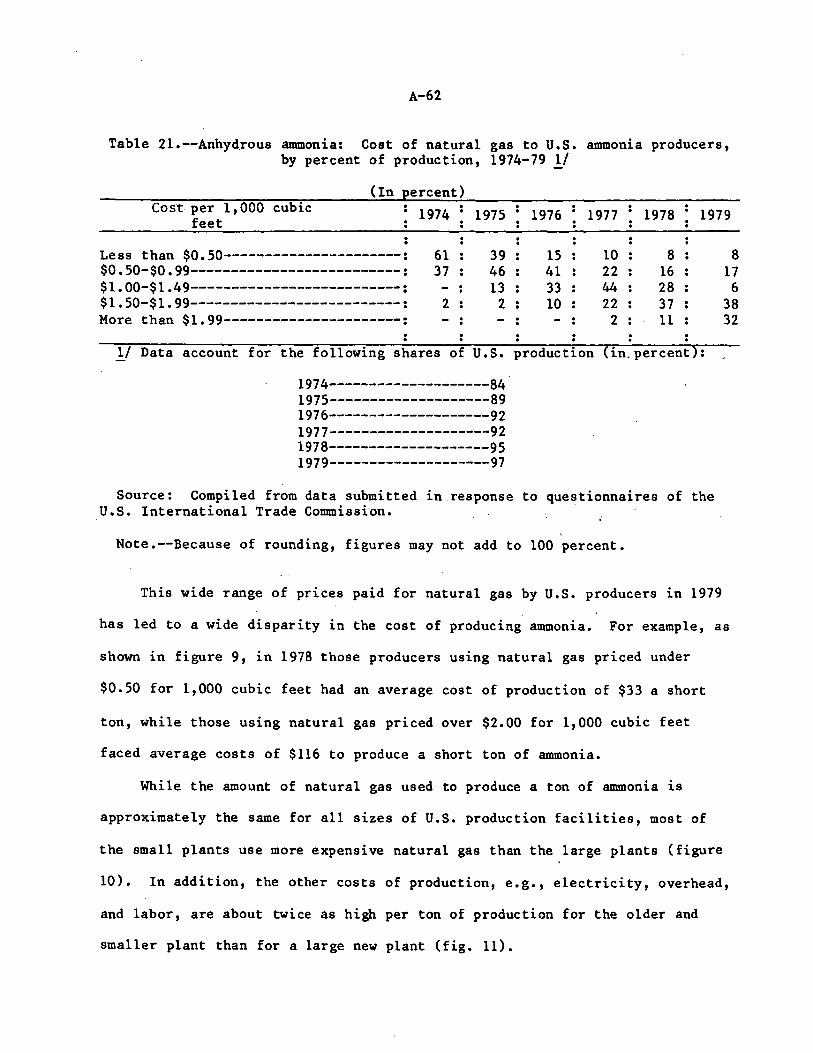
21. Anhydrous ammonia: Cost of natural gas to U.S. ammonia producers, by percent of production, 1974-79-- -----------·- ----------------- A-62
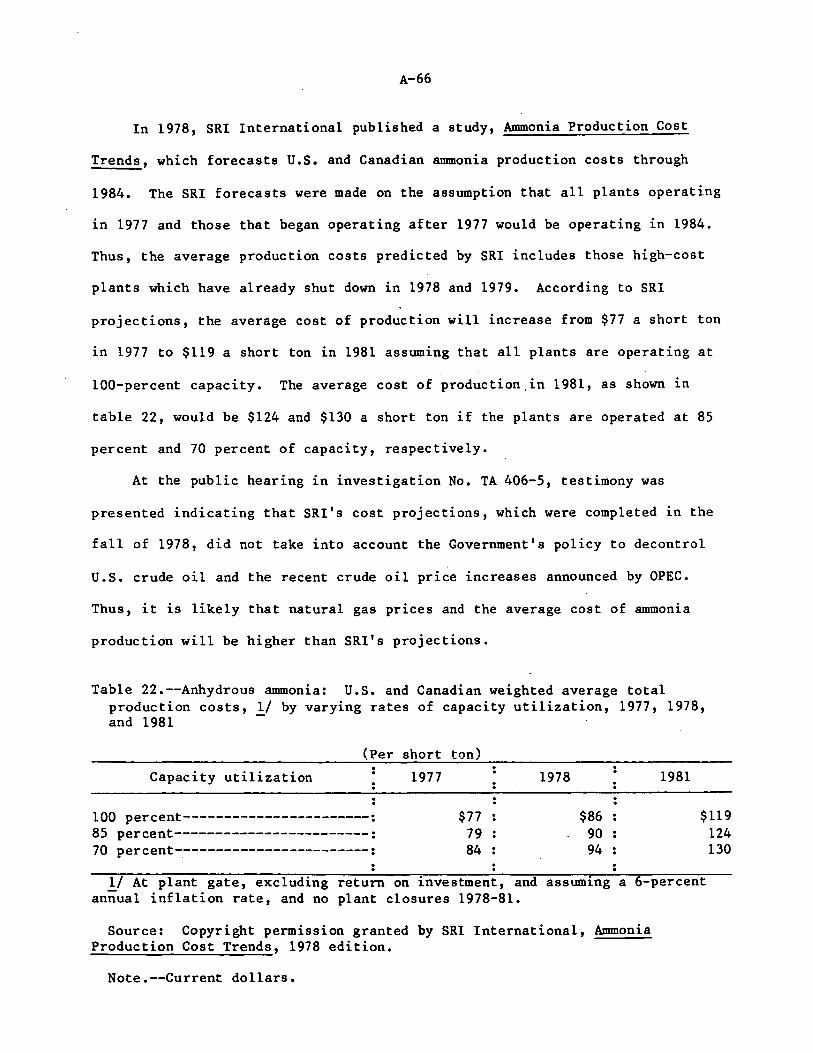
22. Anhydrous ammonia: U.S. and Canadian weighted average total production costs, by varying rates of capacity utilization, 1977, 1978, and 1981---------------------------------------------- A-66
23. Anhydrous ammonia: U.S. gulf coast projected spot prices, by quarters, January 1980-June 1981---------------------------------- A-73
Note.--The whole of the Commission's report to the President may not be made pbulic since it contains certain information that would result in the disclosure of the operations of individual concerns. This published report is the same as the report to the President, except that the above mentioned information has been omitted. Such omissions are indicated by asterisks.
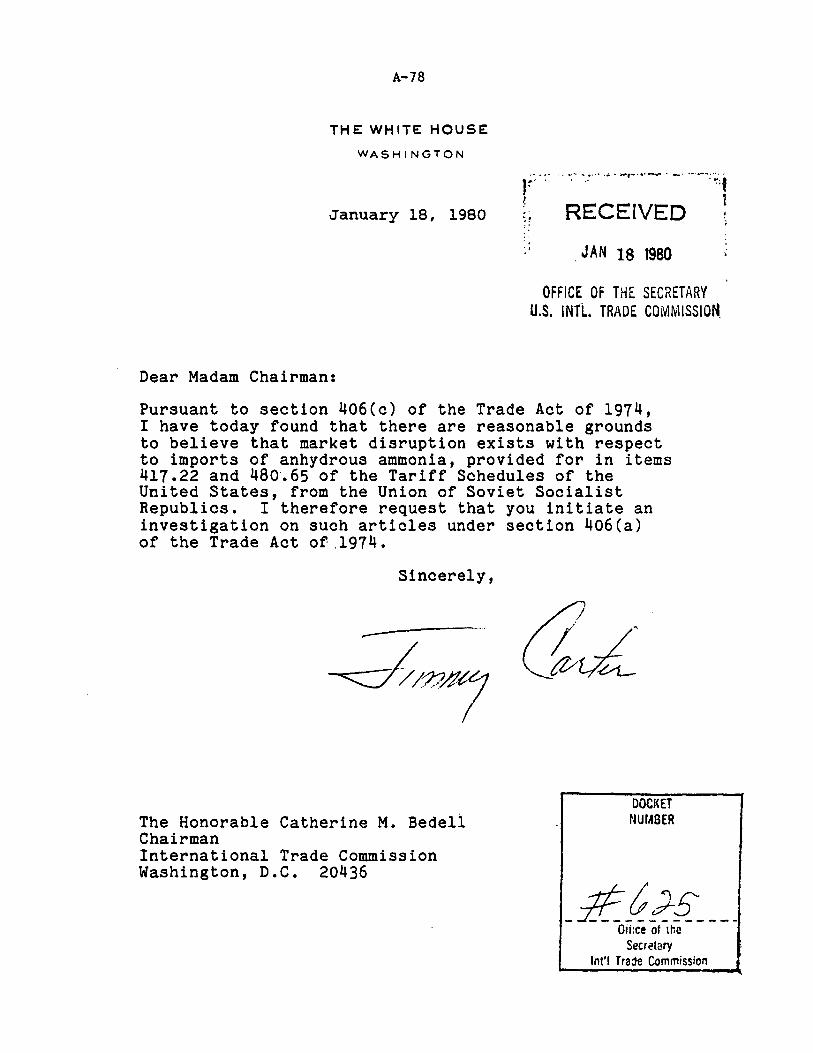
To the President:
REPORT TO THE PRESIDENT
United States International Trade Commission
April 11, 1980
In accordance with section 406{a) of the Trade Act of 1974 (19 U.S.C. 2436(a)),
the United States International Trade Commission herein reports the results of an
investigation relating to anhydrous ammonia (ammonia) from the U.S.S.R. The investi
gation {No. TA-406-6) was undertaken to determine, with respect to imports of
ammonia, provided for in items 417.22 end 480.65 of the Tariff Schedules of the
United States (TSUS), which is the product of the U.S.S.R., whether market dis
ruption exists with respect to an article produced by a domestic industry.
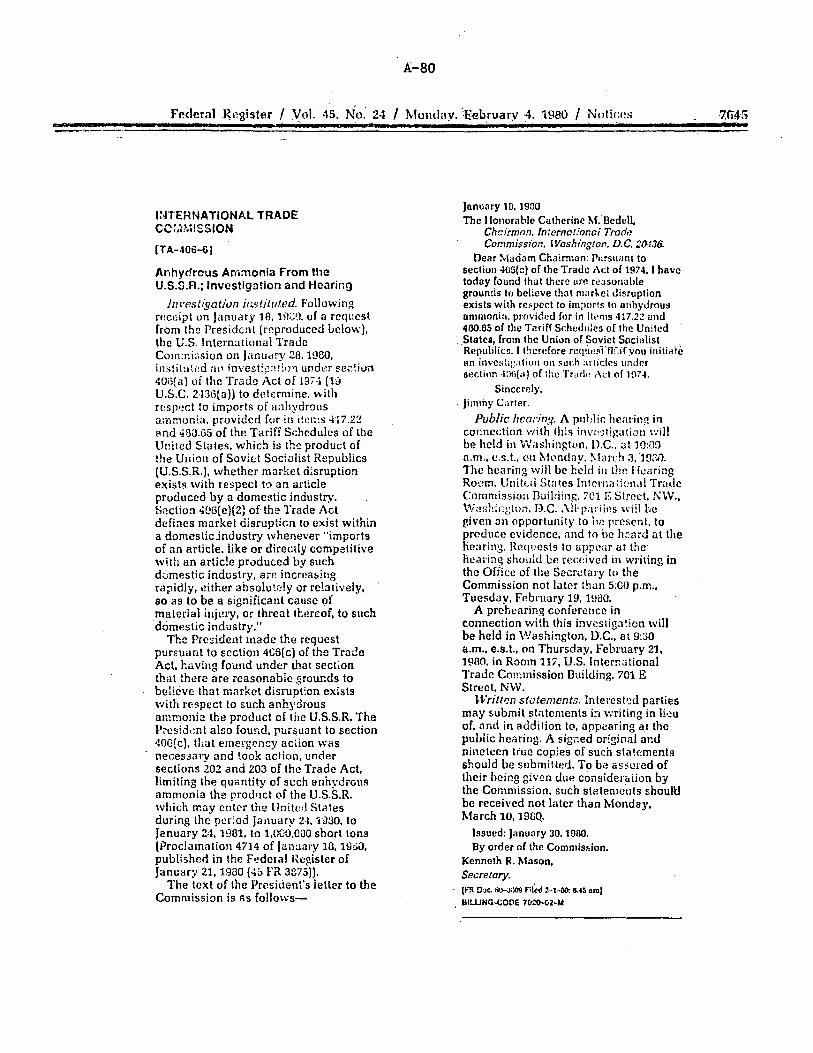
The Commission instituted the ~nvestigation on January 28, 1980, following
the receipt on January 18, 1980, of a request from the President to institute an
investigation. The President made the request pursuant to section 406(c) of the
Trade Act, having found under that section that there are reasonable grounds to ·
believe that market disruption exists with respect to such anhydrous ammonia the
product of the U.S.S.R. The President also found, pursuant to section 406(c),
that emergency action was necessary and took action, under sections 202 and 203
of the Trade.Act, limiting the quantity of such anhydrous ammonia the product of
the U.S.S.R. which may enter the United States during the period January 24, 1980,
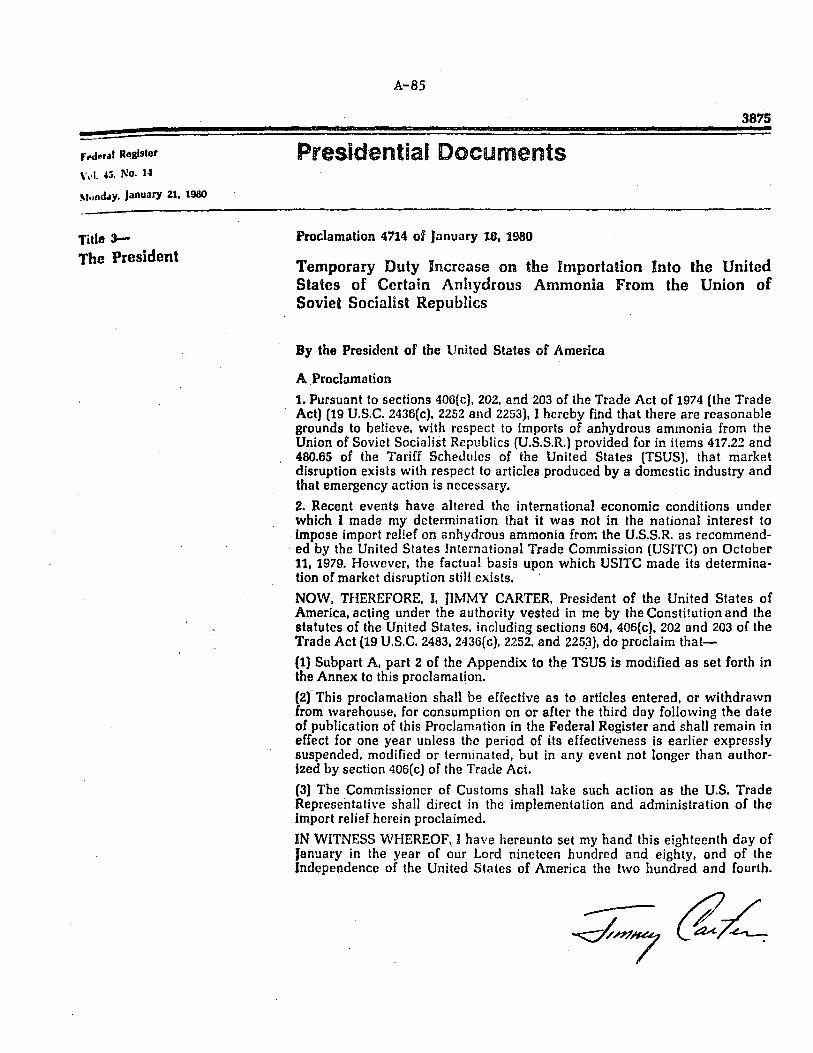
to January 24, 1981, to 1,000,000 short tons (Proclamation 4714 of January 18, 1980,
published in the Federal Register of January 21, 1980 (45 FR 3875)). The Commission
held a public hearing on this matter in Washington, D.C. on March 3, 1980. Notice
of the institution of the investigation and of the public hearing was published in
the Federal Register of February 4, 1980 (45 FR 7645).
2
The information in this report was obtained from fieldwork and interviews -
by members of_ the Commission's staff, from other Federal agencies~ from
responses to t~e Commission'~ questionnaires, from information presented at.
the public hearing, from briefs submitted by interested parties, and from the
Commission's files.
A transcript of the hearing and copies of the briefs submitted by interested
parties in connection with this investigation are attached.
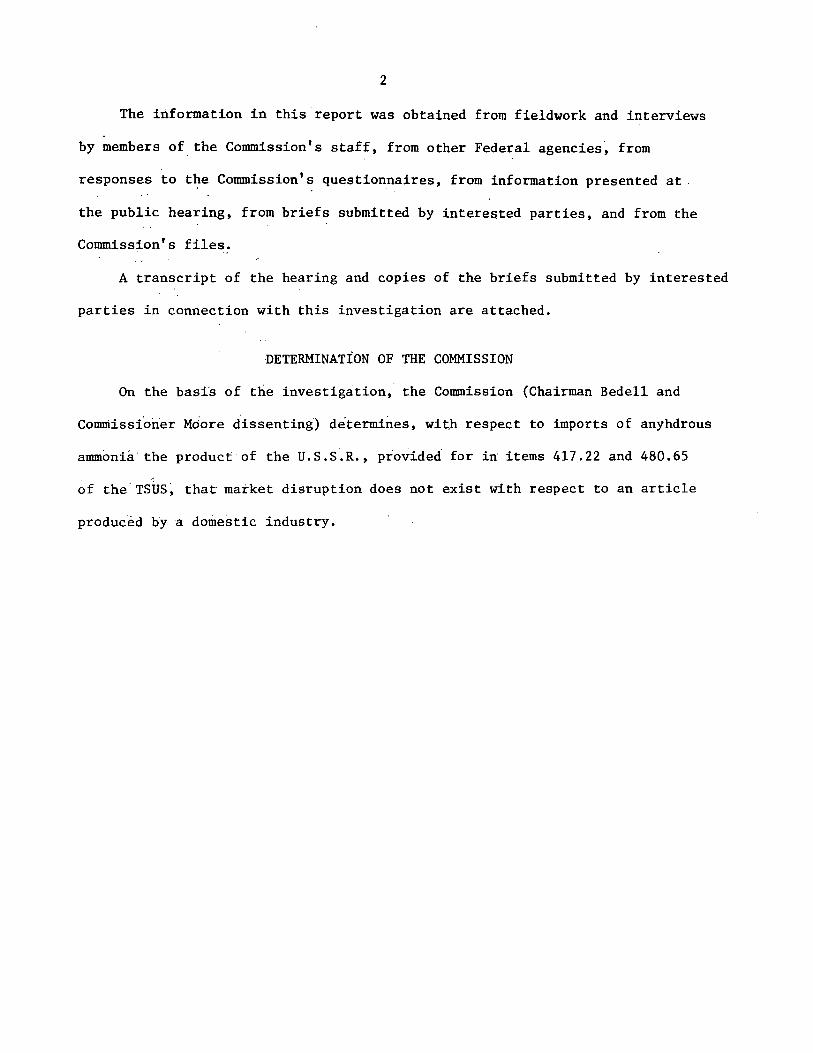
DETERMINATION OF THE COMMISSION
On the basi's of the investigation, the Commission (Chairman Bedell and
Commissioner Mdore dissenting) determines, wit.h respect to imports of anyhdrous
ammonia· the product of the U.S.S.R., provided for in items 417.22 and 480.65
of the.TSUS~ that market disruption does not exist with respect to an article
produced by a domestic industry.
3
STATEMENT OF REASONS OF COMMISSIONER PAULA STERN AND VICE-CHAIRMAN BILL ALBERGER
On the basis o.~ _the information devel~p_ed d_4ring the course of this
investigation, we determine that market \fisruption p.~ defined in Section 406 .
of the Trade Act of 1974 (Trade Act) 1/ _do.es not exist wi.th r~spect to imports : . ". ·': . --: :
of anhydrous ammonia from the Union of Soviet Socialist .R,epub.l~cs (U.S.S .• R.).
Background
The U. S. In'ternationcil Trade C01mnission (Commission) conducted the
present investigation at the request of the President. on' January 18~ 1980,
the President announced that pursuant to Section 406(c) of the Trade Act, he
found "reasonable grounds to believe" that market d1sruption existed with
respect to imports. of Soviet ammonia. 2/ In 'conJunction with thi.'s finding,
the President imposed an interim qu~ta limiting imports of anunonia from the
U.S.S.R. to 1 million short .tons for the year beginning ja~uary 24°, 1980~
This emergency action, taken as if the Commission had made an affirmative
determination, will cease to apply on the day on which the present negative
determination is submitted to the President •. 3/.
This is the second Section 406 invest_ig~tion. which the Commissio.n has ·;
conducted within the last half year of imports on. ~ovie_t ammonia. On
October 11, 1979, the Commission found by a three-to-two majority that mar-. .. ~ . . . ' .
ket disruption existed. We strongly. dissented from that de_terminatio,n. ~/
1/ 19 u.s.c. 2436. Z/ Presidential Proclamation No. 4714, 45 F.R. 3875 (1980). 3/ 19 U.S.C. 2436(c)(l). ~/ United States International Trade Commission, Anhydrous Ammonia from the
U.S.S.R.: Report to the President on Investigation No. TA-406-5 .•• , USITC Publication 1006, October 1979 (Report).
4
On December 11, 1979, the President announced that the provision of the· relief
recommended by the majority was "not in the national economic interest" and,
therefore, he was not proclaiming such relief. 5/
In.initiating the second investigation on January 18, 1980, the President
stated that "recent events have altered the international economic conditions"
under which he had acted on .December 11, 1979.
The present determination by the Commission has been made on a de ~
basis and takes into account all the information before the Commission. In
the previous investigation, data were not available beyond the first half of
1979. The present investigation benefits from data for the full year of 1979
as well as information and predictions based on changes 1n international eco
nomic conditions. We have carefully reviewed our previous determination and
reconsidered our findings and have reached the same conclusion: market dis
ruption does not exist with respect to imports of anhydrous ammonia from the
u.s.s.a.
The product and the domestic indust!"y
We found no new issues regarding the product and the domestic industry.
In 1979, ammonia was produced in the United States by 51 companies operating
at 79 locations throughout the country. The petitioners in the previous
investigation accounted for 48 percent of domestic production in 1979. Two of
them were also major importers from their facilities in Canada and Trinidad.
5/ 44 F.R. 71809 (1979).
5
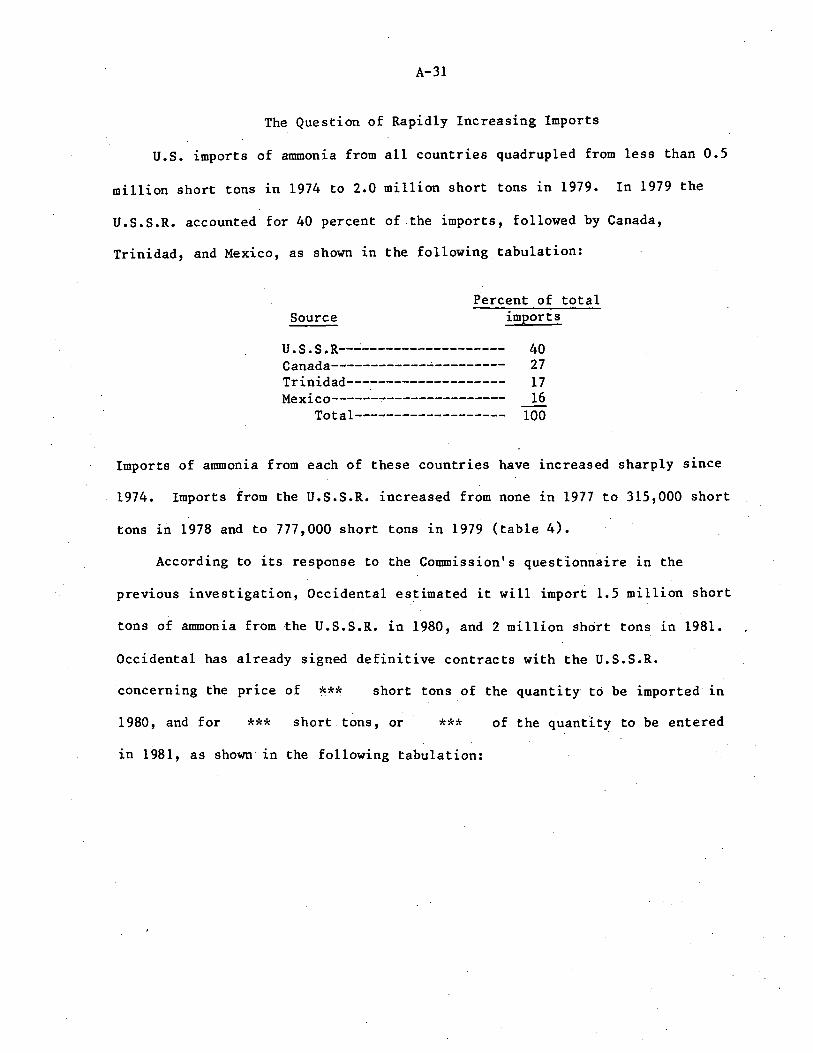
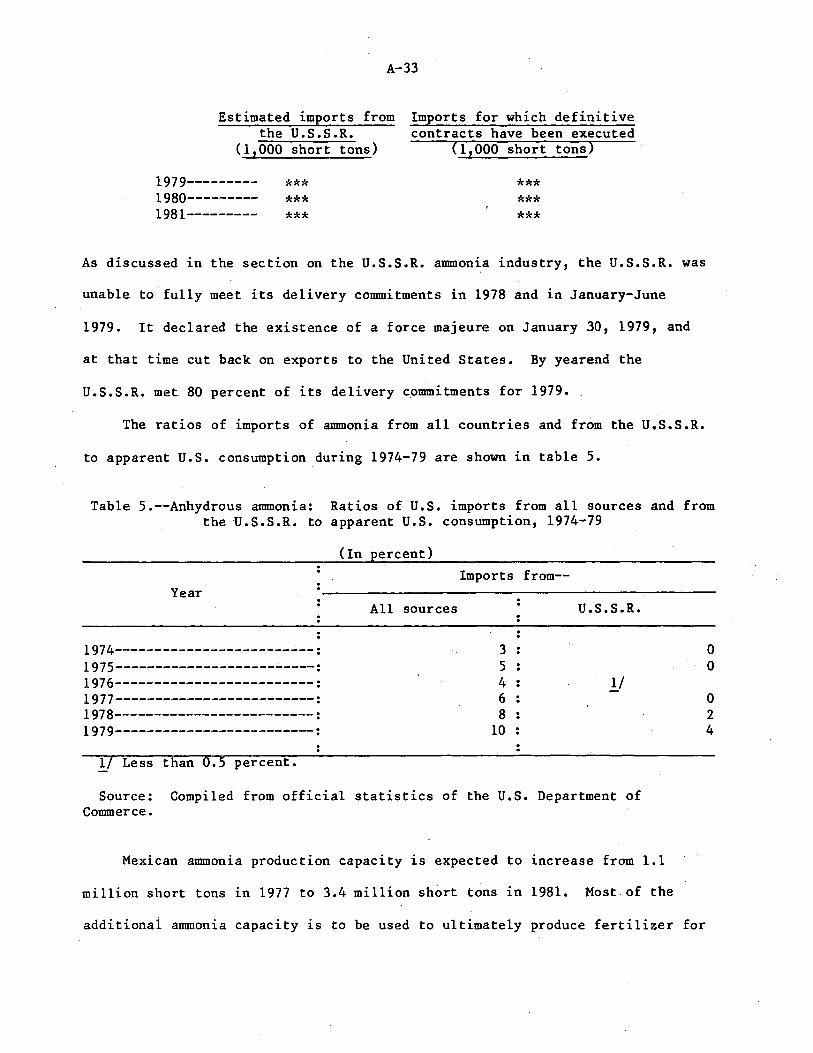
Rapidly increasing imports ~/
Occidental Petroleum Corp. ships virtually all of its imports of Soviet
ammonia to 10 customers in the United States. These customers purchase a
fixed amount each year over the length of their contracts, running from 1 to
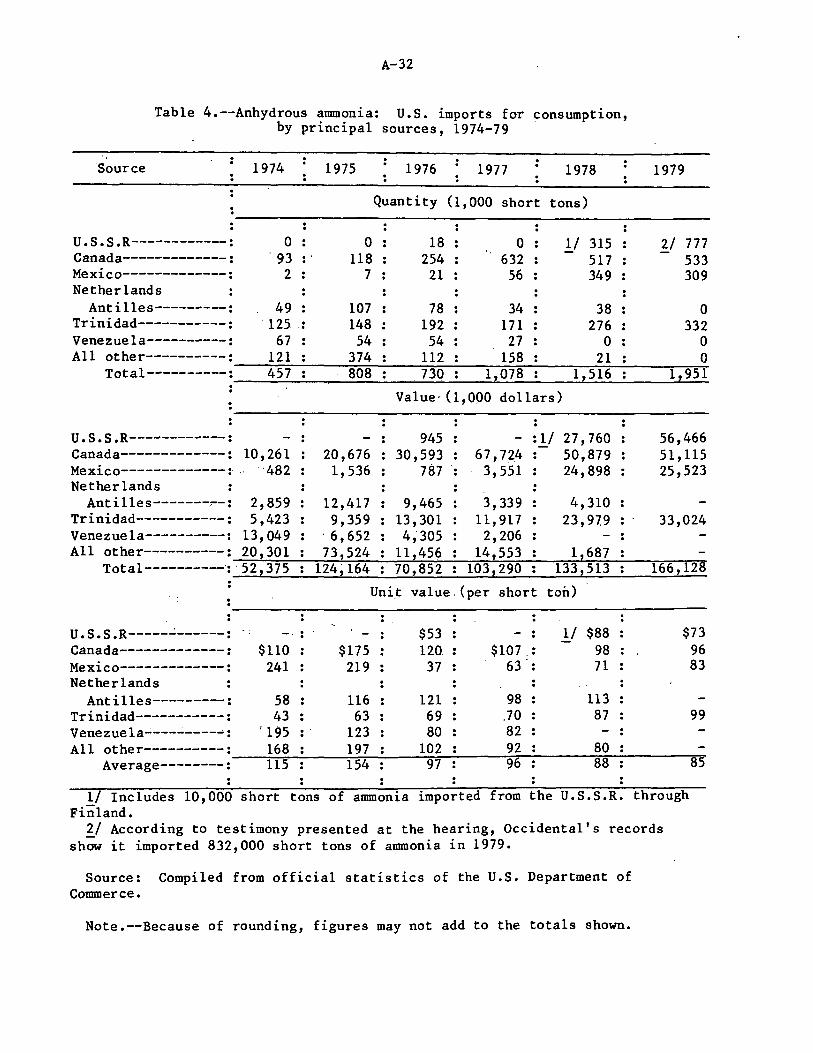
10 years. U.S. imports from the U.S.S.R. reached 777,000 short tons in 1979
(les~ than the 1 million short tons anticipated during the last investigation)
and, in the absence of restrictions, are expected to increase to 1.5 million
tons in 1980 and 2 million tons in 1981.
Imports from other important foreign sources changed slightly in volume
from 1.978 to 1979. Imports from Canada increased 16,000 short tons to 533,000
in 1979; imports from Trinidad increased 56,000 short tons to 332,000 in 1979;
and imports from Mexico fell 40,000 short tons to 309,000 in 1979. The ratio
of all imports to total consumption climbed from 8 percent in 1978 to 10 per~
cent in 1979. The Soviet Union has become the largest single foreign supplier
of this product to the United States.
During the last 2 years, Soviet ammonia increased its share of the domes-
tic market from 2 percent in 1978 to 4 percent in 1979, one point below the
market share expected for 1979 at the time we made our previous determina~
tion. Publicly announced targets for imports from the U.S.S.R. have not yet
been met in any year. As we indicated in the previous investigation, these
imports minimally meet the standard for rapidly increasing imports of section
406.
6/ We find the framework and substance of our joint views in the previous case, No. TA-406-5, remain valid and have not repeated ourselves here. For the sake of brevity, we have merely updated previous data and noted changed conditions. We incorporate our previous opinion by reference. See "Statement of Reasons for the Determination of Commissioners Paula Stern and Bill Alberger" in Report, pp. 13-43.
6
Material injury
We have examined anew all the relevant economic indicators·through 1979
to assess the present health of the domestic industry. Our examination shows
that the ammonia industry in the United States--which had been experiencing
difficulties since mid-1975, well before Soviet imports began to enter the
United States--was rapidly recovering at a time when Soviet imports were
increasing to their highest levels. There are many indications that 1980
will be a fine year for this industry.
In 1979 capacity utilization rose to 89 percent, 3 percentage points
highe~ · tha·n reported i'n the first half of 1979 and a full 12 points higher
' than in 1978. w·ith new plants coming· on stream ·and the closure of outmoded
. ones, the larger, newer, more efficient plants now account for 56 percent of
total capacity. •
Capacity for 1980 is greater than in 1979.
The dramatic decline in profitability of domestic ammonia operations from
1976 to 1978 has reversed itself. The rati•o of net operating profit to total
sales rose from 1 percent in 1978 to 5 percent in 1979. Because previous data
showed a net loss for the first half of 1979, we kn.ow that the second half of
1979 must have been quite profitable to pull the full year profit figure up to
5 percent.
Employment declined 10 percent in 1979 compared with that in 1978, but is
up slightly from the first half year of 1979. Since U. S. production increased
more than one million tons to a recordbreaking 18.1 million short tons in 1979,
any decline in employment in this industry reflects rising productivity, made
possible. by ne~er, more efficient facilities. Shipments reached record high
levels in 1979, and inventories continued to decline through all of 1979.
7
- In the previous investigation, we found material injury that resulted from
causes other than imports from the U.S.S.R. In this case, however, we do not
believe material injury exists, but we will carry our discussion through the
causation test for the sake of clarifying all issues.
Threat of material injury
We have already observed that during the last half of 1979 the domestic
annnonia industry·exceeded on virtually all counts the expectations we formed
in the previous case. (These expectations were based on developments clearly
underway in the first half and t~e best available predictions.) The strong
recovery that was predicted is well underway; Occidental has not inaugurated
a policy of underselling domestic ammonia; prices have increased rapidly to
increasingly profitable levels.
It is on the question of threat that the altered international economic
conditions cited by the President have direct bearing. Barely two weeks after
the President rejected the remedy that the then Commission majority had recom
mended in the previous case, Soviet troops invaded Afghanistan. In parti~l
response, the President made two decisions which altered the environment of
the annnonia market. On January 4, 1980, he announced that the United States.
would limit grain exports to the U.S.S.R., and .. on February 25, 1980, he
ordered an embargo on the exportation of domestic phosphates to the u.s.s.R.
Because production of the crops in question, wheat and corn, accounts for a
significant portion of domestic fertilizer demand, and because Occidental in
effect pays for imported Soviet ammonia with phosphate exports (e.g., super
phosphoric acid), both these events had a significant bearing on the domestic
ammonia industry.
8
The impact of these two announcements on the annnonia industry could have
been direct and/or indirect. Direct effects are those which operate in the
first instance in the ammonia market itself. Indirect effects include those
which operate in the first instance in other markets linked in some fashion to
the ammonia industry. We here considered both the direct effects of the phos-
phate embargo as it relates to the U.S.S.R. 's willingness to supply annnonia
and the indirect effects of the grain embargo.
The U.S. Government embargo on phosphate exports has not, according to .
Occidental, affected the ability or desire of the Soviet Union to meet its
delivery commitments for ammonia. Nor has a private boycott of all U.S.S.R.
vessels and cargo initiat.ed by the International Longshoreman Is Association
(ILA) on Jan~ary 9, l980. On February 1, 1980, ILA longshoremen in Jackson-
ville, Florida, obeyed a court injunction against the boycott, and Occidental
reports that no pho'sphate shipments or amm.o~ia deliveries have been delayed. ?_/
Therefore, we have to assume that annnonia imports from the U.S.S.R. will con-
tinue at approximately the levels projected, while recognizing that they have
consistently fallen short of projected levels.
As for the indirect effects of the grain embargo, nearly 17 million short
tons of wheat and corn contracted to be sold to the U.S.S.R. before October
1980 will not be shipped to the u.s.s.R. To offset the impact of this embargo
on the U.S. agricultur.al sector, the Government has offered to assume the
contractual obligations for approximately 4 million short tons of wheat and 11
million short tons of corn. The Department of Agriculture (Agriculture) will
take delivery of all of the wheat and place it in reserve to be used only for
7/ Accompanying staff report, pp. A-27 and A-28.
9
food assistance programs. The balance between supply and demand for wheat
thus will not change as a result of the embargo. For corn, Agriculture has
revised the farmer-owned reserve system to eliminate most of the embargoed
corn from the market. ~/
Further offsetting developments 1n the grain markets include the pur-
chase by Mexico of 1 million short tons of corn originally destined for the
U.S.S.R. and poorer-than-expected harvests in Brazil, which will force it to
purchase increased quantities of grain. At present, corn export projections
for 1980 by Agriculture are larger than those made in December 1979, in spite
of the embargo. ~/
The best measure of the overall impact of all these phenomena on the total
demand for corn can be found in an analysis of corn prices. In December 1979,
Agriculture forecast that farmers would receive an average of $2.25 to $2.55
per bushel of corn in the 1979/80 crop year. In March 1980, Agriculture pro-
jected that such prices would be between $2.30 and $2.50. The range has
narrowed, but the average is unchanged despite the embargo.
On F~bruary 29, 1980, the Secretary of Agriculture stated that "farm out-
put and prices are near levels expected before the suspension." 10/ Agricul-
ture has accordingly dropped plans for a paid land-diversion program for the
1980 crops of wheat and corn. A post-embargo survey of farmers conducted in
January 1980 indicated that 5 to 6 percent more acres of corn will be culti-
vated in 1980 than in 1979. 11/ Forecasts by Chase Econometrics support those
of Agriculture. 13_/
8/ See accompanying staff report, p. A-25 for details. 9/ Accompanying staff report, p. A-26.
10/ Ibid. ll/ Ibid. fit Chase Econometrics, Fertilizer Model Forecasts, Feb. 18, 1980, pp. 11-14.
Thus, the derived demand for ammonia in wheat and corn cultivation will
not be negatively impacted. In fact, demand for ammonia in 1980 should grow
another 4 percent at a time when its price has already rapidly increased.
With all indicators showing positive trends for the industry during a period
of increasing imports from the U.S.S.R., there is clearly no threat of mate
rial injury to the domestic producers of anhydrous ammonia.
Significant cause
We have not been able to find any credible shred of evidence that would
lirik Soviet imports to any material injury that the domestic industry has
experienced or may continue to experience.
Our previous examination showed that the significant causes of the injury
the industry had encountered were to be found in increasing costs combined
with overcapacity, which had led to fierce competition, declining prices, and
the clos~re of older, less efficient plants. By the end of 1979, 8.0 million
short tons of new capacity, representing 46 percent of total U.S. capacity in
1974, had been added since 1974, most of it coming on stream during 1977 and
1978. The rapid increase in natural gas feedstock prices continued in 1979 as
the average price paid by U.S. ammonia producers reached $1.55 per 1,000 cubic
feet by yearend, 22 percent ·higher than in 1978.
Sirice the last investigation, one additional plant has closed. However,
confirming the closure pattern observed in the previous investigation, it was
one of the older, smaller, reciprocating type using outmoded pre-1963 tech
nology. Moreover, one new plant is opening this spring; it is a modern giant
with a capacity of 400,000 short tons per year.
11
Previously, we were unable to link Occidental's sales of Soviet ammonia
to any of the problems then encountered by the U.S. industry • Since then,
Occidental Petroleum has added one new customer. As in most of the cases of
the nine customers previously analyzed, there are good indications that price
was not the main reason that this customer selected Occidental. We remain
convinced that most, if.not all, of Occidental's ·customers would have gone
offshore for their ammonia purchases in -the absence· of' Soviet ammonia from the
U.S. market. Other foreign producers would have little trouble meeting the
demand of Occidental's customers. The present investigation revealed plans
for new plants in Canada and Trinidad 13/. Also, any Soviet ammonia excluded
from the United States could be diverted to other markets. There it could
directly displace U.S. exports or stimulate other offshore suppliers to fill
the void created in the U.S. market by' the imposition of quotas on Soviet
ammonia.
There is no evidence of price suppression or depression due to the sub-
ject imports. Coinciding with the period of greatest expansion of imports
from the U.S.S.R., gulf coast spot prices rose by 109 percent, from $78 in
July 1978 to $163 in February 1980. 14/ This increase far exceeds the rise
already noted in the price of natural gas, which accounts for two-thirds of
the cost of producing ammonia. The present spot price for ammonia, if it
persists, may provide the basis for the rapid return of this industry to
historic levels of high profitability in 1980. The industry experienced
13/ Staff Report, p. A-34. 14/ The announcement of the ILA boycott may have had some effect on January
spot prices, but with the success of the court injunction of Feb. 1, 1980, any such effect should have quickly vanished.
12
difficulties prior to the introduction of imports from the u.s.S.R. and has
recovered during the period of greatest market penetration by the subject
imports. Clearly these imports are not a cause of injury to the domestic
producers of ammonia.
Conclusion
We have had a rare opportunity 1n the present case to reexamine the
issues, facts, and predictions of a previous determination in the light of
additional data .and changed international economic conditions. We have found
that the positive trends and predic_tions we observed in our previous State
ment of Reasons continued, and generally exceeded our expectations for the
last half of 1979. We have again found .that there are no indications what
soever that imports of Soviet ammonia are a significant cause of material
injury or the threat thereo~ to the domestic industry~ The changed interna
tional circumstances have not brought about market disruption within the
meaning of Section 406 of the Trade Act of 1974.
13 Opinion of Commissioner Michael Calhoun
On the basis of the record developed in the course of this investigation,
I determine that market disruption as defined under Section 406 of the Trade
1 Act of 1974 (hereinafter referred to as the Trade Act) does not exist with
respect to imports of anhydrous ammonia from the Union of Soviet Socialist
Republics.
Discussion
The Product and the Domestic Industry
The nature of the product and the relevant domestic industry under
investigation here were adequately described in the Views of Vice Chairman
Alberger and Commissioner Stern in the investigation which was the predecessor
h . 2 to t is one. I shall treat the matters of the nature of product and the
relevant industry in question by way of updating my colleagues' treatment
in that investigation.
Anhydrous ammonia is used both as a major end product in its own right
and also as an intermediate product in the production of more complex
chemicals. Nearly 75 percent of the ammonia consumed in the United States
is used as fertilizer. As a fertilizer, ammonia can be applied eitheT
directly to farmland or upgraded into other types of fertilizer. But
annnonia is also used in the production of explosives, livestock feeds, fibers,
plastics, resins, and elastomers.
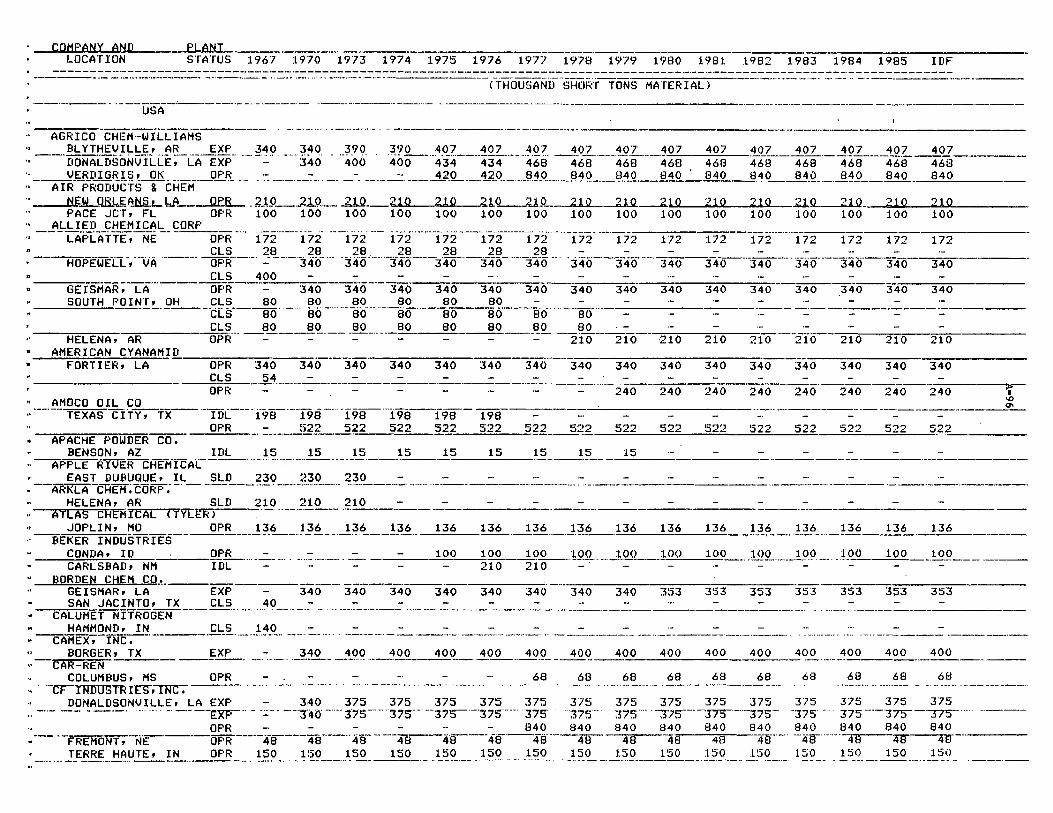
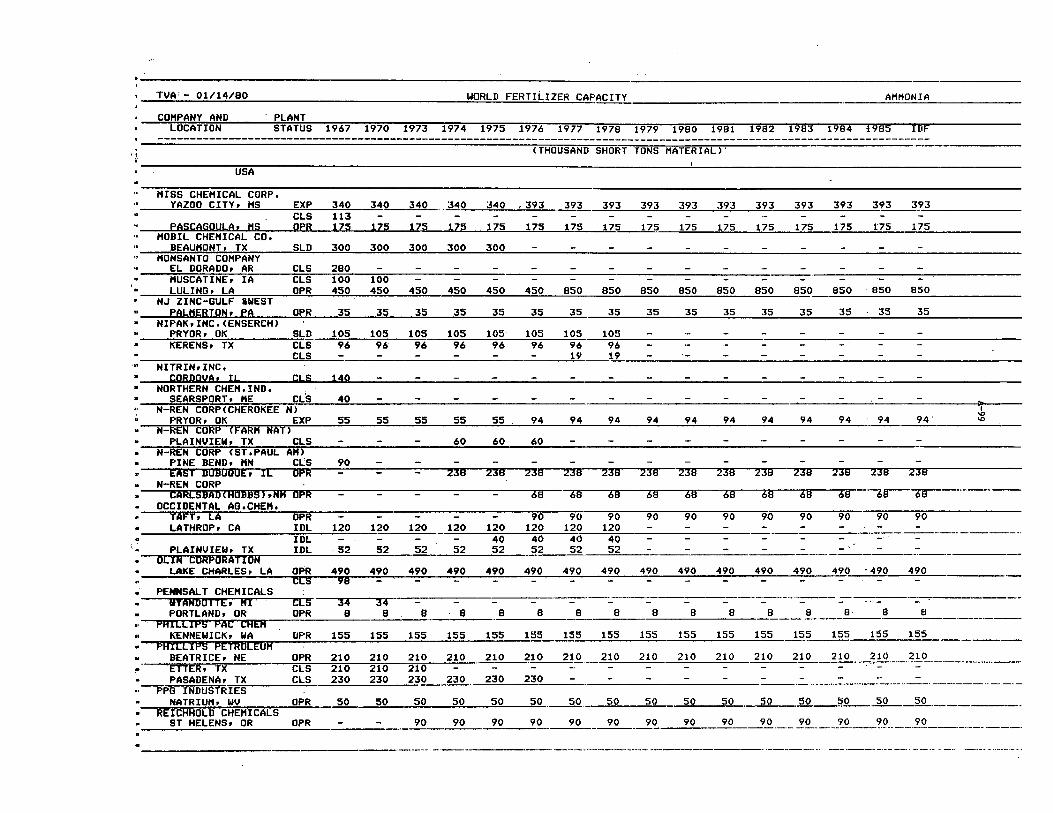
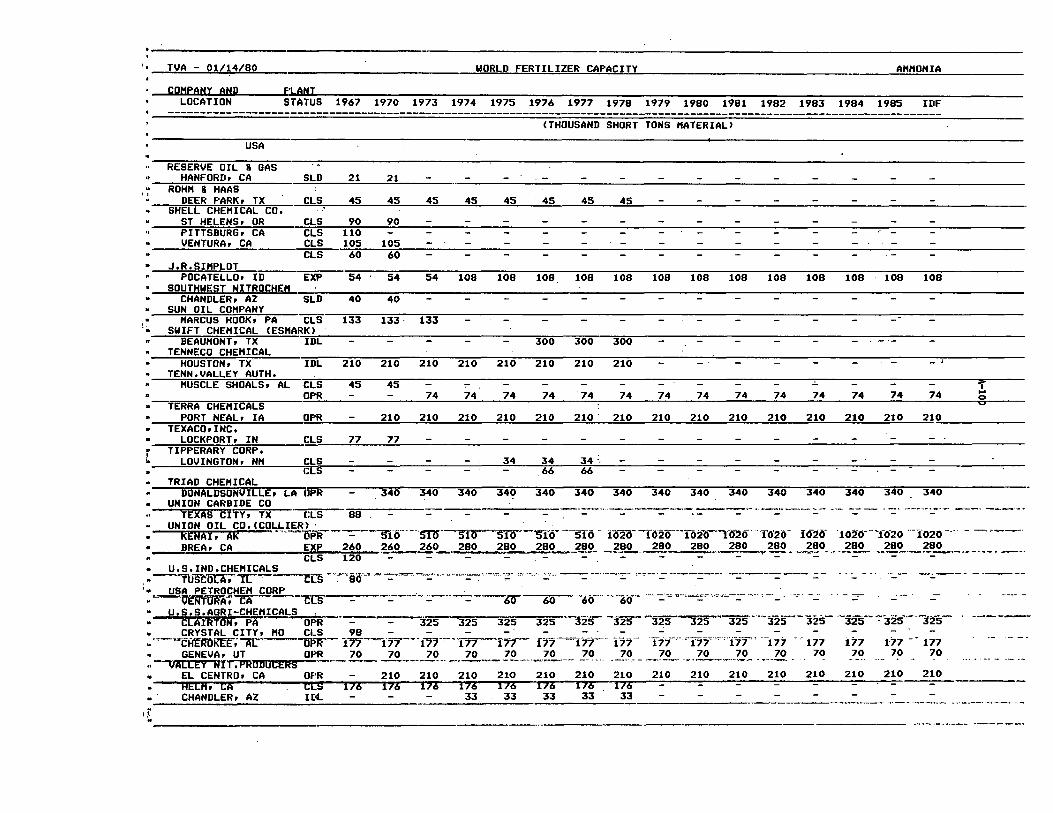
In 1979, ammonia was produced in the United States by 51 companies
operating at 79 locations throughout the country. These producers vary in
!/ 19 u.s.c. §2436.
'!) Anhydrous Ammonia From The U.S.S.R.: Report to the President on Investigation No. TA-406-5, •.. , USITC Publication 1006, October 1979, pp. 13-16. [Hereinafter Ammonia Report]
14
size from small chemical fertilizer producers to large, integrated, multi
national oil and chemical corporations, with farmers' cooperatives being
among the largest producers.
Ammonia producing plants may be classified into three general categories,
usi:ng si..ze and by the nature of the technology employed. The least
efficient producers are small plants which utilize reciprocating compressor
units and have a capacity of less than 200,000 short tons yearly. The most
efficient producers are large plants which utilize the newest centrifugal
compressors and have a capacity in excess of 340,000 short tons yearly.
The intermediate category includes plants using either type of compressor.
In the last decade, in order to increase efficiency and competitiveness,
the domestic industry has built several large plants with the newest
technology. During this period, the domestic industry has also been wracked
by the escalating cost of natural gas, the major feedstock for the production
of anhydrous ammonia.
The domestic producers who were petitioners in the previous ammonia
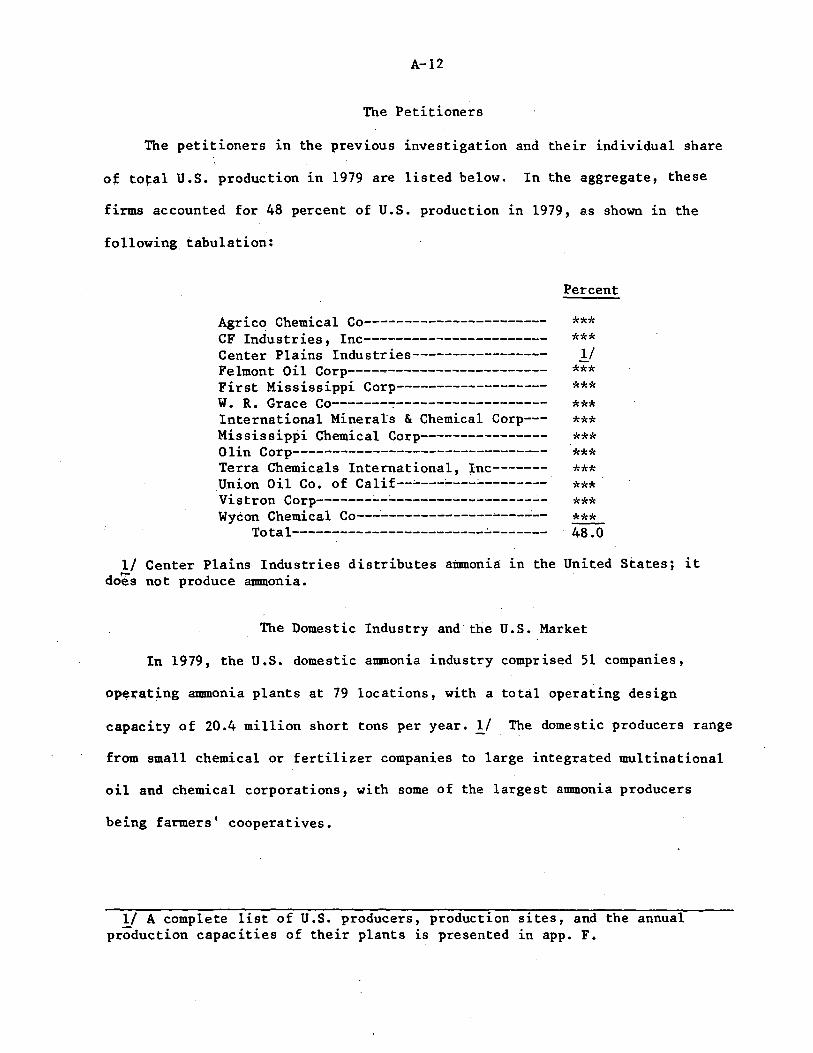
investigation accounted for 48 percent of domestic production in 1979.
Two of the petitioners, CF Industries, Incorporated, and W.R. Grace and
Company, are also major importers by virtue of their ownership of foreign
facilities.
Imports
A. The Occidental Petroleum Company--U.S.S.R. Global Agreement
Central to this investigation is the basic 1973 Global Agreement
between the U.S.S.R. and the Occidental Petroleum Corporation of California
15
(hereinafter referred to as Occidental). Among other things, Occidental
agreed to provide the U.'S.S.R. with design and equipment technology for the
construction of modern ammonia plants. In addition, the Agreement called
for the U.S.S.R. to purchase 20 million tons of superphosphoric acid from
Occidental. 1 In exchange, Occidental originally committed itself under an
exclusive licensing agreement to purchase and market approximately 2.3
million short tons of U.S.S.R. produced ammonia each year from 1978 through
1987 and 1.6 million short tons yearly between 1988 and 1997.2
The prices
paid by Occidental to the U.S.S.R. for this ammonia have been set for
periods of up to three years.
Occidental ships virtually all of its imports of Soviet ammonia for
U.S. consumption to ten customers in the United States. These customers have
agreed to purchase a fixed amount each year over the length of their contracts
which run from one to ten years. The purchases are made on a fixed-price
basis with an automatic escalator clause. In most of the existing contracts
the escalator is an amount of three to six percent per year applicable to
shipments in the second and third years of the contract. Prices for
subsequent years are subject to further negotiations.
U.S. imports of ammonia from the U.S.S.R. increased from a quantity of
zero in 1977 to 315 thousand short tons in 1978 and to 777 thousand short tons
in 1979. 3 Without import restrictions, such imports are expected to increase
to about 1.5 million short tons in 1980 and 2 million short tons in 1981.
1/ On February 25, 1980, the President ordered an embargo upon the exportation of U.S. origin phosphates to the U.S.S.R.
2/ The quantity of ammonia to be purchased has been subsequently revised. Appendix G of the Staff Report gives.a detailed analysis of the agreements.
3/ Occidental Petroleum figures indicate that 832 thousand tons were imported in 1979.
16
B. Other Foreign Sources
The increasing trend in imports from the U.S.S.R. follows the general
trend of increasing imports from some other countries. Imports from Canada
increased irregularly from 93 thousand short tons in 1974 to 533 thousand
short tons in 1979. Imports from Mexico similarly increased from 2 thousand
short tons in 1974 to 309 thousand short tons in 1979. While imports from
all countries quadrupled from 1974 to 1979, the ratio of all imports to
apparent U.S. consumption was only 10 percent in 1979.
Statutory Framework ,
This investigation was conducted at the request of the President under
Section 406(c) of the Trade A~t1 which, in turn, requires an investigation
on the same basis as that provided for under Section 406(a). 2 Section
406(a) (1) direc.ts that the Commission:
· [P]romptly make an investigation to determine, with respect to imports of an article which is the product of a cotmnunist country, whether market disruption exists with respect to an article produced by a domestic industry.3
The term "communist country" is defined under Section 406(e)(7) to mean
"any country dominated or controlled by Cotmnunism. ,,4 The term "market
disruption" is defined under Section 406(e)(2) as follows:
};/ ])
]/ !!_/
19
19
19
Market disruption exists within a domestic industry whenever imports of an article, like or directly competitive with an article produced by such domestic industry, are increasing rapidly, either absolutely or relatively, so as to be a significant cause of material injury, or threat thereof, to such domestic industry.
u.s.c. 2436(c)
u.s.c. 2436(a)
u.s.c. 2436 (a) (1)
19 u.s.c. 2436(e)(l)
17
Section 406(a)(2) directs the Commission to notify directly concerned
agencies, to hold public hearings, and also permits the Commission some
flexibility in defining domestic industry. 1
Communist Countries; Like and Directly Competitive Products
With respect to the requirements under Section 406(a)(l) that the
imports under investigation must be products of a "communist country" and
under Section 406(e)(2) that such imports must be "like or directly competitive
with a domestically produced article", I embrace the views of my colleagues
Vice Chairman Alberger and Commissioner Stern in their treatment of these
two matters in the previous investigation of imports of Soviet ammonia. 2
Market Disruption
But for the matter of whether an article is "like or directly competitive",
reaching a determination on the question of market disruption under Section
406(a)(l) is obstructed by an overwhelming ambiguity as to the meaning of
market disruption under Section 406(e) (2). The heart of tl~e problem lies
in the fact that the definition of market disruption under present law was not
reported by either the House or the Senate nor was it part of the bills
passed by either the House Committee on Ways and Means or the Senate Committee
on Finance.
The policy uudeTlying what is now Sectio.n 406, as expressed by both
Houses of Congress, is to fashion an effective remedy for domestic industries
1__/ 19 U.S.C. 2436(a)(2)
!:_/Anhydrous Ammonia From the U.S.S.R.: Report to the President on Investigation No~ ·rA-406~5; ·~ ; ., USITC Publication 1006, October 1979' pp.19-21.
18
which are· injured by imports from so-called "communist" countries. The
House Report states:
The purpose of section 405 is to provide more easily satisfied criteria for determining whether injury to domestic industries has resulted from imports from countries which are granted nondiscriminatory treatment under ·this title.!
The Senate Report states:
·The purpose.of Section 406 is to provide an effective remedy against market disruption caused by imports
·from· communist countries.2
But as a practical matter, we have little guidance as to the specific
standards to apply in making determ~nations which would achieve this clear
policy prescription. The bill, as reported by the House, had the same definition
of market disruption as did the bill as introduced. 3 It provided in Section
406-(c) that
[MJarke·t ·disruption exists whenever imports of a like or directly competitive article are substantial, are increasing rapidly both absolutely and as a proportion of total domestic consumption, and are offered at prices substantially below those· of ·comparable domestic articles.4
The bill ~~ reported out of the Senate provided in Section 406 that
})
]j
]j
4/
ii
Ma-rket disruption exists within a domestic industry whenever an article is being, or is likely to be, imported into the United States in such increased quantities as to be a significant cause of material injury, or the threat thereof, to such domestic. industry. 5
Trade Reform Act of 1973: Report of the Committee on Ways and Means . H. Rept. No. 93-571 (93rd Cong., 1st Sess.), 1973, p. 82 [Hereinafter House Report].
. . '
Trade Reform Act of 1974: · Report of the 93-1298 (93rd Cong, 2nd Sess.), 1974, p, R.R. 10710, 93rd Cong., 1st Sess., 1973,
H.R. 10710, 93rd Cong., 2nd Sess., 1974, pp. 277-278 (as reported by Senate).
19
Thus; the House established a three criteria test requiring a showing
that imports are (a) at "substantial levels", (b) "increasing rapidly" both
in an absolute sense and in proportion to domestic consumption, and (c) being
offered at prices substantially below those of the domestic articles in
question. The Senate bill established a principally two step test requiring
a showing that imports are coming in or are likely to come in (a) "in such
increased quantities" and (b) so as to be a "significant cause" of "material
injury" or "threat thereof" •
. The test we are reqrtiirea to apply under· current law differs from these
two preliminary formulations in several important respects. First and most
striking, the articulation of the concept of market disruption which is
controlling here is without any reference to the price or pricing practices
addressed in the House bill. Second, the House requirement that the level
of imports must be "substantial" in the first place has disappeared. As
well, the open ended and variable Senate concept of the import level at
which further inquiry would be triggered has given way to the prescription
in the House bill. The House requirement was more rigid and, seemingly,
more demanding in requiring that, irrespective of the measure of· harm
suffered by the domestic industry, imports must first be "increasing
rapidly".
Fourth, present· law permits measuring "increasing rapi_dly" either
absolute or relatively. In contrast, no such provision was in the Senate
bill and the House bill required a finding that increases have been absolute and
in relation to domestic consumption.
20
In addition, the current test incorporates the Senate causality
requirement that the import level·identified as determinative must "be
a significant cause" of ·the resulting harm. And finally, current law
adopts the Senate standard that the import level identified as unacceptable
have a significant nexus.to a harm that is "material" or to such threatened
harm. Consequently, the market disruption standard we are to apply in this
and, indeed, all cases. arising under Section 406 of the Trade Act. requires
a determination fr.om the House bill that imports (a) are "increasing
rapidly", absolutely or relatively, and. from the Senate bill (b) in so
increasing, are a· "significant cause'' of "material injury" or "threat
thereof".
In vi,ew of this amalgamated and patchwork standa.rd, proper and precise
application is sorely dependent upon those expressions of legislative intent
·incorporated in the respective reports of the House Ways and Means
Committee and the Senate Committee on Finance, as the Conference Report
1 is not helpful in this regard. Unfortunately, the confusion and ambiguity
arising from the inconsistencies between the versions of the bill passed by
each House in addition to the inconsistencies between those versions and
the language ultimately passed into law, carries, as well, into the effort
to understand the legi,slative history. Caution is, therefore, warranted
when looking to the respective Committee prints for purposes of clarification
and amplification.. Nonetheless, the Committee prints, however ambiguous,
provided the only real direction available to us in applying the market
disruption definition.
The Conference Report is largely a technical recordation of the compromises reached in reconciling the differences in the bills reported by each House. There is little in the way of discussion that would shed light on reasons for one House yielding to the other. See Conference Report No. 93-1644 (93rd Cong., 2nd Sess.), 1974, p. 15.
21
Increasing Rapidly
Two of the only consistent features in the House and Senate definitions
of market disruption are, as observed above, the underlying policy that this
section is to afford the domestic industry improved opportunities for remedy
in the face of inj4rious behavior by "communist" imports and that expanded
levels of such imports is the action against which remedy could be given.
Thus, the threshold question in finding market disruption is to determine
that level of importation which is such that imports can be said to be
"increasing rapidly", having in mind the underlying policy that this
provision is to enhance the ability of a domestic industry to obtain relief.
The requirement in current law that imports from "communist" countries
must be increasing rapidly comes from the House bill. But, the report of the
Ways and Means Committee is silent as to what it envisioned in using the term.
However, in using the criteria "in such increased quantities as to be •.• ",
the Finance Committee observed that it
[R]ecognizes that a communist country, through control of the distributidn process and the price at which articles are sold, could disrupt the domestic markets of its trading partners and thereby injure producers in those countries. In particular, exports from communist countries could be directed so as to flood domestic markets within a shorter period of time than could occur under free market conditions. In this regard, the Committee has taken into account the problems which East-West trade poses for certain sectors of the American economy. (Emphasis added.)l
The increase in imports required by the market disruption .criteria must have occurred during a recent period of time, as determined by the Commission taking into account any historical trade levels which may have existed.!
While I hasten to reiterate that the Committee is not, here, addressing
the language '.'increasing rapidly", its views are, nevertheless, instructive
in attempting to establish a standard for measuring that level of increased
imports that may be found to be a siginficant cause of material injury or
threat of material injury.
First, although the language used by each House,
in this regard, is plainly different, both sets of language are formulated
to achieve nearly identical objectives. 2 Therefore, in view of the peculiar
circumstances of the legislative history, the Finance Committee's views on
.. this matter should be read to the maximum reasonable extent to also color
the meaning of "increasing rapidly". Second, the House language seems, overall,
to be a more difficult test to meet than that in the Senate bill. 3
1./ Senate Repor~ supra, p. 212.
!:_/ See p. 18. ·
]./ The House· definition requires satisfaction of fairly stringent criteria placed on discrete factors: thus, the bill requires that import levels must be "sub_stantial"; that the increase in imports must be "absolute" and "as a proportion of .•. "; and that prices must be "substantially below" all in addition to which imports must be rising "rapidly". See, H.R. 10710 (as reported by House), supra p. 35. The Senate language, however, calls for a sequential weighing of integrated factors: Imports must be "in such increased quantities as to be a significant cause of material injury or threat thereof." See, H.R. 10710 (as reported by Senate), supra p. 277-278.
23
Thus, having regard for the compelling reason to read the House
language of "increasing rapidly", to be, to the maximum reasonable extent,
consistent with the Finance Connnittee's perspective on its test and· having
regard for the House definiti~n of market disruption being, overall, more
restrictive than the Senate's, the Finance Committee's views well serve
as a minimum standard for determining the meaning o~ "increasing -rapidly"
as used in Section 406(e).
In circumscribing the exercise of discretion to be used in determining
that level of importation at which imports could be a cause of material
injury, the Finance Committee observed that the.circumstance to be addressed
is that in which "communist" imports could "flood" the domestic market. 1
Consequently, as a minimum, then," the operative notion under Section 406(e)
would seem to be "flood".
In common usage, "flood" is understood to mean "to cover or overwhelm •.•
II 2 inundate, deluge . Deluge implies "an irresistable rush of something113
and inundate suggests "to overhwelm by great numbers of superfluity of
something; 4
swamp." By comparison, "rapidly" plainly denot.es something
entirely different, but its connotation fits well within the Finance
Committee's view of the character of the importation in question. "Rapid"
is understood to suggest that which is
1/ Senate Report, supra~ p. 210.
!:../ Webster's Third New International Dictionary (Unabridged), 1971, p. 873.
]_/ Ibid., p. 598.
4/ Ibid., p. 1188.
24
[M]arked by a notably high rate of motion, activity, succession, or occurence: requiring notably little time: not slow or retarded •.• marked by abrupt action or decision without delay or hesitation.!
Clearly ~hen, in view of all the various and complex considerations
which proper interpretation of Section 406(e) requires, the most reasonable
interpretation of increasing rapidly must be strongly colored by imports
increasing, in an empirical sense, so as to suggest an inundation, a high
rate of motion over a short time, an abrupt action.
There can be little question that Soviet imports of ammonia have been
increasing steadily. In 1977 there were no Soviet imports. In 1978,
Soviet imports represented 2 percent of domestic consumption. In 1979,
they had captured 4 percent of consumption. In absolute terms, in 1978,
Soviet imports amounted to some 315 thousan~ short tons and grew to 777
thousand short tons in 1979. Such a doubling in market share and more
than doubling in absolute volume over a two year period is significant.
To be sure, this increase is in contrast to the relatively static volume
and market penetration of no.n-Soviet imported ammonia which have remained
at approximately 1.1 million short tons over the past two years and at
about 6 percent market penetration.
];./Webster,. supra~ p. 1188.
25
But to find that this increase in the level of imports, however
steady or significant, sufficiently touches upon a notion of inundation,
abrupt action, or high rate over a short time in the sense of what appears
to be a reasonable interpretation of "rapidly increasing" is not so clear.
First, it cannot be ignored that Soviet ammonia is a new entrant to this
market. Thus, the reference to a historical level of zero will necessarily
make a rate of increase appear to be very significant in both absolute as
well as relative terms. Successful new entrants into a market will often
show marked increases in volume and even in market share from one year to
the next in the initial years of the market entry without requiring a
1 . h h . . b . d . 1 cone usi:on t at sue an increase is a rupt or 1nun ating.
In addition, since the thrust of what is meant by increasing rapidly
reasonably includes a notion of high volume and short time, further note
must be taken of the circumstance under which Soviet ammonia arrives into
this country. The strategy used to market Soviet imports consists of
entering into long-te~m, forward pricing contracts for a prescribed volume
of ammonia. Testimony is on the record that Occidental's imports will
never amount to the full 2.3 million short tons per year they have agreed
to purchase from ~he U.S.S.R. Occidental negotiates with potential
customers and obtains letters of intent to purchase specific quantities
of ammonia at certain prices, the~, in turn, agrees on terms with
!_/ In this connection, nothing in the legislative history suggests that either House intended its formulation of market disruption to deter the establishment of a respectable market share for imports from "communist countries". .Indeed, the Senate Finance Committee observed that "a· reasonable quantity of such materials could be imported from communist countries without market disruption". Senate Report, supra, p. 211.
26
the U.S.S.R. at fixed prices for specific periods of time. The initial
contracts under which Occidental is presently selling the bulk of the
Soviet ammonia are for periods of up to ten years with fixed prices during
the first three years. The prices in the second and third years, 1979
and 1980, are subject in most cases, to escalation clauses agreed to in
1976-1977, which provide for price increases ranging from 3 percent to
6 percent per year.
Thus, in contrast to a circumstance in which there is an inundation
of imports or a high rate of ammonia imports over a short time, we are
faced here with new imports which have grown from a 2 percent market
penetration in the first year of importation to a 4 percent market
penetration in the second year. In absolute terms, we are dealing with
rather modest levels of imports, 315 thousand short tons in 1978 and
777 thousand short tons in 1979, whose growth cannot be said to be
unreasonable in the sense of the increasing rapidly as discussed above.
Furthermore, contracts already secured for 1980 and 1981 do not reveal
1 trends that radically differ from this pattern.
]:_/ Information on future imports associated with existing contracts was submitted to the Commission in confidence.
27
Moreover, these are imports for which contracts were made years in
advance, with prescribed voltnnes and predetermined prices. The contracts
are known to the market place and, in most instances, are with domestic
purchasers who formerly consumed captive ammonia. I am, therefore, unable
to find that either under the guidance of the.Senate Finance Committee
language, or, indeed, on the very face of the language itself that, with
regard to the question of present material injury, Soviet imports of
ammonia are increasing rapidly.
Having, thus, disposed of.the question of whether Soviet imports are
increasing rapidly within the framework of material injury does not, in .this
case, necessarily resolve this question in the context of a significant
cause of threat of material injury. This case presents the unique circum-
stance in whicb the importer has every intention, barring some unforeseen
circumstance, of importing in the future at a predetermined level. Wh~le
such an intention, though strongly expressed and strongly pursued, to me
seems to be too speculative to have a bearing on a finding of increasing
rapidly with respect to present injury, the special nature of the circum-
stances and procedures of the imports in this case do seem to raise this
question as it goes to a finding of threat of material injury. Consequently,
if imports were, in fact, to come in as intended by the importer, the
question exists as to whether imports are increasing rapidly with a view
to threat of material injury.
After two years of importation, after having achieved an importation
level of over three quarters of a million short tons, and in view of contracts
for·future purchases, Soviet imports have well established themselves in
this market and have established a sound base.period against which to compare . .
28
growth. By its testimony, Occidental fully expects, abserit unforeseen
circumstances, that its imports of Soviet ammonia will, indeed, continue
to grow. Occidental expects to import approximately 1.5 million short
tons in 1980 and 2 million short tons in 1981. If the 1980 level is
reached, this would be approximately 7 percent of the projected domestic
consumption for 1980, an improvement of over 80 percent above that in 1979.
Moreover, the growth from a 4 percent market share to possibly a 7.3 percent
share, if achieved, would represent a one year advance in penetration nearly
equal to that achieved in the first two years-of importation. Such an
expansion seems to well reflect the flavor of inundation and abrupt action
contemplated under Section 406(e).
To compound this rather dramatic·potential relative increase, the
potential absolute growth in imports above that of the 1979 level, likewise,
touches the concern implicit in the concept of increasing rapidly. Without
reaching a conclusion as to the actual health of the domestic industry, 777
thousand short tons of ammonia is a significant order of magnitude. It is
a level such that the potential impact on the domestic industry of an
additional 700 thousand or ·so short tons is substantially different than
the impact of that amount when there had been no previous imports. Thus, such
an expected growth, in one year, from the 777 thousand short tons it took
two years to reach to the 1.5 million short tons expected for 1980, if
achieved, would be an absolute increase in imports also of an order and
character that well'.falls within the color of abrupt action, high rate of
motion requiring notably little time, and inundation.
Therefore, I find that imports of Soviet ammonia are increasing rapidly
to the extent this consideration bears on the question of threat of material
injury under Section 406(e).
29
Material Injury
Since I have concluded that Soviet imports of armnonia are not
increasing rapidly with respect to present injury, it is not necessary for
me to consider the question of whether the domestic industry is suffering
material injury. Nevertheless, having reviewed the record on this matter,
I join in the treatment and conclusion of my colleagues, Vice Chairman
Alberger and Commissioner Stern, on the question of whether the domestic
industry is, at all, suffering material injury in this case. However,
I disassociate myself with that part of their views on this matter which
1 may in.corporate their belief, as expressed in the previous case, that the
Trade Agreements Act of 1979 is useful in understanding the meaning of
"material injury" as it is used in Section 406(e) of the Trade Act of 1974.
Threat of Material Injury
Since I have found that Soviet ammonia imports are increasing
rapidly with regard to considerations as to the presence of threat of
material injury, it is necessary for me to reach a conclusion as to
whether the domestic industry is, in fact, faced with this threat. In
this connection, I, agai_n, join in the treatment and conclusion of my
colleagues, Vice Chairman Alberger and Commissioner Stern, on the question
of whether the domestic industry is faced w;ith a. threat of ··mate:rial
injury.
Overdependence
Testimony was offered in· this case that the concept of "market
disruption" under Section 406(e) incorporates a notion of "overdependence"
1_/ Ammonia Report. supra,
30
in addition to that provided for on the face of this section. Support
for this interpretation is largely based on language found in the Senate
1 Finance Connnittee Report. However, the completely confused origin
of this provision, as I have discussed, obstructs an easy understanding
of its meaning and intent. Thus, caution is warranted when relying on
expressions of intent in the respective Committee reports even when such
expressions. go to language used in present law. But to look to the report of
one Connnittee for support in advancing a theory not expressly provided for
on the face of this section, nor i1_1 any of its prior forms, seems to go
beyond the rea$onable limits of statutory interpretation. Consequently,
I find th~t Section 406(e) does not contemplate overdependence as a d~screte
theory to be considered in reaching a conclusion with regard to the
f k d. . 2
existence o mar et 1srupt1on.
l_/ Senate Report, supra; pp. 210~211.
2/ Even if such a theory might be cognizable under Section 406(e), it cannot be ignore.cl that .it is the well established practice of this institution, founded both upon law and prudence, that in fulfiiling its statutory obliga.tions .. the Connnission relies upon objective rather than subjective factors. The core of the objective factors that have been considered in discharge of the Connnission's responsibilities overwhelmingly have to do with economic considerations. Nothing on the face of this section, in any of it~ prior forms, nor, inde~d, in the legislative history, remotely suggests that Congress intended Section 406(e) as mandate for this body to stray from its usual practice. Thus, while from a trade policy or foreign policy perspective, it "~S worthy of concern that this country could be dependent upon the Soviet Union to satisfy as much as 10 percent of the domestic consumption of ammonia, action based upon such a concern, unsupported by reference to the traditional objective factors looked to by this institution, goes beyond this body's jurisdiction.
31
STATEMENT OF REASONS FOR THE.AFFIRMATIVE·DETERMINATION OF CHAIRMAN CATHERINE BEDELL AND COMMISSIONER GEORGE M. MOORE
This investigation is before 'the Coniinission as the result of a request by
the President. The President stated that "there are reasonable grounds to
believe" that imports of anhydrous annnonia (annnonia) from the U.S.S.R. are
causing market disruption within the meaning of section 406 of the Trade Act
of 1974. On January 28, 1980, the Connnission instituted investigation No.
TA-406-6 to determine whether imports of ammonia from the U.S.S.R. are causing
such market disruption.
The term "market disruption~' is defined in section 406 (e) (2) of the Trade
Act of 1974 as follows:
Market disruption exists within a domestic industry whenever imports of an article, like or directly competitve with an article produced by such domestic industry, are increasing rapidly, either absolutely or relatively, so as to be a significant cause of material injury, or threat thereof, to such domestic industry.
In accordance with section 406(a)(l), the Commission is to examine the impact
of imports of ammonia from the U.S.S.-R. on the domes-tic industry producing- a-
like or directly competitive article. Ammonia is identical in physical charac-
teristics and quality regardless of source; therefore, for.the purpose of this
investigation, we consider the domestic industry to be the facilities in the.
United States devoted to the production of ammonia.
In 1979, 51 companies operated ammonia plants at 79 locations with a total
operating design capacity of 20. 4 ~ill:fon .short tons per year. In comparison,
in 1978, there were 59 domestic firms at 93 locations with an operating design
capacity of 22 million short tons producing ammonia. Domestic producers· range
in structure from small chemical or fer~ilizer companies to large integrated
multinational e>il and chemical corpor:atioD:s. ·Some of the largest ammonia pro-
ducers are farmer cooperatives.
32
In order to make an affirmative determination of market disruption, the
Connnission must find that imports are "increasing rapidly, either absolutely or
relatively." This requirement reflects the concerns of Congress regarding the
ability of Conununist countries to direct their exports by virtue of their con-
trol of distribution and price "so as to flood domestic markets within a shorter
time period than could occur under free market condition." 1./ Although the
term "increasing rapidly" is not statutorily defined, the Senate Finance
Connnittee report on the Trade Act provides further guidance as to its meaning:
The increase in imports required by the market disruption criteria must have occurred during a recent period of time, as determined by the Conunission taking into account any historical trade levels which may have existed. J:./
It is clear that the inrrease in imports can be either absolute or relative
and must have been recent in time. The increase in imports must also have been
rapid and of a magnitude to be a significant cause of mate.rial injury within
the meaning of the act. ]_/
In 1973, Occidental Petroleum Corp. entered into an agreement with the
Soviet Union which, among ~ther things, gave Occidental the exclusive right to
any specified am.aunt of Soviet annnonia for sale in the United States
beginning in 1978.~ Prior to 1978, there were no imports of ammonia from the
U.S.S.R. except a nominal amount in 1976. More than 300,000 short tons was
imported in 1978, and imports further increased to 777,000 short tons in 1979.
Occidental has advised that without import restrictions imports will total about
1.5 million short tons in 1980 and 2 million short tons in 1981.
1/ U.S. Senate, Trade Reform Act of 1974: Report of the Committee on Finance -:- ., s. Rept. No. 93-1298 (93d Cong., 2d sess.), 1974, p. 210. 2/ Ibid., p. 212. 3/ Statement of reasons for determination of Commissioners George M. Moore,
Catherine Bedell, and Italo H. Ablondi, and views of Chairman Joseph O. Parker, in Clothespins From the People's Republic of China, the Polish People's Republic, and the Socialist Republic of Romania: Report to the President on Investigations Nos. TA-406-2, TA-406-3,and TA-406-4 ••• , USITC Publication 902, August 1978.
33
Imports of ammonia from the U~S.S.R. were equal to about 2 percent of
domestic production in 1978 and· i.ncr·eased to 4 percent in 1979; they will rise
to a level almost equal to i2 percent of domestic production in 1981.
Considering historical trade levels arid increases occurring during the most
recent period of tim'e, it is clear that these imports are increasing rapidly,
both absolutely and relatively, within the meaning of section 406.
Section 406 also requires that the rapid increase in imports be a
"significant cause of nuteria:l irijury or tnreat thereof" to a domestic
industry. Like the term:· "increasing rapidiy, 11 the statutory terms "significant
cause'' and "material injury,' or threat· thereof" are not defined in the
statute but are discussed in the legislative history of this section. These
terms should not be confu'sed with the causation and injury standards of
section 201, which is structured to permit the Commission to address
the problems of increased imports from all sources, whereas section 4Q6
is specifically designed.to' address the unique problems of imports from .·, _
nonrnarket economies. In explaining the difference between the causation
standards of section 406 and.section 201, the Finance Committee Report.
states:
This market· disruption definition contained in the Committee bill is formulated along lines similar to the criteria for import·~elief under section 201 of this bill. However, the market disruption test is intended to be more easily met than the serious injury tests in section 201. While section 20l(b) would require that increased imports of the·article be a "substantial cause" of the requisite injury, or the threat thereof,
'to a dome~tic industry, section 406 wbuld require that the article is being, or is likely to be, imported in such iil.creas.ed quantities as to be a "significant cause" of material injury, or the threat thereof. The term "significant cause" is intended to be an easier standard
34
to. satisfy .. than that, of. "su,bstanti,al cause". . • • . In addition, the term "material injury" in section 406 is intended· to rep.resent a J,:esser· 9egree of •intury than the term "serious injury" standard employed in section 201. .1/
It is clear.from these legislative connnents. that a "significant. cause"
in se~~ion,.406 investigations mus~-be an important and .factually identifi~ble.
cause, but the cau.sation requirement ,is in.tended to .. be more. easily satisfied
than the requirement in. sect_i;on 201.
The t.erm· '·'mate~ial ·1nj,ury, or threat· the+~of" ·is· not defined in the :
sta.tute .• '· ;· ;l~oweven; the st?tutory. history indicates that the term as used in
section 406 is ·int·en,ded to. represent a less~ ciegree of injury than the
"seriou:s 1 .injµry'·'· stq.ndard of se~tion 201.
When; impo+.ts of a.IIJI!l01:1ia from the U.S.S •. R~ commenced in 19,78, ~he domestic
industry was ioia substantially' weakened competitive·position. The industry's
vulnerabil:i:ty was. due in. part to.· unu~ed ~apacity resulti;ig from the expansion of
production :faci.}.;iti,e~i. in. the mid-19?0' s, and the .increasing costs of natural.
gas.
In 1978, U .,s. productiqn of .ammonia decreased .from the 1977 level. In '• . . ~ .
1979 it increased only 2.7 percent above the level attained in 1977, the last
year in which there were no U.S. ~portsofSoviet ~onia. At the same time, the .' 'I ' ~ . ' •. • . : • ' . \ . .
U.S. producers '.~.sq~re of domestic. cc;msumption decreased by 4 percent· .from the
1977 share, despi,te a 9-:-percept in.cre~se in consumption.
U.S. ammonia pr~ductive:capacity rose from 17.2 million short tons in
197 4 to 22. 0 million short tons. i~ .19.78, .repre~enting. an increase of 28 percent. . . . . .
However, since 1?78,.wh~n ammo~ia imports began to enter from the U.S.S.R.,. U.S.
. .. productive capacity has decl~ned by 5.7 percent.
1./ U.S. Senate, op. cit., p. 212.
35
In 1978 and 1979, 31 U.S. ammonia-producing plants with a capacity of
3 million short tons were forced to close because their continued operation
was unprofitable. The closing and idling of these· ammonia plants was the
single cause .of the increase in domestic ammonia capacity utilization from
77 percent in 1978 to 89 percent in 1979. Seven of Occidental's 10 long-
term contract customers have closed. domestic ammonia-producing plants and replaced
the output of these faci.lities with imported low-cost Soviet ammonia•
The number of production and related works engaged in producing ammo·nia
in the United States increased steadily from 3,828 in 1974 to.4,744 in 1977.
In 1978, the first year ammonia was imported by Occidental from the U.S.S.R.,
the number of such workers decreased to 4,610; the number decreased further,
by 10 percent, to 4,137 in 1979. The number of hours such workers were employed
followed the same trend, increasing steadily from 8.4 million hours in 1974 to
10.3 million hours in 1977 but subsequently dropping to 9.9 million hours in
1978 and 8.4 million hours in 1979.
Natural gas accounted for 64 percent of the cost of produc;i.ng ammonia in
1978. The average price paid by U.S. ammoµia producers for natural gas increased
. from $0.48 per 1,000 cubic feet in 1974 to·$1.55 per 1~000 cubic feet in 1979.
While the rising cost of natural gas contributes to the problellls experienced by
the domestic industry, low-priced imports from the U.S.S.R. threaten material
;injury to this industry, which is also faced with a severe cost~price squeeze.
While natural gas cost $1.55 per 1,000 cubic feet on the average in 1979,
32 percent of the ammonia produced in the United States in 1979 used gas that
cost more than $2.00 per 1,000 cubic feet. The cost of natural gas and, hence,
the cost of ammonia production, will continue to increase and exacerbate the
threat of material injury to ammonia producers from imports of Soviet ammonia.
36
Availabre· profit-and":""loss,.data .show net operating profit from domestic
ammonia operations declining from $316 million in 1976 to $149 million in
1977 and to. $10: million i·n 1978.· . In 1979, the' profit level increased to
$68 million, wM:ch was· 120 percent below the. profit level· of the domestic
industry in· 1977.
Occidental has, contz:acted with th~ u.s.s.-R. to purchase annual quantities
of ammonia during the 20-year period. beginning in 1978. The contract has been.
modified' several times, obligating -the Soviet Union to supply _increasing
quantid.es' of ammonia-.to 'O.c'cidental for sale in the United States.
Occidental e'stimates .that approximately 1. 5 million tons of .ammonia will
be imported in 1980 and 2 ·million ·tons will ·be .. impo,rted in 1981. Even if the
· Department of Agriculture's :estimates of a 1.1-million-ton increase :i,.n ammonia
consumption this year are accurate; .the dome!;ltic industry is imminently
threatened witl: the capture .. of most if not· all of this incre1,1sed con.sumption
by Soviet imports.
The strategy used to ·market Soviet imports consists of.entering into long
term ·forward-price .contracts .. Oc.cident.al negotiates with potential
customers· and obtains letter's of intent· to purchase quantities of annnonia at
certain prices and then, ·in turn, ag-rees upon prices and quantities 1'.Vith the
u.s.s .. R., with pric•es ·fixed for specific periods of time. The contracts
under which Occidental sells ... to its customers are for periods up to 10 years
at prices fixed.for periods not exceeding 3 years. The prices in the second
and third years are fixed except for nominal,increases through escala-
tion c·lauses ranging. 'in most cases - from 3 ,percent to 6 percent a· year.
Occidental is thus,able to.offer ammonia in th~ U.S. market at firm prices
for specified· periods of·-time by virture of. the arrangements it has been able
to make with its Soviet supplier. The production and sale of ammonia by the
37
U.S.S.R. is a governmental operation and, therefore, does not have to be
responsive to the disciplines of the free-market economy in which the U.S.
industry competes.
The prices at which the imported ammonia was sold in the first year of
the contracts appear to have been comparable with.U;s. market prices at the
time these forward~price contracts were entered into. However, in 1980 and
198~, the price at the time of delivery, even with the application of a price-
escalation clause, will be below U.S. market prices of domestically produced
ammonia.
The forward pricing of· Soviet ammonia serves to aggravate the cost-price
squeeze with which the domestic industry is faced. U.S. producers which are
confronted with rapidly increasing costs of natural gas are unable to compete
with the long-term contracts made available by the U.S.S.R. Price of U.S.-
produced ammonia have risen since 1979 to cover the escalating costs of
ammonia production;, the prices of ammonia from the Soviet Union have increased
only slightly. Thus, the disparity in prices is greater today than in 1979,
and consequently substantial sales will be lost to Soviet imports in 1980.
By reason of Occidental's unique ability to forward price through long-
term arrangements with the u.s.S.R., imports from the u.s.s .. R. are able to i
penetrate the U.S. market to an unlimited extent .. Apparent domestic consumption
increased by approximately 500,000 short tons in 1978, or about 3 percent over
that in 1977. In 1979, domestic consumption increased further by 1.2 million
short tons, or by 7 percent. Imports from the u.s.s.R. supplied approximately
65 percent and 38 percent of this growth in 1978 and 1979, respectively. But
for the declaration of a force majeure by the U.S.S.R. in January 1979, which
caused its failure to meet early 1979 delivery commitments, Soviet import
penetration would have been substantially higher.
38
Soviet ammonia production capacity is scheduled to double between 1977
and 1982, increasing from 17 million short tons to 34 million short tons.
Soviet ammonia production capacity, which was about 20 percent less than U.S.
ammonia production capacity in 1977, will be about· 60 percent greater than
U.S. ammonia production capacity in 1982. This tremendous growth in Soviet
productive capacity over a mere 5-year period does not appear to reflect
either Soviet or world market needs and consequently poses a threat to the
domestic industry.
In October 1978 a CIA report entitled S?yiet Chemical Equipment Purchases
from the West: Impact on Production and Foreign Trad~ predicted that Soviet
exports of ammonia "will be an important destabilizing factor in world ammonia
markets in the 1980's." This report further stated that "producers in the
developed Western countries almost certainly will he affected • • • with
depressed prices and profits in store."
A further significant consequence of these sales could be the potential
dependence on the U.S.S.R. for a vital raw material. This was of particular
concern to the Senate Finance Committee,which stated in its report that it
"expects the Commission and the President to monitor carefully import trends
and to view each case with the goal of preventing imprudent tlependence on a
nonmarket economy for a vital material."!/ Certainly the ability of the
United States to maintain our highly efficient agricultural production
is vital to our economy and to the free world, which is also the beneficiary
of our. agricultural efficiency.
Dependence on Soviet-produced and Soviet-supplied ammonia for a signi
ficant portion of our nitrogen requirements will place our agricultural and
other national requirementts in a vulnerable position. Ammonia plants are
1/ U.S. Senate, op cit. p. 211.
39
capital intensive. Capital requirements will be difficult to obtai~ to meet
current and future needs if the market structure is disrupted by Soviet
produced ammonia which is marketed under terms and ~rrangements with which
the U.S. industry cannot compete because of the disciplines of a free-market
economy.
40
Conc'lusioh
Much 'lias been: sa'id" about ·tl1e' r~e'cent rec'overy. of the domestic ammonia
On December 11, 1979, the President, rejecting the Commission's
recommendation, determined that "import relief is not in the national economic
interest." One month later on January 18, 1980, however, the President
announced that "recent events have altered the international economic
conditions" and took emergency action under section 406(c) of the Trade Act to
impose a 1-year quota of, 1 mi'llion short tons on imports of ammonia from the
U.S.S.R. J/ .. At the same time the President requested that the Commission
initiate a new investigation under section 406(a) of the Trade Act.
1/ A copy of the Commission 1 s notice of determination and recommendations to the President is presented in app. C. The Commissioners' statements of reasons in this investigation together with the information obtained in the investigation are published in Anhydrous Ammonia From the U.S.S.R •••• , USITC Publication 1006, October 1979.
2/ Copies of the President's December 11, 1979 determination and his Ja~uary 18, 1980 proclamation are presented in app. D.
A-6
Description and Uses
' . . In this report tlie terms "anhydrous ammonia" and "ammonia" are used
synonymously. ··The term ' 11 anhydrous~ 11 'which means without water, is often used
by the industry to distinguish pure ammonia, NH3 , from aqua ammonia,
NH3.H20, which is a solution of ammonia dissolved in water. By weight,
ammonia is 82 percent nitrogen and 18 percent hydrogen.
Ammonia is ·b~e· of the most basic commercially produced chemicals in the
world. It is us~d .as a major end product and as an ,intermediate in the
production of more complex chemicals. Virtually all commercially fixed
nitrogen (chemically combined) is derived from ammonia • . :1• • . O' 0 • M. '
Nearly 75 percent of. the ammonia consumed in the Unit~4 States is used as
fertilizer. Ammonia,.ca~ be applied directly to farmland or: it can be upgraded
into other fertilizers. In addition, ammonia is used in· .the production of
~xplos~ves and blasting agents, livestock feeds, fibers, plastics, resins, and
el~£?.~o~ers. U.S. consumption of ~onia, by end uses, is- shown in table 1.
A-7
Table 1.--Anhydrous ammonia: Percentage distribution of U.S. consumption, by end uses, 1975
End use Percent
Fertilizers: Ammonia, direct application------------------------: 29.l Ammonium nitrate----------------------------------: 18.1 Urea-----------------------------------------------: .12.5 Ammonium phosphates--------------------------------: 7.5 Ammonium sulfate-----------------------------------: 3.7 All other (nitrogen solutions, etc.)---------------: 2.8
~~~~~~~~~~~~~
To ta 1----------------------.----------------------: 7 3. 7 Explosives and blasting agents:
Grand total--------------------------------------:==================~r~o~o~.::;o
Source: Copyright permission granted by Stanford Research Institute, Chemicals Economics Handbook, April 1977 •.
At normal atmospheric temperatures and pressures, ammonia is a colorless
gas with a sharp, intensely irritating odor. Ammonia is toxic and hazardous;
inhalation of concentrated fumes can be fatal. In addition, ammonia is a
moderate fire hazard.
Ammonia gas can be easily liquefied by increasing the pressure or
decreasing the temperature. The industry has found that ammonia in liquid
form is easiest to ship or store. Consequently, rail tank cars, tractor
trailers, pipelines, ocean-going vessels, and storage tanks have been
specially designed to handle liquefied ammonia.
A-8
Modern ammonia plants produce one grade of ammonia. Most ammonia is sold
with a guaranteed purity of 99.5 percent. When used for refrigeration and
metallurgy, however, ·ammonia must possess a purity of 99.98 percent and 99.99
percent, respectively. Extra precautions may be required in handling ammonia
for these special end uses to prevent contamination.
Production Process
The basic feedstocks for ammonia plants in the United States are air,
which is 78 percent nitrogen, natural gas, and water. In some foreign plants,
naphtha, oil, __ or coal is used in lieu of natural gas~ 1/
The· ffrst. commercial process for. the direct synthesis of ammonia was
developed in Germ~~Y. by Fritz Haber and Carl Bosch during the early 1900's.
The first plant utiliz~ng the Haber-Ba.sch process was constructed in Germany
in 1913. During World War I, the great need for_nitrates in munitions, and
the difficulty of importing sodium nitrate during wartime led the U.S.
Government to construct the first U.S. direct-synthesis plant for producing
ammonia at Muscle Shoals, Ala., in 1918. This plant had a design capacity of
10,000 short tons per year.
During the period 1920-60, the U.S. ammonia industry expanded rapidly in
the United States because of the continuing demand for military explosives and
propellants, and impressive increases in farm crop yields that resulted from
the application of nitrogenous fertilizers. Ammonia plants increased
gradually in size, with plants built during this era generally having a
capacity ranging from 30,000 to 100,000 tons per year.
Beginning in 1963, the United States experienced a surge in ammonia
production capacity as a result of major changes in engineering technology. A
!/ A detailed discussion of the ammonia production process is presented in app. E.
A-9
new concept 1n ammonia plant design was developed in which waste heat recovery
was increased throughout the system, high-pressure steam was used to drive
compressors and other equipment, higher pressure was used in the gas
preparation section, and an integrated system was used throughout the plant
which balanced energy consumption, energy production, equipment size, and
catalyst volumes. In addition, the ammonia converters (the reaction vessels
in which hydrogen reacts with nitrogen to form ammonia) dramatically increased
in size, and centrifugal compressors were utilized in place of the much more
cumbersome and expensive reciprocating compressors. These changes resulted in
the construction of large, single-train (one ammonia converter per plant)
. ammonia plants with initial capacities of 200,000 tons per year. This
technology was later scaled up, enabling plants to have capacities between
340,000 and 510,000 short to·ns per year (fig. 1). The unit cost of ammonia
production dropped sharply, and capital construction cost per ton of capacity
was substantially reduced. The new ammonia plant technology was rapidly
adopted throughout the world, and world ammonia capacity increased
dramatically.
Pullman Kellogg Co. of Houston; Tex., is generally credited with most of
the innovations that caused the major shift in ammonia plant design in the
early 1960's, although other chemical plant vendors were quick to recognize
and adopt the principal improvements and to offer ammonia plants of comparable
capacity. The economic impact of the new ammonia plant technology 1s
summarized in a paper, "The Ammonia Supply Dilemma," by George C. Sweeney of
Arthur D. Little, Inc., written in February 1979. Mr. Sweeney wrote:
Figure 1.--Anhydrous ammonia:
* * *
A-10
Maximum sizes of U.S. production facilities, 1930-70. '.
* * * *
Source: A.V. Slack "History and Status of Ammonia Production and Use," in Ammonia, ed. A.V. Slack and G. Russell James, Marcel Dekker, New York, 1973.
A-11
• • • the development of the all-centrifugal plant brought significant reductions in the capital cost per annual ton of anunonia, to such a degree that most major producers rushed to install these new generation plants in the mid-1960's. Somewhat overlooked in the scramble to get this new and cheaper technology was the fact that it could 'only· be obtained in· large· plants. Larger plants produce more product, and this requires larger markets. It became clear in the latter part of the 1960's that in its fascination with this new technology, the industry had neglected to do the necessary market arithmetic, and anunonia prices plunged to the range of $20-$25 per ton along the Gulf Coast. Even with the cheap gas and higher efficiency plants, these were "red ink" prices. Most companies posted losses in their fertilizer-divisions for the period 1968-1970.
·,·
Demand continued to increase, however, and a gradual but slow re.;covery in prices· took plac·e. However, price controls which were·. imposed after the· oil embargo in 1972 kept industry profits at too low a level to generate much interest in new plant construction, and it was not until controls were lifted that additional projects were undertaken. By this time, demand had increased to the point where anunonia· was actually in short supply, and prices shot up to ·unbelievable levels. With apparently. short memories, there was a· rush of new plant construction, which again, as it turned out, was in excess of what the markets could absorb.
A-12
The Petitioners
The petitioners in the previous investigation and their individual share
ot to~al U.S. production in 1979 are listed below. In the aggregate, these
firms accounted for 48 percent of U.S. production in 1979, s.s shown in the
following_ tabulation:
Agrico Chemical Co----------------------CF Industries, Inc----------------------Center Plains Industries----------------Felmont Oil Corp----~-------------------First Mississippi Corp-------------------W. R. Grace Co-------~-------------------International Minerals & Chemical Corp--Mississippi Chemical Corp----------------Olin Corp--------------------------------Terra Chemicals International Inc-------' . Union Oil Co. of Calif--~---~---~--------Vistron Corp-------...:-...:-------------------Wycon Chemical Co---------------------...:--
To ta 1------------------------~-------
Percent
*** *** 1/
*** *** *** *** *** *** *** *** *** *** 48.0
1/ Center Plains Industries distributes ammonia in the United States; it do'es not produce ammonia.
The Domestic Industry and the U.S. Market
In 1979, the U.S. domestic alIDllonia industry comprised 51 companies,
oper~ting ammonia plants at 79 locations, with a total operating design
capacity of 20.4 million short tons per year. !/ The domestic producers range
from small chemical or fertilizer companies to large integrated multinational
oil and chemical corporations, with some of the largest aunnonia producers
being farmers' cooperatives.
1/ A complete list of U.S. producers, production sites, and the annual production capacities of their plants is presented in app. F.
A-13
Most domestic ammonia plants are located in those States which have large
supplies of <natural gas. In 1979, 31 percent of the ammonia productive
capacity was located in Louisiana, 10 percent, in Texas, and 11 percent, in
Oklahoma.
More than 50 percent of the ammonia produced in the United States is used
by the ammonia producers for further processing into more advanced products,
primarily fertilizers. According to a 1977 report prepared by the U.S.
Department of Agriculture, 61 percent of the U.S. ammonia producers,
accounting for 79 percent of U.S. production capacity, owned 88 percent of the
U.S. capacity for processing ammonia into more advanced products in 1977, as
shown in table 2.
Table 2.--Vertical integration of U.S. anhydrous ammonia firms, 1975-77
(In percent)
Item
Anunonia-producing firms owning 1 or more plants for processing ammonia into more advanced products 1/-----------------------:
U.S. ammoni·a-produci;g capacity owned by those firms producing more advanced products 2/--------------------------------:
U.S. capacity for processing ammonia into more advanced products owned by ammonia producing firms--------------------------~:
1975 1976
76
91
92
1/ Including ammonium nitrate, ammonium phosphates, and urea. ~/ In terms of 100 percent nitrogen equivalents.
71
81
89
Source: Compiled from official statistics of the U.S. Department of Agriculture.
1977
61
79
88
Industrial consumers of ammonia purchase large quantities of ammonia.on a
continuous long-term basis, while the fertilizer market for direct-application
ammonia is seasonal in nature. Industrial consumers include fertilizer
A-14
producers that ·use ammonia in the production of urea, ammonium nitrate,
ammonium phosphates, ammonium sulfate, and other chemical fertilizers. Other
industrial consumers include chemical plants that purchase ammonia to produce
chemicals other than fertilizers.
The efficiency requirement that most ammonia plants operate continuously
at near cap.ac1ity must be· balanced against the seasonal nature of the
fertilizer market, Which- is· the principal end-u·se market for ammonia. The
situation is further complicated 'by the physical-chemical prope'rties of
ammo~ia that. require it to be stored and transported as a refrigerated liquid
at -280 F, or as a pressurized liquid in a vessel designed for a working
pressure of at least 250 psi (pounds per square inch), or about 17 times
atmospheric pressure. Storage facilities for ammonia are expensive to
construct and maintain and are, therefore, limited to a maximum of a few
months production.
Virtually all forms of transportation, except air, are used to move
ammonia to markets. For example, a pipeline system 1,700-miles-long carries
liquid anhydrous ammonia from Louisiana to Iowa, Nebraska, Illinois, Indiana,
Missouri, and-other Midwestern consuming areas. Another long-distance ammonia
pipe line stretches over 700 miles, from Borger, Tex. , to dis trib.ution points
in Kapsas, Nebraska, and Iowa (fig. 2). Refrigerated storage tanks are built
at strategic points along these lines.
In addition to pipelines, anhydrous ammonia is transported by barges,
railroad tank cars, transport trucks, and tank trailers. Large tonnages of
ammonia ·move by barges up the·Mississippi river and along the other inland
waterways.' Barge transportation is a relatively low-cost means of
transportation for the areas that have access to the waterways. One type of
barge is designed for high-pressure use and is capable of transporting liquid
A-15
Figure 2 .--Anhydrous ammonia: U.S. water transportation routes and pipeline systems.
Source: The Tennessee Valley Authority.
·-. - pipelines water routes
A-16
anhydrous ammonia at ambient temperatures at which ammonia can have high vapor
pressures, while another type of barge is designed for low-pressure usage.
Low-pressure barges have insulated storage tanks and mechanical refrigeration
units which keep the vapor pressure of ammonia below the maximum allowable
design pressure of the cargo containers.
A standard railroad tank car with a capacity of· 11,000 gallons transports
25 to 26 tons of liquid ammonia. Such a car has an inner high-pressure tank
covered by a layer of· insulating material with an outer shell of light steel·
construction. Jumbo tank cars .with a~capacity of 30,000 gallons (70 tons) now
move m~st of th~ rail-shipp,ed,'. ammonia. The jumbo tank cars have noninsulated
tanks designed for high pressures. . .~
Highway tr.ansport 'trucks, usually tractor trailer rigs with high-pres.stire
tanks varying in size from 6,000 to--9,000 gallons, haul from 12 to 19 toris of
ammonia per trip. Some·transport trucks are equipped with vapor compressors
or liquid pumps for unloading~ Other trucks have no pumping equipment and
must be unloaded by pumps or compressors located at the delivery storage tank.
For d:Lrect farm applications, ammonia is moved from the retail dealer's
storage tank to the farmer's fields in high-pressure tanks with capacities of
500 or 1,000 gallons. The tanks are usually mounted on heavy duty two- or
four-wheel wagons. At the 85-percent-full level, a 1,000-gallon tank contains
about 2.2 tons of ammonia.
Farm equipment for the direct application of ammonia has improved
considerably in the past several years so that ammonia can, in some cases, be
applied at a rate of 40 acres per hour, or more. Large horsepower tractors
pull plows at 5 miles per hour, with swath widths of up to 65 feet. Ammonia
nurse tanks are mounted on or pulled behind these special plows. Ammonia
flows from the nurse tank to a pressure manifold which distributes the ammonia
A-17
through numerous hoses and tubes so that ammonia is injected behind each plow
tine several inches below the soil surface. The vaporizing ammonia reacts
immediately with moisture in the soil and, in addition, is adsorbed on
particles of soil so that little or none escapes from the soil when proper
application procedures are followed.
U.S. Tariff Treatment
Virtually all ammonia imported into the United States, including the
imports of ammonia from the U.S.S.R., enters under item 480.65 of the TSUS.
Anhydrous ammonia of a grade used chiefly for fertilizer or chiefly as an
ingredient in the manufacture of fertilizer is entered duty free under this
item. According to a customs classification ruling in 1970, ammonia with a
minimum purity of 99.S percent by weight is chiefly used as a fertilizer or
chiefly used as an ingredient in the manufacture of fertilizer. Since modern
ammonia plants produce only one grade of ammonia, which is at least 99.S
percent pure, according to this ruling, all ammonia should enter under the
duty-free TSUS item.
Small quantities of ammonia, however, enter under TSUS item 417.22, under
which ammonia for other end uses was originally classified. In view of the
customs ruling mentioned above, these imports appear to be misclassified. The
most-favored-nation (MFN) rate of duty applicable to this item is 6.4 percent
ad valorem, the concession rate for least developed developing countries
(LDDC's) is 2.8 percent ad valorem, and the column 2 rate of duty is 28
percent ad valorem. Imports under this item from designated beneficiary
developing countries are eligible for duty-free treatment under the
Generalized System of Preferences (GSP). 1/ When the final stage of
-~/ Imports under item 417.22 from Mexico are not eligible for duty-free treatment under the GSP.
A-18
concessions on this item granted in the Tokyo round of trade negotiations
becomes effective in 1987, the applicable MFN rate will be 2.8 percent ad
valorem.
The Ammonia Industry of the U.S.S.R.
In its Ninth Five-Year Plan (1971-75), the U.S.S.R. committed itself to
the rapid improvement of its faltering agricultural sector. Central to this
plan is a program to construct approximately 40 large ammonia plants by 1982.
These new plants will have an estimated total yearly capacity of approximately
22 million short '.tons.
According to· a CIA report, Soviet Chemical Equipment Purchases from the
West: Impact on Production and Foreign Trade, published in October 1978, the
U.S.S.R. has·contracted to buy at least 31 of these plants from Western
firms. Many of the new ammonia plants are financed through countertrade
arrangements in which Western exports of technology, know-how, machinery, and
equipment needed for the production of ammonia are compensated in part by
exports of ammonia from the U.S.S.R. Thus, in addition to export commitments
to its usual trading partners in Eastern Europe and Cuba, the U.S.S.R. also
has contracts to export ammonia to the United States, Denmark, Finland,
France, Italy, and Japan. According to CIA estimates, the U.S.S.R. contracted
to export approximately 2 million short tons of ammonia to Western nations in
1979 and approximately 3 m:llion short tons per year to those nations in 1980
and 1981. Nearly 50 percent of its 1980 export commitment to Western Nations
is earmarked ·for the U.S. market.
Industry sources, however, doubt that the U.S.S.R. met its 1979
production targets or that it filled all of its export obligations. According
to both industry sources and the CIA, the assimilation of Western ammonia
A-19
production technology by the U.S.S.R. is behind schedule. The 1978 CIA report
stated:
••• one of the smaller Western-based units, located at Cherkassy, was at least two years late in coming on stream. A few large units that will at least partially depend on Western technology but incorporate a substantial amount of Soviet or Czechoslovak equipment apparently have had construction delays of one year or longer. Large Western-supplied ammonia installations at Nevinnomyssk in the Caucasus and Severodonetsk in the Ukraine experienced frequent breakdowns during at least part of their first year of operation. Distribution problems affecting natural gas, the major Soviet feedstock for ammonia, have caused at least temporary under-utilization of· some imported installations. Such problems are not uncommon in the West. Moreover, the Soviet delays in commissioning ammonia plants apparently are less serious than in the past. The construction period required per thousand tons of new ammonia capacity reportedly has been reduced to 45 percent of its former level.
According to a more recent unpublished CIA report, U.S.S.R.: Ammonia Exports
to the United States, completed in July 1979, the U.S.S.R. ammonia plant
construction program is still experiencing delays. The report states:
The U.S.S.R. experienced severe problems in the first four or five months of 1979 that resulted from a combination of f actors--lags in construction of new ammonia capacity in 1978, operating difficulties, transportation and other problems that reflected the unusually severe winter weather and the cutoff of the gas pipeline from Iran till late March 1979.
Natural gas imported from Iran is not used for producing ammonia in the
U.S.S.R. However, because the winter of 1978/79, according to testimony
presented at the hearing held in connection with investigation No. TA-406-5,
was the coldest in 100 years, domestic natural gas supplies that would
normally have been used in ammonia production were diverted to home heating
because supplies of Iranian gas were curtailed. !/ Nonetheless, the CIA
1/ See transcript of the hearing, p. 464.
A-20
concludes that "even with a shortfall in implementation of the plans, the
increase in capacity will be substantial, and will enable the u.s.s.R. to
expand exports considerably."
In addition, the CIA predicts that exports of ammonia from the u.s.S.R.
"will be an important destabilizing factor in world ammonia markets in the
1980's." As a consequence, the CIA continues, "producers in the developed
Western countries almost certainly will be affected, and with depressed prices
and profits in store, the closing of at least older ammonia plants in those
COUntrieS is likely o II
Production of ammonia 1n the u.s.s.R., according to the CIA data,
increased from 12 million short tons in 1974 to more than 15 million short
tons in 1978, representing an increase of 25 percent, as shown in the
lTiridicates capacities of plants not included in the yearly data for which there is insufficientl.nformafion concerning actual· construction plans. 2/ The Central Intelligence Agency, using a different method to estimate capacity, estimates.1978 u.s.s.R. capacity to be 19 million short tons,
1979 capacity to be between 24 million and 26 million short tons, and 1980 capacity to be 28 million short tons. 3/ Other than Communist Asia •
. ""§:./ Communist.
Source: The Tennessee Valley Authority.
Note.--Because of rounding, figures may not add to the totals shown.
t N ID
A-30
Figure 4.--World nitrogen fertilizer production and consumption •
1/ Includes 10,000 short tons of ammonia imported from the U.S.S.R. through Finland. ~/According to testimony presented at the hearing, Occidental's records
show it imported 832,000 short tons of ammonia in 1979.
Source: Compiled from official statistics of the U.S. Department of Commerce.
Note.--Because of rounding, figures may not add to the totals shown.
!f Includes swaps made for materials other than anhydrous ammonia.
2.6 3.1 3.1 3.7 4.1
2.2 2.6
Source: Compiled from data submitted in response to questionnaires of the U.S. International Trade Commission. 49 firms reported, which accounted for 95 percent of U.S. production in 1978.
U.S. plant expansions and closings
Since 1974, a total of 34 U.S. plants began operating and 13 expanded
production capabilities, adding 8.0 million short tons to U.S. ammonia
production capacity. The greatest expansion occurred in 1977' when over 3
million short tons of capacity were added. Most of the new plants which began
operating in 1977 were planned during the fertilizer year 1974/75 when ammonia
prices were high and shortages were predicted until the end of the century.
Of the new plants which have begun operating since 1976, 12 are large
plants with annual capacities of 340,000 short tons or more. Large plants
(more than 340,000 tons yearly capacity) accounted for 34 percent of capacity
1n 1976 and 56 percent of capacity in 1980 (table 11).
Since 1976, however, when the predictions of continued ammonia shortages
were not borne out, 3. 7 million short tons of U.S. production capacity have
A-44
been idled or closed (table 12). In 1979 alone, 26 plants with a total of 2.6
million short tons of capacity were idled or closed. Since 1976, the number
of small production facilities with annual capacities of 200,000 short tons or
less declined by 27, from 67 plants to 40 plants.
A-45
Table 11.--Anhydrous ammonia: U.S. production capacity, by plant sizes, 1974-80
Item
Plants with less than 200;000 tons yearly capacity: ·
Number------------------------------------: Total yearly capacity
million short tons--: Share of total U.S. capacity-----percent--:
Plants with 200,000-340,000 tons yearly capacity:
Number------------------------------------: Total yearly capacity
million short tons--: Share of total U.S. capacity-----percent--:
Plants with more than 340,000 tons yearly capacity:
Number·------------------------------------: Total yearly capacity
million short tons--: Share of total U.S. capacity-----percent--:
All U.S. plants: Number----------------~-------------------:
Total yearly capacity
1974
55
5.0 29
26
7.3 42
11
4.9 28
92
million short tons--: 17.2 Share of total U.S. capacity-----percent--: 100
. . 1975
60
5.3 29
25
7.0 38
14
6.1 33
99
18.4 100
1976
67
5.6 29
25
6.9 36
15
6.5 34
107
19.0 100
Source: Compiled.from statistics of the Tennessee Valley Authority.
Note.--Because of rounding, figures may not add to the totals shown.
1977
67
5 .4 25
24
6.6 31
21
9.5 44
112
21.5 100
. •·
1978
62
5.2 24
23
6.4 29
24
10.4 47
109
22.0 .100
. .
1979
41
4.0 20
21
5.5 27
25
10.9 53
87
20.4 100
1980
40
4.0 19
20
5.2 25
27
11. 7 56
87
20.8 100
A-46
Table 12.--Anhydrous ammonia: Changes in U.S. production capacity, 1974-80
In its ·questionnaire sent to all u·.s. ammonia producers, the Commission
requested information on plant closings since 1974. Seventeen firms responded
to this section of the questionnaire. On the basis of information reported in ~
annual reoorts, 10-K forms, and responses to the Commission's questionnaires,
the most frequently cited reasons for closing ammonia plants since 1974 were
the high cost of production, including the cost of natural gas (11 firms), the
low price of ammonia (7 firms), and outmoded .plant (4 firms), as shown in the
following tabulation:
Reason for closing plant Number of firms
High cost of production, including cost .of natural gas-------------------------------- 11
Low ammonia price------------------------------- 7 Outmoded plant---------------------------------- 4 Weak ammonia market---------~------------------- 3 Oversupply---------~--------------------------~- 2 Low-priced imports------~----------------------- 1 U.S. competition-------------------------------- 1 Operating at a loss since 1976------------------ 1 Loss of natural gas supply---------------------- 1
Note.--Firms frequently cited more than 1 reason for closing their plants.
Seventeen firms reported temporary shutdowns because of natural gas
curtailments, equipment failures, and strikes. According to data compiled by
The Fertilizer Institute, approximately 1 to 3 percent of U.S. productive
capacity was idled each fertilizer year during 1974-79 because of curtailments
A-49
of natural gas supplies. The largest loss occurred in the winter of 1976/77,
when 730,000 short tons of ammonia production were lost, as shown in table 14.
Table 14.--Anhydrous ammonia: U.S. production lost to natural gas · curtailments, fertilizer years 1974-79
Date
Year ending June 30.of--1974--------------------------: 1975--------------------------: 1976--------------------------: 1977---~----------------------: 1978--------------------------: 1979--------------------------:
Source: The Fertilizer Institute.
Inventories
Quantity
1,000 short tons
230 356 251 730 428 245
Percent of capacity
Inventories of nitrogenous fertilizers held by U.S. producers, as shown
in figure 6, fluctuate seasonally. Inventories, built up for the spring
planting, are highest in February and reach their lowest levels in May and
1.3 1.9 1.3 3.4 1.9 1.2
June, after the-planting season has ended. Weather plays an important role in
determining the quantity of fertilizer applied each season. Farmers may be
prevented from applying the optimum amount of ammonia to their fields if the
winter is harsh, and the spring is cold. In addition, since anhydrous ammonia
cannot be applied in fields that are too wet to plow, during a wet spring,
farmers .may choose to use urea or another source of nitrogen which can be
applied to wet fields.
Yearend inventories of ammonia held by U.S. producers, as shown in table
15, increased from 2.1 million short tons in 1975 to 2.8 million short tons in
1977. Yearend inventories subsequently decreased to 2.5 million short tons in
1978, and 2.2 million short tons in 1979.
A-50
Figure 6.--U.S. fertilizer manufacturers' inventories of nitrogenous fertilizers, l/ 1974-79,
Mil. tons
3
2
1
0 1974 1975 1976 1977 1978
ll Does not include area.
Source: U.S. Department of Agriculture.
1979
A-51
Table 15.--Anhydrous ammonia: U.S. producers' inventories, as of Feb. 28, June 30, and Dec. 31 of 1975-79
The number of production and related workers engaged in the production of
atmnonia in the United States, as reported by 47 firms, increased steadily from
3,828 in 1974 to 4,744 in 1977, and subsequently decreased by 3 percent to
4,610 in 1978. The number of such workers further decreased to 4,137 in 1979,
representing a decrease of 10 percent. The number of hours worked by such
workers followed a similar trend, increasing from 8.4 million hours in 1974 to
10.3 million hours in 1977, and subsequently decreasing to 9.9 million hours
A-52
in 1978 and 8.4 million in 1979 (table 16). The decline in employment can in
part be attributed to the closing of the older reciprocating plants which are
more labor intensive than the newer plants.
Table 16.--Average number of U.S. production and related workers engaged in the production of anhydrous armnonia and the hours such workers were employed, 1974-79
Year Production and related workers Hours employed
1/ Includes cost of materials, engineering, management of construction, and labor for a turnkey plant with an annual capacity of 400 thousand short tons. Does not include costs associated with storage and shipping terminals, site acquisition, or buildings other than control buildings.
Source: Pullman Kellogg.
A-57
Figure 7.--Anhydrous ammonia: U.S. producers' average unit value of their shipments, average cost of production, and average pri~e needed for a 20-percent return on investment (R.O.I.), 1973-78.
Source: The Fertilizer Institute's study, Ammonia Cost of ~-~-<?_ciuc_t_i<?!l• conducted by Ernst and Ernst, April 1979, and official statistics of the U.S. Department of Commerce.
Note.--Sales and general administrative costs are not included in the average price needed for a 20-percent return of investment.
A-58
The Question of Causality
Counsel for Occidental.contended at the Commission's previous hearing
that if the domestic industry producing ammonia is experiencing material
injury, it is primarily attributable to the overexpansion of U.S. production
capacity and to the rapidly increasing cost of production. This increase in
production cost was reported to be primarily attributable to large increases
in the price of natural gas. The petitioners acknowledged that these factors
contributed to the difficulties they have experienced since 1976, but they
also contended that imports from the U.S.S.R. are a significant cause of
material injury.
Import penetration
Imports of ammonia from the U.s.s.R., as a percent of apparent U.S.
consumption increased from zero percent in 1977 to 4.0 percent in 1979. Based
on an estimated 5 percent annual growth rate in U.S. consumption of ammonia
during the years 1980 and 1981 and based on Occidental's estimates concerning
its imports in each of those years, this ratio will increase to*** percent in
1980, and*** percent in 1981, as shown in the following tabulation:
Ratio of imports from the U.S.S.R. to U.S. consumption
The issue of overexpansion regarding the U.S. industry is discussed in
the sections of this report on U.S. capacity, production, consumption, and
U.S. plant expansions and closings.
Cost of production
In April 1979, the public accounting firm, Ernst and Ernst, completed a
study for The Fertilizer Institute concerning the cost to produce ammonia in
the United States during 1970-78. Thirty-four companies responded to the
survey. Results indicated that the average cost to produce a ton of ammonia
in the United States increased from $30 a short ton in 1973 to $81 a short ton
in 1978. Natural gas, which accounts for about 64 percent of the cost of
production, accounted for most of the increase in cost, rising from an average
of $14 a short ton in 1973 to $50 a short ton in 1978 (fig. 8). In reviewing
figures 8 and 9, it should be noted that the data on cost of production are
based on the weighted average costs of 34 firms that responded to the survey
conducted by Ernst and Ernst on ammonia production costs. Thus, the costs
presented are strongly influenced by the _9utput of the large-capacity plants,
which are more efficient than the small- and medium-sized plants. It should
also be noted that production costs do not include sales and general
administrative costs.
According to data collected by the Commission, the average cost of
natural gas to U.S. ammonia producers more than tripled from $0.48 in 1974 to
$1. 55 in 1979, as shown in the fol lowing tabulation:
A-60
Figure 8 .--Anhydrous anunonia: U.S. producers' average unit value ·of thefr · shipments, average cost of production,. and averag!·. ~-~-Sb· of natur~l gas, 1973-78.
Dollars a short ton
150 140 130 120 110 100
90
80 70 60
50 40
30 20 10 0 ]
1973
Average cost of production of ammonia
1
1974 1975
Average unit value of· U.S.-prpduced ammonia
1976
1·
•
cost of gas
t • 1978
Source: The Fertilizer Institute's study, Ammonia Cost of Production, conducted by Ernst and Ernst,April 1979, and official statistics of the U.S. Department of Commerce.
Source: Compiled from data submitted in response to questionnaires of the U.S. International Trade Commission.
Note.--Because of rounding, figures may not add to 100 percent.
This wide range of prices paid for natural gas by U.S. producers in 1979
6 38 32
has led to a wide disparity in the cost of producing ammonia. For example, as
shown in figure 9, in 1978 those producers using natural gas priced under
$0.50 for 1,000 cubic feet had an average cost of production of $33 a short
ton, while those using natural gas priced over $2.00 for 1,000 cubic feet
faced average costs of $116 to produce a short ton of ammonia.
While the amount of natural gas used to produce a ton of ammonia is
approximately the same for all sizes of U.S. production facilities, most of
the small plants use more expensive natural gas than the large plants (figure
10). In addition, the other costs of production, e.g., electricity, overhead,
and labor, are about twice as high per ton of production for the older and
smaller plant than for a large new plant (fig. 11).
A-63
Figure 9.-~Anhydrous ammonia: U.S. producers'.average unit value of their · shipments and average cost of.production, 1973-78.
Dollars per short ton
150 140 130 120 110 100
90
80 70
60
50 40 30
20 10 0
1973
Average unit value of U.S.- produced ammonia .............. __.
1974 1975
Average cost of production for U.S. producers using natural gas priced more than $2.00 a 1,000 cubic feet
Average cost -of production of ammonia
i Average cost of production for U.S. producers using natural gas priced less than $0.50 for 1,000 cubic feet
1976 1977 1978
Source: The Fertilizer· Institute's study, Ammonia Cost of Production, conducted by Ernst and Ernst, April 1979 and official statistics of the U.S. Department of Commerce. · ·
A-64
Figure 10.--Average cost of natural gas, by sizes of U.S. annnonia production facilities, 1973-7a
Dollars per 1,000 cubic feet
1. 60
1.40
1.20
1.00
.80
.60
.40
"" .LU
I 0 1973 1974
Small plants
I I
1975
f I
I / Medium plants
/ _.---·-·--. .-------Large plants
1976 1977 1978
Source: The Fertilizer Institute's study, Ammonia Cost of Production, conducted by Ernst and Ernst, April 1979.
Note.--Large plant, capacity of more. than 340,000 short tons a year; medium-size plant, capac.ity between 200. 000 and 340. 000 short tons a year; small-size plant, capacity less than 200,000 ~hort tons a year.
A-65
Figure 11.--Anhydrous armnonia: U.S. producers' average unit value of their shipments and average cost of production, by plant sizes, 1973-78•
Source: The Fertilizer Institute's study, Ammonia Cost of Production, conducted by Ernst and Ernst, April 1979, and official statistics of the U.S. Department of Commerce .
. Note.-~Large plant, capacity of more than 340,000 short ton a year; medium plant, capacity between 200,000 and 340,000 short tons a year; small plant, capacity less than 200,000 short tons a year.
A-66
In 1978, SRI International published a study, Ammonia Production Cost
Trends, which forecasts U.S. and Canadian ammonia production costs through
1984. The SRI forecasts were made on the assumption that all plants operating
in 1977 and those that began operating after 1977 would be operating in 1984.
Thus, the average production costs predicted by SRI includes those high-cost
plants which have already shut down in 1978 and 1979. According to SRI
projections, the average cost of production will increase from $77 a short ton
in 1977 to $119 a short ton in 1981 assuming that all plants are operating at
100-percent capacity. The average cost of production.in 1981, as shown in
table 22, would be $124 and $130 a short ton if the plants are operated at 85
percent and 70 percent of capacity, respectively.
At the public hearing in investigation No. TA 406-5, testimony was
presented indicating that SRI's cost projections, which were completed in the
fall of 1978, did not take into account the Government's policy to decontrol
U.S. crude oil and the recent crude oil price increases announced by OPEC.
Thus, it is likely that natural gas prices and the average cost of ammonia
production will be higher than SRI's projections.
Table 22.--Anhydrous ammonia: U.S. and Canadian weighted average total production costs, 1/ by varying rates of capacity utilization, 1977, 1978, and 1981 -
OFFICE OF THE SECRETARY U.S. INTL. TRADE COMMISSION.
Dear Madam Chairman:
Pursuant to section 406(c) of the Trade Act of 1974, I have today found that there are reasonable grounds to believe that market disruption exists with respect to imports of anhydrous ammonia, provided for in items 417.22 and 480.65 of the Tariff Schedules of the United States, from the Union of Soviet Socialist Republics. I therefore request that you initiate an investigation on such articles under section 406(a) of the Trade Act of :1974.
Sincerely,
The Honorable Catherine M. Bedell Chairman International Trade Commission Washington, D.C. 20436
I
a'
vvL
DOCKET NUfABER
1
~tJ-s -~----------Oii:ce of tne
Secretary lnt'I Tra:re Commission
A-79
APPENDIX B
THE COMMISSION'S NOTICE OF INVESTIGATION AND HEARING
Anhydrous Arr.:nonia From tha U.S.S.R.; Investigation and Hearing
Jm·esligativn fo~!ituted. Following receipt on January 18, rn;_:a. of a request. from the President (rep;oduced Lelo·w), the U.S. Intern:itil111al Trade Com:nir.sion on Janu<1ry 28. 1980, instiit1kd a;i invest'.;::~!:1)11 under se.-;!ion 40i3(a} of the Trade Act of 19/-1 (D U.S.C. 2·136(a)) to determine, with respect to imports of anhydrous ammonia, provided for in iten:s .f·i7.22 and 48ll.G5 of the Tariff Schedules of the United States, which is the product of !he Union of Soviet Socialist Republics (U.S.S.R.), whether market disruption exists with respect to an article produced by a domestic industry. Sr?clion 4()13( e )(2) of the Trade Act defines market disrupticn to exist within a dornestidndustry whenever "imports of an article. like or directly competitive with an article produced by such dvmestic industry, are increasing rapidly, .~ither absolu~dy or rc!aiively, so as to be a significant cause of material injury, or threat ttercof, to such domestic industry."
The Pre;;ident 111ade the request pursuant to section 4G5(c) of the Tra..!e Act, having found under that section that th~re are reasonable r;rounds to believe that market disrupt:cn exists with respect lo such anhydrous ammonia the product cf the U.S.S.R. The P;-csid,.:nt also found, pursuant to section 40G(c), tl:at emergency aciion was neces3a1-v and took action. under sections 202 and 203 of th~ Trade Act, limiting the quantity of scch anh\·drous ammonia the prod11ct of the U.S.S.R. which may cr;tcr the United St~!es during the per:od January 2-1. 1930, to January 24, 1981, to 1,000,000 short tons (Proclamation 4714 of January 10, 1\l(:;l),
publishcrl in the Fedctal Rc;:istcr of January 21, 1980 {4i> FR 3S7S)).
The text of the President's letter to the Commission is as follows-
January lll, 1900 The Honorable Cutherine M:Bedell,
Dear ~!adam Chairman: Pursuant to section 406(c) of the Trade Act of 1974, I have today found that there 11rc reasonable grounds to believe that marl..e! disruption exists with rc.,pect to im;iorts to anhydrous ammonia, provided for in i1t·n1s 417.22 and 400.65 of the Tariff Schedules of the United
: Statea, from the Union of Soviet Socialist ·Repuhlii:s. I t!1crefore rcqi.1e,T'W.if )lou initiate un in\·csti:'.:ition on st1r.h arlidr.s under section ,l~Jii[a) of lhe Trarl" ;\cl of Hl74.
Sincerely, . Jimrily Carter.
Public hearing. A p11blic hearing in cor;nection with Ibis invi,~•ligatim1 will be held in Washington, D.C .. at 10:00 a.m., c.s.t., on Mondnv .. ~farch :J, 1!Jili1. The hearing will be h~ld i11 lhr. Hearing Roem. Unitul Slates lntr.n;a:ic'!l.i! Trude Commission Iluilding. 701 E Street, NW .. Wasl1in;;ton. IJ.C. ,\ii· pa:·ii1~s wi!l be given on opportunity to he prcsrnl. to produce evidence, and to be h::<ird at the Hearin:~. lfoqucsls to uppear at the hcari'1g should be received in writing in the Office of the Secretary lo the Commission not later than 5:00 p.m .. Tuesday, February 19, rnao.
A prehcaring conference in connection with this investigation will be held in \·Vashington, D.C .. at 9:30 a.m .. e.s.t .. on Thursday, February 21, 1980. in Room 117, U.S. lnlerr.utional Trade Commission Building, 701 E Street, NW.
Writtl]n statements. rnlereste<l parties may submit statements b v•riting in li>~u of, nnd in addition to, app2aring ai the public hearing. A sig;-:.ed original and nineteen true copies of such statements should be submitted. To b<~ assured of their being givt!n due considen;tion by the Commission, such stalenw.uls shoulU be received not later than Monday, March 10, 19GQ.
Issued: January 30, 1980. By order of the Commisi;ion.
Federal R1?gistcr / Vol. 44, No. W7 ·1 \'' I .1 > 1 ~1 ncsuay. October ~4. 19/!'l / Notices
[TA-406-5)
Anhydrous Ammonia From the U.S.S.R.; Report to the President
October 11, 1979. To the President:
In accordance \vith section 406(a)(3) of the Trade Act oi 1974, the United States International Trade Commission herein reports the results of an investigation relating to anhydro1Js ammonia (ammonia) from the U.S.S.R. The investigation (No. TA--406-5) was undertaken to deteimine with resoect to imports of ammonia provided for
0
in items 417.22 and 480.65 of the Tariff Schedules of the United Stales (TSUS), which arc the product of the U.S.S.R. whether mr.rket disruption exists with respect to an article produced by a domestic industry.
The Commission instituted the investigation. under the authority of section 40G(a) of the Trade Act. on )Lily 18, 1979, following the receipt of a petition under section 406 of the Trade Act for relief from ammonia imported from the U.S.S.R. filed on behalf of 12 U.S. producers and 1 U.S. distributor of ammonia. The Commission held a public hearing on this matter in Washington, D.C. on A1Jgust 29-31. 1979. Notice of the institution of the investigation and of the public hearing was published !n the Federal Re~istcr of July 25. 1879 l4·1 FR 43330).
The information in this rerort was obtained from fieldwork and intcr\'iews by members of the Commission's staff, fro:n other Ft:dcrnl a<:?encics, from respons~s to the Cor~mission's ques:ionnaires, from information vrescntcd at the public hearing. from
briefs s11J1mittc~d by interested parties, and from the Commission's files.
A transcript of the hearing und copies of the briefs submitted !lV interested parties in connection wiih this investi~ation arc attached. 1
Determination. Findin:~s and Recommendations of the Commission
Determination On the basis of the "investigation, the
Commission (Vice Chairman Alberger and Commissioner Stern dissenting) determines. with respect to imports of anhyclrous ammonia the product of the U.S.S.R .. pro\'idecl for in items 417.22 and 480.65 of the TSUS. that market disruption exists with respect to un article produced by a domestic industry.
Findings and Recommendations Chairman Parker and Commissioners
Bedell and A!oore find and recommend that. in order lo remedv such market disruption, it is necess~ry to impose a quota of 3 year·s duration on U.S. imports of anhydrous ammonia the product of the U.S.S.R .. pro\'ided for in items 417.22 and 480.f.5 of the TSUS. as specified below.
The quotas for the 3-year period beginning with calendar year 1980 would be as follows-
Year
Ouantrty ot '"'?O<l&
to be Bf lowed
t>nfry Cohort tons)
1st yeat (1980) ................... -·-··---·--·-- 1.000.000 2nO year (1981) .......................................... ___ 1,100.0'JO 3rd year (1982) .................................................... __ 1.300.000
Vice Chairman A/berger and Commissioner Stern recommend that there be no remedy in this investigation.
Dy order or the Commission. Issued: October 11, 1979.
Kenneth R. Mason, • Secretary. fFR Due. 111-3UIZ8 Filed 10-23--79: 11:45 aml BILLING COOE 7021H12-lol
-
A-83
APPENDIX D
THE PRESIDENT'S DECEMBER 11, 1979, AND JANUARY 18, 1980, AMMONIA DETERMINATIONS
A-84
Fedr.ral Rr.~isll~r I Vol. 44. No. 240 I Wednesday. December 12. 1979 I Presidcntinl Documents 71009
[FR Doc. 79-38295
Filed \2-11-79: 1Z:10 pmj
Btlll11t1 code 3195--01-M
Presidential Documents
Determination Under Section 406 and 202 of the Trade Act of 1974; Anhydrous Ammonia From the Union of Soviet Socialist Republics
Memorandum for the Special Representative for Trade Negotiations
Pursuant to section 406(b) and 202 of the Trade Act of 1974 (P.L. 93-618. 88 Stat. 1978), I have determined the action I will take with respect to the report of the United States International Trade Commission (USITC]. transmitted to me on October 12, 1979, concerning the results of its investigation of a petition for import injury filed on behalf of 12 U.S. producers and one U.S. distributor of anhydrous ammonia provided for under items 417.22 and 480.65 of the Tariff Schedules of the United States (TSUS).
After considering all relevant aspects of the case, including those considerations set forth in section 202(c) of the Trade Act of 1974, I have determined that provision of import relief is not in the national .economic interest for the following reasons:
t. Anticipated conditions in the U.S. and overseas markets for anhydrous ammonia do not warrant import relief at this time. The industry is currently operating at 86 percent of capacity and should continue to operate at comparable levels, prices are sharply higher and expected to continue rising, and strong m~rket conditions are projected for the current and next marketing years. Given anticipated growth in demand for grains and other crops, it is critical that farmers have access to sufficient fertilizer supplies at reasonable prices.
2. Relief would not limit the growth in U.S. imports of anhydrous ammonia but will merely shift the source of foreign supplies from the Soviets to other low- . cost producers. Thus, the domestic industry would realize little benefit from relief and relief would be unlikely to promote industry adjustment.
You should request the 'u.s. International Trade Commission to issue a factual report on overall market conditions for ammonia as prescribed under section 332 of the Tariff Act of 1930. This report should be prepared on an ar~riual basis, beginning in !'Jcvember 1980. until further notice. I \-vould plan to have these reports discussed with appropriate Soviet officials through existing channels.
This determination is to be published in the Federal Register.
TIIE WHITE HOUSE. Washington, December 11, 1979.
:;;:,,,,7
UL
f..J.,ral Register
\"•I. .is. No. 1-1
Miind~y. January 21, 1980
Title 3-
The President
A-85
3875
Presidential Documents
Proclamation 4714 of January 18, 1980
Temporary Duty lncrcase on the Importation Into the United States of Certain Anhydrous Ammonia From the Union of Soviet Socialist Republics
By the President of the United States of America
A Proclamation
1. Pursuant to sections 400(c), 202, and 203 of the Trade Act of 1974 (the Trade Act) (19 U.S.C. 2436(c), 2252 and 2253), I hereby find that there are reasonable grounds to believe, with respect to imports of anhydrous ammonia from the Union of Soviet Socialist Republics (U.S.S.R.) provided for in items 417.22 and 480.65 of the Tariff Schedules of the United States {TSUS), that market disruption exists with respect to articles produced by a domestic industry and that emergency action is necessary.
2. Recent events have altered the international economic conditions under which I made my determination that it was not in the national interest to impose import relief on anhydrous ammonia frorr. the U.S.S.R. as recommend-
. ed by the United States International Trade Commission (USITC) on October 11, 1979. However, the factual basis upon which USITC made its determination of market disruption still exists.
NOW, THEREFORE, I, JIMMY CARTER. President of the United States of America, acting under the authority vested in me by the Constitution and the statutes of the United States. including sections 604, 406{c), 202 and 203 of the Trade Act (19 U.S.C. 2483, 2436(c), 2252, and 225~). do proclaim that-
(1) Subpart A, part 2 of the Appendix to the TSUS is modified as set forth in the Annex to this proclamation.
(2) This proclamation shall be effective as to articles entered, or withdrawn from warehouse, for consumption on or after the third day following the date of publication of this Proclamation in the Federal Register and shall remain in effect for one year unless the period of its effectiveness is earlier expressly suspended, modified or terminated, but in any event not longer than authorized by section 406{c) of the Trade Act.
(3) The Commissioner of Customs shall take such action as the U.S. Trade Representative shall direct in the implementation and administration of the import relief herein proclaimed.
IN WITNESS WHEREOF,_ I have hereunto set my hand this eighteenth day of January in the year of our Lord nineteen hundred and eighty, and of the Independence of the United States of America the two hundred and fourth.
A-86
3876 Federal Register / Vol. 4!i, No. 14 I MondJ~'· January 21. 19110 / Prcsiclcntinl Documents
(FR Doc. 80-208;
Filed 1-16-80: 2:44 pmJ
Billing code 3195--01-M
A?INEX
Subpart A, part 2 or the Appendix to the TSUS is modiried by inserting the following new provision in nu~cricll sequence:
Item
923.10
Articles
"Whenever the acgregate quantity of anhyd~ou~ a~monia specified below for ite~ 923.10, the product of the Union of Soviet Socialist Republics (U.S.S.R.), has been entered during the period J3nuary2~, 1980 to January24, 1981, no anhydrous anmonia in such ite~, the product of. such country, may be entered durir.~ t~e re~aindcr of such period:
An~ydrous ammonia, provided for
Q'.iota Quantity (in i<hort tons)
in items 417.22 and 430.55 ••..• 1,000,000"
A-87
APPENDIX E
AMMONIA PRODUCTION PROCESS
A-88
A flow diagram of a typical ammonia plant's production process is pre
sented in figure E-1.
In a typical large ammonia plant, natural gas feedstock is compressed, if
necessary, from 300 to 600 psi and desulfurized before it enters the
primary reformer. Water, in the form of high-pressure steam, is added, and
the mixture of steam and natural gas is passed through a series of tubes con
taining a nickel catalyst. In the primary reformer tubes, which are heated
externally to supply energy for the reaction, the hydrocarbons in the natural
gas react to form hydrogen, carbon monoxide, and carbon dioxide. The gas exit
temperature from the primary reformer is about 1,500 degrees F.
Next, the gaseous mixture enters a secondary reformer, which also con
tains a nickel catalyst. Compressed air is injected into the secondary
reformer, and the oxygen in the air is completely consumed in exothermic
reactions with hydrogen, carbon monoxide, and residual methane from the
primary reformer. The gas from the secondary reformer then contains suffi
cient nitrogen (from the injected air) for the ammonia synthesis. Exit gas
temperature from the secondary reformer is almost 2,000 degrees F. The
temperature of the outlet stream from the secondary reformer is reduced in a
tubular waste heat boiler in which high-pressure steam is generated for use in
the plant.
From the secondary reformer, the process gas enters a two-stage shift
converter where the carbon monoxide is converted to carbon dioxide. Steam is
added to a catalyst bed in the shift converter to effect the conversion of
carbon monoxide to carbon dioxide. In the first stage, shift conversion is
carried out over a chromium-promoted iron catalyst at a temperature of about
700 degrees F. Th~ second-stage shift conversion is carried out over a copper
oxide, zinc oxide, aluminum oxide catalyst at a temperature of about 500
degrees F.
A-89
Figure E-1.--Ammonia production process.
NAT. G S
DESULFUR!ZER PRIMARY SECONDARY REFORM EA
METHANATOR
REFORMER
AMMONIA CONVERTER
SYNTHESIS GAS COMP.
Source: Agrico Chemical Co.
C02 ABSORBER
I I 1.~--,
I I I ..----1' l
K.0. I DRU.
SHIFT 'f CONVERTER
MEA STRIPPERS
C02 VENT
TO URE PLAN'
NAT GAS
PURGE GAS
AMMONIA ,RECEIVER
NH3 STORAGE
TANK
~lPPIN.G
A-90
The next step in the ammonia synthesis process is the removal of carbon
dioxide from the gas stream, and a number of methods have been used to do
this. One of the processes uses ethanolamines to scrub the synthesis gas.
Ethanolamines have a high solubility for carbon dioxide, so one process
consists of counter-current extraction in the absorber and subsequent regene
ration of the ethanolamines in a reactivator by steam stripping and heating.
The removed carbon dioxide is generally piped to a urea plant for use in urea
synthesis or is vented to the atmosphere.
Before the synthesis gas is sent to the ammonia converter, the carbon
dioxide and carbon monoxide content must be reduced to very low levels. One
widely used process for doing this is the methanation process, in which carbon
dioxide and carbon monoxide are reacted with hydrogen over a nickel catalyst
to form methane and water. The remaining gas mixture now consists of the
proper ratio of hydrogen and nitrogen and is ready for the ammonia synthesis
reaction. The synthesis gas must be compressed before it enters the con
verter. The newer ammonia plants use centrifugal compressors driven by steam
turbines, while older plants use reciprocating compressors driven by electri
cal motors. Reactor pressures of about 2,000 psi are common in 1,000-ton-per
day plants, while the optimum pressure in a 1,500-ton-per-day plant is about
3,500 psi, although some designers favor higher pressures, to about 4,500
psi. The ammonia synthesis is carried out at a temperature of about 1,000
degrees F over an iron oxide catalyst promoted by aluminum oxide and potassium
oxide, calcium oxide, or magnesium oxide. The reaction of hydrogen and nitro
gen, in the presence of a catalyst, is highly exothermic, and means must be
provided in the converter for dissipating the excess heat generated in the
system. Effluent from the ammonia converter is heat-exchanged against fresh
inlet gas, and a bypass line around this exchanger permits feed gas to
A-91
be introduced into the converter without preheating and provides temperature
·control to the top catalyst bed.
\
Ammonia product is removed from the converter effluent by cooling the gas
to a low enough temperature (-10 degrees to 20 degrees F) so that the ammonia
condenses and is removed as liquid anhydrous ammonia, while the unreacted
synthesi~ gas is recirculated back though the ammonia converter. Product
ammonia is then piped as a liquid into refrigerated storage tanks or piped to
shipping terminals for distribution.
A-93
APPENDIX F
U.S. PRODUCTION FACILITIES
----------··· WQRL.ll._EERTILIZER CAPACITY
----------~·---ECPNONICS AND MARKETING RESEARCH S=E-C~II~O=N~~~~~~~~~~~~~~~~~~~~~~~ TENNESSEE VALLEY AUTHORITY
tiUS_Cf_E__SHOALfu_A.LABAMA_-35660.
-·---- -·---------------------------------------
AMMONIA 01/14/80
CAPACITY DATA HAS BEEN COMPILED FROM PUBLISHED SOURCES, CONTACTS wrTH INDUSTRY, AND OTHER SOURCES. TVA MAKES NO GUARANTEE OF COMPLETENESS OR ACCURACY OF THIS LIST. COMMENTS, CORRECTIONS, OR ADDITIONS WOULD
------------------------------·-----------------------------------------------·---------------------------------------------<THOUSAND SHORT TONS ~ATERIAL>
---- --------
USA I
--
FIRST HISS CORP<AHPRO> DONALDSONVILLEr LA PLN - - - - - ·- - - - 400 400 400 400 400 400 400
Source: Form 10-K of Occidental Petroleum Corp. supplied to the Securities and Exchange Commission for the fiscal year ended Dec. 31, 1978, at p. 28.
1/ All quantities specified in the agreements were in metric tons which are equivalent to 1.1 short tons. All data reported in the report are in terms of short tons.
Occidental has shipped only a minor amount of its U.S.S.R. urea to the United
States and has not yet shipped any potash to the United States. Occidental
has announced that it intends to sell most of the u.s.s.R. urea and potash in
foreign markets.
The fertilizer agreements are constructed with the idea that the value of
the superphosphoric acid sold by Occidental to the U.S.S.R. over the entire
20-year period should not exceed the value of Occidental's purchases of ammo
nia, urea, and potash during the period. The agreements provide that, at the
request of one of the parties, they are to meet from time to time in order to
work out an arrangement for meeting this. objective.
Occidental's purchases of up to 600,000 metric tons of ammonia annually
under the 10-year agreement, i.e., through 1987, are for the purpose of enab
ling the U.S.S.R. to repay, with the sales proceeds, $900 million (including
interest) borrowed by the U.S.S.R. from the Export-Import Bank of the United
States and a group of U.S. and foreign banks to construct the various fertil
izer facilities in the u.s.S.R., including the port storage and pipeline
facilities to which the technical agreements relate. Occidental is permitted
to purchase up to an additional 400,000 metric tons of ammonia annually under
the 10-year agreement in order to satisfy this objective.
James J. Galvin, president of the Agricultural Products Group of Hooker
Chemical Corp·., a subsidiary of Occidental, testified at the Commission's
hearing that Occidental does not have long-term fixed price agreements with
the u.s.s.R. !/ He said that Occidental, prior to negotiating a price with
the Soviets, first negotiates with its customers, obtains letters of intent
from them, and then with such letters of intent negotiates prices and quan-
tities with the Soviets.~/ He said that none of Occidental's customer con-
tracts run for periods longer than the particular contract with the U.S.S.R. 3/
1/ Transcript of the previous hearing, pp. 532-33. 2/ Id., P• 533. lf Id., PP• 533-34.
*
Library Cataloging Data
United States. International Trade Commission.
Anhydrous ·ammonia from the U.S.S.R. report to the President on investigation no. TA-406-6, under section 406 of the Trade act of 1974 I USITC. -- Washington USITC, 1980.
41, A 112 p. : ill. publication 1051)
28 cm. -- (USITC
"Prepared by Abigail Eltzroth."
1. Ammonia. 2. Nitrogen fertilizers. 3. Russia--Commerce--United States. I. Title.
UNITED STATES
INTERNATIONAL TRADE COMMISSION WASHINGTON. D.C. 20436
OFFICIAL BUSINESS
ADDRESS CORRECTION REQUESTED
ADDRESS CHANGE O Remove from. List O Change as Shown
Please detach address label and mail to address shown above.
Postage And Fees Paid U.S. International Trade Commission ~