18
1 Aniceta Šapolienė International Consultant, FAO

1
Aniceta Šapolienė
International Consultant, FAO

2
The purpose is to compile agricultural products supply balance sheets, to produce comprehensive and reliable statistical information on the production and consumption and change in stocks of agricultural products.
2

3
The FBS are compiled for the following agricultural products:
1. All grain, including leguminous, total 2. Grain processing products 3. Potatoes 4. Vegetables of all kinds 5. Market garden crops 6. All kinds of fruits 7. Grape 8. Sunflower 9. Meat in carcass weight, total 10. Milk and dairy products 11. Eggs

4
The FBS are compiled for calendar year for the country total and by categories of the farms: agricultural companies end enterprises and separate for farmers’ farms and households. FBS is compiled using the old methodology (Soviet time),
Market balance and Farm+ market balance (total) according to the EU recommendations are not compiled.

5
Agricultural and environment statistics, NBS;
Industrial statistics, NBS;
Trade statistics, NBS;
Household budget statistics, NBS;

6
Data on production of the agricultural products are provided on the basis of agricultural production statistics surveys results. Data on crop area and yield, number of livestock and animal production products are collected from big companies and enterprises and farmers with land area more then 10 hectare of agricultural land area – totally.
From the farms less than 10 hectare of agricultural land area and households are collected using sample survey. Further the results of the survey are recalculated for the general population of farms and for households.

7
The data on stocks and losses are calculated for the agricultural produces on the basis of the survey of the agricultural companies and enterprises and big farmers’ farm. These farms provide data on balance by agricultural products.
Further the results of the survey are recalculated for the general population of entities and for households.
Retail trade level and household level are not included in the stocks and losses.
8
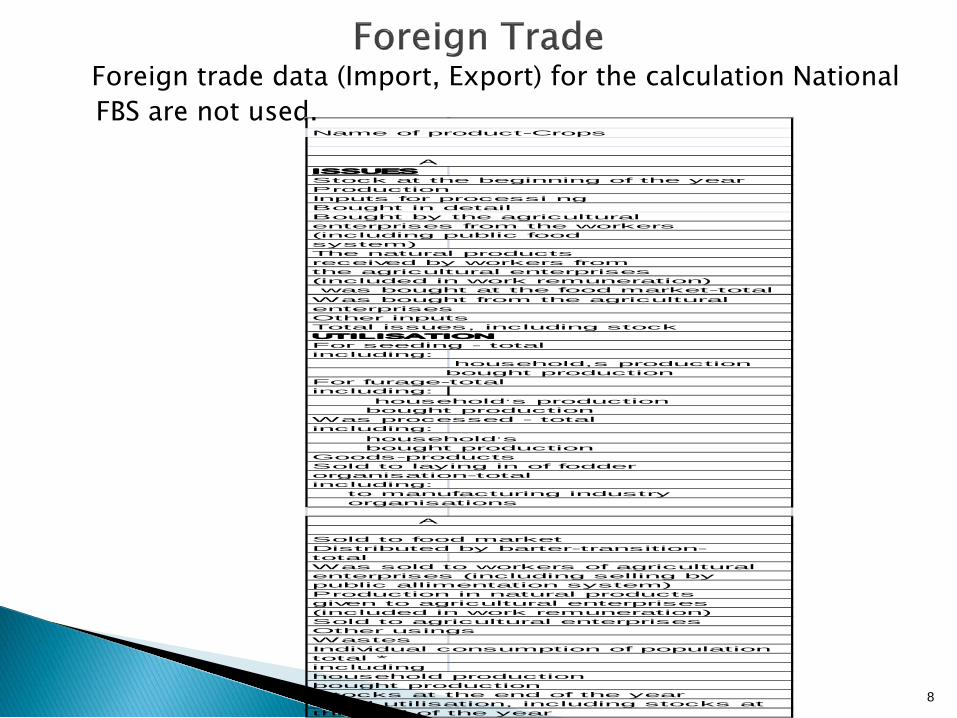
Foreign trade data (Import, Export) for the calculation National FBS are not used.
Name of product-Crops A ISSUESStock at the beginning of the yearProductionInputs for processi ngBought in detailBought by the agriculturalenterprises from the workers(including public foodsystem)The natural products received by workers fromthe agricultural enterprises(included in work remuneration) was bought at the food market-totalWas bought from the agriculturalenterprisesOther inputsTotal issues, including stockUTILISATIONFor seeding - totalincluding: household,s production bought productionFor furage-totalincluding: household,s production bought productionWas processed - totalincluding: household,s bought productionGoods-productsSold to laying in of fodderorganisation-totalincluding: to manufacturing industry organisations
A Sold to food marketDistributed by barter-transition-totalWas sold to workers of agriculturalenterprises (including selling bypublic allimentation system)Production in natural productsgiven to agricultural enterprises(included in work remuneration)Sold to agricultural enterprisesOther usingsWastesIndividual consumption of populationtotal *includinghousehold productionbought productionStocks at the end of the yearTotal utilisation, including stocks atthe end of the year

9
In Moldova: It is calculated subtracting production quantity used for seed, fodder, losses, and changes in stocks from balance income sheets.
EUROSTAT definition for human consumption: It is calculated subtracting production
quantity used for seed, fodder, export, losses, industrial uses and changes in stocks from balance income sheets.

10/14/2011 10
The balance of agricultural products in the householdsfagricultural production per
quantity-thousands tonnesprice- lei bani,value- thousands lei,
Line,s All the Agricul-Name of product-Crops num- cathego- tural ber ries of hou-enterpri- quantity price value seholds ses A B 1 2 3 4 5ISSUESStock at the beginning of the year 1 563.5 196.6 366.9 455 167300Production 2 3180 1964.2 1215.8 448.6 545412.5Inputs for processi ng 3Bought in detail 4 - x - - -Bought by the agriculturalenterprises from the workers(including public foodsystem) 5 471.6 x 471.6 302.43 142625.8The natural products received by workers fromthe agricultural enterprises(included in work remuneration) 6 121.7 x 121.7 250.54 30491 was bought at the food market-total 205.3 x 205.3 480.04 98551.6Was bought from the agriculturalenterprises 8 117 117 - - -Other inputs 9 -Total issues, including stock 10 4659.1 2277.8 2381.3 413.38 984380.9UTILISATIONFor seeding - total 11 140.9 126.2 14.7 405.75 5964.5including: household,s production 12 x x 9.8 433.33 4246.6 bought production 13 x x 4.9 350.59 1717.9For furage-total 14 454.5 91.6 362.9 405.58 147186including: household,s production 15 x x 241.2 433.33 104519.2 bought production 16 x x 121.7 350.59 42666.8Was processed - total 17 1594.2 139.4 1454.8 400 581910including: household,s 18 x x 973.4 424.4 413136 bought production 19 x x 481.4 350.59 168774Goods-products 20 900.1 764.8 135.3 453.92 61414.8Sold to laying in of fodderorganisation-total 21 419.7 379.4 40.3 392.51 15818.2including: to manufacturing industry organisations 22 333.6 293.3 40.3 392.51 15818.2
A B 1 2 3 4 5 Sold to food market 23 205.3 110.3 95 480.07 45606.6Distributed by barter-transition-total 24 275.1 275.1 x x xWas sold to workers of agriculturalenterprises (including selling bypublic allimentation system) 25 471.6 471.6 x x xProduction in natural productsgiven to agricultural enterprises(included in work remuneration) 26 121.7 121.7 x x xSold to agricultural enterprises 27 117 117 - - -Other usings 28 75 75 - - -Wastes 29 35.3 23.1 12.2 433.33 5286.6Individual consumption of populationtotal * 30 xincludinghousehold production 31 xbought production 32 xStocks at the end of the year 33 748.8 347.4 401.4 454.96 182619Total utilisation, including stocks atthe end of the year 34 4659.1 2277.8 2381.3 413.38 984380.9 *Individual consumption ofthe population is
Total - Population

11
Statistical information on Food Consumption per Capita is published in: ◦ “Statistical Yearbook of Moldova” http://www.statistica.md/pageview.php?l=en&idc=263&id=2193
◦ “ Aspects of the Standard of Living of Population in”
http://www.statistica.md/public/files/publicatii_electronice/aspecte_nivelul_trai/Aspecte_privind_nivelul_de_trai_in_2006.pdf
◦ “Moldova in figures” http://www.statistica.md/pageview.php?l=en&idc=263&id=2195

10/14/2011 12
2001 2002 2003 2004 2005 2006 2007 2008 2009Carne şi produse din carne în echivalent carne (fără slănină şi subproduse)
24 27 27 32 40 30
Мясо и мясопродукт ы в пересчет е на мясо (без сала и субпродукт ов)
Lapte şi produse din lapte (înclusiv unt) în echivalent lapte
155 167 164 166 174 169
Молоко и молочные продукт ы (включая масло живот ное) в пересчет е на молоко
Ouă, buc. 139 158 158 162 177 162Яйца,шт
Cartofi 65 68 69 63 75 88 59 58 59Картофель
Legume şi bostănoase 104 99 107 88 101 106Овощи и бахчевые
Fructe, pomuşoare şi struguri (fără prelucrare în vin) 33 38 43 38 37 35Фрукт ы, ягоды и виноград (без переработ ки на вино)
Produse de panif icaţie(pîine şi paste fainoase în echivalent făină,făină,crupe şi leguminoase)Хлебные продукты (хлеб и макаронные изделия в пересчете на муку, мука, крупа, бобовые)
139 141 133 146 142 136 119 123 119
177 175
39 28
168 177
132 76
CONSUMUL PRODUSELOR ALIMENTARE PE LOCUITORПОТРЕБЛЕНИЕ ПРОДУКТОВ ПИТАНИЯ НА ДУШУ НАСЕЛЕНИЯ
41
kilograme / килограммов /
32
155
141
99
38 36

13
Improvements of the methods of the calculation FBS and quality of data calculation in the future according to the existing EU standards and FAO methodology is needed

14
According to the EU recommendations all product balances are subdivided into two sub-balances: Farm balance: includes only trade and uses on theoretical national
farm. Under this “national farm” concept the whole agriculture of a country is regarded as one big farm. This means that flows between farmers are not accounted for in the balance sheets;
Market balance: includes all trade and uses on the market (off the
national farm); Farm and market balance (total balances): obtained by adding
together the farm and market balances;

15
According to the EU recommendations the additional data collection for the compilation of the FBS is needed.
Include in the questionnaires additional indicators for processing enterprises such as: ◦ data on stocks and losses on primary and
processed commodities; ◦ technical coefficient for livestock for evaluation
data such as live weight and carcass weight for meat production ; ◦ industrial uses data (products quantities used to
produce others products such as alcohol, beer and ethanol, etc);
16
For the FBS calculation to use Combined Nomenclature (CN) of products and coefficient for recalculation processing products to raw products weight according to FAO and Eurostat methodology

17
The improvement of the NBS website. The national food balance sheet should be incorporated;
The availability of the national food composition table in the Publications;
The publication should provide an concise definition of the indicators and methods used to produce FBS.
Study tour to other country to study the agricultural statistical system and methods of the calculation FBS would be useful;
17

18
18


